Resilience and Sustainability of Aquifers Under Climatic and Agricultural Pressure

 , , and
Abstract
1. Introduction
2. Study Area
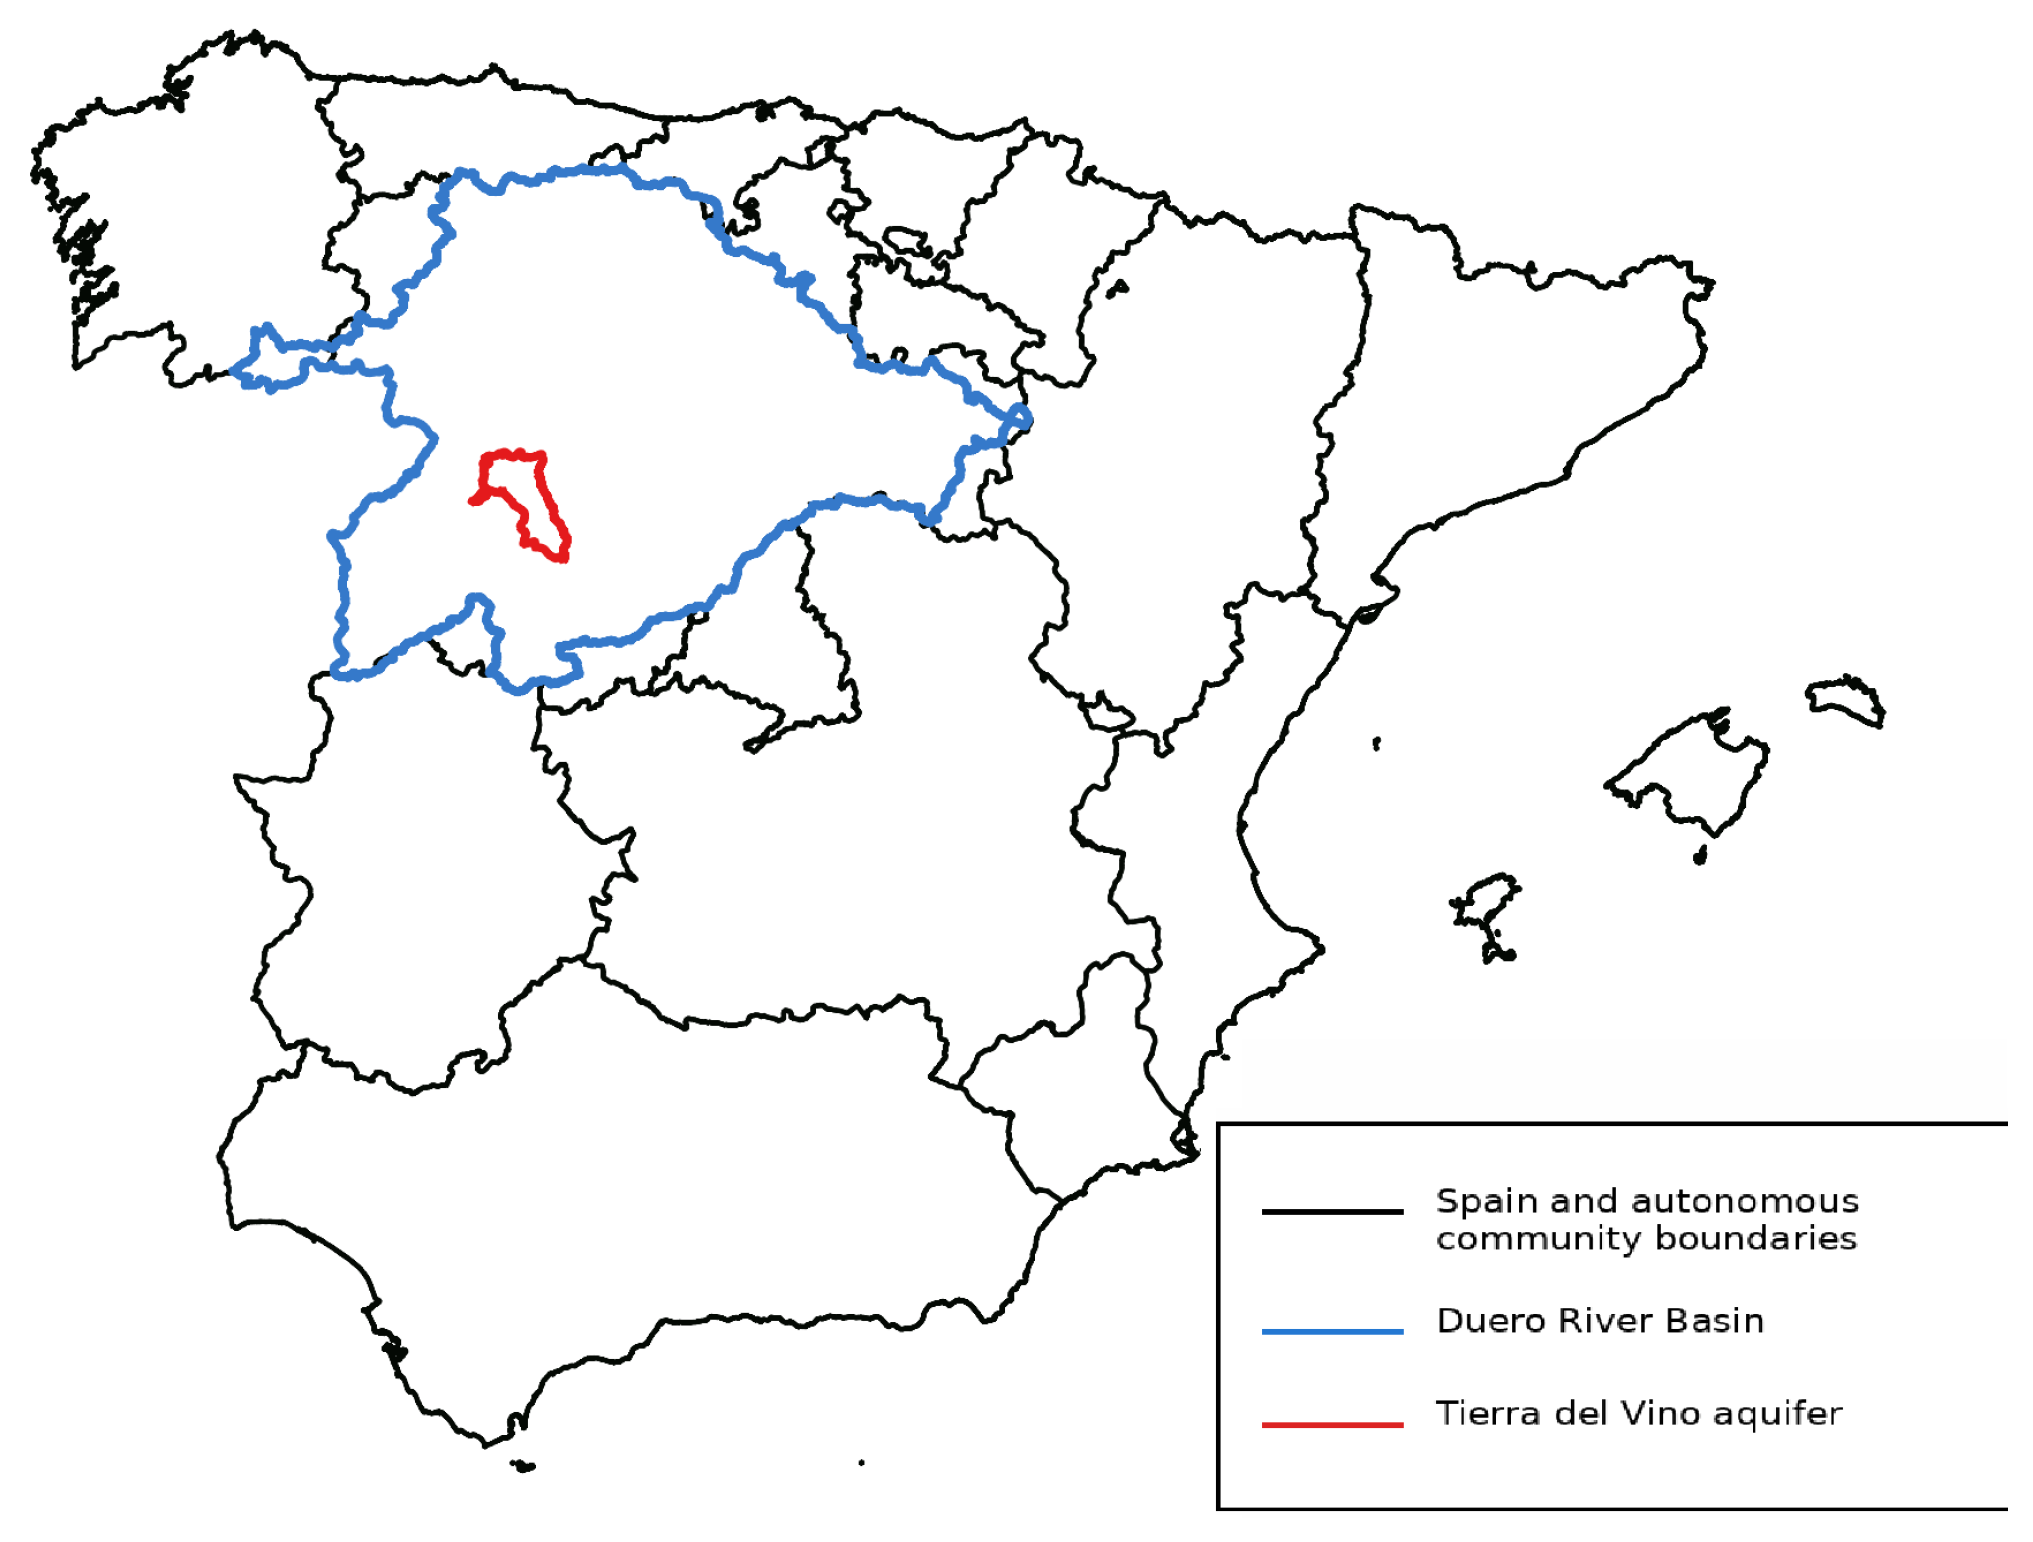
2.1. Geographical Setting and Hydrogeological Framework
2.2. Agricultural Use Context and Extraction Pressure
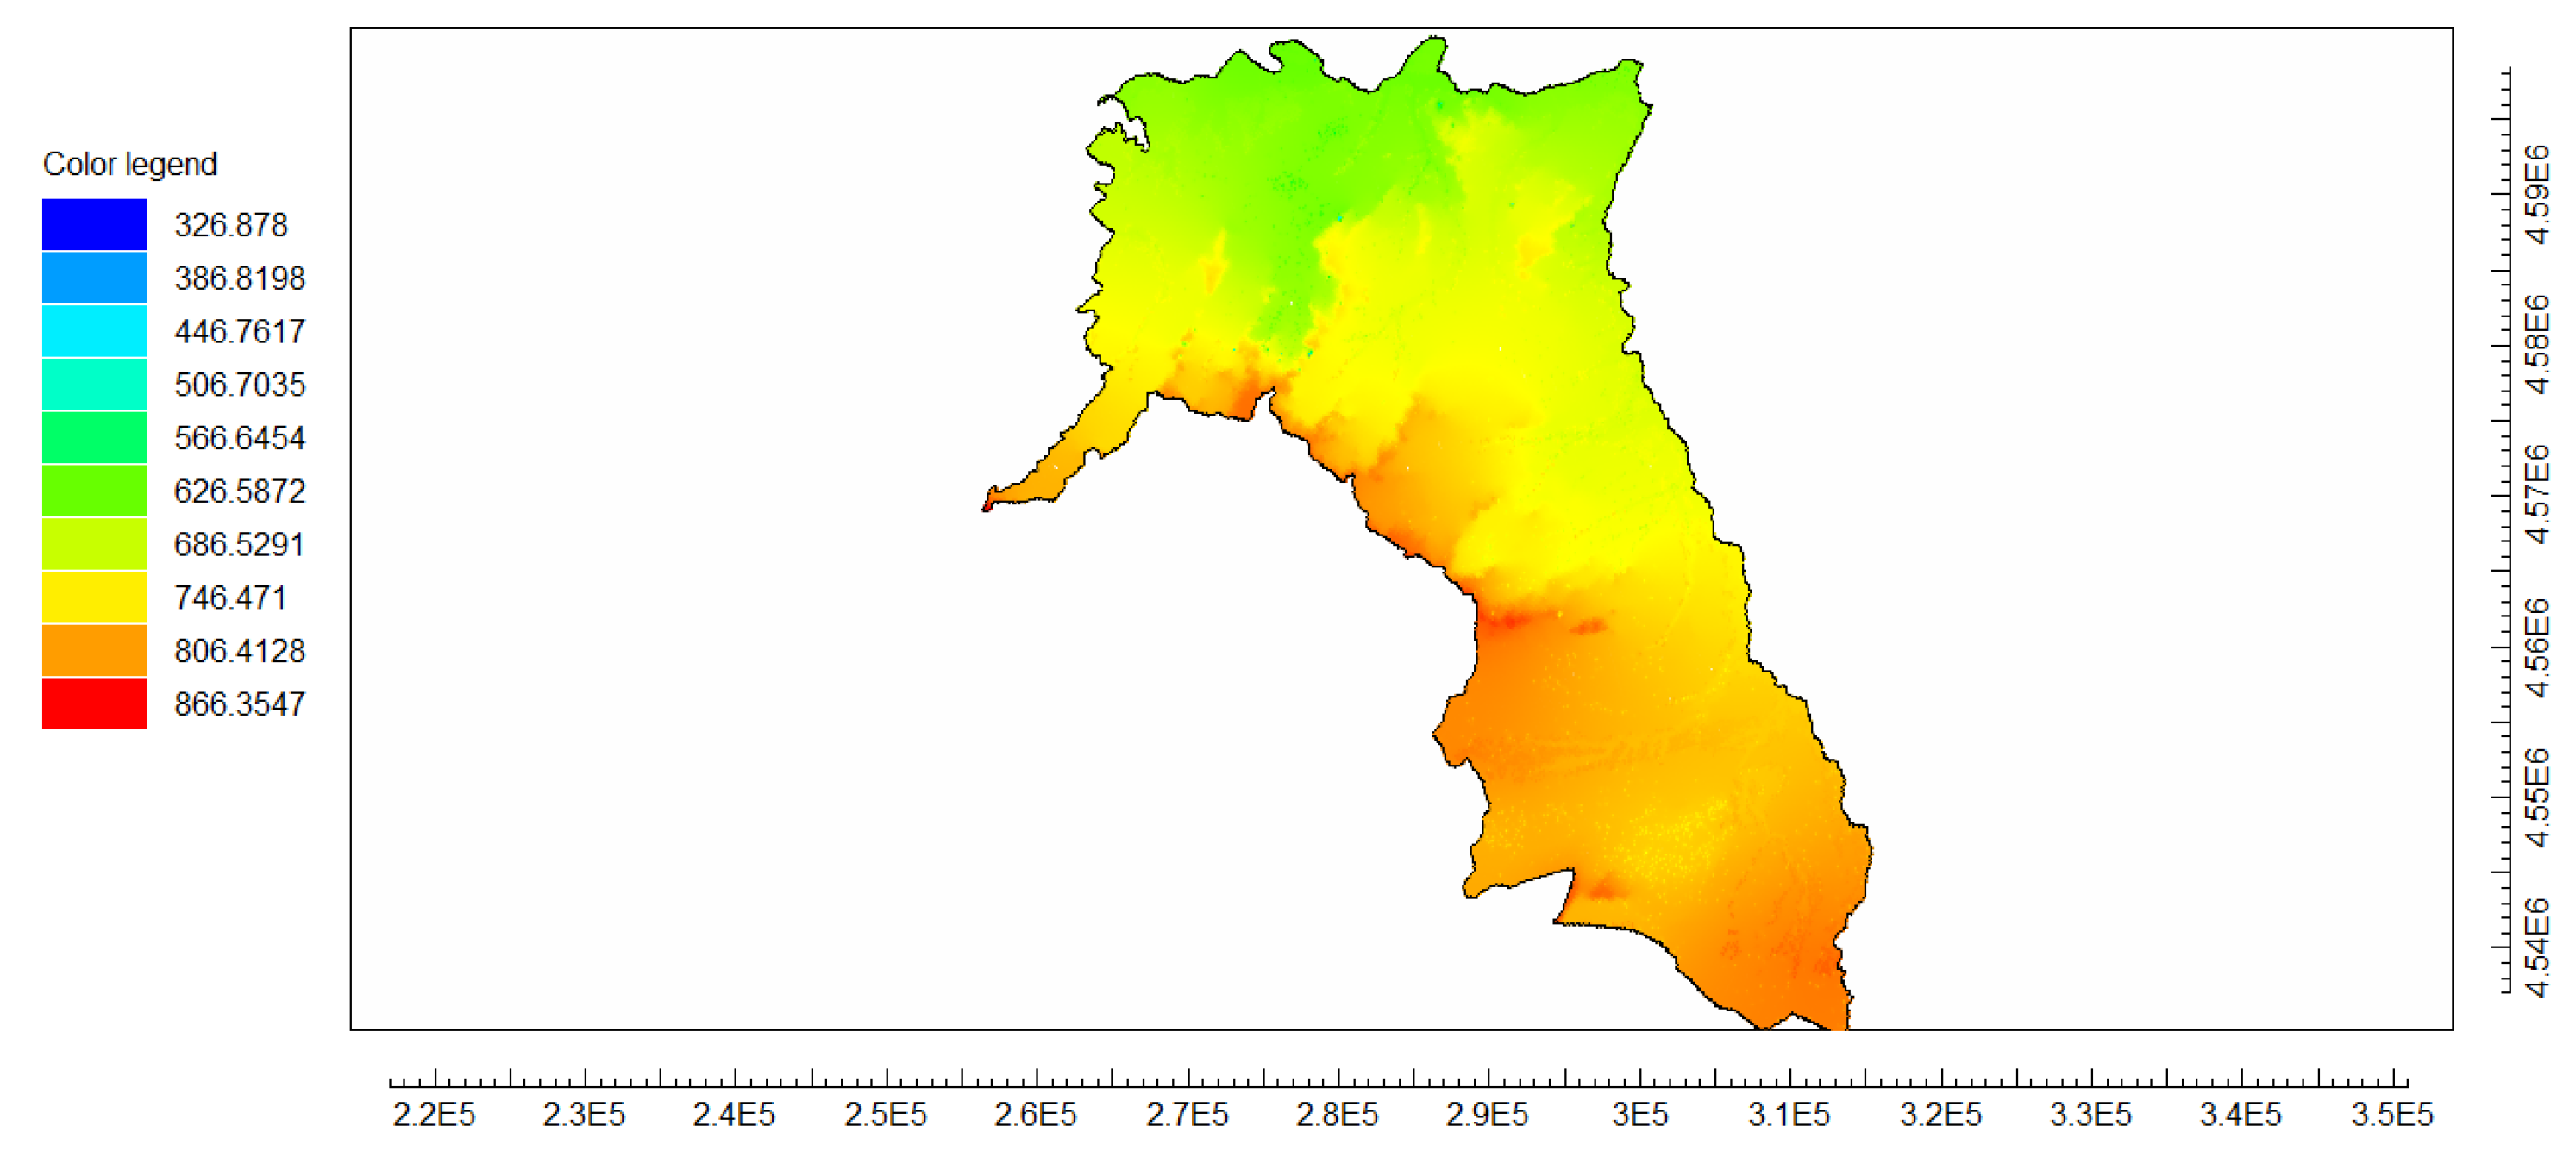
2.3. Justification and Selection of the Detailed Calibration Area
3. Methodology
3.1. Data Used and Information Sources
3.2. Grid Design and Spatial Discretization
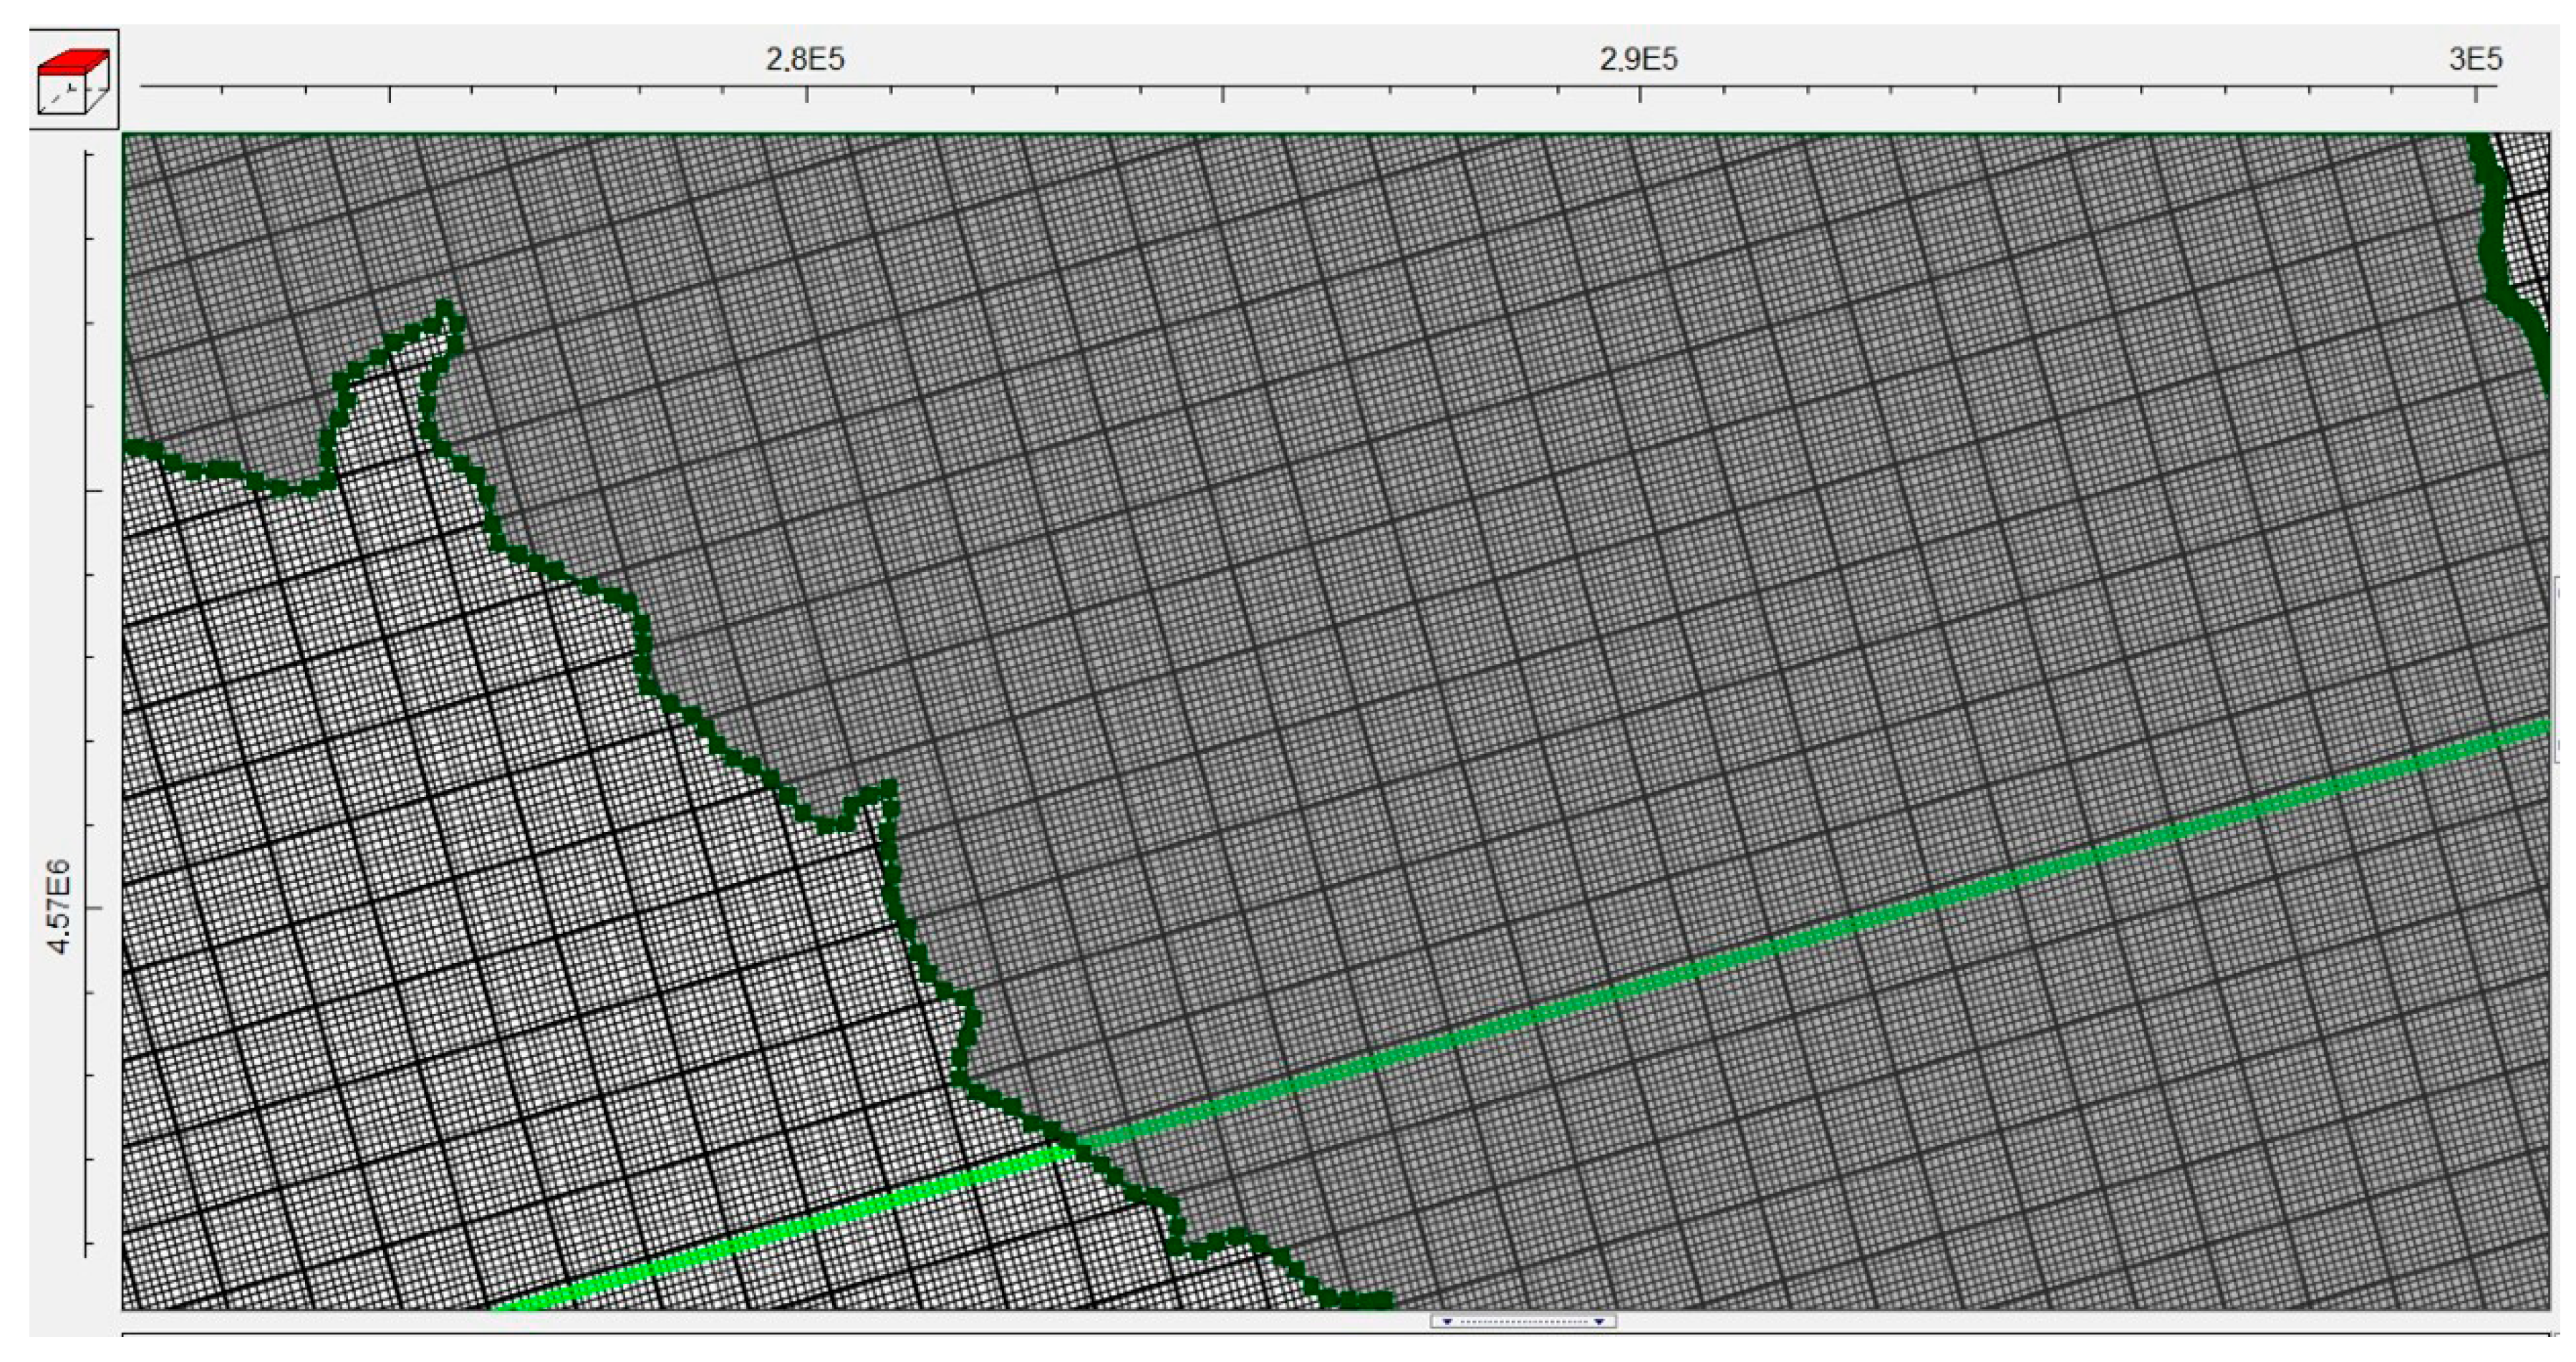
- Physical representativeness: The adopted spatial resolution (100 × 100 m; 1 ha per cell) is appropriate for the regional scale of the Tierra del Vino aquifer (1785.44 km2), as it allows a sufficiently detailed representation of the spatial distribution of abstractions and the associated hydraulic gradients, particularly in areas of intensive irrigation. This discretization is also consistent with the density and spatial distribution of the piezometric monitoring points used during calibration, facilitating a coherent comparison between simulated and observed groundwater levels.
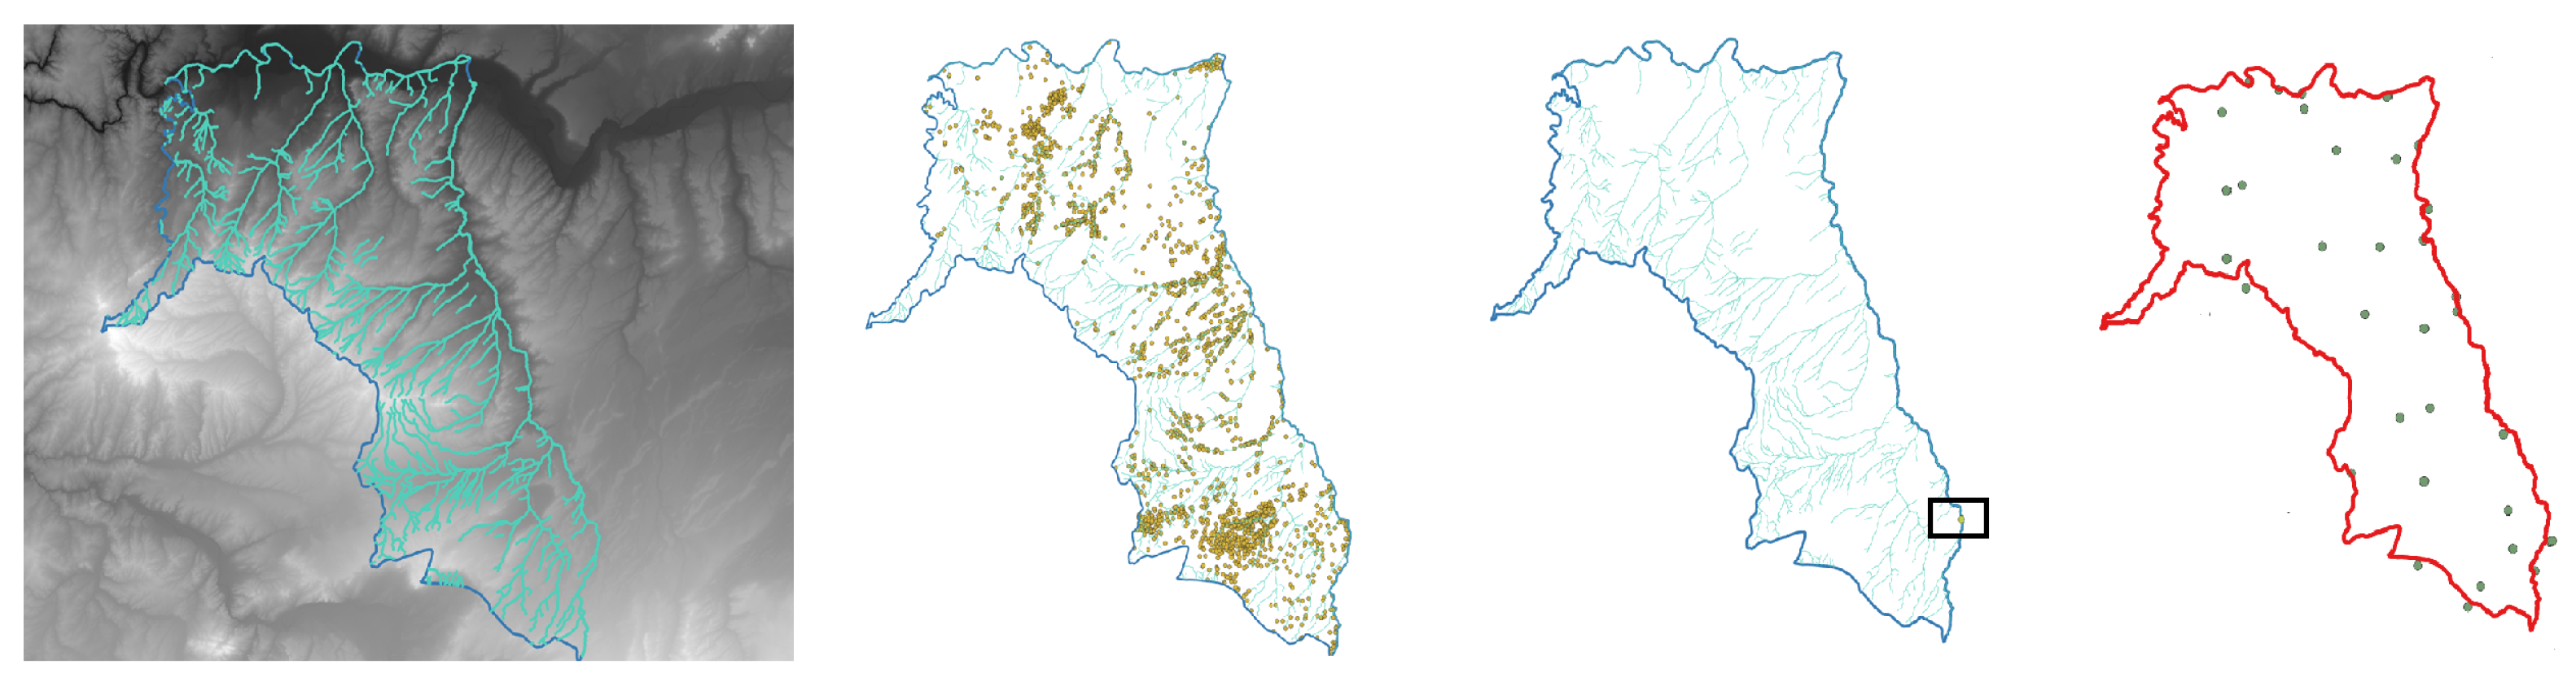
- Numerical efficiency: The grid dimension ensures robust convergence and accurate mass balance in MODFLOW 6 [21], enabling the efficient execution of the more than 500 iterations required during the manual calibration process. This methodological approach is consistent with previous studies on climate-driven groundwater simulations, such as [27], which highlight the capability of MODFLOW to integrate variable recharge data as a key factor for predicting piezometric surface behaviour under climate change scenarios. The resulting spatial discretization and grid layout are shown in Figure 4.
3.3. Vertical Structure and Hydraulic Parameterization
3.4. Boundary Conditions and System Inputs
3.5. Calibration Strategy and Numerical Adjustment
- Methodological approach. Given the hydrogeological complexity of the Tertiary detrital aquifer and the marked spatial heterogeneity of its hydraulic properties, an iterative manual calibration procedure based on the trial-and-error technique was adopted. This approach was considered appropriate for a regional multilayer model, where hydrogeological interpretation and progressive parameter control are fundamental [13].
- Iterative process. The adjustment required a large number of successive model runs (more than 500), allowing the progressive refinement of the spatial zonation of hydraulic conductivities, particularly in sectors subjected to greater anthropogenic pressure from groundwater abstraction.
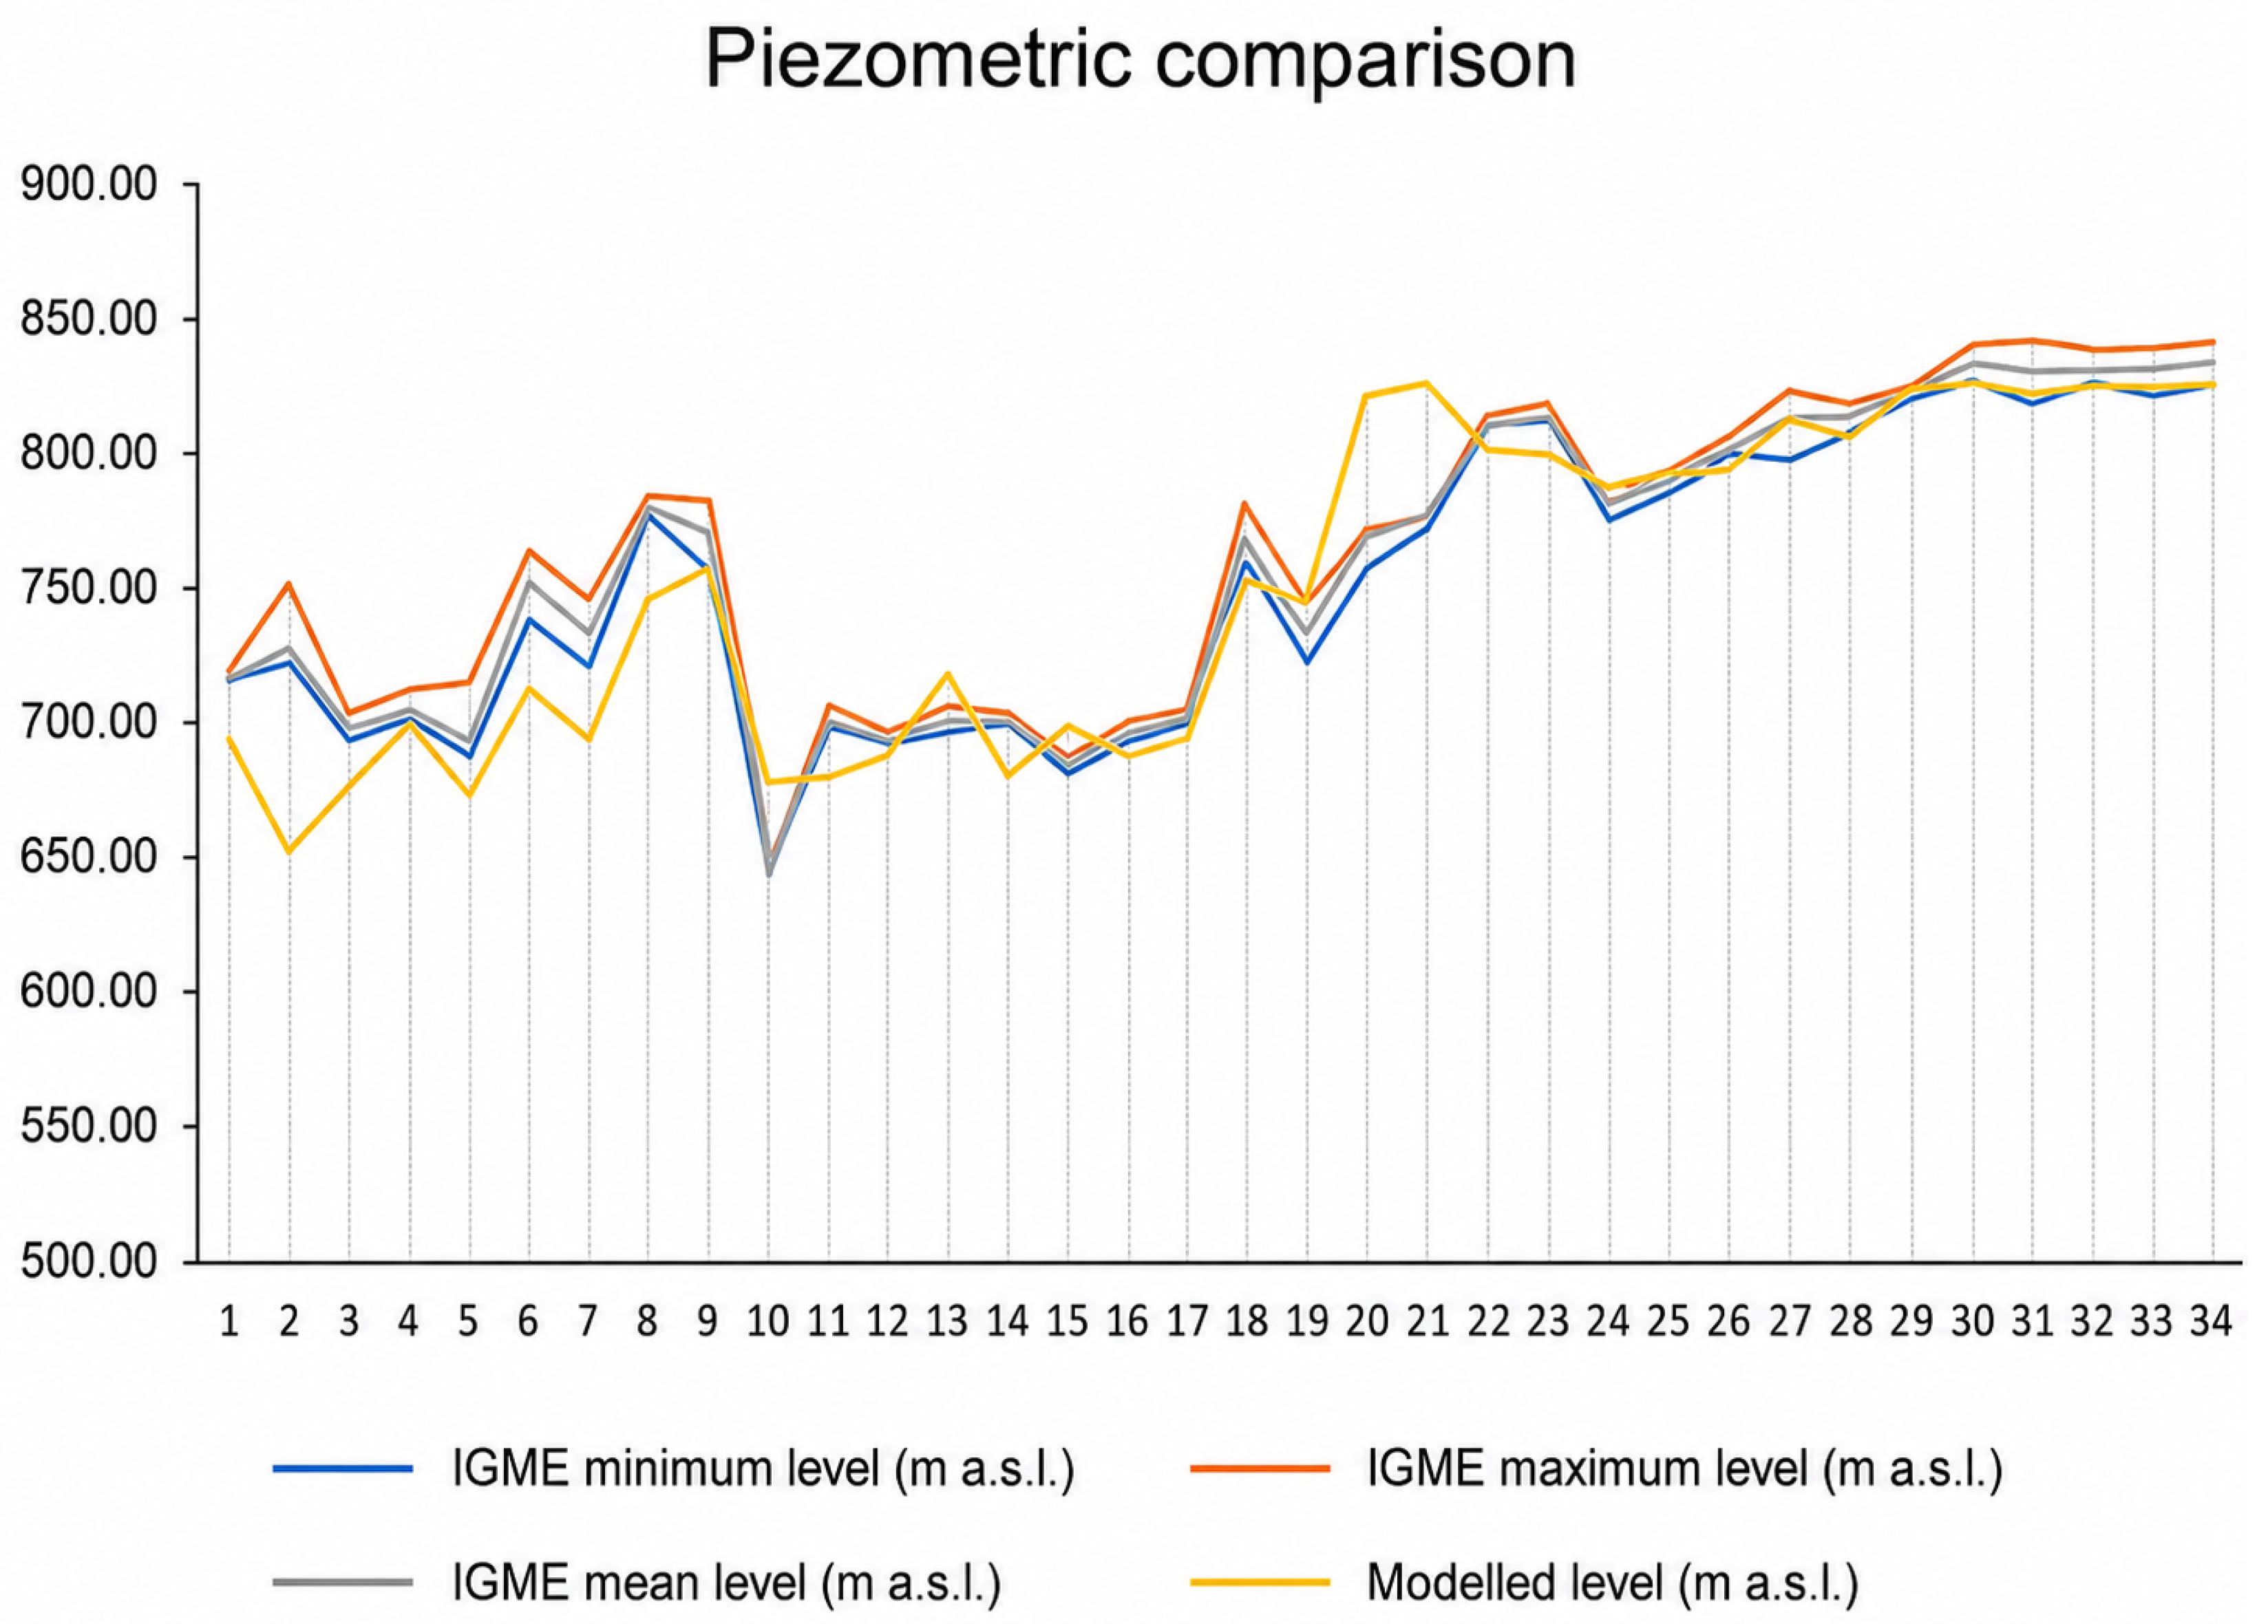
- Control data. Calibration was carried out by comparing simulated piezometric levels with observed levels obtained from the official piezometric monitoring network managed by the Geological and Mining Institute of Spain (IGME), previously described in the data sources section.
- Calibration criteria. Following the recommendations for the construction and evaluation of groundwater flow models described by [13], calibration was oriented to simultaneously ensuring:
- –
- consistency between simulated piezometric levels and observed values through the adjustment of effective hydraulic conductivities;
- –
- numerical stability of the finite-difference solution scheme;
- –
- a mass balance with a reduced percentage error, ensuring the internal consistency of the model.
- Initial parameterization conditions. The initial values of the hydraulic parameters used as the starting point of the calibration process were established from the official technical information of the Duero River Basin Authority, previously described in the hydraulic parameterization section. The final adjusted values, together with the model performance statistics, are presented in the Results section.
4. Results and Discussion
4.1. Model Validation
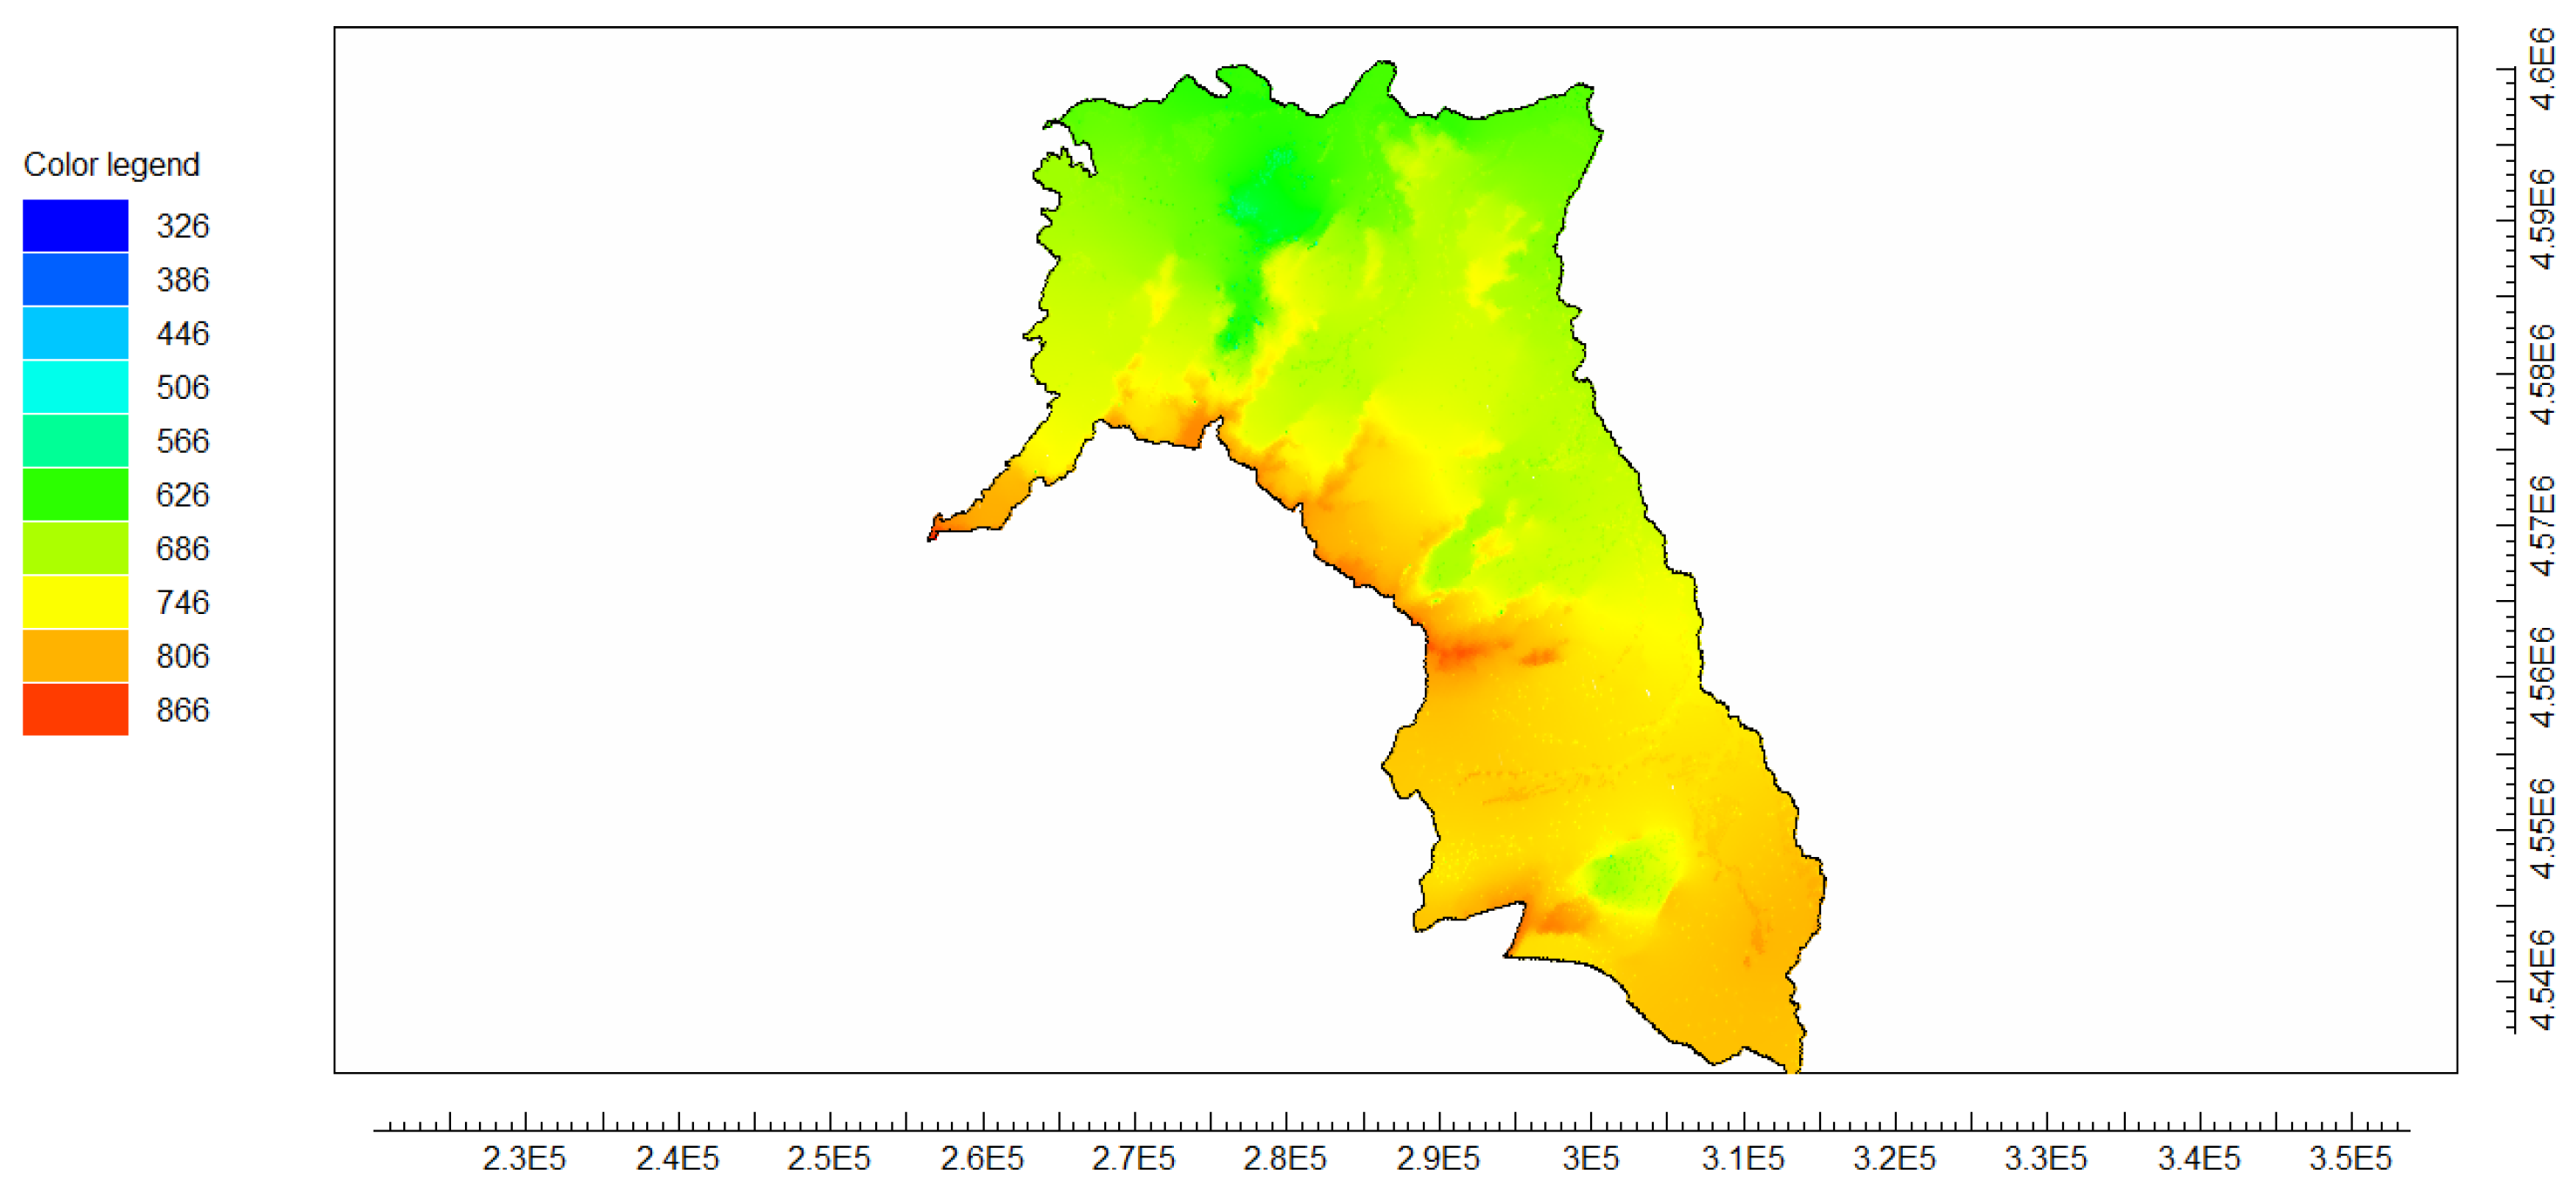
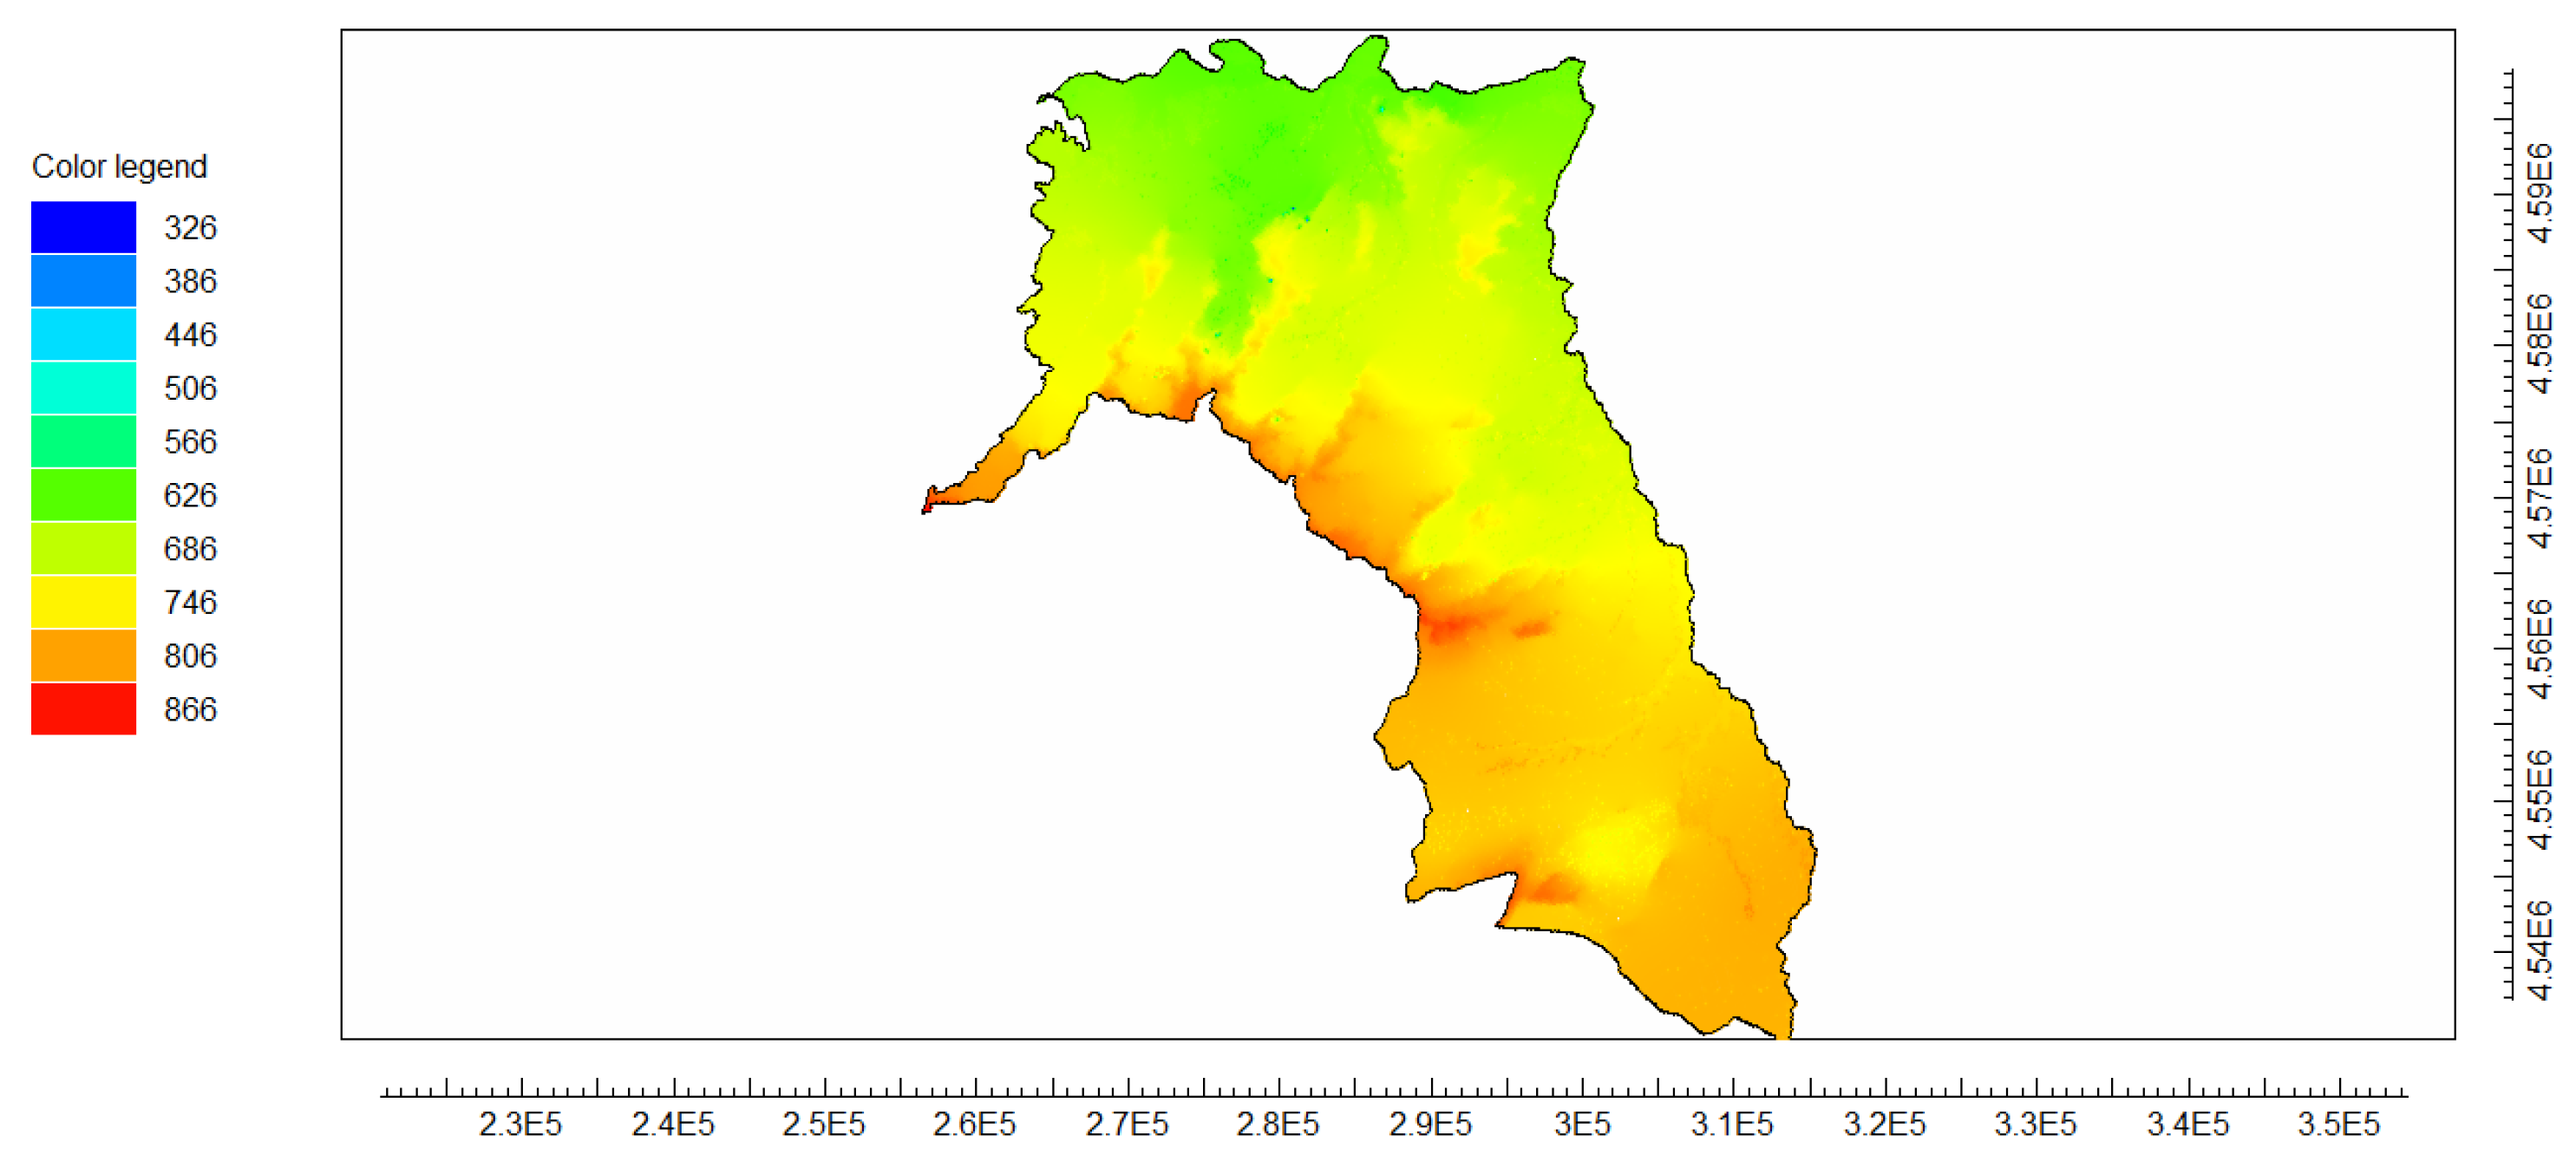
- Main aquifer (Layer 5): this level behaved as the most influential in the hydrodynamic response of the system within the model domain. Calibration resulted in an effective hydraulic conductivity on the order of (≈). This value is consistent with relatively permeable detrital materials (sands/conglomerates with silty fractions) described for productive Tertiary levels in the regional hydrogeological information.
- Lower-permeability units (Layers 1, 2, 3, 4, 6 and 7): these layers were parameterized with hydraulic conductivities significantly lower than those of the main aquifer, within the documented regional ranges, in order to represent the presence of finer detrital materials, partially cemented levels and/or silty and clayey intercalations that induce semi-confined conditions at depth. In the model, their function is to modulate effective transmissivity by layer and control vertical flow transfer between layers, consistent with the observed piezometric differentiation. The assignment of these values was adjusted during calibration, avoiding the imposition of a single identical value for all layers if such an assumption did not improve the fit or lacked hydrogeological justification.
- Vertical anisotropy: a constant vertical anisotropy ratio of was maintained in the calibrated model.
- Nash–Sutcliffe Efficiency (NSE): a normalized statistic that compares residual variance to the variance of measured data [32]. It ranges from to 1, where 1 indicates perfect agreement. Result obtained: 0.816. This value indicates a high level of agreement between observed and simulated groundwater levels.
- Mean Absolute Error (MAE): the mean absolute difference between simulated and observed levels, expressed in physical units (m). Result obtained: 20.49 m, a magnitude considered acceptable for a regional model of this scale.
- Root Mean Square Error (RMSE): the square root of the mean squared error, sensitive to larger deviations. Result obtained: 27.79 m, reflecting the dispersion associated with aquifer heterogeneity and local variability in areas with higher pumping density.
- Standard deviation of residuals (SDres): standard deviation of the residuals between simulated and observed mean piezometric levels, used as a complementary measure of calibration error dispersion. Result obtained: 26.98 m.
- Mean Absolute Percentage Error (MAPE): mean relative error expressed as a percentage. Result obtained: 2.9%, indicating a small relative difference and overall stability of the model fit.
- Pearson correlation coefficient (R): measures the strength of the linear relationship between observed and simulated values. Result obtained: 0.928, confirming a very strong direct relationship.
- Coefficient of determination (): represents the fraction of variance explained by the model fit. Result obtained: 0.819, indicating that 81.9% of the variability in measured groundwater levels is explained by the model. The remaining percentage is associated with factors not explicitly represented and with the inherent variability of the data.
4.2. Future Scenario Analysis
4.3. Discussion and Limitations
4.4. Implications for Sustainable Management
5. Conclusions
Author Contributions
Funding
Data Availability Statement
Acknowledgments
Conflicts of Interest
References
- Vicente-Serrano, S.M. Evolution of Climate Drought Studies in Spain in Recent Decades. Geographicalia 2021, 73, 7–34. [Google Scholar] [CrossRef]
- Caretta, M.A.; Mukherji, A.; Arfanuzzaman, M.; Betts, R.A.; Gerten, D.; Hirabayashi, Y.; Lissner, T.K.; Gunn, E.L.; Liu, J.; Morgan, R.; et al. Water. In Climate Change 2022: Impacts, Adaptation and Vulnerability; Cambridge University Press: Cambridge, UK, 2022; pp. 551–712. [Google Scholar] [CrossRef]
- Scanlon, B.R.; Faunt, C.C.; Longuevergne, L.; Reedy, R.C.; Alley, W.M.; McGuire, V.L.; McMahon, P.B. Groundwater depletion and sustainability of irrigated agriculture in the US High Plains and Central Valley. Proc. Natl. Acad. Sci. USA 2012, 109, 9320–9325. [Google Scholar] [CrossRef] [PubMed]
- Faunt, C.C. (Ed.) Groundwater Availability of the Central Valley Aquifer, California; U.S. Geological Survey Professional Paper 1766; U.S. Geological Survey: Reston, VA, USA, 2009; 227p. [CrossRef]
- Du, J.; Laghari, Y.; Wei, Y.-C.; Wu, L.; He, A.-L.; Liu, G.-Y.; Yang, H.-H.; Guo, Z.-Y.; Leghari, S.J. Groundwater Depletion and Degradation in the North China Plain: Challenges and Mitigation Options. Water 2024, 16, 354. [Google Scholar] [CrossRef]
- Confederación Hidrográfica del Duero. MÍRAME-Duero Viewer: Hydrogeological and Piezometric Information. Official Data Portal. 2026. Available online: https://mirame.chduero.es/chduero/ (accessed on 20 January 2026).
- Sahuquillo, A.; Custodio, E.; Llamas, M.R. Groundwater Management; Technical Report; Scientific and Technical Panel for Water Policy Monitoring, University of Seville–Spanish Ministry of Environment: Seville, Spain, 2009; p. 9. [Google Scholar]
- De la Hera-Portillo, A.; López-Gutiérrez, J.; Mayor, B.; López-Gunn, E.; Henriksen, H.J.; Gejl, R.N.; Zorrilla-Miras, P.; Martínez-Santos, P. An Initial Framework for Understanding the Resilience of Aquifers to Groundwater Pumping. Water 2021, 13, 519. [Google Scholar] [CrossRef]
- Jiménez Cisneros, B.E.; Oki, T.; Arnell, N.W.; Benito, G.; Cogley, J.G.; Döll, P.; Jiang, T.; Mwakalila, S.S. Freshwater Resources. In Climate Change 2014: Impacts, Adaptation, and Vulnerability; Cambridge University Press: Cambridge, UK, 2014; pp. 229–269. [Google Scholar]
- Shah, T.; Scott, C.; Kishore, A.; Sharma, A. Energy-Irrigation Nexus in South Asia: Improving Groundwater Conservation and Power Sector Viability, 2nd ed.; Research Report 70; International Water Management Institute: Colombo, Sri Lanka, 2004. [Google Scholar]
- Corominas, J. Agua y energía en el riego en la época de la sostenibilidad. Ing. Agua 2009, 17, 219–233. [Google Scholar]
- van Vuuren, D.P.; Edmonds, J.; Kainuma, M.; Riahi, K.; Thomson, A.; Hibbard, K.; Hurtt, G.C.; Kram, T.; Krey, V.; Lamarque, J.-F.; et al. The Representative Concentration Pathways: An Overview. Clim. Change 2011, 109, 5–31. [Google Scholar] [CrossRef]
- Anderson, M.P.; Woessner, W.W.; Hunt, R.J. Applied Groundwater Modeling: Simulation of Flow and Advective Transport, 2nd ed.; Academic Press: San Diego, CA, USA, 2015. [Google Scholar]
- Pulido-Velazquez, D.; García-Aróstegui, J.L.; Molina, J.L.; Pulido-Velazquez, M. Assessment of Future Groundwater Recharge in Semi-Arid Regions Under Climate Change Scenarios. Hydrol. Process. 2015, 29, 828–844. [Google Scholar] [CrossRef]
- Confederación Hidrográfica del Duero. Hydrological Plan of the Spanish Part of the Duero River Basin District 2022–2027; Technical Report; Spanish Ministry for Ecological Transition and Demographic Challenge: Valladolid, Spain, 2023. [Google Scholar]
- Instituto Geológico y Minero de España. Hydrogeological Characterisation of the Tierra del Vino Groundwater Body; Technical Report; IGME-CSIC: Madrid, Spain, 2022. [Google Scholar]
- Confederación Hidrográfica del Duero. La Masa de Agua Subterránea Tierra del Vino (400048); Technical Report; Duero River Basin Authority: Valladolid, Spain, 2014. [Google Scholar]
- Confederación Hidrográfica del Duero. Technical Sheet of Groundwater Body 400048–Tierra del Vino; MÍRAME-IDEDuero Information System: Valladolid, Spain, 2026. [Google Scholar]
- Confederación Hidrográfica del Duero. Annex 5: Water Demands. Appendix III: Irrigation Use Methodology; Technical Report; Hydrological Plan 2015–2021; Spanish Ministry of Agriculture, Food and Environment: Valladolid, Spain, 2015. [Google Scholar]
- Harbaugh, A.W. MODFLOW-2005, The U.S. Geological Survey Modular Ground-Water Model; Technical Report 6-A16; U.S. Geological Survey: Reston, VA, USA, 2005.
- Langevin, C.D.; Hughes, J.D.; Banta, E.R.; Niswonger, R.G.; Panday, S.; Provost, A.M. Documentation for the MODFLOW 6 Groundwater Flow Model; Technical Report Techniques and Methods 6-A55; U.S. Geological Survey: Reston, VA, USA, 2017. [CrossRef]
- Winston, R.B. ModelMuse Version 4: A Graphical User Interface for MODFLOW 6; Technical Report Scientific Investigations Report 2019-5036; U.S. Geological Survey: Reston, VA, USA, 2019. [CrossRef]
- Instituto Geológico y Minero de España (IGME). Piezometric Monitoring Network and Groundwater Level Data. Official Groundwater Level Database. 2025. Available online: https://catalogo.igme.es/geonetwork/srv/api/records/ESPIGMEPUNTOSAGUA20190723 (accessed on 20 January 2026).
- IPCC. Climate Change 2013: The Physical Science Basis. Contribution of Working Group I to the Fifth Assessment Report of the Intergovernmental Panel on Climate Change; Cambridge University Press: Cambridge, UK; New York, NY, USA, 2013. [Google Scholar]
- CEDEX. Assessment of Climate Change Impacts on Water Resources and Droughts in Spain; Technical Report; Centro de Estudios y Experimentación de Obras Públicas: Madrid, Spain, 2017. [Google Scholar]
- FAO. CROPWAT 8.0 for Windows: Software for Crop Water Requirements and Irrigation Scheduling; FAO: Rome, Italy, 2009. [Google Scholar]
- Toure, A.; Diekkrüger, B.; Mariko, A. Impact of Climate Change on Groundwater Resources in the Klela Basin, Southern Mali. Hydrology 2016, 3, 17. [Google Scholar] [CrossRef]
- Instituto Geológico y Minero de España. Hydrogeological Map of Spain 1:200,000. Sheet 37 Salamanca; Technical Report; Lithostratigraphic Base Used for Model Layer Definition; Ministry of Industry and Energy: Madrid, Spain, 1982.
- McDonald, M.G.; Harbaugh, A.W. A Modular Three-Dimensional Finite-Difference Ground-Water Flow Model. In Techniques of Water-Resources Investigations Book 6, Chapter A1; U.S. Geological Survey: Reston, VA, USA, 1988. [Google Scholar]
- Cabrera-Estupiñán, E.; Hernández-Valdés, A. Modelación del agua subterránea a escala regional con refinamiento local de la malla: Planteamiento y validación del algoritmo. Tecnol. Cienc. Agua 2011, 2, 65–82. Available online: http://www.scielo.org.mx/scielo.php?script=sci_arttext&pid=S2007-24222011000100005&lng=es&nrm=iso (accessed on 1 May 2026).
- Moriasi, D.N.; Gitau, M.W.; Pai, N.; Daggupati, P. Hydrologic and Water Quality Models: Performance Measures and Evaluation Criteria. Trans. ASABE 2015, 58, 1763–1785. [Google Scholar] [CrossRef]
- Nash, J.E.; Sutcliffe, J.V. River Flow Forecasting Through Conceptual Models Part I—A Discussion of Principles. J. Hydrol. 1970, 10, 282–290. [Google Scholar] [CrossRef]
- Olcina Cantos, J. Water Planning and Management in Spain in a Climate Change Context: Facts and Proposals. Cuad. Investig. Geogr. 2024, 50, 3–28. [Google Scholar] [CrossRef]
- FAO. Energy-Smart Food for People and Climate; Technical Report; Food and Agriculture Organization of the United Nations: Rome, Italy, 2011. [Google Scholar]
- Albiac, J.; Esteban, E.; Tapia, J.; Kahil, T. Economics of Irrigation Water Management; Water Resources Management and Policy; Springer: Cham, Switzerland, 2023. [Google Scholar]
- Alley, W.M.; Reilly, T.E.; Franke, O.L. Sustainability of Ground-Water Resources; Technical Report 1186; U.S. Geological Survey: Denver, CO, USA, 1999.
- Custodio, E. Aquifer Overexploitation: What Does It Mean? Hydrogeol. J. 2002, 10, 254–277. [Google Scholar] [CrossRef]




Disclaimer/Publisher’s Note: The statements, opinions and data contained in all publications are solely those of the individual author(s) and contributor(s) and not of MDPI and/or the editor(s). MDPI and/or the editor(s) disclaim responsibility for any injury to people or property resulting from any ideas, methods, instructions or products referred to in the content. |
© 2026 by the authors. Licensee MDPI, Basel, Switzerland. This article is an open access article distributed under the terms and conditions of the Creative Commons Attribution (CC BY) license.
Share and Cite
Virto González, D.; Ruiz Pérez, L.; González-Barragán, I.; González Morales, M.J. Resilience and Sustainability of Aquifers Under Climatic and Agricultural Pressure. Water 2026, 18, 1163. https://doi.org/10.3390/w18101163
Virto González D, Ruiz Pérez L, González-Barragán I, González Morales MJ. Resilience and Sustainability of Aquifers Under Climatic and Agricultural Pressure. Water. 2026; 18(10):1163. https://doi.org/10.3390/w18101163
Chicago/Turabian StyleVirto González, Dunia, Lidia Ruiz Pérez, Isabel González-Barragán, and María Jesús González Morales. 2026. "Resilience and Sustainability of Aquifers Under Climatic and Agricultural Pressure" Water 18, no. 10: 1163. https://doi.org/10.3390/w18101163
APA StyleVirto González, D., Ruiz Pérez, L., González-Barragán, I., & González Morales, M. J. (2026). Resilience and Sustainability of Aquifers Under Climatic and Agricultural Pressure. Water, 18(10), 1163. https://doi.org/10.3390/w18101163