Article

Dynamic Multi-Factor Flood Risk Assessment in Peri-Urban Areas: Integrating Migration, Exposure, and Community-Level Vulnerability and Capacity


1
Department of Civil and Environmental Engineering, Graduate School of Urban Environmental Sciences, Tokyo Metropolitan University, Hachioji City 192-0397, Japan
2
Centre for Natural Resources and Environment, Cambodia Development Resource Institute, 56 Street 315, Tuol Kork, Phnom Penh 120508, Cambodia
*
Authors to whom correspondence should be addressed.
Water 2026, 18(10), 1152; https://doi.org/10.3390/w18101152
Submission received: 7 April 2026 / Revised: 4 May 2026 / Accepted: 8 May 2026 / Published: 11 May 2026
(This article belongs to the Special Issue Water: Economic, Social and Environmental Analysis)

Abstract

Rapid peri-urban expansion has intensified flood risk in Southeast Asian cities through wetland loss, rural–urban migration, and delayed infrastructure development. This study examines the spatial and temporal dimensions of flood risk in Phnom Penh, Cambodia using a multi-factor framework based on hazard, exposure, vulnerability, and coping capacity. Vulnerability and coping capacity are analysed at both community and household levels. Migrant settlement duration captures differences in exposure and adaptive capacity over time. A composite flood risk index is constructed from survey data using the Rank Order Centroid weighting method. Results show that exposure is the dominant driver of flood risk, exceeding the influence of hazard intensity and largely shaping spatial patterns. Community-level vulnerability and coping capacity exert stronger effects than household-level characteristics, highlighting the importance of infrastructure and local settings. Flood risk varies across migrant groups: new migrants face the highest risk due to elevated exposure and vulnerability, while long-term migrants experience lower risk as adaptive capacity improves over time. However, risk reduction varies across groups, with persistent challenges linked to infrastructure and disaster preparedness systems. These findings highlight the importance of community-scale resilience strategies and targeted infrastructure investment to reduce flood risk in rapidly urbanising cities.

1. Introduction

Urban flooding is an increasing climate-related risk in rapidly urbanising cities of the Global South [1,2,3]. In Southeast Asia, flood impacts cannot be explained solely by hydrological processes. Instead, they reflect socio-spatial dynamics shaped by urban expansion, migration, land transformation, and uneven infrastructure provision [4,5,6,7,8]. These dynamics are particularly pronounced in peri-urban areas, where rapid settlement growth often outpaces planning control, drainage provision, and disaster management [9,10]. As a result, flood risk becomes spatially uneven and socially differentiated.
Flood risk is commonly defined and operationalized as the interaction of hazard, exposure, vulnerability, and coping capacity [11,12,13,14,15,16]. Hazard and exposure describe the physical characteristics of flood events and the distribution of assets at risk. Vulnerability and coping capacity capture the social, economic, environmental, and institutional conditions that shape flood impacts. Importantly, these dimensions operate across multiple scales [17]. Community-level conditions—such as drainage systems, land-use change, and environmental degradation—structure exposure and constrain adaptation. Household-level characteristics, including income, health, and housing conditions, influence sensitivity but remain embedded within these broader systems.
Coping capacity similarly reflects both institutional and household dimensions. Community-level capacity includes local management effectiveness, disaster risk reduction systems, and early warning mechanisms [18]. On the one hand, household capacity depends on financial resources, preparedness, and social networks [19]. However, household responses are often conditioned by institutional support and service accessibility. Flood risk is therefore not only a function of hazard intensity but also a product of uneven spatial development and infrastructural provision.
Recent flood vulnerability assessments often combine multiple physical and social factors into a Flood Vulnerability Index (FVI). FVI integrates hydro-climatic variables such as rainfall intensity, flood depth, and flood frequency [11,12,20]. It also incorporates exposure indicators, including population density and the location of critical infrastructure [15]. Socioeconomic factors, such as literacy, employment, and housing quality, capture community preparedness and adaptive capacity [21,22].
Geospatial methods, particularly GIS-based spatial analysis, are commonly used to map the spatial distribution of vulnerability and exposure [23,24]. Multi-Criteria Decision Analysis (MCDA) allows these diverse indicators to be weighted and combined into a composite index [25,26]. Techniques such as the Analytic Hierarchy Process (AHP) and the Rank Order Centroid (ROC) provide systematic methods for assigning indicator weights [27,28,29].
While traditional FVI frameworks capture spatial variation, they often treat vulnerability as static. Incorporating temporal dynamics, for example, using migrant settlement duration, provides insight into how flood risk evolves. This study applies a composite hazard, exposure, vulnerability and coping capacity (H-E-V-C) framework to urban flood risk in Phnom Penh and incorporates migration dynamics. While similar approaches have been applied in South Asia [2,30,31,32,33,34] and Latin America as well as Europe [35,36,37,38], our study provides a novel local context for peri-urban Cambodia. By integrating migration dynamics and cross-scalar vulnerability, this approach enables a detailed assessment of spatially and temporally differentiated flood risk.
Migration introduces a critical temporal dimension to flood risk. In many Southeast Asian cities, migrants settle in peri-urban areas where land is more accessible but often more hazard-prone [8,39,40]. Over time, households may improve their housing, accumulate knowledge, and strengthen their social networks, thereby enhancing their adaptive capacity. However, prolonged exposure to degraded environments, combined with wetland loss and increasing surface sealing, can intensify flood risk [41,42]. Infrastructure deterioration and governance gaps may further constrain adaptation [43,44]. Flood risk, therefore, evolves dynamically and does not necessarily decline with settlement duration.
Despite growing recognition of these dynamics, many flood risk assessments remain static. Existing studies often prioritise hydrological modelling or economic loss estimation while underrepresenting cross-scalar vulnerability and temporal processes. In Cambodia, research has focused on riverine flooding [7,45,46], city-scale modelling [41,47,48,49,50,51,52], urban poor and climate resilience [43,44,48,53,54,55,56,57,58,59] or socioeconomic study and loss estimation [43,56,58,59,60,61,62]. Few studies integrate community- and household-level vulnerability with migration dynamics within a unified flood risk framework.
Phnom Penh provides a critical case for examining these processes. The city has experienced rapid peri-urban expansion since the early 2000s, largely driven by wetland conversion and urban sprawl [41,42]. Approximately one-quarter of peri-urban areas are flood-prone [52]. At the same time, pluvial flooding has intensified due to increasing rainfall and drainage constraints [51], particularly in rapidly expanding districts such as Dangkor and Por Senchey [61]. These changes disproportionately affect low-income and migrant communities, where infrastructure deficits and limited institutional support increase vulnerability [60,63].
This study addresses these gaps by developing a dynamic, multi-scalar flood risk framework that integrates hazard, exposure, vulnerability, and coping capacity with migration dynamics. Vulnerability and coping capacity are disaggregated into community and individual levels to distinguish structural and individual determinants. Migrant settlement duration is incorporated to capture temporal changes in exposure, vulnerability and adaptive capacity. A composite flood risk index is constructed using a rank-based ROC, based mainly on household survey data and Sangkat-level indicators in peri-urban Phnom Penh.
The study pursues three objectives: (1) to quantify spatial variation in flood risk using a multi-factor hazard–exposure–vulnerability–coping capacity (H-E-V-C) framework; (2) to assess the relative influence of community- and household-level vulnerability and coping capacity on flood risk outcomes; and (3) to examine how migrant settlement duration shapes dynamic flood risk trajectories across peri-urban communities.
This study contributes to flood risk research in three ways. First, it demonstrates that exposure and community-level conditions are the dominant drivers of peri-urban flood risk, exceeding the role of hazard intensity. Second, it introduces a temporal perspective, showing that flood risk evolves non-linearly across migrant groups. Third, it provides fine-scale empirical evidence from a rapidly urbanising Southeast Asian city, offering policy-relevant insights for migrant-inclusive and community-based flood risk management.

2. Materials and Methods

2.1. Conceptual Framework

This study adopts and extends the Methods for the Improvement of Vulnerability Assessment in Europe (MOVE) framework [11] in conjunction with the IPCC (2014) risk framework [64]. The IPCC framework conceptualises disaster risk as a function of hazard, exposure, and vulnerability. The MOVE framework further elaborates vulnerability by incorporating dimensions related to anticipation, coping, and recovery capacity.
Building on these approaches, and following Imamura (2022) [12], this study conceptualises flood risk as an interaction among H-E-V-C. Flood risk (FR) is therefore expressed in Equations (1) and (2) as:
F R =   H × E × V C
F R = H × E × V c o m   + V i n d C c o m +   C i n d
H denotes hazard, E exposure, V vulnerability, and C coping capacity. The multiplicative structure reflects reinforcing interactions. Vulnerability is disaggregated into community-level ( V c o m ) and individual ( V i n d ). Coping capacity is similarly divided into community-level ( C c o m ) and individual ( C i n d ) dimensions.
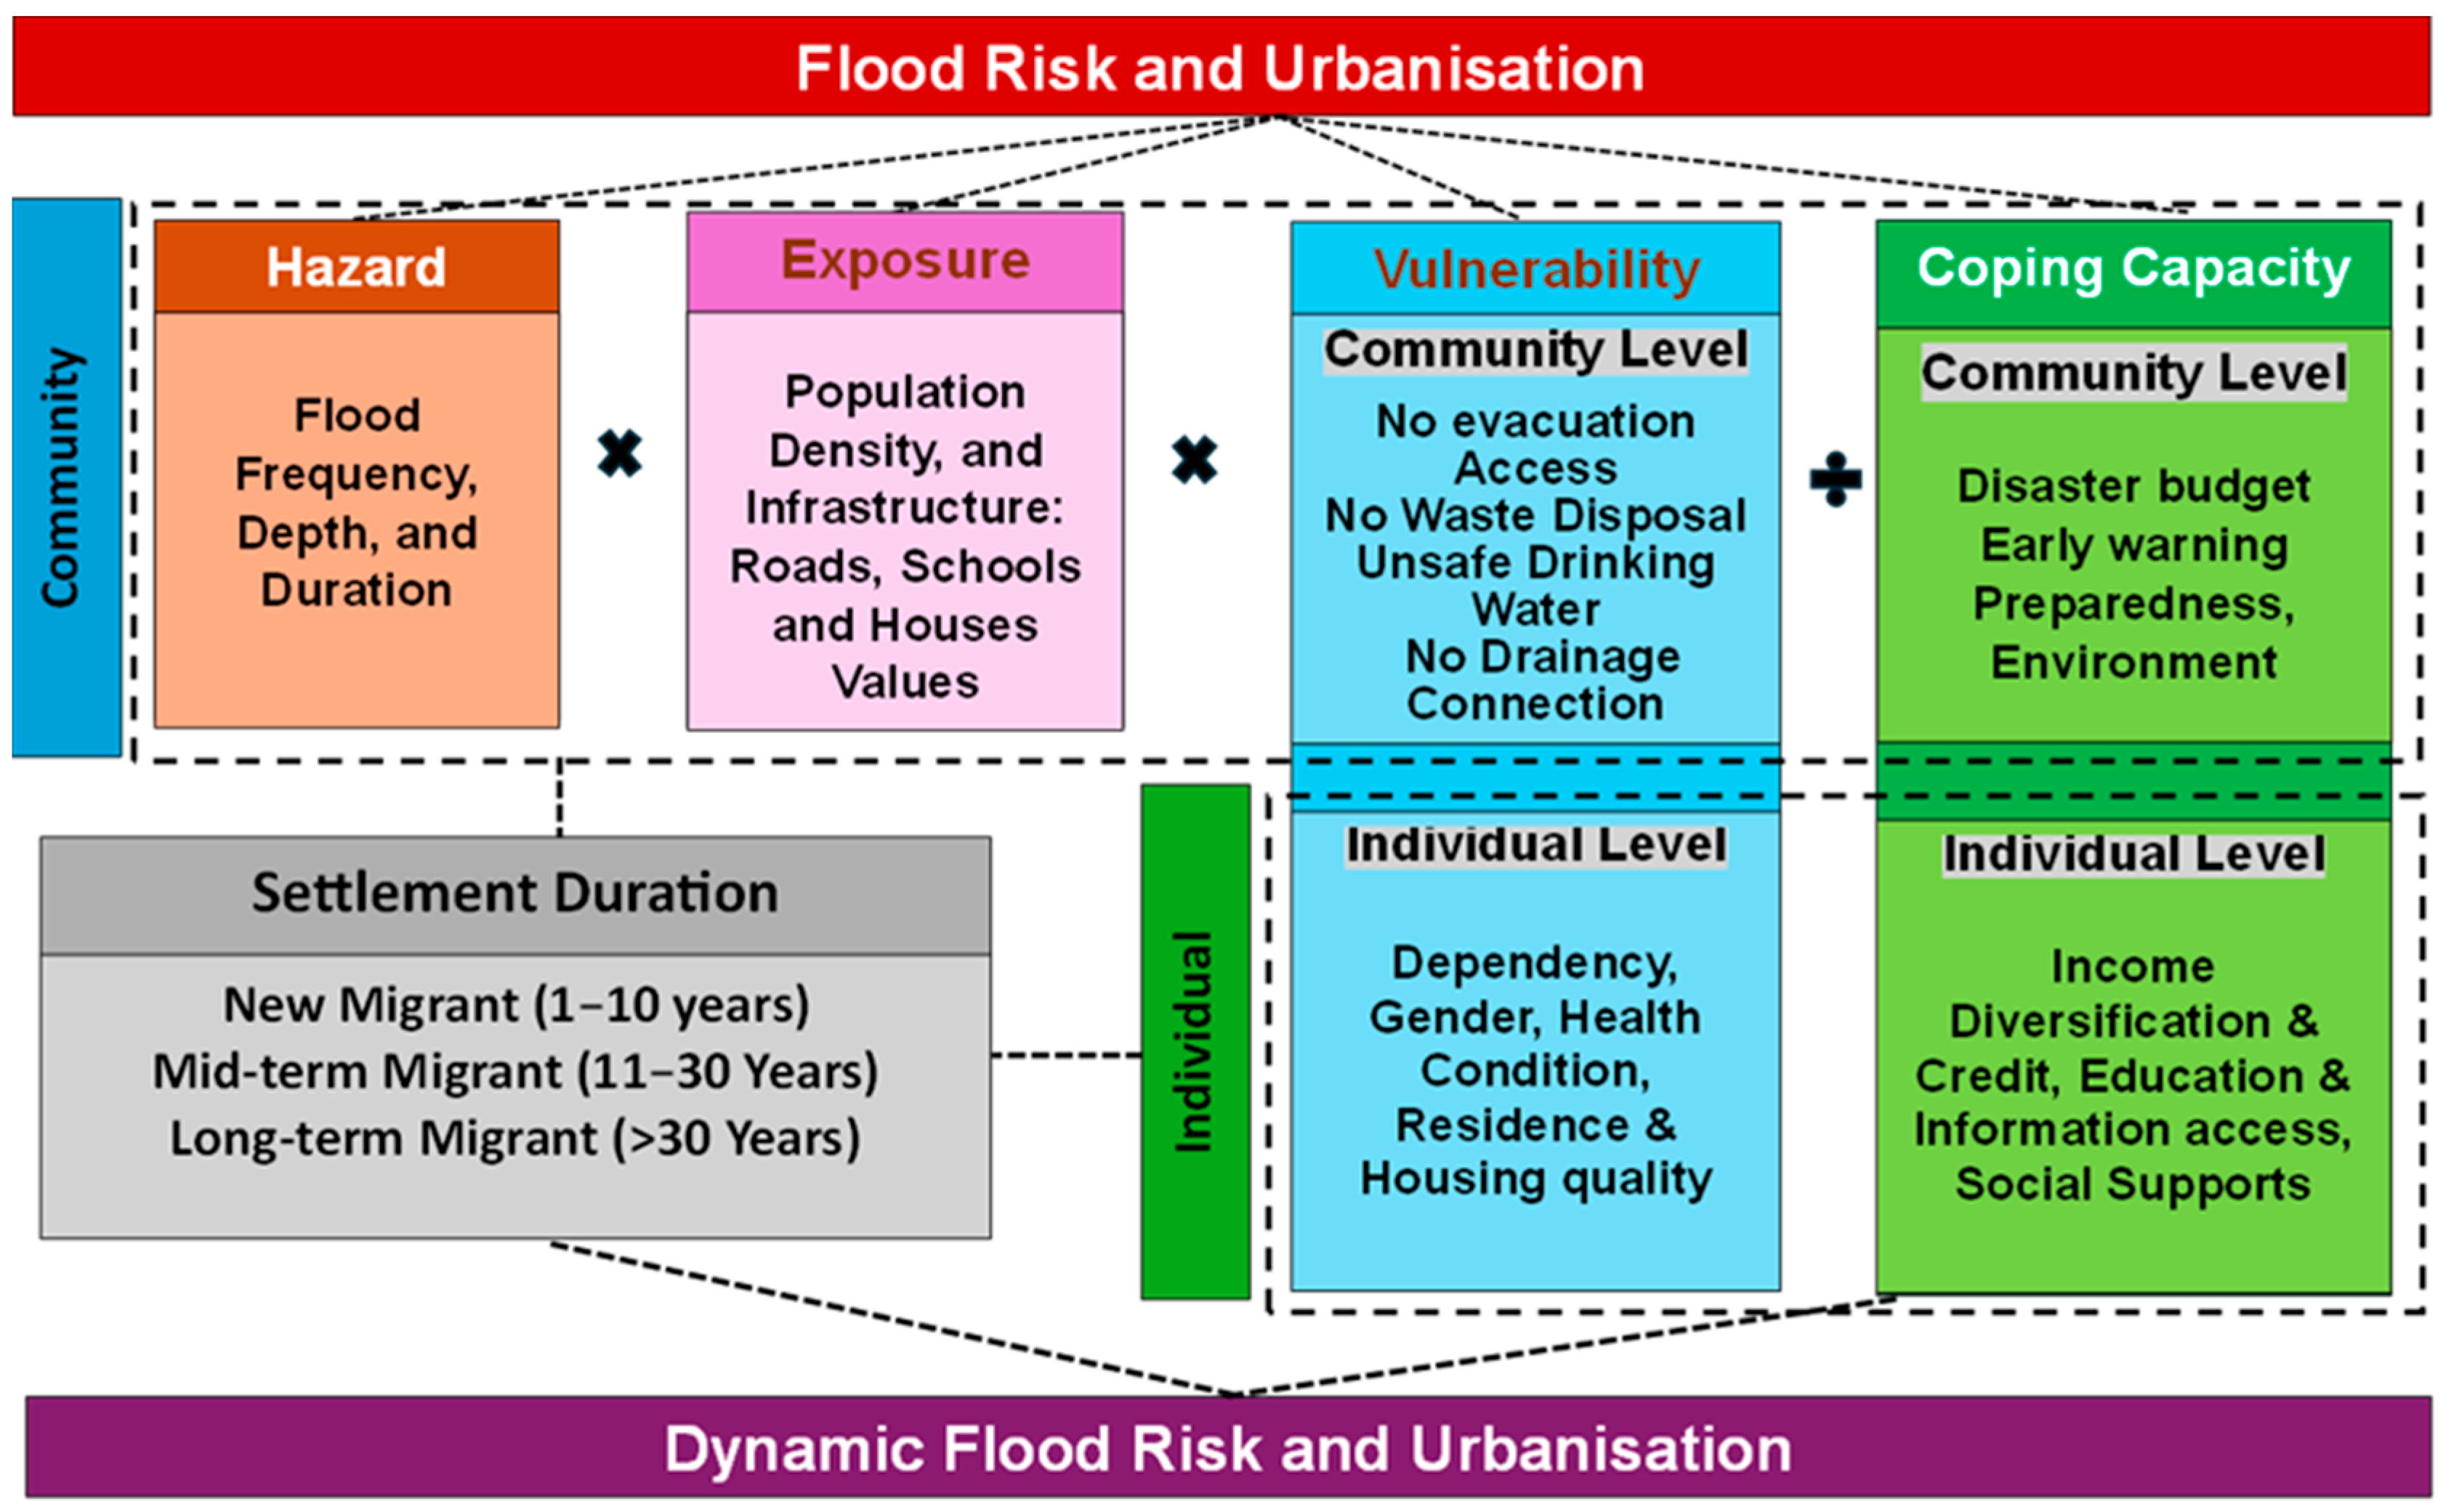
Figure 1 describes the flow of the analytical framework. The diagram examines the relationship between flood risk and urbanisation, with a focus on migration dynamics. It emphasises the interaction of the four H-E-V-C components.
Hazard includes flood characteristics such as flood frequency, depth, and duration, which represent the physical intensity of flood events at the community level. Exposure measures the extent to which people, infrastructure, and assets are at risk in flood-prone areas. It considers population density and the value of exposed infrastructure, such as roads and schools.
Vulnerability is divided into two levels: community-level (e.g., drainage systems, water access, waste management) and individual-level (e.g., health conditions, demography, housing quality). This reflects the environmental and socioeconomic factors contributing to risk.
Coping capacity also operates at two levels: community-level (e.g., disaster preparedness, institutional support) and individual-level (e.g., income, flood-prevention measures, social support). This represents the capacity to respond and adapt to floods.
The framework incorporates migration dynamics, where settlement duration influences flood risk [65]. New migrants (1–10 years) face a higher risk due to inadequate infrastructure. In contrast, mid-term (11–30 years) and long-term (>30 years) migrants benefit from improved infrastructure and greater adaptive capacity over time. This temporal aspect adds complexity to the assessment of flood risk in urban areas.
In summary, the framework integrates physical, socioeconomic, and environmental factors to assess flood risk, highlighting the influence of migration and urbanisation on flood risk components.
This study adopts a composite flood risk framework comprising four core components. These components reflect the interactions between physical flood processes and socioeconomic conditions in peri-urban Phnom Penh. Indicators were selected based on their relevance to flood risk processes, their measurability, and their reflection of local conditions, particularly in the context of rapid urbanisation and informal settlement patterns.

2.2. Study Area

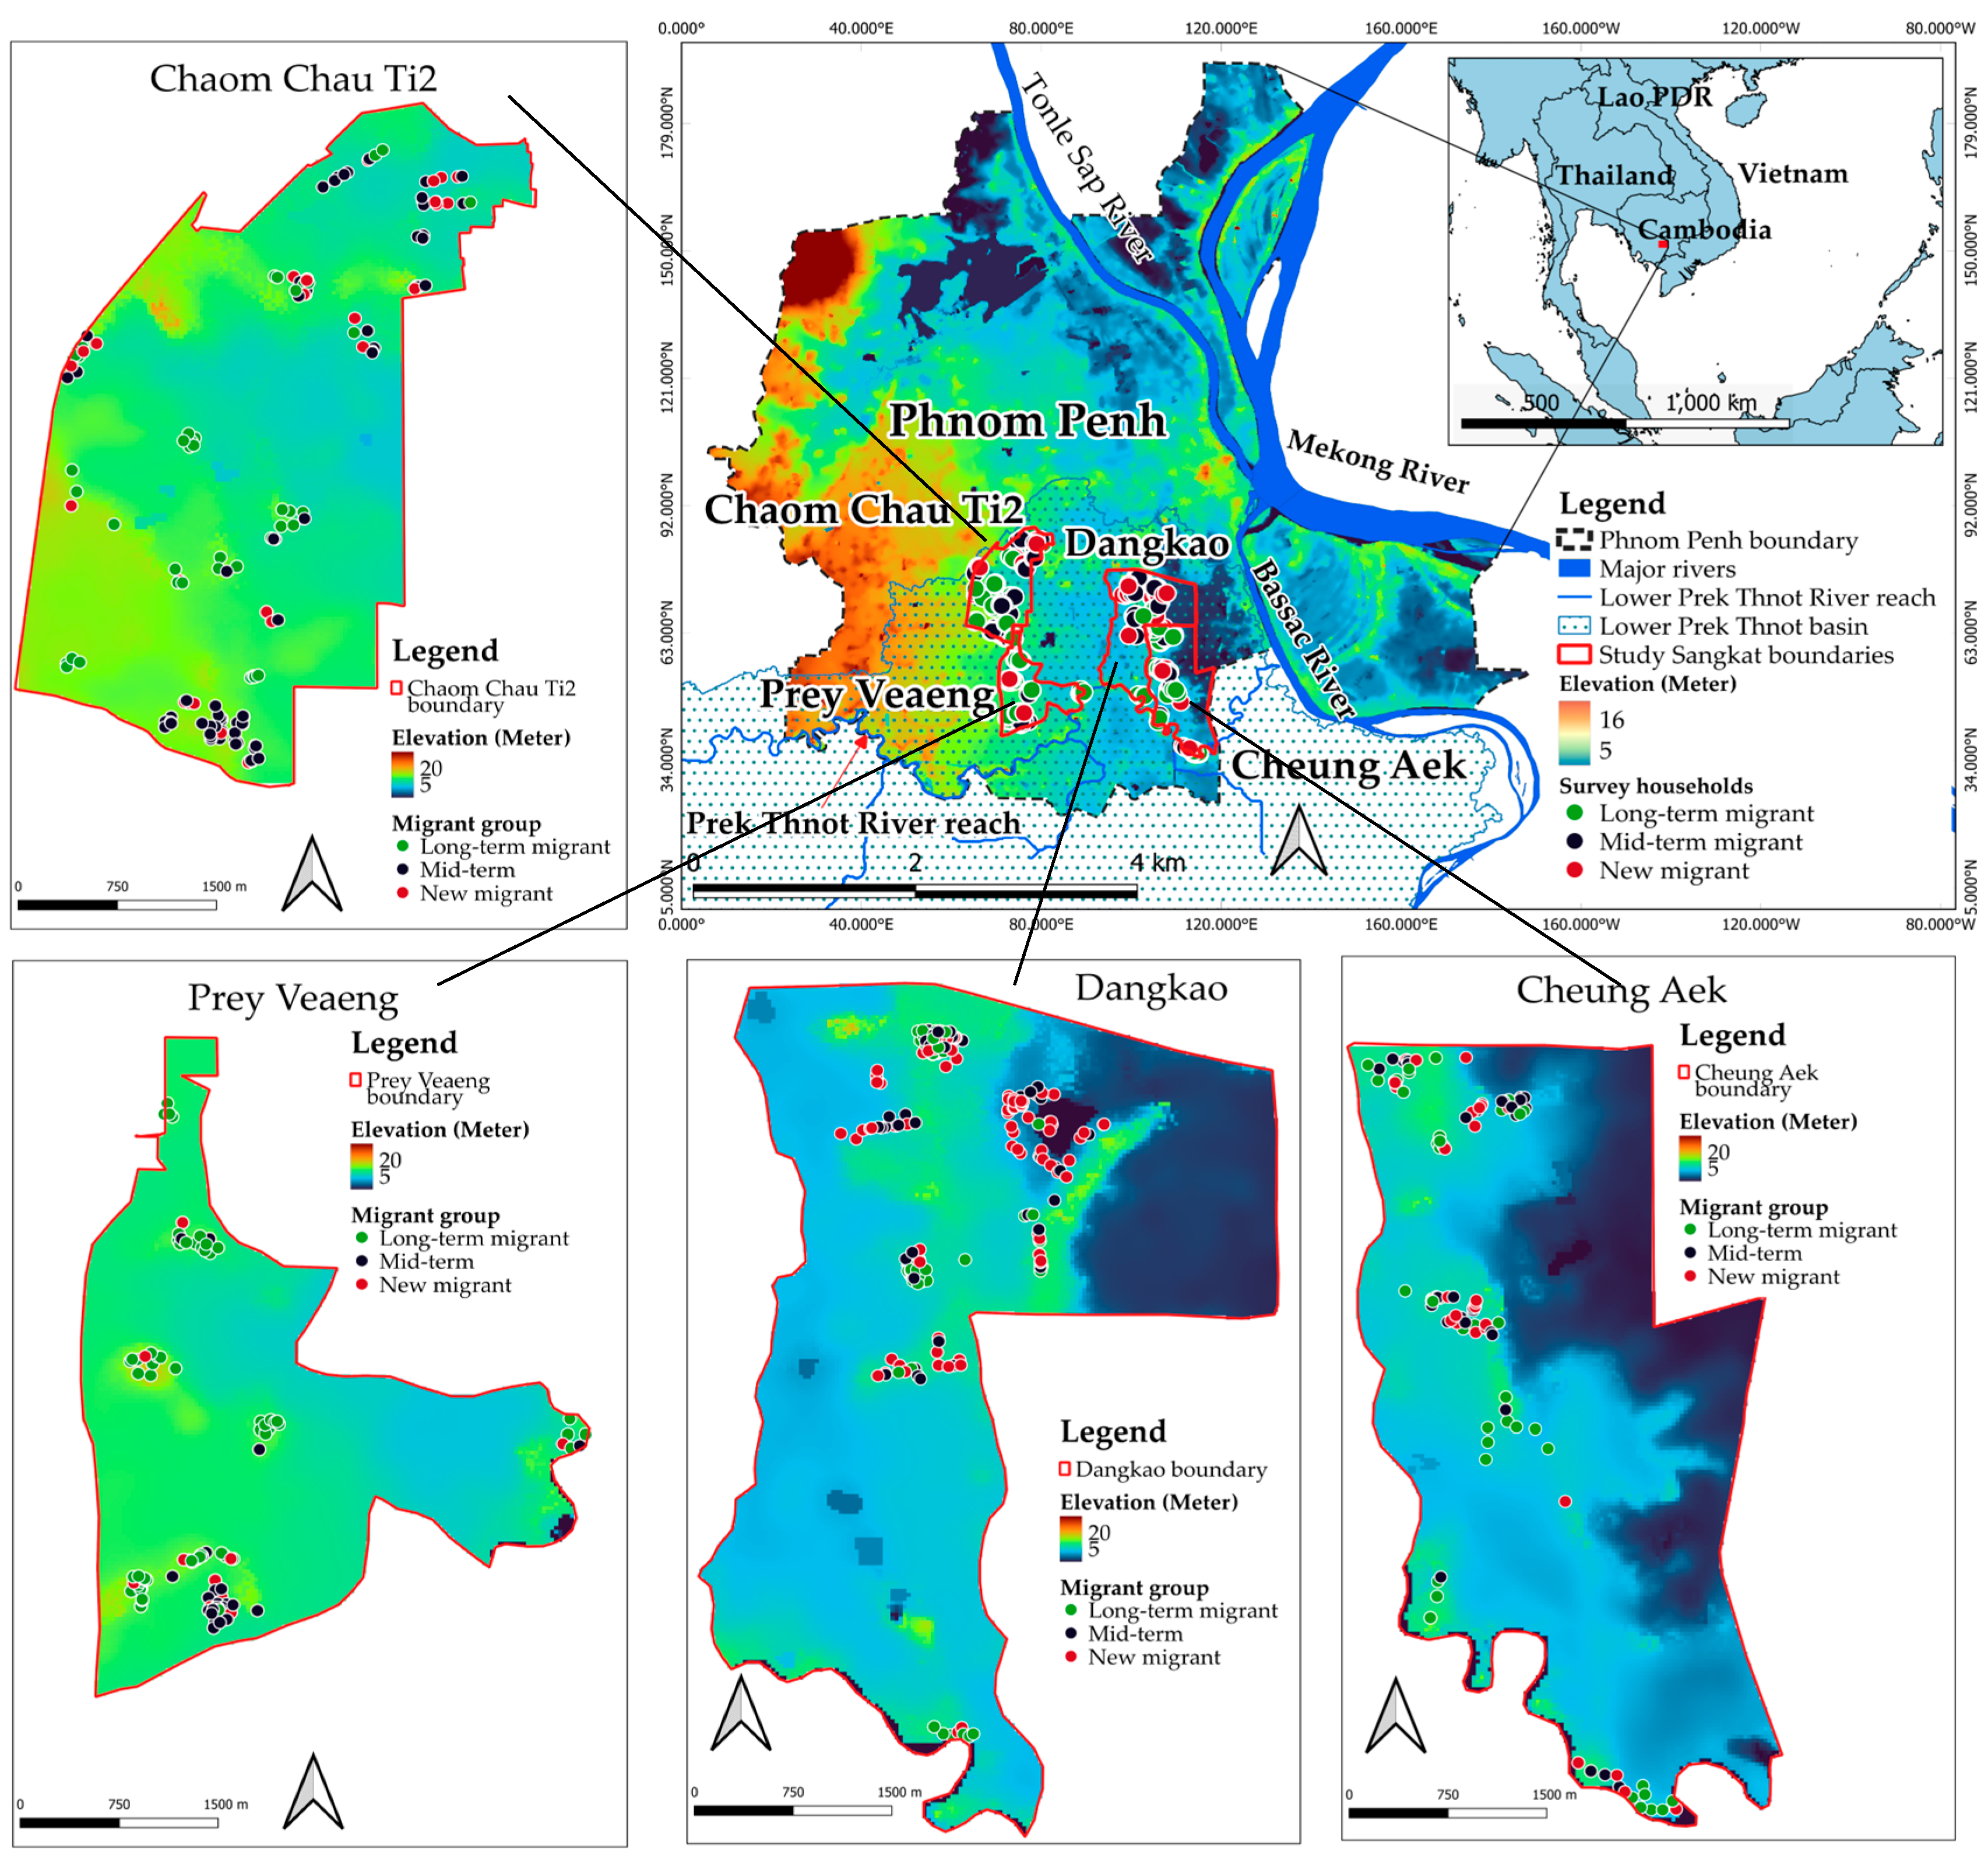
The study focused on four peri-urban Sangkats, the sub-district administrative units of Phnom Penh. The study area includes Dangkao, Chaom Chau Ti2, Cheung Aek, and Prey Veaeng. These sites were selected for differences in urbanisation, elevation, wetland retention, and drainage capacity. They represent rapid urban expansion into low-lying floodplains. Elevation ranges from 9.8 m in Dangkao and Cheung Aek to 13.7 m in Prey Veaeng. Historical wetlands and agricultural land have been converted to residential areas over the past decades (Figure 2). These changes have reduced natural water retention and drainage, increasing flood exposure.
Flooding in the four Sangkats has significantly increased over the past 34 years, with rising frequency and severity since 2020. Floods were infrequent before 2010, averaging one to two events annually. However, by 2023, flood events peaked at eight, or 22% of all cases [13]. This escalation reflects urban expansion, wetland infill, and inadequate drainage capacity. These factors have shifted flooding from occasional events to chronic, urban-induced hydrological stress.
Spatial analysis, including GIS-referenced elevation and land-use data, was used to contextualise flood exposure and vulnerability. The heterogeneity of these Sangkats provides a representative framework for assessing dynamic flood risk, following the approach of Nong et al. (2026) [13]. Table 1 summarises elevation, urbanisation, wetland retention, flood exposure, and drainage capacity across the four Sangkats. This overview supports the selection of these sites for analysing both community-level and household-level factors affecting vulnerability and coping capacity.

2.3. Data Sources and Collection

2.3.1. Household Survey

A stratified random sampling method was applied to 560 households across the four Sangkats. Households were stratified by settlement duration: new (1–10 years), mid-term (11–30 years), and long-term (>30 years). This captures temporal variations in exposure, vulnerability and adaptive capacity. Household selection followed Yamane’s formula (1973) [66] to ensure statistical representativeness.
n = N 1 + N e 2
where n is the required sample size, N is the total number of households in the study area, and e is the acceptable margin of error. Assuming a 95% confidence level and a 5% margin of error, the formula yielded a minimum required sample of 511 households. To account for potential non-response and data attrition, a 5% oversampling buffer was added, resulting in a target sample of 560 households (Table 2). The final dataset included 560 valid responses, reflecting a high response rate and strong field efficiency. Slight oversampling was justified by replacement sampling and local field conditions. Retaining these additional cases increased analytical precision and improved subgroup comparisons. For detailed household survey administration and processes, please refer to Nong et al. (2026) [13].
This study extends the previous work by constructing a composite Flood Risk Index using the Rank Order Centroid (ROC). The index integrates both community-level and household-level vulnerability and coping capacity into a single quantitative measure. This allows explicit comparison across Sangkats and settlement-duration cohorts. Nong et al. (2026) [13] relied on descriptive analysis of H-E-V-C without a composite index. The weighted index improves analytical precision and supports policy prioritisation. It also enables correlation with historical flood damage, adding empirical validation to the assessment.

2.3.2. Sangkat-Level Survey

To capture community-level structural conditions, a complementary survey was administered to 36 village heads across the four Sangkats. Village heads were selected for their formal responsibilities in infrastructure maintenance, disaster coordination, and local record-keeping, thereby positioning them as key informants on collective conditions. The Sangkat-level instrument collected data on drainage infrastructure coverage and maintenance, flood frequency and severity, solid waste management, early warning systems, emergency shelters, evacuation planning, inter-institutional coordination, and disaster management capacity. These indicators represent shared environmental and institutional factors that shape community-level vulnerability and coping capacity. By integrating household- and community-level data, the study operationalises the cross-scalar structure of the conceptual framework. Supplementary Material S1 provides the structured survey questionnaires for both Sangkat- and household-level data collection.

2.3.3. Other Sources

The Commune Database supplied demographic and infrastructural data at the commune level. Data on housing values and other exposure-related indicators were sourced from CBRE Cambodia [67,68], while information on impervious surface ratio and wetland loss was obtained from the [52]. Please refer to Supplementary Materials S2–S4 for details.

2.3.4. Equipment and Software

We used the KoBoToolbox digital platform (https://www.kobotoolbox.org) to design and conduct household and community surveys in the field. KoBoToolbox is a continuously updated web-based platform. Microsoft Excel Professional Plus 2021 was employed to organise, clean, and pre-process the raw survey and secondary data. The cleaned data were analysed using Stata (Version 18.0). Results were visualised through tables, charts, and graphs in Microsoft Excel Professional Plus 2021. QGIS (Version 3.44.6) was used to create spatial maps, including the study location, household survey locations, elevation, and river system.

2.4. Indicator Selection and Normalisation

2.4.1. Indicator Selection

Indicators were selected to operationalise the four core components of the conceptual framework. Vulnerability and coping capacity were disaggregated into community- and individual-level dimensions. Hazard indicators capture flood frequency, depth, and duration, reflecting the physical characteristics of flood events. Exposure indicators measure populations, housing, infrastructure, and public facilities located within flood-prone areas. Vulnerability indicators incorporate both structural conditions—such as drainage connectivity, environmental degradation, and service accessibility—and household socioeconomic characteristics, including income status, housing materials, and dependency ratios. Coping capacity indicators reflect community performance, disaster preparedness systems, institutional support mechanisms, and household-level adaptive behaviours (see Appendix A).
Indicator selection was guided by theoretical relevance, empirical measurability, and data availability. This approach ensures coherence between the conceptual framework and its empirical operationalisation.

2.4.2. Indicator Normalisation

Given the integration of heterogeneous data types, all indicators were normalised to a common 0–1 scale prior to aggregation. Normalisation ensures cross-variable comparability and prevents indicators with larger numeric ranges from disproportionately influencing the composite index’s construction [12,15,16,69,70,71,72,73,74,75]. The transformation methods applied to each indicator type are described below.
Ranked Categorical or Ordinal Indicators
For ordered categorical indicators representing frequency or intensity (for example, flood-training participation, early warning receipt, map accuracy, response efficiency), the normalised Weighted Average Index (WAI) was applied to transform categorical responses into values ranging from 0 to 1 while preserving ordinal relationships [75]. The WAI is calculated as:
X i =   j = 1 k w j ·   n j N
where Xi is the normalised index for the indicator, k is the number of categories, wj is the normalised weight assigned to category j (evenly scaled from 0 for the lowest category to 1 for the highest), nj is the number of respondents in category j, and N is the total number of respondents. For indicators with different numbers of categories (e.g., 3, 4, 5, or 6 categories), the weights are determined as:
w j = j 1 k 1  
This approach allows direct comparability across indicators with different scales while accounting for response distributions. For example, for a six-category flood frequency indicator, a neighbourhood with 1, 2, 3, 4, 2, and 1 respondents across the six categories, respectively, would have a WAI of 0.508. Similarly, a three-category early warning reception indicator (No, Sometimes, Yes) would use weights of 0, 0.5, and 1 to compute the normalised index. This method was consistently applied to all ordinal indicators in the dataset, including training frequency, early warning availability, hazard map quality, household income, and flood preparedness perception, ensuring that higher values consistently reflect greater intensity, frequency, or positive perception depending on the indicator context.
Continuous Indicators (Ratio/Percentage)
For ratio- or percentage-based indicators (for example, exposed population, impervious surface ratio, poverty rate), min–max scaling was applied to preserve relative magnitudes across observations [69]. For indicator X i , the normalised value X i is calculated as:
X i =   X i X m i n X m a x X m i n
where X m i n and X m a x represent the minimum and maximum observed values across all units. This transformation rescales the variable to the [0, 1] interval while preserving proportional differences.
Continuous Indicators (Distance/Value)
For continuous indicators measured as distances or monetary values (for example, distance to hospital/health centre/clinic, housing value), the same min–max normalisation in Equation (6) was applied. This ensures comparability across heterogeneous measurement units while preserving distributional structure.
Binary Indicators (Yes/No)
Binary indicators representing presence or absence (for example, health care access, disaster group membership) were coded dichotomously [72]:
X i =   1   if   condition   is   present 0   if   condition   is   absent
This coding directly reflects access or functional availability without further transformation.
Across all transformations, higher normalised values consistently represent greater hazard, exposure, or vulnerability, depending on the component. Directional consistency was verified prior to aggregation to ensure interpretative coherence within the composite flood risk index.
Inverse Normalisation of Coping Capacity
Coping capacity is treated as a variable that inversely influences flood risk: higher coping capacity corresponds to lower vulnerability and risk. To reflect this relationship, an inverse min–max normalisation was applied.
Unlike Equation (6), where higher values correspond to higher contributions, the inverse transformation reverses this direction for continuous indicators [16,69]. Specifically, for community-level ( C c o m ) and individual-level ( C i n d ) coping capacity:
X i =   X m a x X i X m a x X m i n
where X i is the raw value of the coping capacity, X m a x and X m i n are the maximum and minimum observed values for the indicator. This transformation ensures that higher original coping capacity values yield lower normalised values, while lower coping capacity yields higher normalised values (i.e., higher risk contribution). As a result, all indicators are aligned in the same direction, with higher values indicating greater flood risk.
The lack of coping capacity is then aggregated along with vulnerability to construct the final flood risk index [16].
All component scores were computed as the arithmetic mean of their respective sub-indicators:
A =   i = 1 n X i n
where A represents the composite score of a given component, X i denotes the normalised value of the i-th sub-indicator, and n is the total number of sub-indicators included in that component. For indicators derived from survey responses, the mean was calculated across all respondents to obtain the index value.

2.5. Weighting Method: Rank-Based Rank Order Centroid (ROC)

This study applies a rank-based weighting approach using the Rank Order Centroid (ROC) method, informed by expert judgement. The Analytic Hierarchy Process (AHP) is a structured multi-criteria decision-making method that derives indicator weights through pairwise comparisons [76]. The ROC simplifies this by using expert rankings, improving consistency and reducing the time required from experts.
The ROC approach was selected because it reduces cognitive burden compared to conventional AHP while maintaining theoretical prioritisation. It is particularly suitable for studies with multiple indicators and limited expert availability.
The conventional AHP method requires pairwise comparisons and consistency checks [77]. These steps can be demanding when the number of indicators is large. They may also introduce inconsistency in expert judgments. Rank-based approaches provide a practical alternative. They require only ordinal ranking while preserving priority structure. Previous studies show that ROC weights closely approximate AHP-derived weights with limited loss of accuracy [78,79].
Rank-based weighting methods, like the Rank Order Centroid (ROC), are increasingly used in flood risk and multi-criteria decision analysis (MCDA). These methods offer simplified, robust alternatives to AHP [77,78]. Integrated into hierarchical risk frameworks, such as the Hazard–Exposure–Vulnerability framework, ROC calculates weights at multiple levels. This ensures internal normalisation and preserves theoretical prioritisation [25,80].
The weighting procedure was implemented within the hierarchical structure of Hazard–Exposure-Vulnerability-Coping Capacity (H-E-V-C). Weights were calculated separately within each component and then normalised. This approach ensures internal consistency and aligns with standard practices in spatial multi-criteria decision analysis [25,80].
In this analysis, expert opinions informed the ROC. Thirteen experts were selected for their expertise in urban flood risk, climate resilience, hydrology, and social vulnerability (Table 3). We asked experts to prioritise key components of flood risk. Their rankings served as the basis for the ROC analysis, with some variation, particularly between vulnerability and coping capacity. However, the overall alignment ensured the robustness of the final assessment.
They represented universities (n = 9), a government agency (n = 1), a non-governmental organisation (NGO) (n = 1), a research institute (n = 1), and the private sector (n = 1). This diverse composition ensured that both technical knowledge and context-specific insights informed the weighting of flood risk indicators in peri-urban Phnom Penh.
The ROC method assigns relative importance to each indicator based on expert judgement. This contrasts with the Equal Weight approach, which treats all indicators equally. Applying ROC assigned higher weights to flood depth and exposed population, reflecting their stronger influence on flood risk, while spatial patterns remained consistent.
Indicator weights were derived using a rank-based ROC. Unlike conventional AHP, which requires n ( n 1 ) 2 pairwise comparisons and consistency testing [77,81]. The ROC relies on expert ranking, thereby reducing cognitive burden and minimising bias from inconsistent ratings.

2.5.1. ROC Weight Calculation

For a component containing n indicators ranked from most important (j = 1) to least important (j = n), weights were computed using the ROC formula [78,79]:
w j =   1 n   i = 0 n 1 k
where w i = weight of indicator ranked j. n = total number of indicators within the component.
By definition: j = 1 n w j = 1 , ensuring internal normalisation within each risk component.

2.5.2. Assessment of Expert Agreement and Robustness

Expert agreement was evaluated using the coefficient of variation (CV). CV values ≤0.40 indicate less variability, while values >0.40 reflect more variability. For high-CV indicators, Winsorization replaced the highest and lowest ranks with the second-highest and second-lowest values [73,82]. This slightly reduced CV values without substantially changing ROC weights. Sensitivity analyses using Winsorization confirm that the weights reliably reflect expert consensus while minimising the influence of outliers.
To reduce the influence of highly variable indicators, the initial indicator weights were adjusted using a Winsorization-based approach informed by the coefficient of variation (CV). Indicators with a CV greater than 0.6 were considered to exhibit high variability and were therefore down-weighted to limit potential dominance in the composite index. Specifically, the original weight Wi was adjusted by multiplying it by the ratio 0.6/CVi, thereby capping the variability effect at 0.6. Indicators with CV values <0.6 retained their original weights.
A CV-based adjustment was then applied to limit the influence of highly uncertain indicators. For indicators with CVi >0.6, weights were adjusted as:
w i * =   w i × 0.6 C V i
Indicators with CVi ≤0.6 retained their original weights. All weights were subsequently normalised within each component. This step ensures comparability and preserves the relative importance structure.
After adjustment, all weights within each component were re-normalised so that their sum equalled one. This procedure improves the robustness of the composite index by preventing indicators with extreme dispersion from disproportionately influencing the overall risk assessment (see Supplementary Material S5: Adjusted WI after Winsorization).

2.5.3. Methodological Considerations

The rank-based ROC approach offers several advantages. It reduces the complexity of eliciting expert judgments. It avoids inconsistency issues associated with pairwise comparisons. It also improves transparency and reproducibility.
However, the method relies on ordinal information. It may not fully capture non-linear differences in expert preferences. To address this limitation, sensitivity analysis was conducted by comparing ROC-derived weights with equal-weight scenarios. The results showed limited variation, indicating that the model is robust to the choice of weighting method.

2.6. Composite Flood Risk Index Construction

Indicators that reduce risk, such as coping capacity, must be normalised so that higher values consistently indicate higher flood risk. Some studies use inverse trans-formations for example 1/C, but these can produce extreme values and instability [69]. In this study, all indicators were normalised to the range [0, 1]. Coping capacity was transformed into a lack of coping capacity using a bounded linear function [15,16]:
C = ( 1 C )
This ensures that all components remain finite and interpretable. Normalised indicators were aggregated into sub-indices using weighted linear aggregation. Vulnerability and coping capacity were computed separately at the community and individual levels.
The overall flood risk index was defined as:
F R = H   × E   × V × C
F R = H × E × V c o m + V i n d   × ( C c o m + C i n d )  
where H, E, V, and C′ denote hazard, exposure, vulnerability, and lack of coping capacity, respectively.
Vulnerability and lack of coping capacity were decomposed as weighted aggregates of community and individual components:
V =   α V c o m + ( 1 α ) V i n d
C = α C c o m + ( 1 α ) C i n d
where α represents the relative contribution of community-level conditions.
The multiplicative structure was selected to capture interactions among risk components and to reduce full compensability. In additive models, a low value in one dimension can be offset by a high value in another. This assumption is often unrealistic in flood risk contexts. For example, high coping capacity cannot fully offset extreme hazard exposure. Multiplicative aggregation limits such compensation and reflects the reinforcing nature of risk processes [83,84].
At the same time, linear aggregation within sub-indices allows partial substitution among indicators operating at the same scale. This is appropriate when indicators represent related dimensions of a broader construct, such as socioeconomic vulnerability [74]. The general aggregation structure can be expressed as:
F R =   i = 1 n k ( W i k X i k )
where Wik denotes indicator-level weights and Xik represents normalised indicator values.
This hybrid formulation balances methodological robustness and interpretability. It aligns with established practices in composite indicator construction and flood risk assessment, where multiplicative models are commonly used to represent the joint effect of hazard, exposure, and vulnerability [85,86].
The construction of the composite index and the subsequent classification are closely interrelated. The multiplicative aggregation framework preserves the relative differences and interactions among hazard, exposure, vulnerability, and lack of coping capacity. This ensures that the resulting index retains meaningful variation across spatial units. The use of a distribution-independent classification method further supports comparability by avoiding distortions introduced by data-driven thresholds. Together, these steps enhance the robustness, interpretability, and policy relevance of the flood risk assessment.

2.7. Risk Classification and Ranking

Flood risk index values were classified into three categories (low, medium, and high) using the equal-interval classification method. This approach divides the full range of index values into equal-width intervals. It was selected to ensure consistency, transparency, and comparability across spatial units and population groups.
Equal-interval classification is particularly suitable when the objective is to preserve the absolute magnitude of differences in index values. Unlike data-driven methods such as quantiles or natural breaks, it does not depend on the distribution of observations. This reduces sensitivity to sample-specific characteristics and facilitates comparison across different datasets or time periods [87].
The use of three classes reflects a balance between interpretability and analytical clarity. A limited number of categories supports clear communication of results to policymakers while avoiding excessive generalisation.
To assess the robustness of the classification scheme, sensitivity checks were conducted by comparing results with alternative classification methods, including quantile-based grouping. Rankings of Sangkat-level units and migrant groups were examined across schemes to evaluate the stability of spatial and social patterns. Consistent ranking patterns indicate that the results are not driven by classification choice but reflect underlying risk structures.
This validation step is important, as classification methods can influence the visual and analytical interpretation of composite indices. Testing alternative schemes helps ensure that conclusions remain robust and are not artefacts of methodological decisions [74].

2.8. Sensitivity Analysis

A sensitivity analysis was conducted to assess the robustness of the composite flood risk index to weighting assumptions (Supplementary Material S6). Two baseline weighting schemes were compared: equal weighting and ROC-derived weights based on expert ranking. Local sensitivity was evaluated by perturbing ROC weights by ±10%, ±15%, and ±20% while maintaining the normalisation constraint. This approach tests how deviations in expert judgement influence index values and rankings, as recommended in composite indicator construction [74].
Index values and rank positions were recalculated for each perturbation scenario. Overall, mean absolute differences (MAD) remained small (0.001–0.008), and Spearman correlation coefficients were high (ρ = 0.944), indicating that the index is robust to moderate changes in weights.

2.8.1. Impact of Weighting Scheme on Risk Scores

Comparing equal-weight and ROC-based schemes showed minor variations in risk scores. For example, the 1–10 years migrant group changed from 0.026 (equal weight) to 0.024 (ROC), and the 11–30 years group from 0.014 to 0.013. Perturbation of ROC weights by ±10% produced only marginal changes in risk scores, confirming that overall risk patterns and group rankings remain stable.

2.8.2. Ranking Consistency and Robustness

Ranking stability was assessed using Spearman’s rank correlation coefficient (ρ). Major risk categories, particularly the highest- and lowest-risk groups, remained stable under all perturbation scenarios, with correlation coefficients exceeding 0.9. Minor shifts were observed among intermediate-risk groups, reflecting sensitivity in borderline cases. At the Sangkat level, similar patterns were found. These results demonstrate that the composite flood risk index reliably captures broad patterns while transparently representing uncertainty in intermediate groups.

2.8.3. Implications for Model Robustness

The combined results demonstrate that the composite index is robust to both alternative weighting schemes and moderate uncertainty in weight specification. The consistency of risk scores and rankings indicates that the model structure, rather than specific parameter choices, drives the observed patterns.
Such robustness is essential for policy-relevant applications, as it increases confidence that the identification of high-risk groups and areas is not an artefact of subjective weighting decisions [74].

2.9. Validation Using Historical Damage Records

To evaluate the reliability of the composite flood risk index, validation was conducted using historical flood damage data (2012–2024) from unpublished administrative records compiled by the Sangkat Database and Sangkat Council Offices [88].
The analysis compares modelled risk values with observed impacts at the Sangkat level. Infrastructure damage, measured as total flooded road length, was used as a proxy for observed flood impact.
Spearman’s rank correlation coefficient (p) was applied to assess the relationship between modelled flood risk and observed damage. This non-parametric method was selected due to the small sample size and the ordinal nature of the comparative analysis.

3. Results

3.1. Spatial Flood Risk Components: Hazard, Exposure, Vulnerability, and Coping Capacity (H-E-V-C) by Sangkat

3.1.1. Hazard

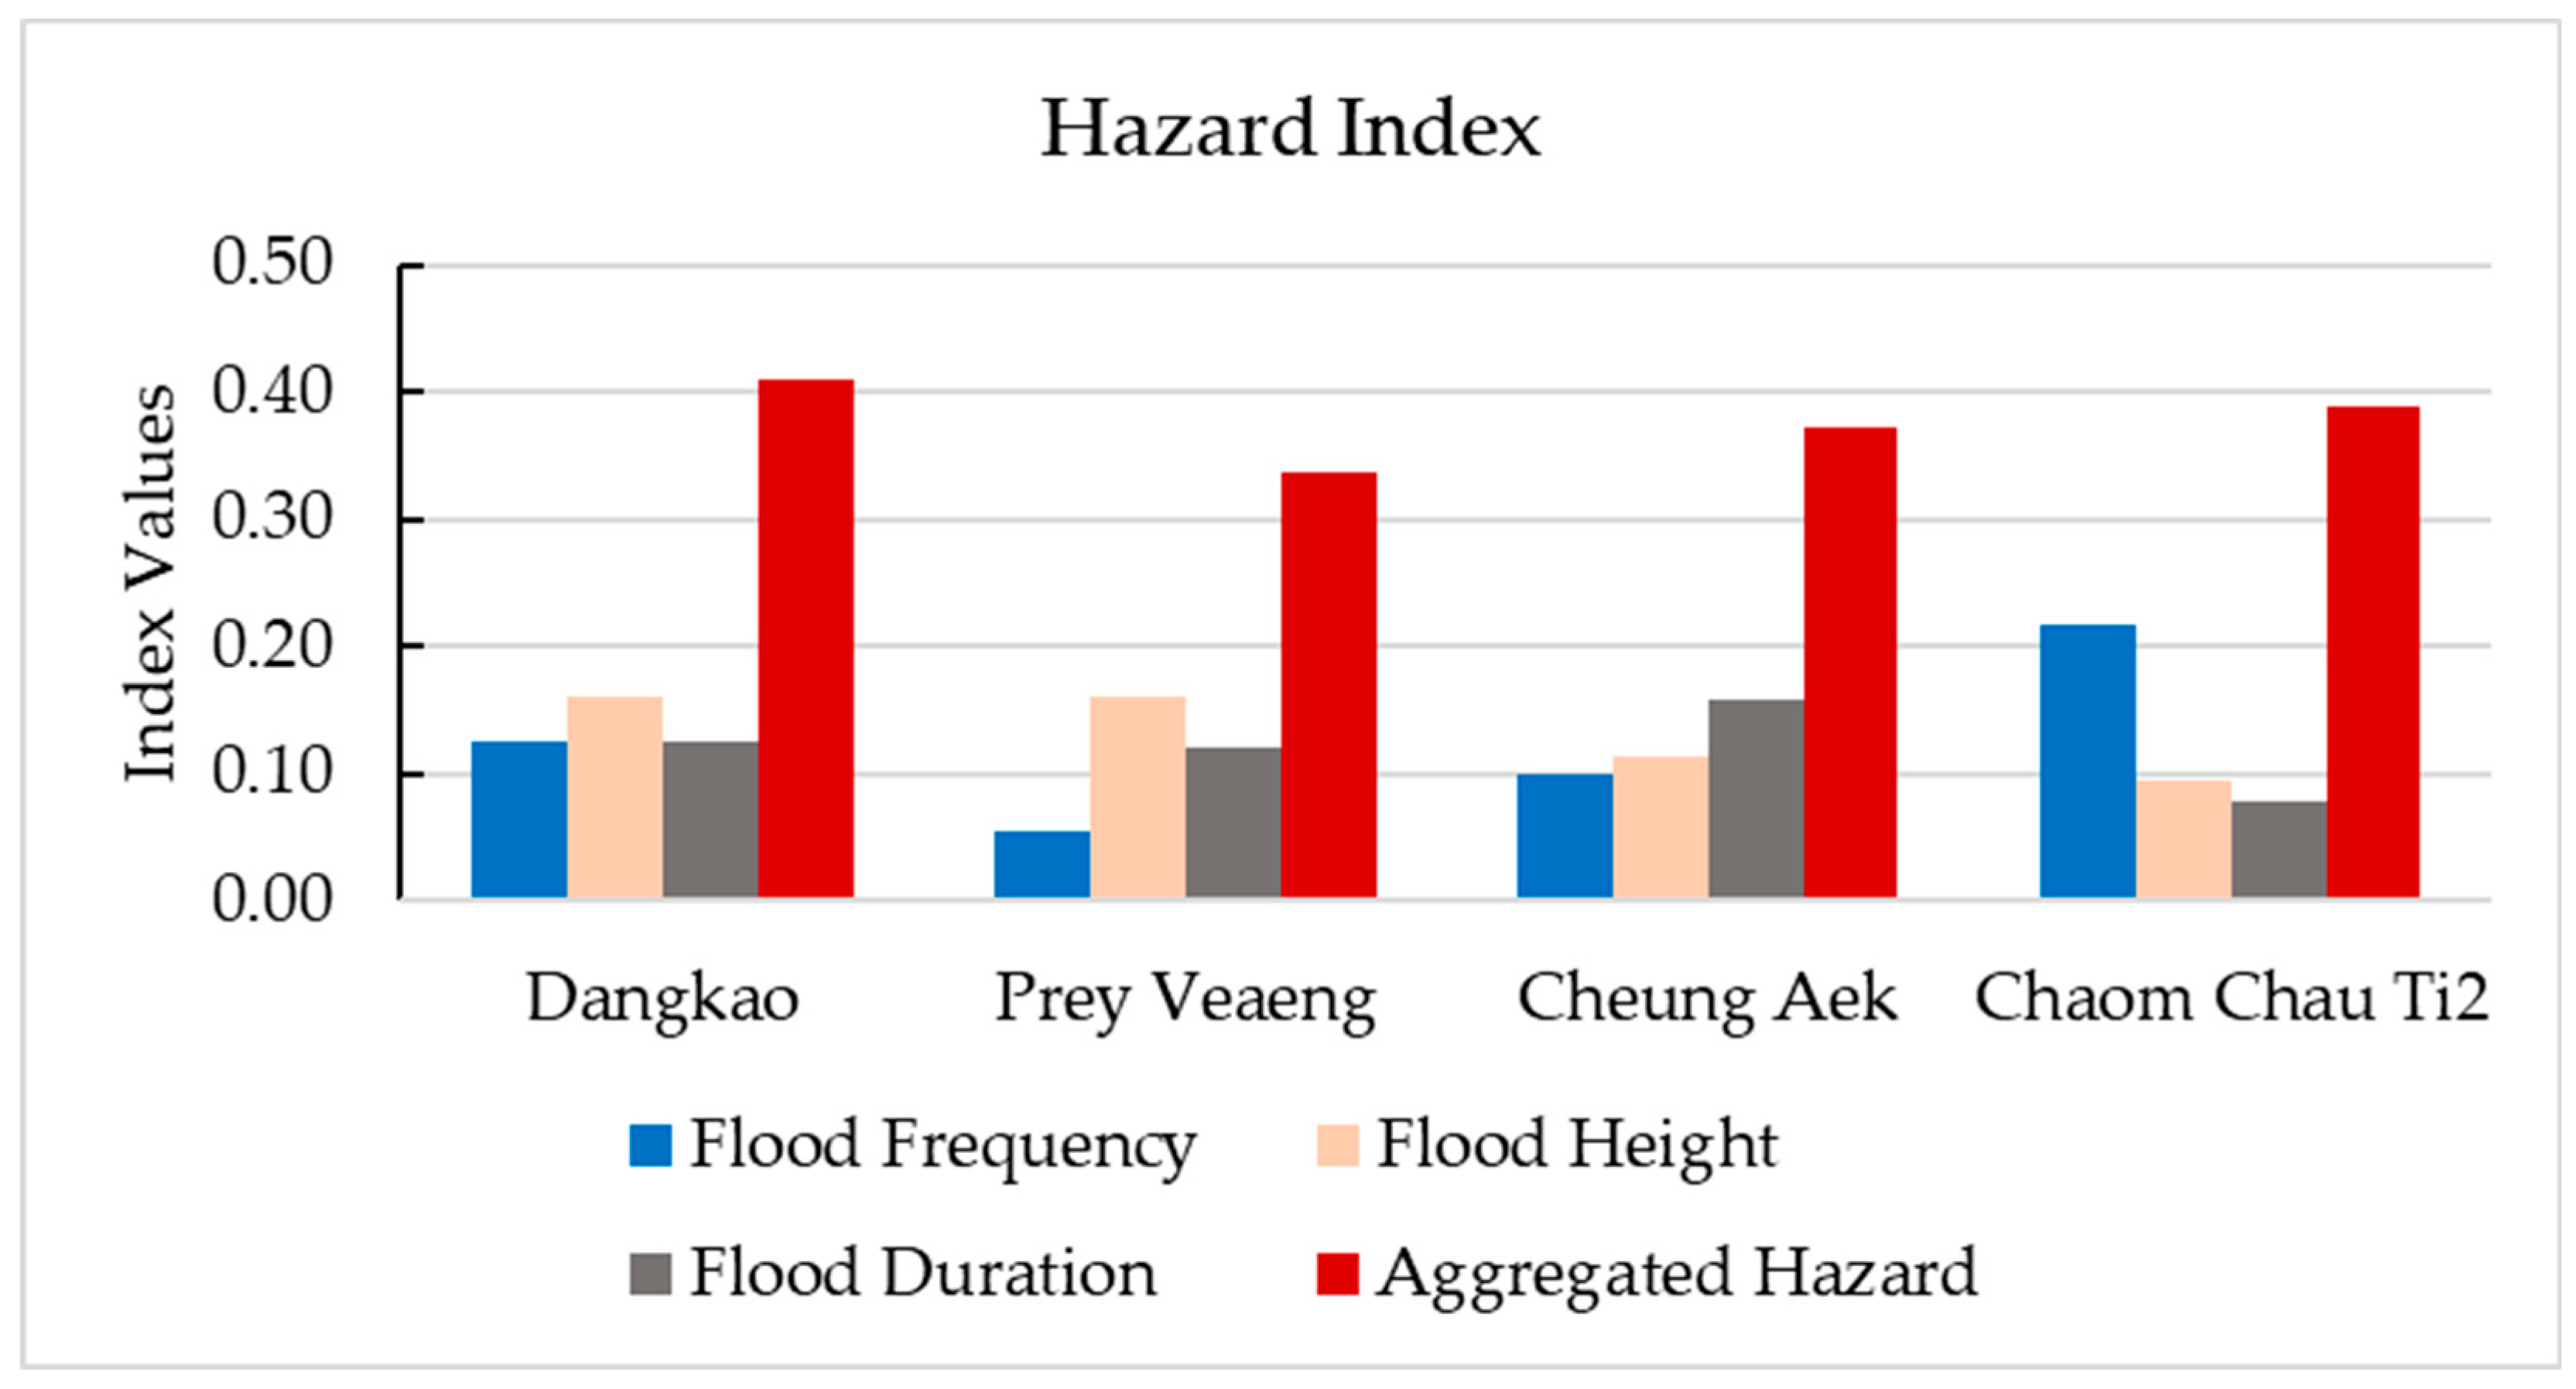
The hazard component comprises flood frequency, depth, and duration, evaluated using the Equal Weight and the ROC methods. Under ROC, flood depth receives the highest weight (0.404), followed by flood frequency (0.314) and duration (0.283). This prioritisation indicates that flood depth is the most influential hazard characteristic because of its direct impact on physical damage.
Indicator contributions vary across Sangkats but remain broadly consistent between weighting methods. Flood frequency shows the largest variation, ranging from low levels in Prey Veaeng to higher values in Chaom Chau Ti2 (0.058–0.230). As shown in Figure 3, under ROC, the contribution of flood height increases, particularly in Dangkao and Prey Veaeng (0.161), while the influence of duration declines slightly. Supplementary Material S7 provides details of the Equal Weight and ROC-derived weights by component and Sangkat.
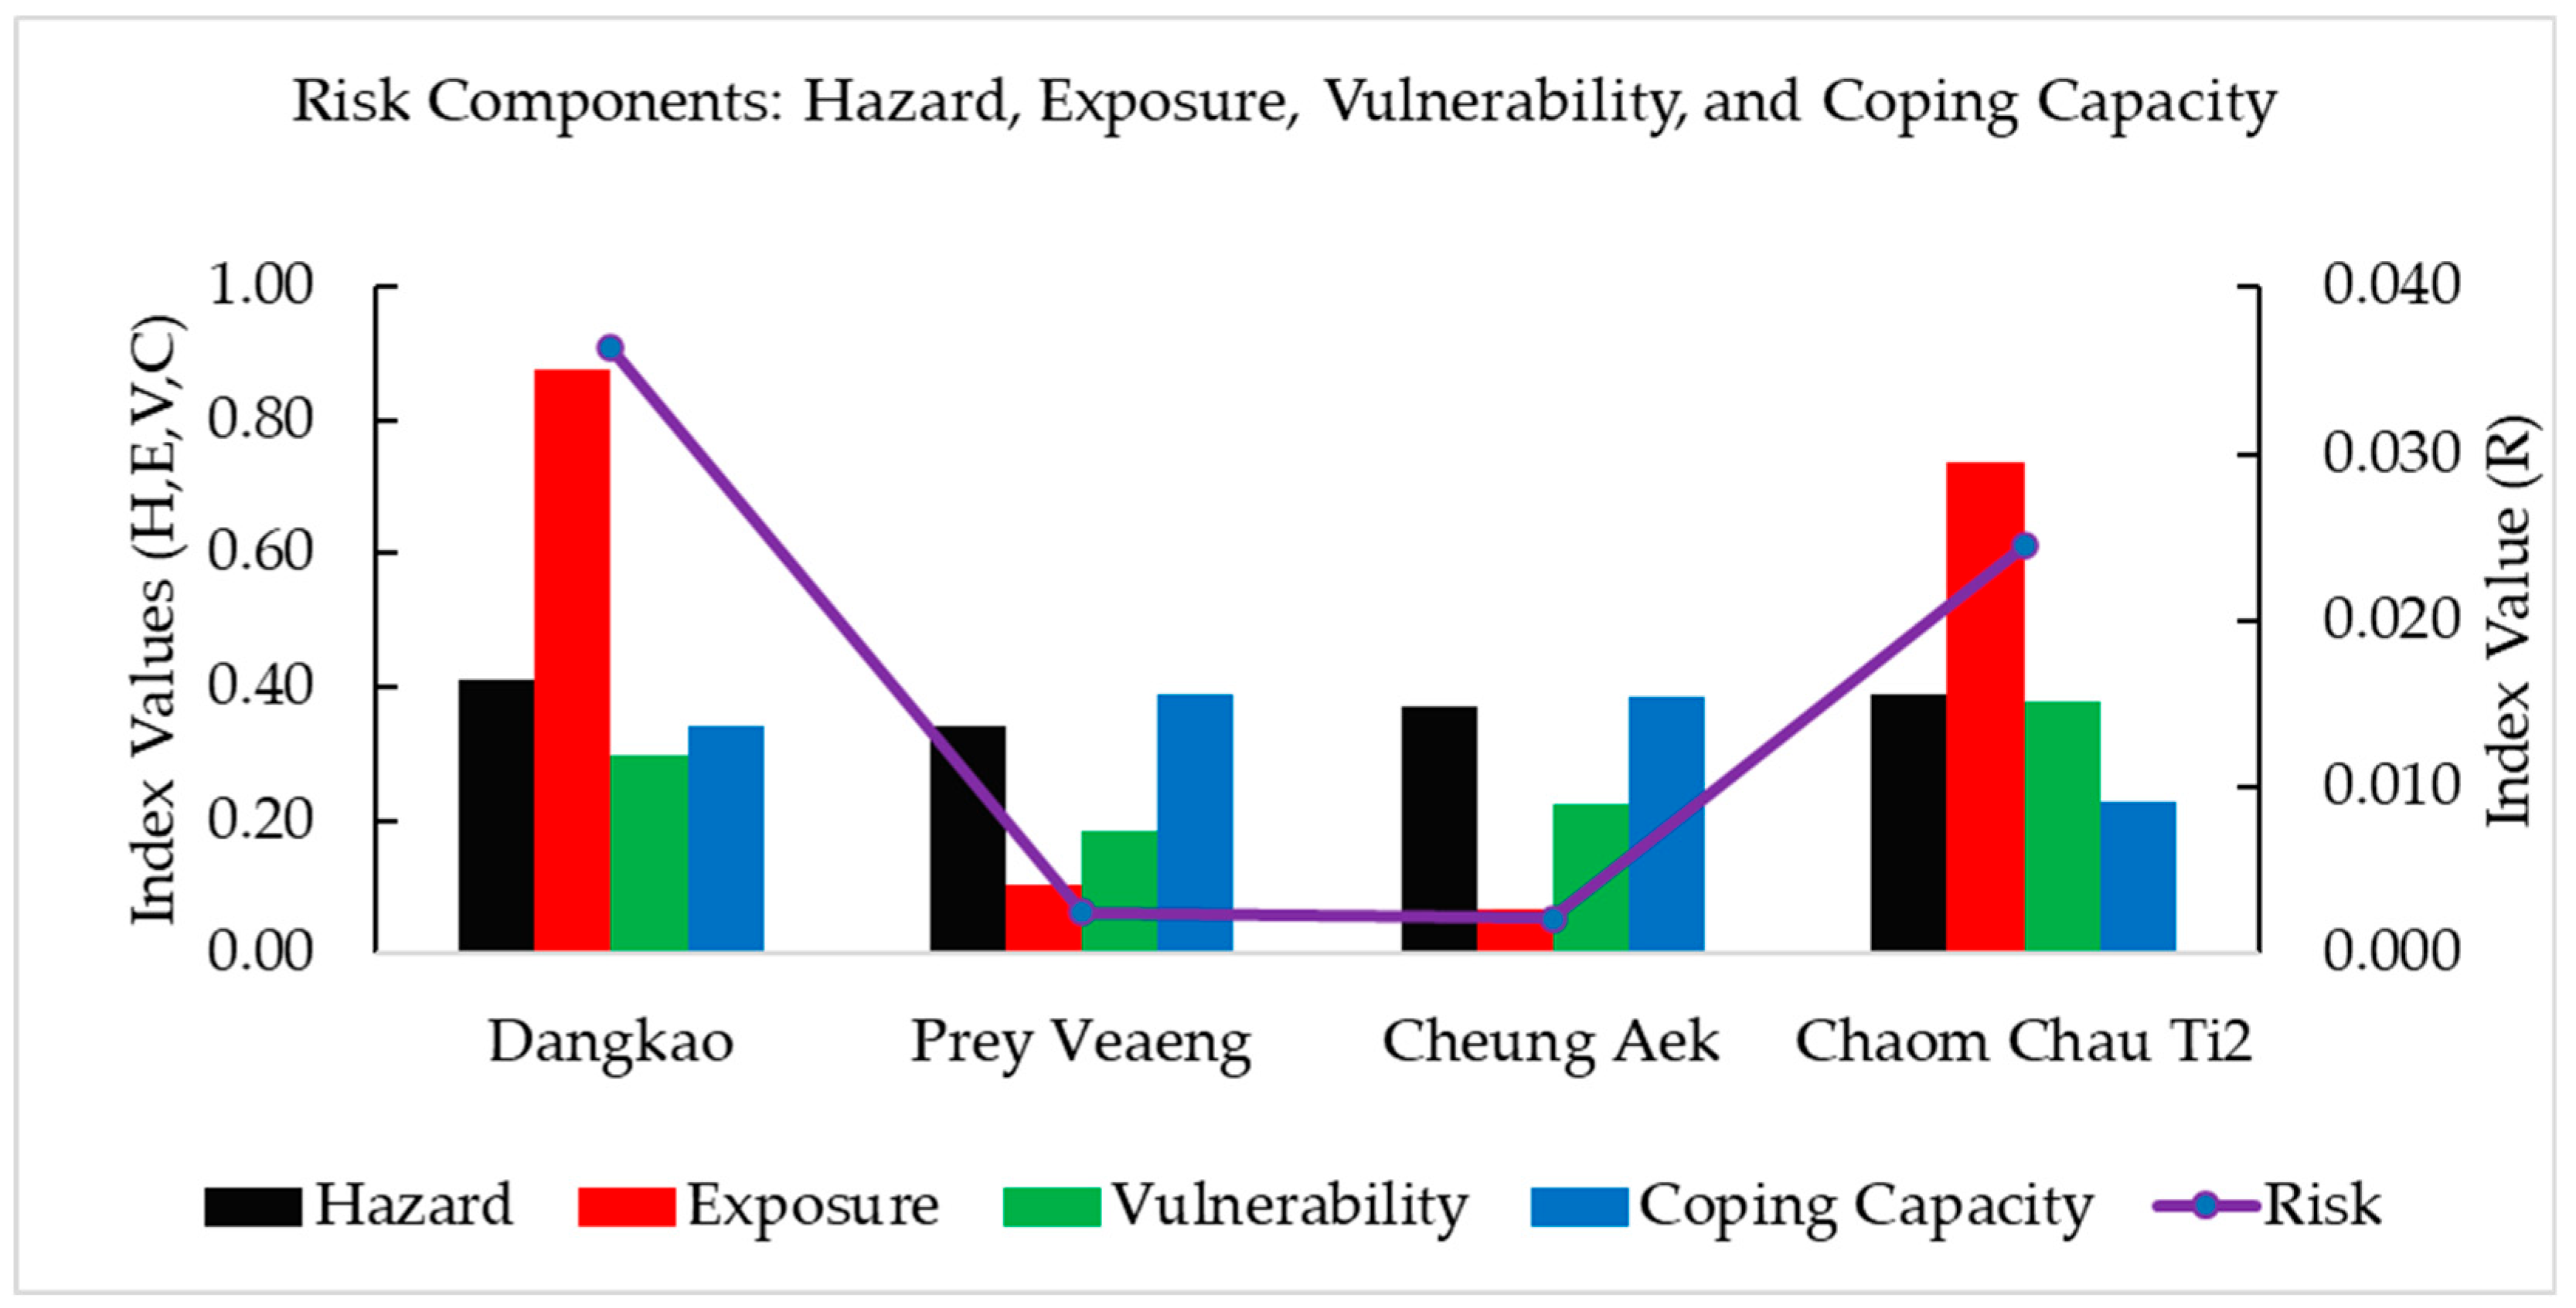
Aggregate hazard scores exhibit similar spatial patterns under both approaches. Dangkao and Chaom Chau Ti2 record slightly higher hazard levels, while Prey Veaeng shows the lowest values (0.413 and 0.400 versus 0.333 under Equal Weight; 0.411 and 0.389 versus 0.336 under ROC, respectively).
Hazard varies only moderately across Sangkats. This indicates that hazard intensity alone does not explain spatial differences in flood risk.

3.1.2. Exposure

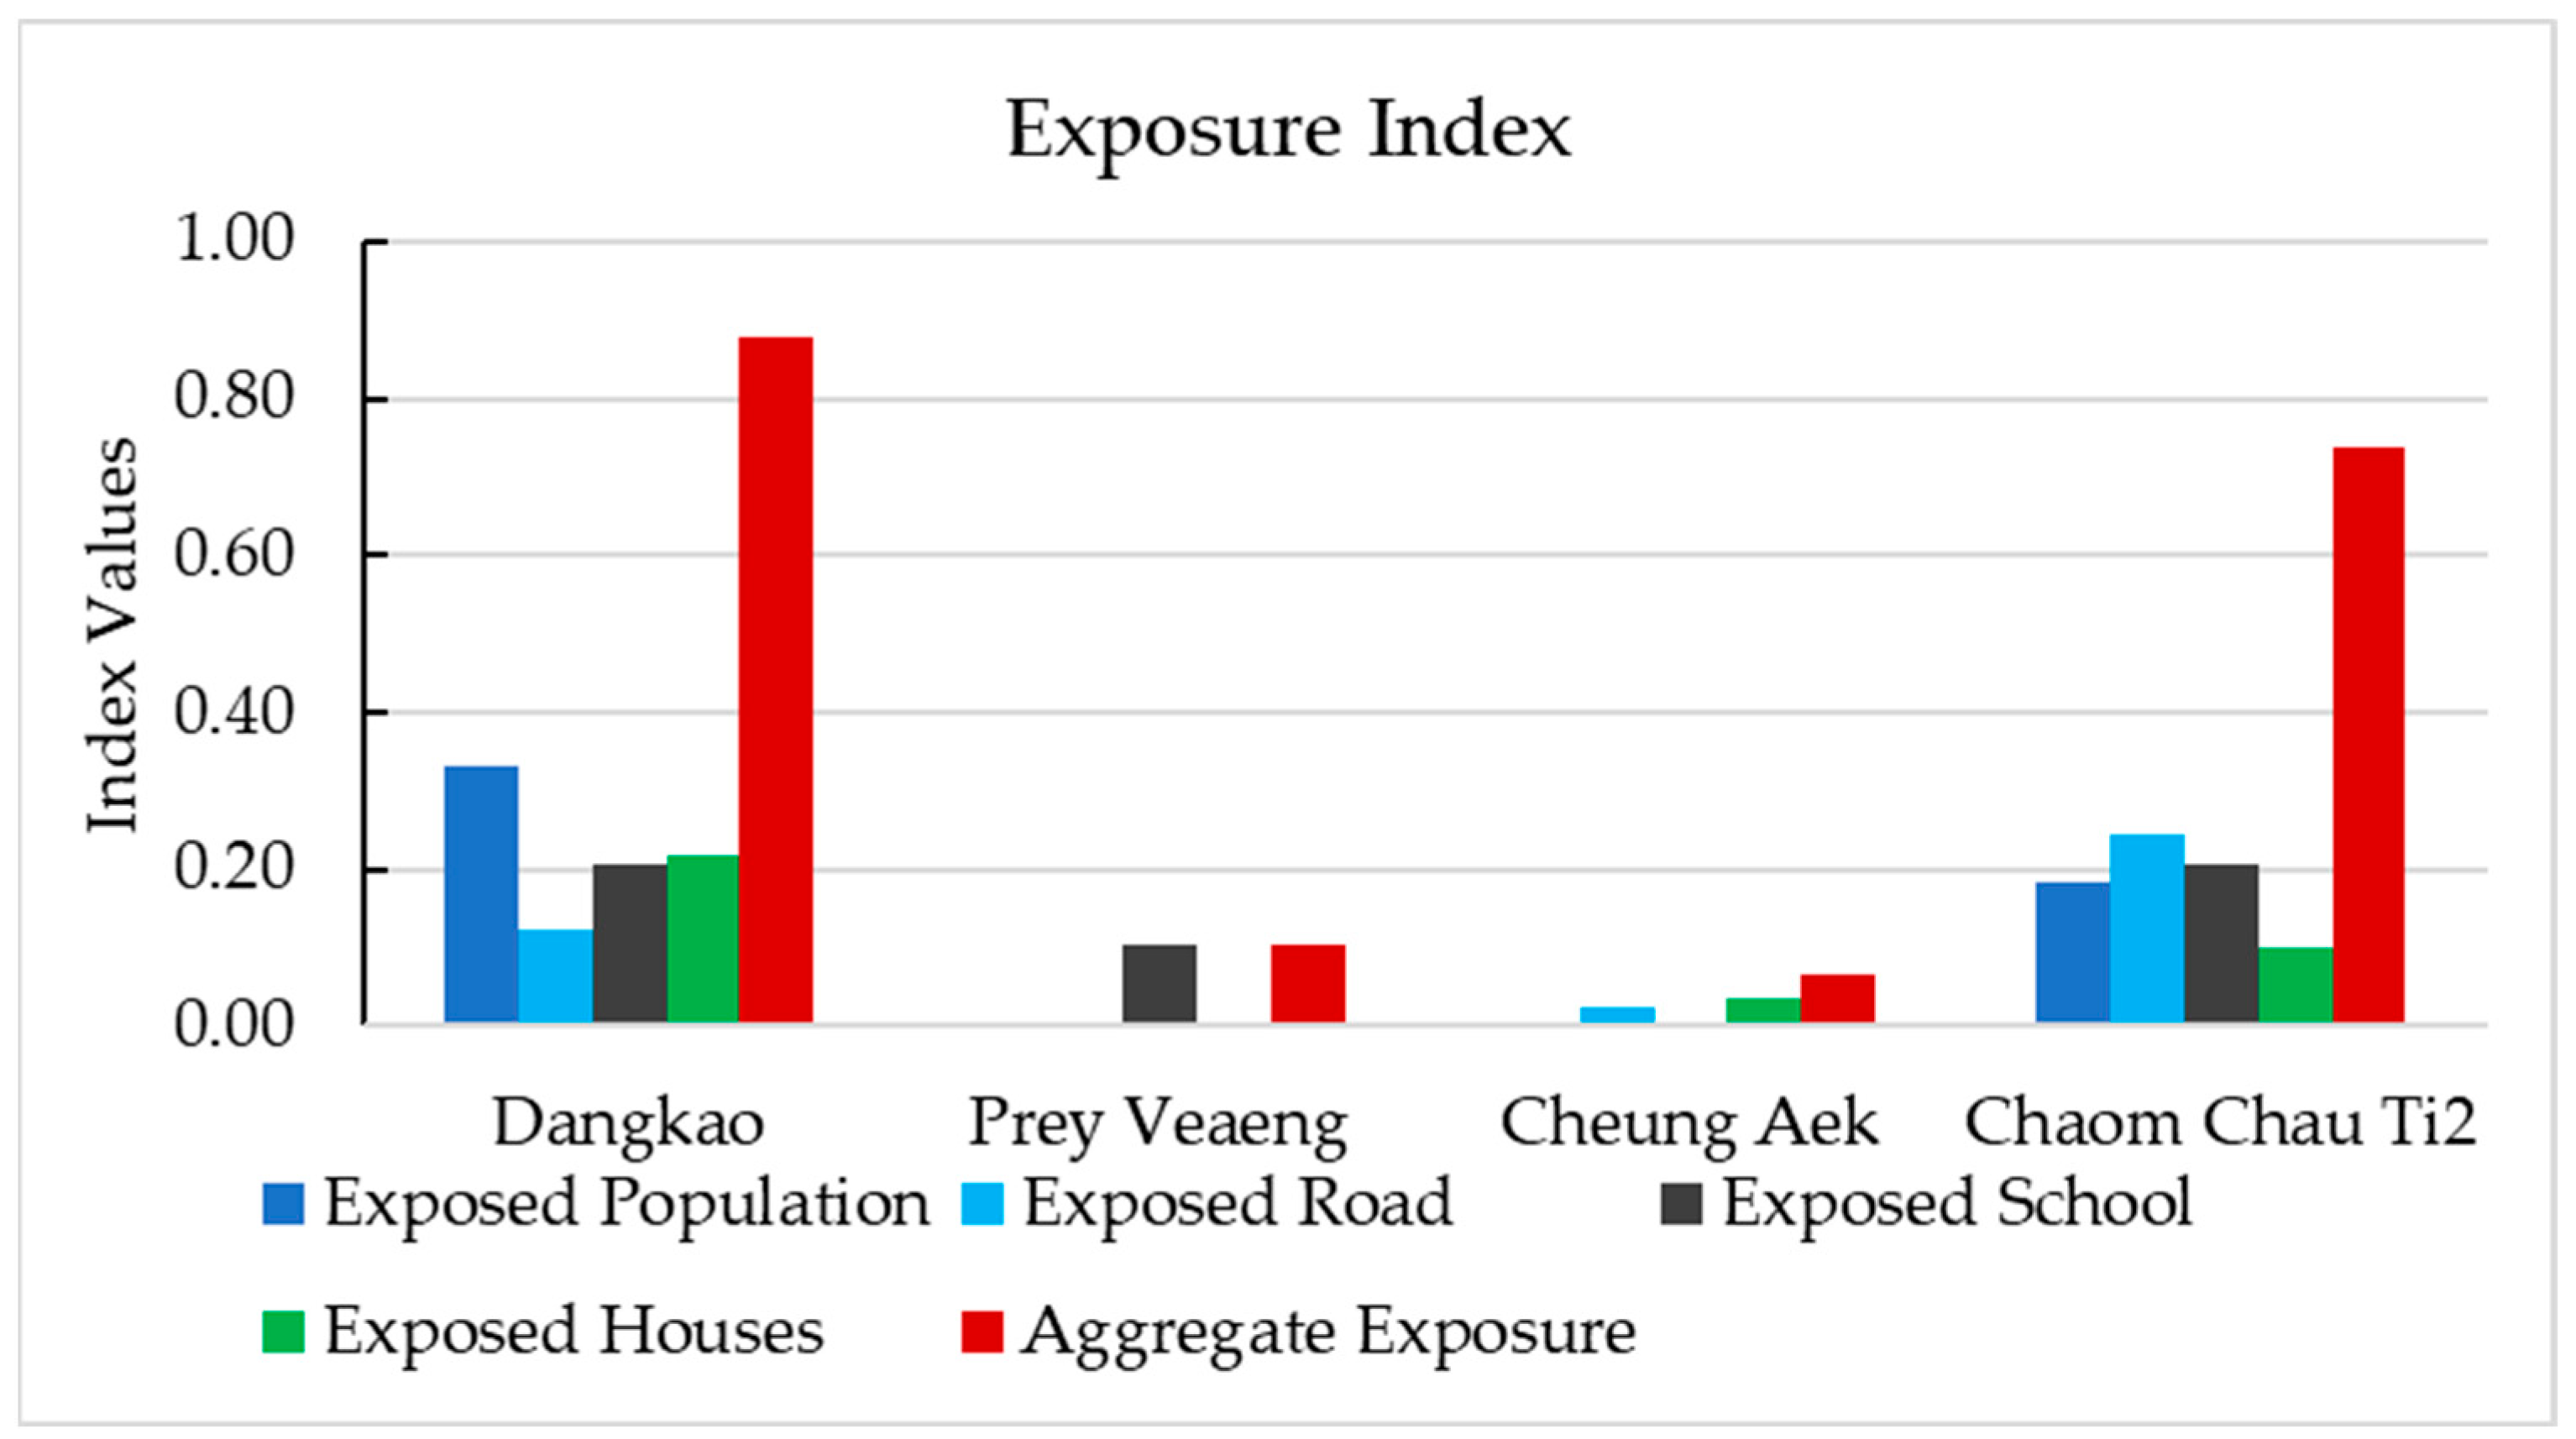
Exposure reflects the extent to which populations, infrastructure, and assets are located in flood-prone areas. Four indicators were assessed: exposed population, roads, schools, and housing. Under ROC, the exposed population receives the highest weight (0.332), followed by roads (0.244), housing (0.218), and schools (0.206), indicating that population concentration is the dominant contributor to overall exposure.
Indicator contributions vary across Sangkats. Dangkao consistently shows high exposure across multiple indicators, while Chaom Chau Ti2 is particularly influenced by road exposure. In contrast, Prey Veaeng and Cheung Aek exhibit uniformly low values across indicators.
Aggregate exposure scores reveal strong spatial differentiation. Dangkao and Chaom Chau Ti2 record substantially higher exposure than the other Sangkats (0.874 and 0.755 under Equal Weight; 0.877 and 0.736 under ROC, respectively), whereas Prey Veaeng and Cheung Aek remain comparatively low (0.125 and 0.069; 0.103 and 0.065) (Figure 4). These patterns are consistent across weighting approaches.
High exposure amplifies flood impacts by increasing the concentration of people and assets at risk. As a result, areas such as Dangkao and Chaom Chau Ti2 experience greater impacts even under moderate hazard conditions, while lower-exposure areas remain less affected.
Overall, exposure shows the greatest spatial variation among all components, indicating that population and infrastructure concentrations in flood-prone areas are the primary drivers of spatial flood risk.

3.1.3. Vulnerability Components at Community and Individual Levels

Community vulnerability shows substantial spatial variation, indicating uneven environmental and infrastructural conditions across Sangkats. Under ROC, the most influential indicators include drainage connectivity (0.181), unsafe drinking water (0.150), solid waste blockage (0.129), and evacuation access (0.121). These factors highlight the importance of drainage systems, sanitation, and accessibility in shaping flood vulnerability.
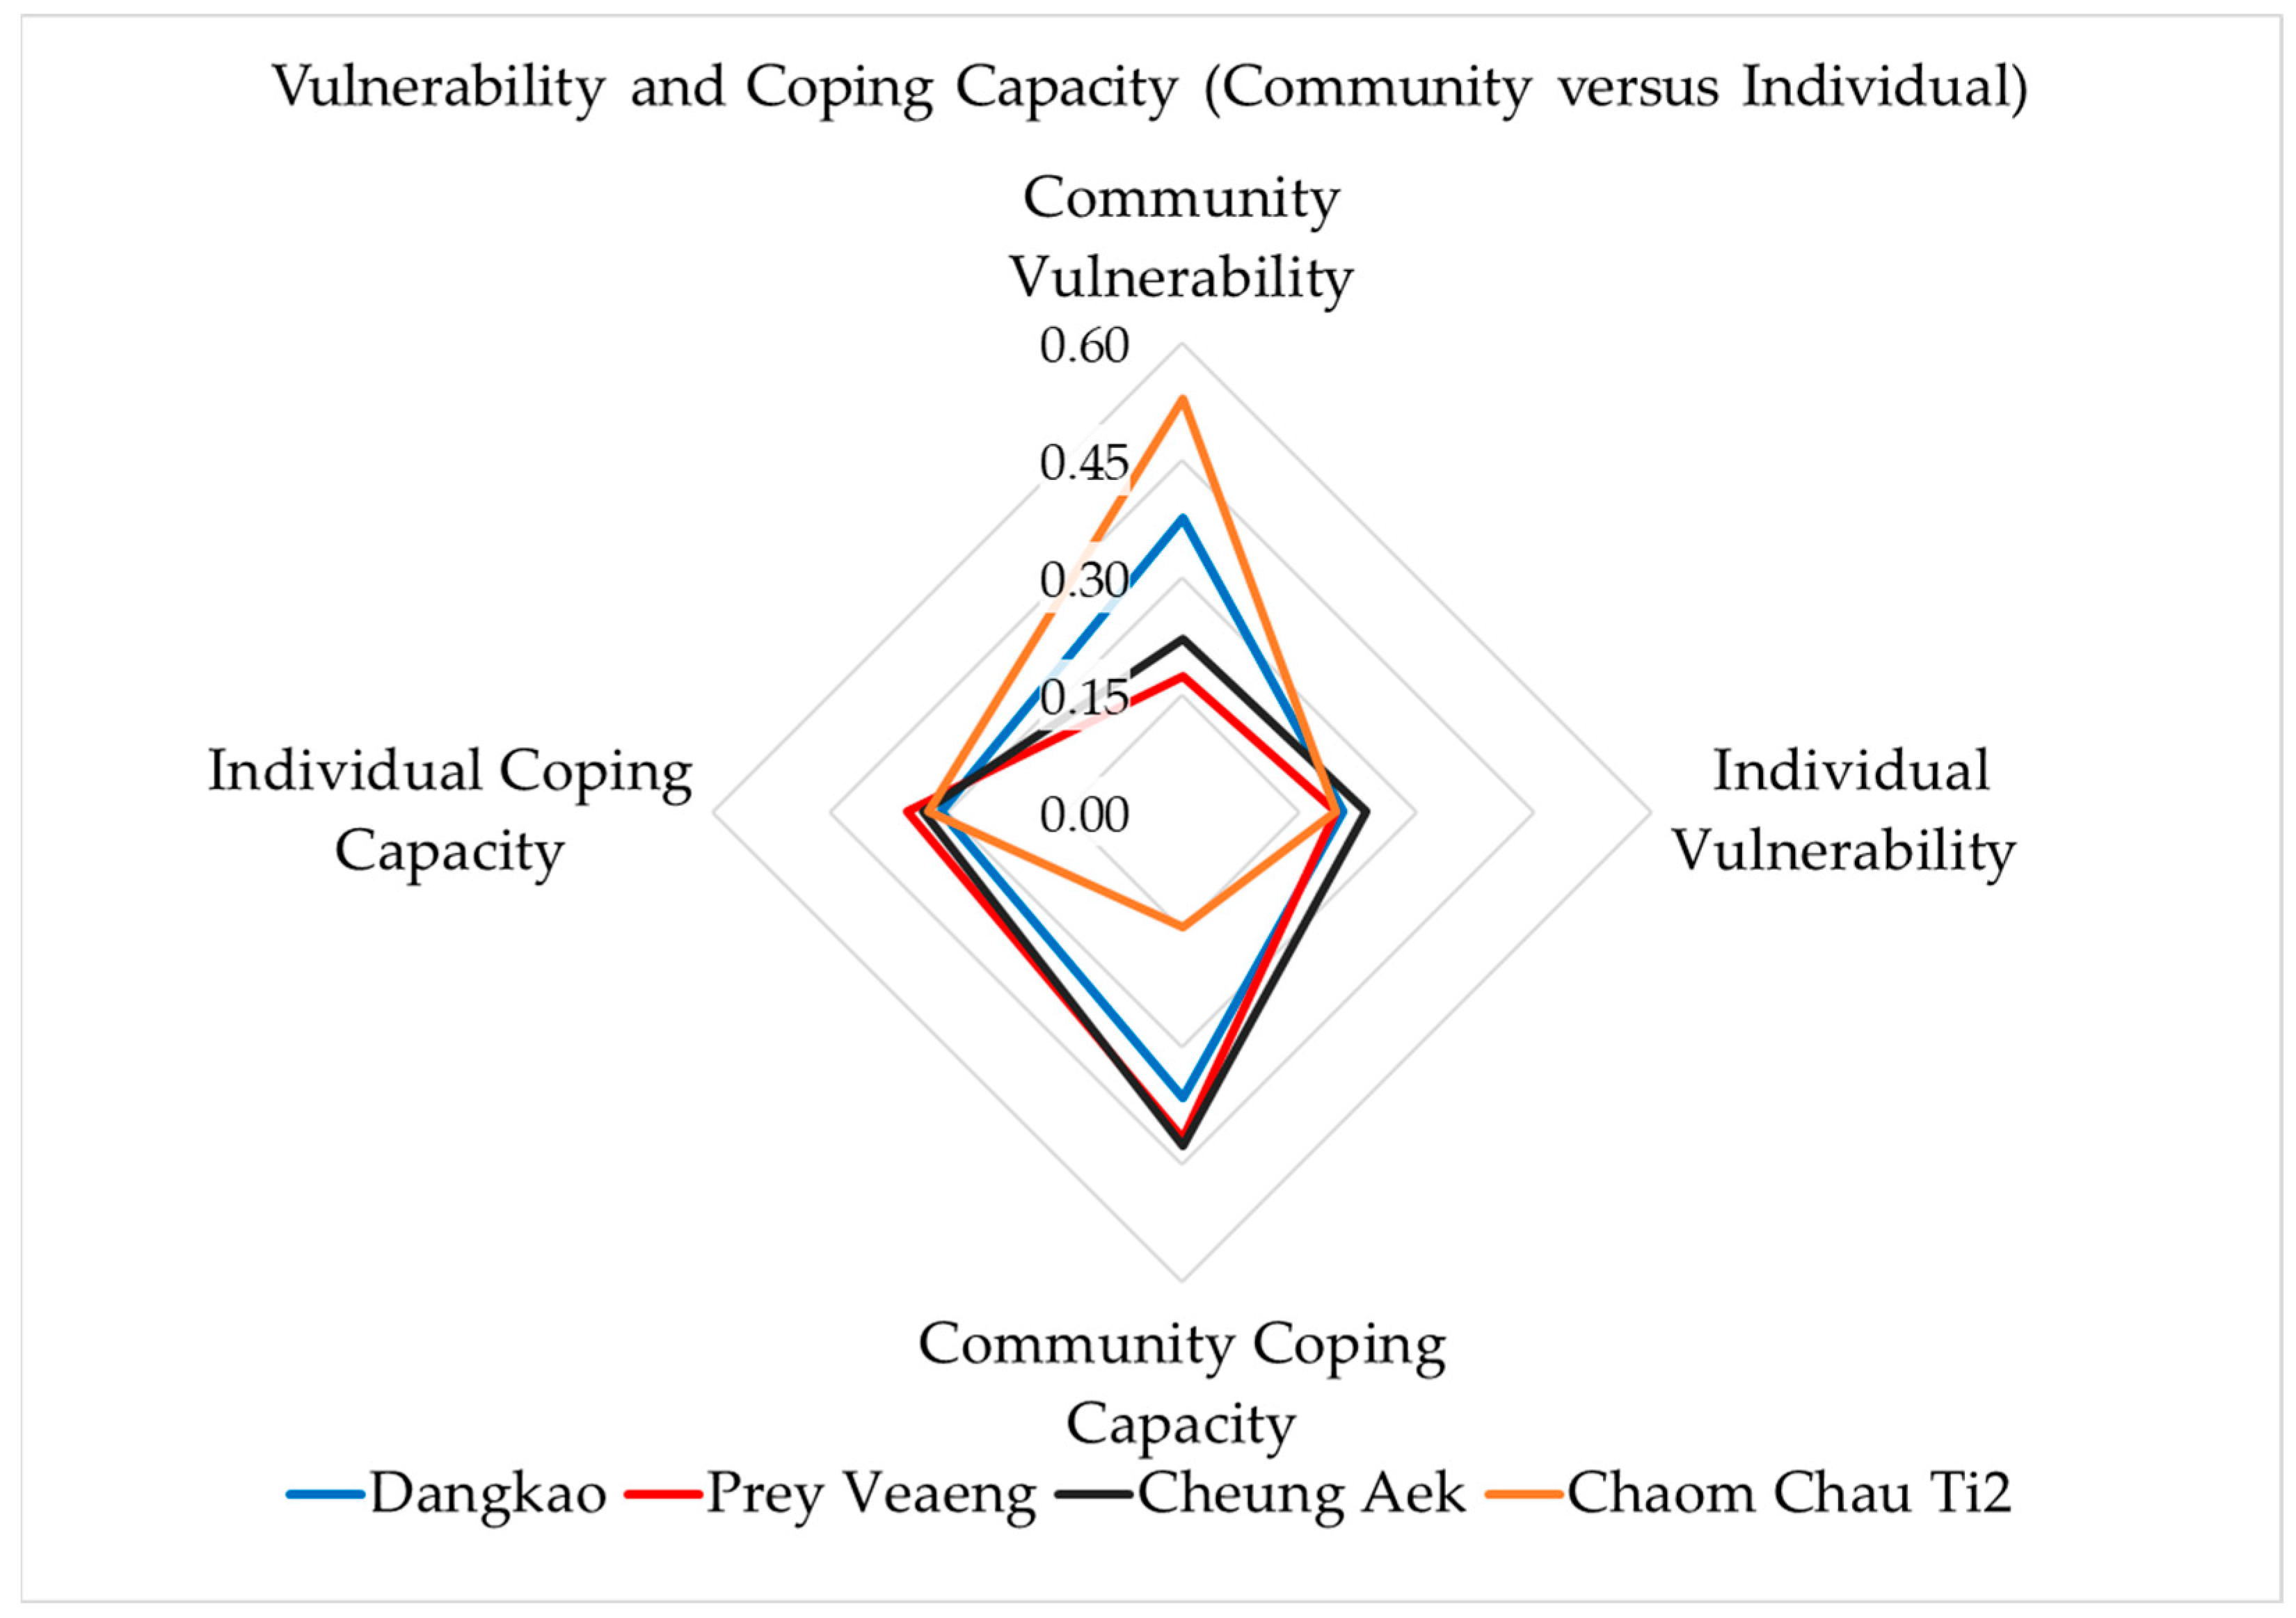
Aggregate scores reveal clear spatial disparities, as shown in Figure 5. Chaom Chau Ti2 records the highest community vulnerability (0.528), followed by Dangkao (0.375), while Cheung Aek and Prey Veaeng remain lower (0.221 and 0.173, respectively). This pattern suggests that rapid urban expansion, wetland loss, and increasing population density contribute to higher vulnerability in more developed peri-urban areas.
In contrast, individual vulnerability varies only slightly across Sangkats, indicating broadly similar socioeconomic conditions. The most influential indicators include disability prevalence and household poverty (both 0.106), followed by elderly population share (0.096) and chronic illness (0.090). Other factors contribute more modestly.
Aggregate individual vulnerability scores show a narrow range, from 0.197 to 0.236. Cheung Aek records slightly higher values, but overall variation remains limited. This suggests that household-level characteristics play a comparatively minor role in explaining spatial differences in flood risk.
Overall, community vulnerability in areas such as Chaom Chau Ti2 and Dangkao amplifies spatial differences in flood risk, whereas individual vulnerability remains relatively uniform. This highlights the dominant role of structural and environmental conditions.

3.1.4. Coping Capacity at Community and Individual

Community coping capacity shows marked spatial variation, reflecting differences in local arrangement, preparedness, and response systems. Under ROC, key indicators include flood response efficiency (0.126), disaster risk reduction support (0.122), early warning dissemination (0.119), and the availability of community disaster groups and updated hazard maps (0.111). These factors emphasise the importance of institutional capacity in strengthening resilience.
As coping capacity indicators are inverted, higher values indicate weaker capacity. Figure 5 illustrates that Cheung Aek and Prey Veaeng record the weakest community capacity (0.426 and 0.418), while Dangkao shows moderate levels (0.366). Chaom Chau Ti2 has the strongest capacity (0.147), despite its high vulnerability. This suggests that effective disaster management can partially offset structural risk.
Individual coping capacity shows limited variation across Sangkats. Key indicators include household income (0.126), flood-prevention measures (0.121), and timely access to warnings (0.117), highlighting the roles of economic resources and preparedness behaviour.
Aggregate scores range narrowly from 0.352 to 0.308, indicating relatively consistent household capacity. Although Prey Veaeng and Cheung Aek show slightly weaker performance, overall differences remain small.
Overall, community coping capacity differs substantially across Sangkats, while individual capacity remains relatively uniform. This underscores the importance of institutional preparedness over household-level resources in shaping flood resilience.

3.1.5. Flood Risk

The flood risk index integrates hazard, exposure, vulnerability, and coping capacity to estimate overall flood risk across Sangkat units. Both Equal Weight and ROC approaches produce consistent spatial patterns, although minor differences in component contributions exist (See Supplementary Material S7).
Dangkao exhibits the highest flood risk, with a mean index of 0.036, SD = 0.0097, and a ROC-based 95% confidence interval of 0.035–0.038. This high risk is primarily driven by elevated exposure (mean = 0.877, SD = 0.000, 95% CI 0.877–0.877) and moderate-to-high hazard (mean = 0.412, SD = 0.000, 95% CI 0.412–0.412). Coping capacity is moderate (mean = 0.340, SD = 0.076, 95% CI 0.329–0.351), while vulnerability contributes moderately to overall risk (mean = 0.296, SD = 0.041, 95% CI 0.290–0.302).
Chaom Chau Ti2 also shows elevated flood risk (mean = 0.024, SD = 0.0088, 95% CI 0.023–0.026), mainly due to high exposure (mean = 0.736, SD = 0.000, 95% CI 0.736–0.736) and vulnerability (mean = 0.378, SD = 0.046, 95% CI 0.370–0.385). Lower coping capacity (mean = 0.226, SD = 0.071, 95% CI 0.215–0.237) further elevates risk.
Prey Veaeng and Cheung Aek have lower flood risk, with mean indices of 0.002–0.003 and SDs of 0.0007–0.0009. Their 95% CIs are narrow, reflecting lower hazard and exposure, although moderate vulnerability and weaker coping capacity contribute to residual risk (Figure 6). Supplementary Material S9 provides key statistics—including mean, standard deviation, variance, and 95% confidence intervals—for all Sangkat-level.
Across all Sangkat units, areas with higher exposure consistently exhibit higher flood risk. Confidence intervals are narrow for high-risk units, indicating robust estimates. Wider intervals in lower- or intermediate-risk units reflect sensitivity to survey design and ROC-based weight perturbations.

3.1.6. Validation of Flood Risk Index

Validation results show general agreement between modelled flood risk and observed infrastructure damage, supporting the reliability of the composite index.
Dangkao records both the highest flood risk (0.037) and the greatest flooded road length (3562 m), demonstrating strong alignment between modelled risk and observed outcomes. Chaom Chau Ti2 also shows relatively high risk and moderate damage, while Prey Veaeng and Cheung Aek exhibit lower overall risk levels.
The Spearman correlation between the composite flood risk index and the observed length of flooded roads (ρ = 0.682, p = 0.537) indicates a positive but weak association. This suggests that the index generally reflects spatial patterns of flood impact, though much of the observed variation in damage is likely driven by other factors, such as infrastructure conditions, event-specific characteristics, and local responses. Given the small sample size at the Sangkat level, this validation should be interpreted as indicative rather than definitive, and future studies could use more detailed or event-based data to strengthen the assessment.
Some discrepancies remain. Prey Veaeng and Cheung Aek have similar low-risk values but differ in observed damage levels. This variation likely reflects localised factors, including drainage conditions, infrastructure quality, and flood flow concentration. While observed damage primarily reflects hazard–exposure interactions, the composite index additionally incorporates social vulnerability and coping capacity, which may not be directly observable in infrastructure damage alone.
Temporal patterns further support the results. Peak damage years (2019–2021) correspond to major flood events and align with higher-risk locations, reinforcing the structural validity of the index.
Overall, the validation confirms that the composite index captures underlying spatial flood risk patterns, while observed damage reflects event-specific variability.

3.2. Flood Risk by Migrant Group

3.2.1. Results of Sensitivity Analysis

The sensitivity analysis compares flood risk results under the Equal Weight and ROC approaches. Both methods produce consistent patterns across migrant groups, indicating strong robustness of the composite index.
New migrants (1–10 years) consistently exhibit the highest flood risk, while long-term migrants (>30 years) remain in the low-risk category. Minor variation is observed for mid-term migrants (11–30 years), whose risk decreases slightly under ROC (from 0.023 to 0.020), shifting from high to moderate risk.
Overall, differences between weighting schemes are minimal (e.g., 0.026 to 0.024 for new migrants), indicating that the flood risk index is stable and not sensitive to weighting assumptions. Supplementary Material S8 provides details of the Equal Weight and ROC-derived weights by component and migrant group.

3.2.2. Hazard and Exposure Components of Migrant Groups

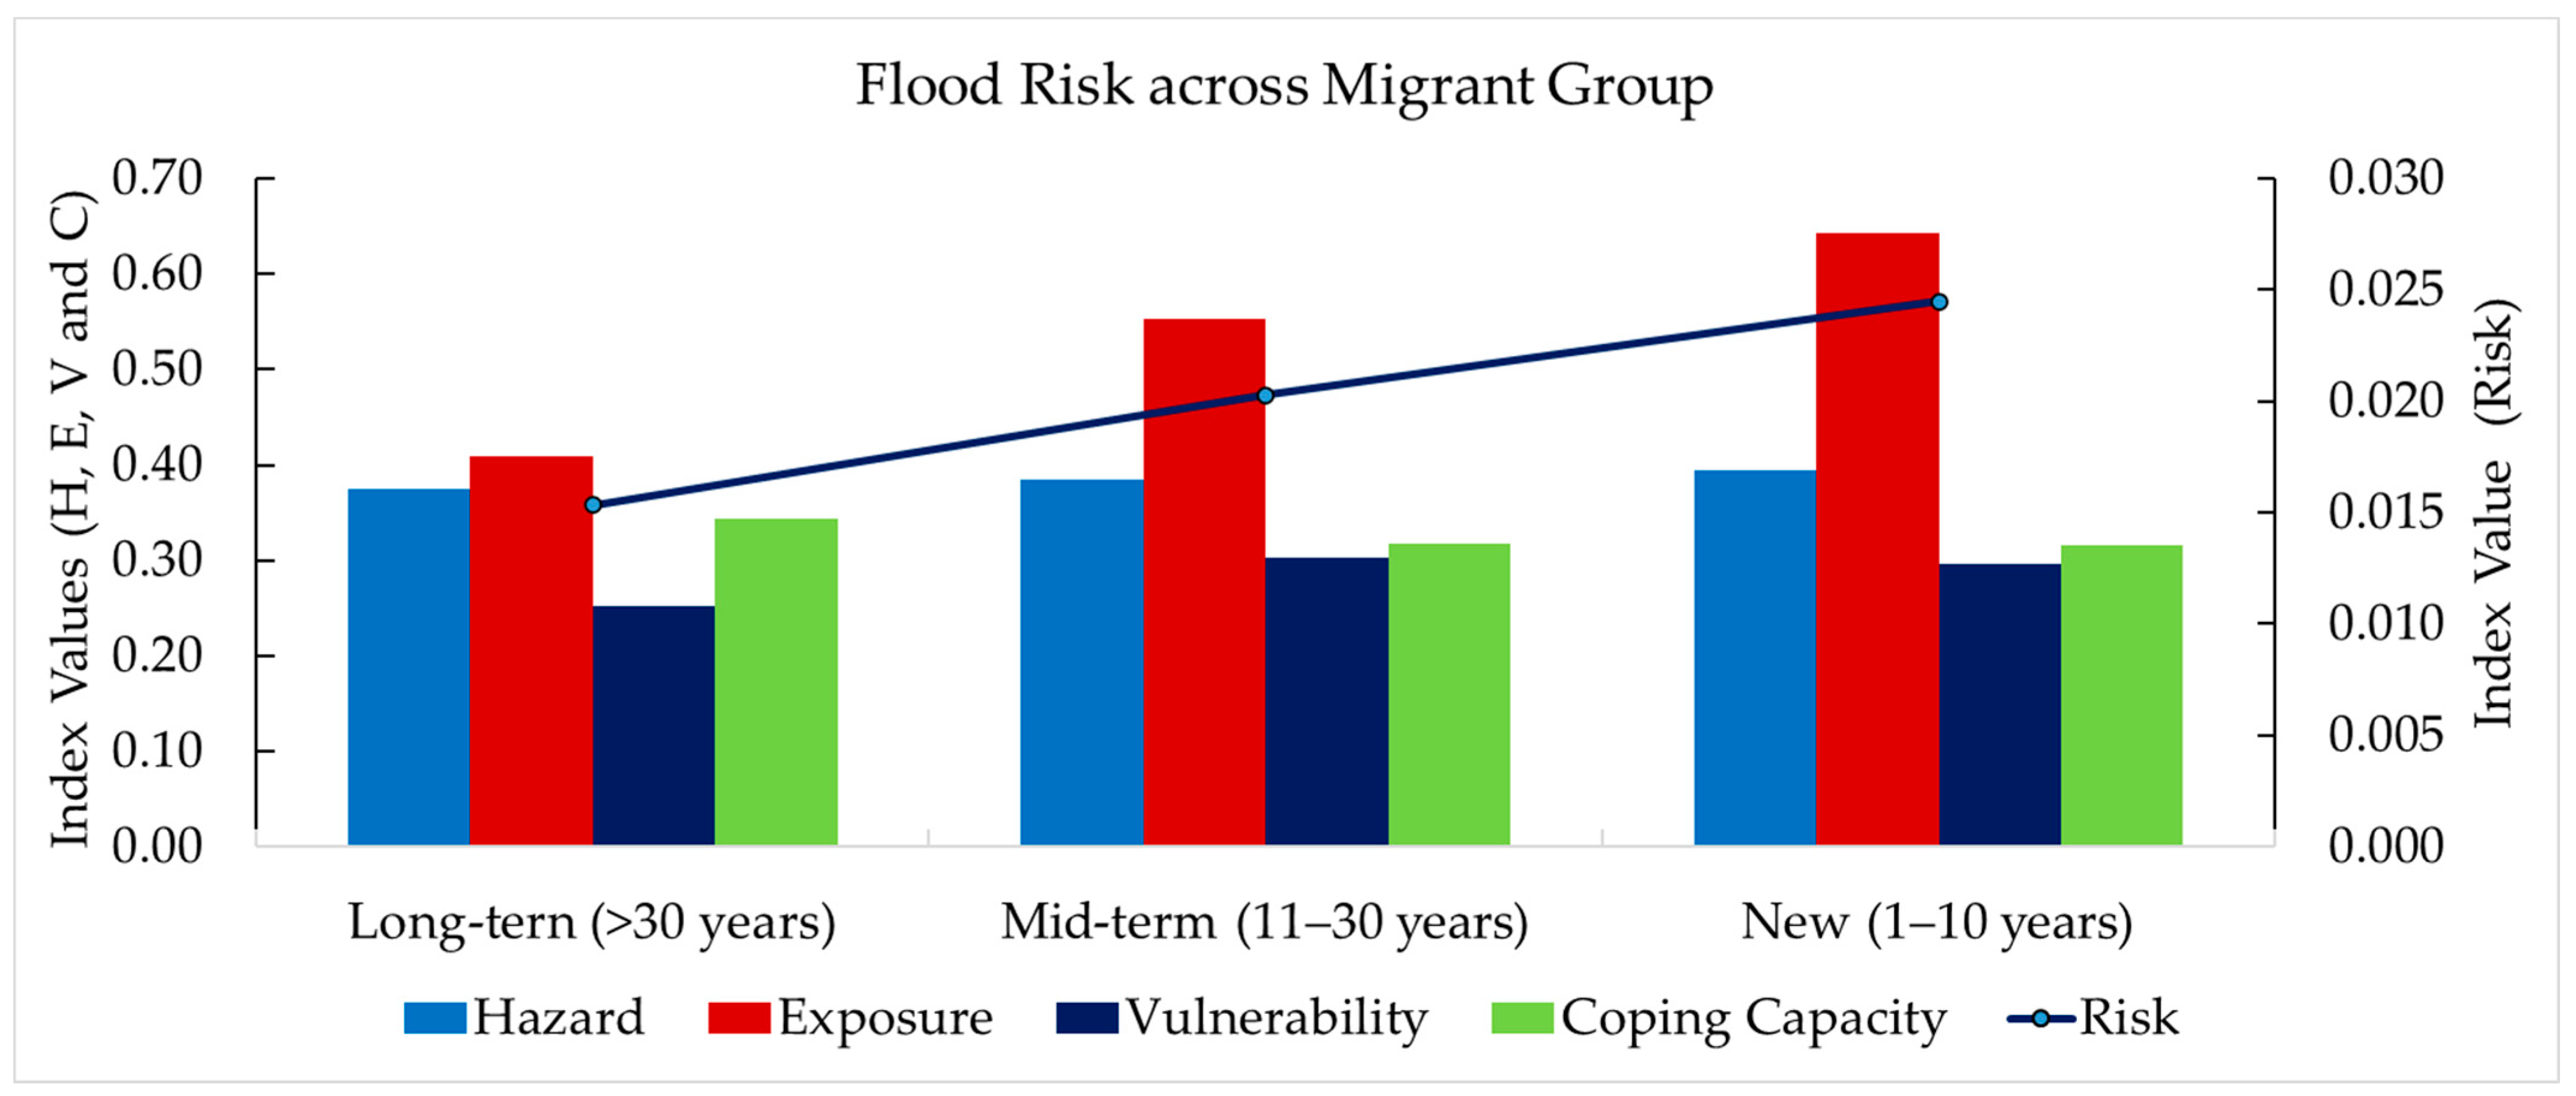
Hazard levels remain relatively similar across migrant groups, with only slight variation (0.373–0.394). This suggests that flood intensity does not differ substantially by settlement duration.
In contrast, exposure varies markedly. New migrants show the highest exposure (0.643), followed by mid-term migrants (0.553), while long-term migrants exhibit lower levels (0.409). This pattern reflects settlement in more flood-prone and less-developed peri-urban areas among recent migrants.
Overall, variation in flood risk across migrant groups is primarily driven by differences in exposure rather than in hazard.

3.2.3. Determinants of Vulnerability and Coping Capacity

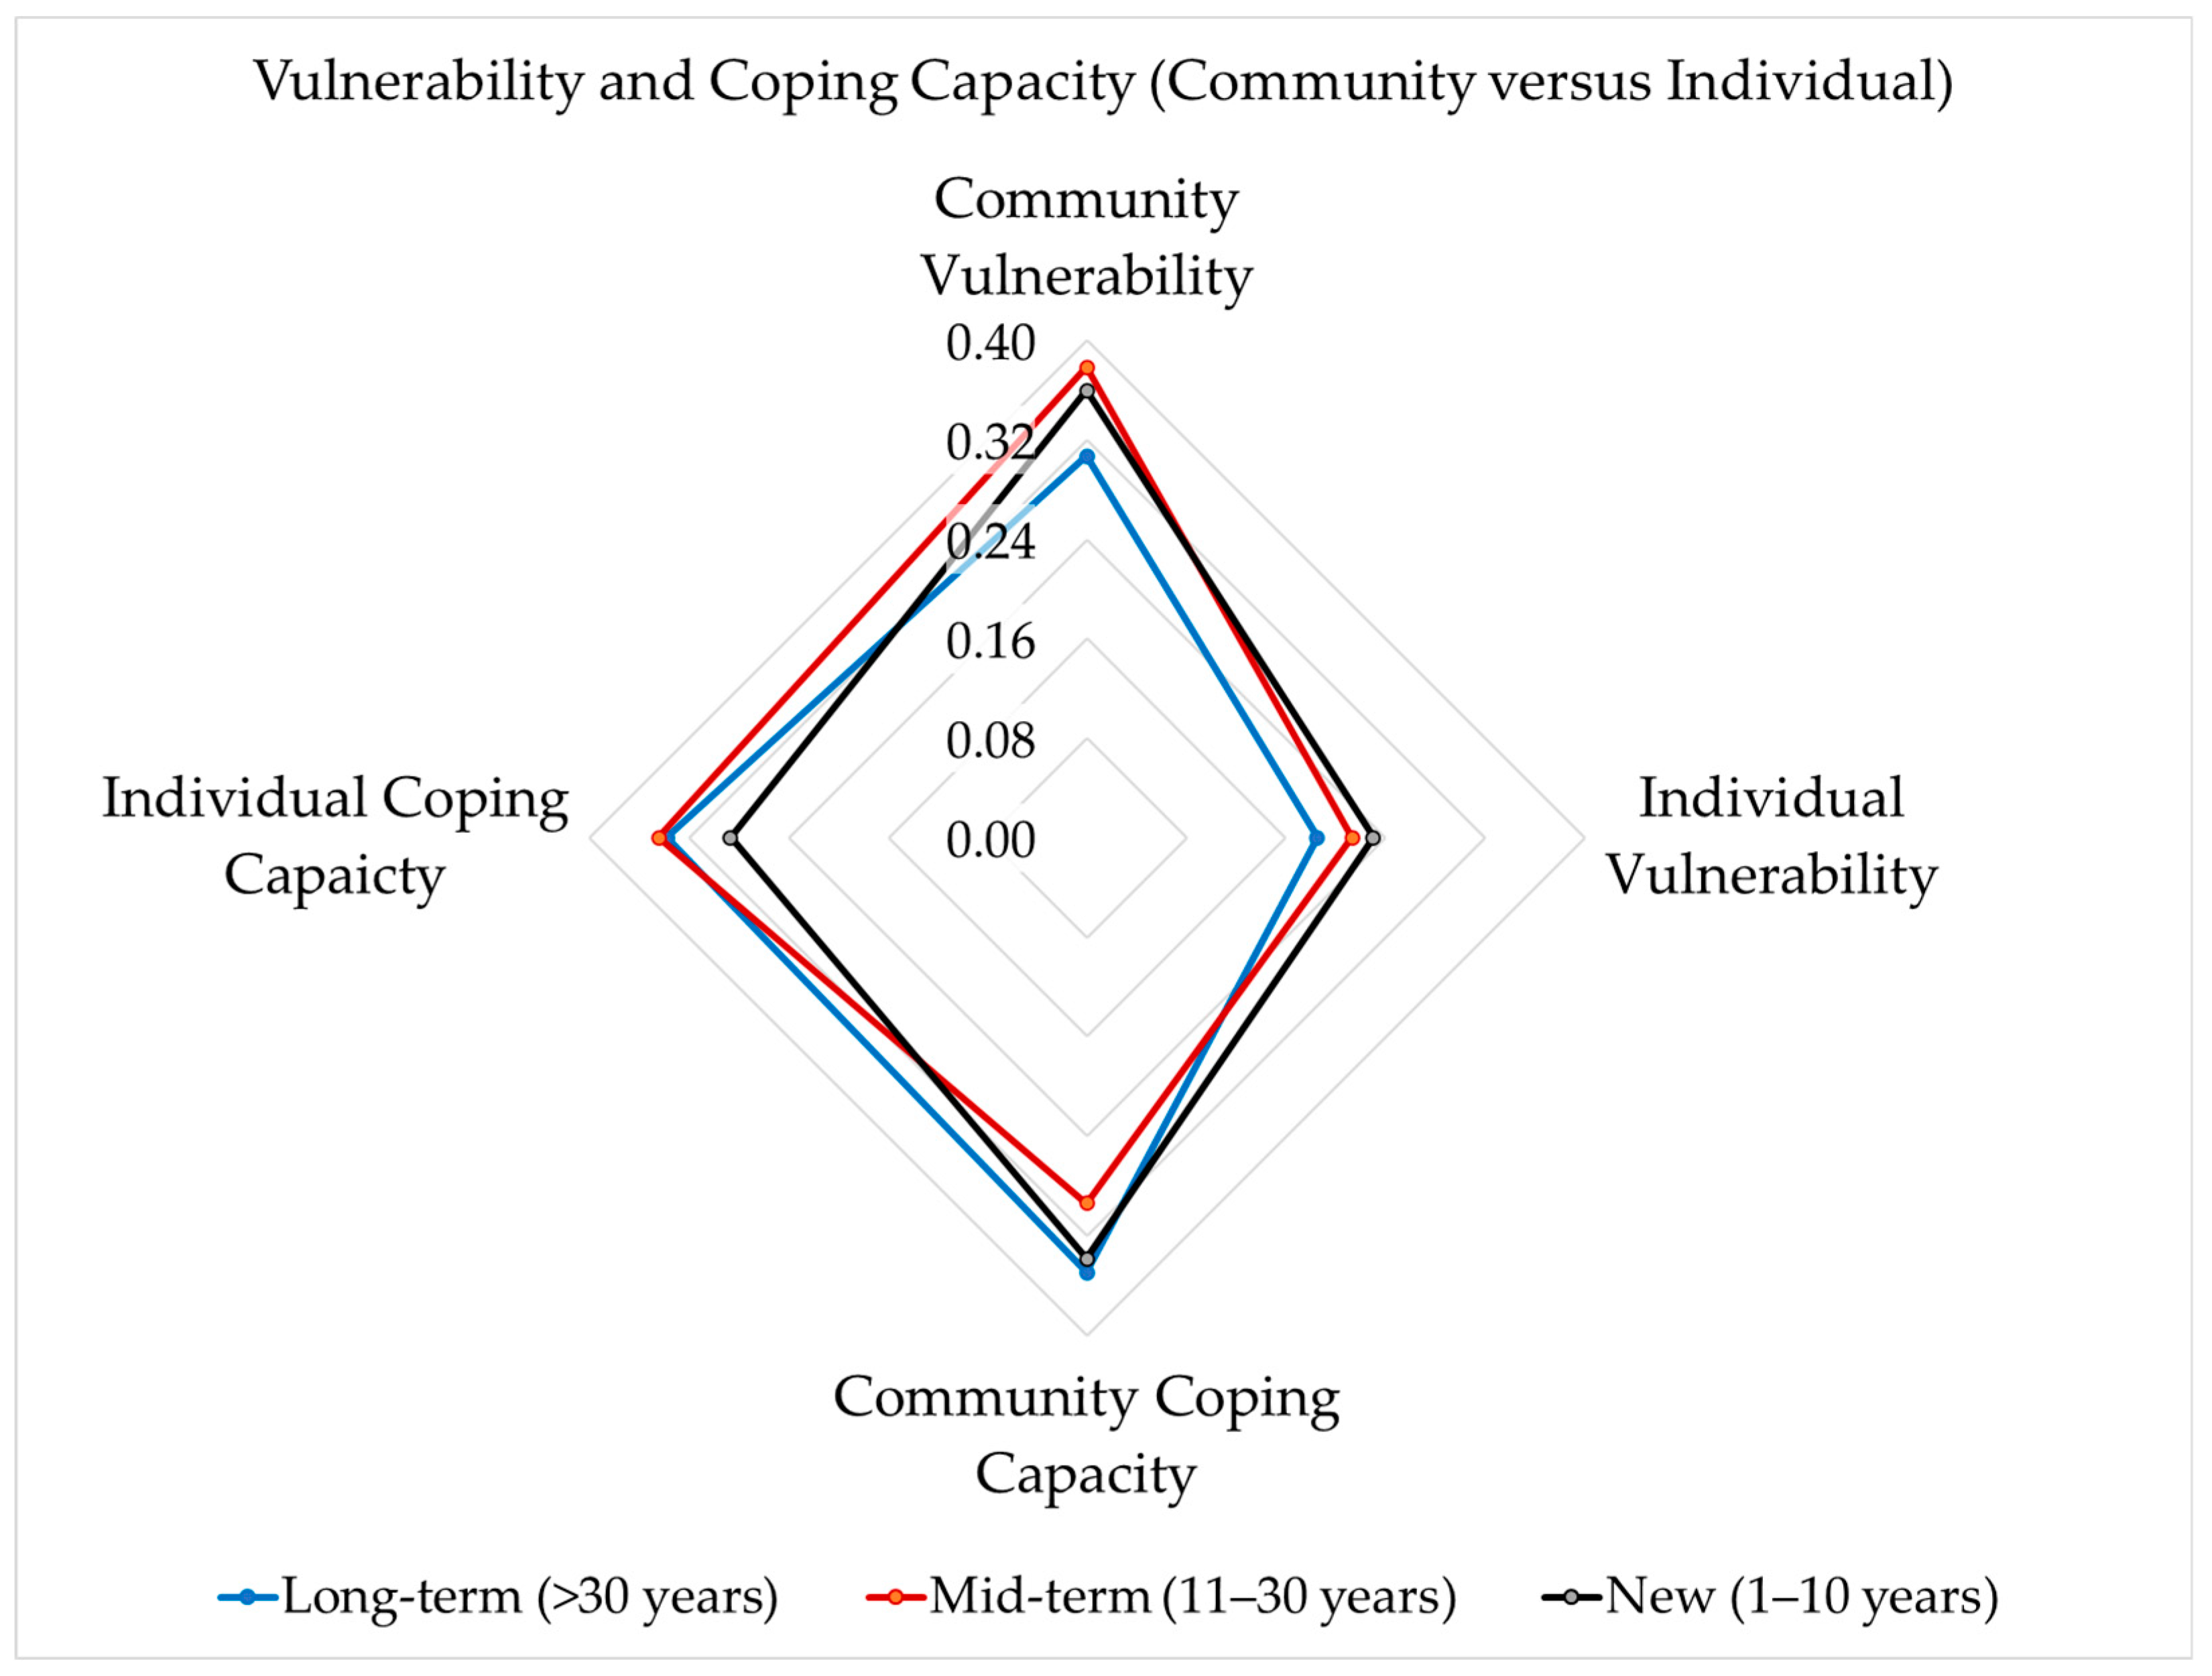
Community vulnerability varies across migrant groups, with mid-term migrants showing the highest levels (0.406 and 0.378 under Equal Weight and ROC), followed by new and long-term migrants. This suggests that environmental pressure and infrastructure limitations are particularly pronounced in mid-term settlements.
Figure 7 describes the variation in vulnerability and coping capacity at the community and individual levels. Individual vulnerability is highest among new migrants (0.261 and 0.230), reflecting greater socioeconomic constraints, including limited resources and weaker social networks. In contrast, long-term migrants show lower vulnerability, indicating more stable living conditions.
Community coping capacity (inverted index) is weakest among long-term migrants (0.372 and 0.350), suggesting potential institutional or infrastructural gaps in older settlements. New and mid-term migrants show comparatively stronger community support.
Individual coping capacity varies less, although mid-term migrants exhibit slightly weaker performance (0.339 and 0.345). This indicates moderate constraints in household preparedness and resources.
Overall, new migrants face the highest flood risk due to high exposure and individual vulnerability, while mid-term migrants exhibit mixed patterns shaped by infrastructure, environmental conditions, and institutional capacity. These patterns highlight the dynamic nature of flood risk across migrant groups, with stepwise adaptation observed across settlement durations.

3.2.4. Overall Risk Across Migrant Groups

The flood risk index also integrates hazard, exposure, vulnerability, and coping capacity to assess risk across migrant groups. Results from Equal Weight and ROC approaches are consistent, with minor differences in component contributions (see Supplementary Material S8).
New migrants (1–10 years) face the highest flood risk, with a mean index of 0.024, SD = 0.016, and a 95% confidence interval of 0.022–0.027. Elevated exposure (mean = 0.643, SD = 0.340, 95% CI 0.589–0.697) and vulnerability (mean = 0.297, SD = 0.068, 95% CI 0.286–0.308) drive this high risk, while coping capacity is limited (mean = 0.316, SD = 0.089, 95% CI 0.302–0.330).
Mid-term migrants (11–30 years) exhibit moderate risk, with a mean index of 0.020, SD = 0.015, 95% CI 0.018–0.022. Exposure (mean = 0.553, SD = 0.339, 95% CI 0.506–0.601) and vulnerability (mean = 0.302, SD = 0.082, 95% CI 0.291–0.313) are slightly lower than for new migrants, while coping capacity remains modest (mean = 0.317, SD = 0.109, 95% CI 0.302–0.332).
Long-term migrants (>30 years) have the lowest flood risk, with a mean index of 0.015, SD = 0.017, 95% CI 0.013–0.018. Reduced exposure (mean = 0.410, SD = 0.362, 95% CI 0.360–0.459) and vulnerability (mean = 0.252, SD = 0.093, 95% CI 0.239–0.264) explain the lower risk. However, weaker coping capacity in some established communities (mean = 0.344, SD = 0.098, 95% CI 0.330–0.357) contributes to residual risk (Figure 8). Supplementary Material S9 provides key statistics—including mean, standard deviation, variance, and 95% confidence intervals—for all migrant-group data.
However, this transition does not occur at a constant rate. While exposure and vulnerability generally decrease with settlement duration, weaker coping capacity in some long-established areas contributes to residual risk. Figure 8 illustrates the dynamic evolution of flood risk across migrant groups. Exposure declines with settlement duration, while coping capacity follows a non-linear pattern. As a result, overall flood risk decreases but does not follow a linear trajectory.
Overall, flood risk declines with settlement duration. Variance and ROC-based confidence intervals highlight uncertainty in intermediate-risk groups while confirming the robustness of high- and low-risk estimates. These measures support cautious interpretation of temporal trends and the adaptive processes influencing flood vulnerability across migrant populations.

4. Discussion

4.1. Determinants of Spatial and Migrant Flood Risk Differentiation

Flood risk in peri-urban Phnom Penh emerges from interactions among H-E-V-C. The results show that exposure and community-level conditions are the primary determinants of spatial flood risk, while migration dynamics introduce a temporal dimension.
Consistent with prior analyses by Nong et al. (2026) [13], Dangkao exhibits the highest flood risk, followed by Chaom Chau Ti2, whereas Prey Veaeng and Cheung Aek show lower risk levels. Similarly, both studies identify new migrants as the most vulnerable group. However, this study advances prior work by applying an ROC-weighted composite index, enabling systematic comparison across Sangkats and migrant groups. Unlike previous descriptive approaches, this framework captures cross-scalar interactions and temporal dynamics, providing a more robust and policy-relevant assessment.
New migrants (1–10 years) are the most vulnerable group, reflecting settlement in flood-prone and infrastructure-deficient areas. This confirms findings from [8,40], who emphasise that recent migrants often face heightened risk due to limited social networks, adaptive capacity, and residence in peripheral areas.
Unlike descriptive assessments in previous studies [48,63], the ROC-weighted composite index enables quantitative comparison across Sangkats and migrant groups, capturing non-linear interactions among hazard, exposure, and vulnerability. This approach aligns with the conceptualisation of socially produced risk in peri-urban contexts [4,11].

4.2. Spatial Determinants of Flood Risk

Hazard conditions vary across the study areas but do not fully explain spatial differences in flood risk. Dangkao records the highest hazard, but overall variation is primarily driven by exposure and structural vulnerability, consistent with urban flood risk analyses in Southeast Asian cities [7,42,55].
While hazard intensity shows minimal spatial variation (0.333–0.413) across the four Sangkats, it remains a necessary component of the H-E-V-C framework. Spatial differences in flood risk are largely driven by variations in exposure and community-level vulnerability, highlighting the amplifying role of socioeconomic and structural factors relative to hazard intensity.
In contrast, exposure plays a dominant role. Dangkao and Chaom Chau Ti2 exhibit high exposure due to dense populations and infrastructure located in flood-prone areas [41,62]. Rapid peri-urban expansion, often characterised by informal or weakly regulated development, has concentrated settlements in environmentally vulnerable locations [48,63]. These patterns significantly increase the number of people and assets at risk.
Community-level vulnerability further amplifies these spatial differences. High impervious surface ratios, wetland loss, and inadequate drainage systems increase flood susceptibility [55,56], particularly in Dangkao and Chaom Chau Ti2. Similar processes have been identified across Southeast Asian cities, where land-use change intensifies pluvial flooding [42,51]. These findings confirm that structural and governance conditions mediate the translation of hazard into actual risk [5,44].
By contrast, individual vulnerability shows limited spatial variation, suggesting broadly similar socioeconomic conditions across Sangkats. This supports the existing literature, which indicates that household-level characteristics alone cannot explain spatial risk patterns [4,11].
Coping capacity also shapes flood outcomes. Variations in community-level preparedness, early warning systems, and institutional support influence resilience. For example, Chaom Chau Ti2 demonstrates relatively strong coping capacity, which partially offsets its high vulnerability. In contrast, weaker institutional capacity in Cheung Aek and Prey Veaeng increases sensitivity to flood impacts. These findings highlight the critical role of governance and community systems in urban flood resilience [53,56,75].

4.3. Migration Dynamics and Flood Risk

Migration introduces a critical temporal dimension to flood risk. New migrants experience the highest risk, driven by elevated exposure and individual-level vulnerability [89,90]. Mid-term migrants show moderate exposure but higher residual vulnerability due to ageing infrastructure in their settlements [48,50]. New migrants often settle in recently developed peri-urban areas where land is more affordable, but infrastructure remains incomplete. These areas are frequently low-lying and poorly drained, resulting in elevated exposure to flooding. Similar settlement patterns have been documented in Phnom Penh and other Southeast Asian cities [62].
Long-term migrants benefit from enhanced adaptive capacity via social integration, improved housing, and established coping strategies. However, risk reduction does not occur at a constant rate, as residual risk persists where community coping capacity is weak or institutional support is inconsistent [43,44,58].
It is important to note that settlement duration is used in this study as a proxy for adaptive capacity and experience. Settlement duration may also be correlated with other socioeconomic factors such as income, education, and housing quality, which can independently affect vulnerability and coping capacity. Therefore, the observed differences in flood risk across migrant groups likely reflect a combination of temporal adaptation and underlying socioeconomic conditions. The analysis captures associational patterns rather than isolating the independent causal effect of settlement duration.
The relationship between migration status and flood risk should also be interpreted in light of potential reverse causality and selection effects. Vulnerable households may preferentially migrate to peri-urban areas where land is affordable, but flood exposure is higher. Consequently, elevated risk among newly arrived migrants may partly reflect pre-existing vulnerability. These patterns likely result from the interaction of two processes: (i) selection of more vulnerable households into high-risk areas, and (ii) gradual adaptation over time through improved housing, infrastructure access, and social integration. Overall, the findings reflect the combined effects of settlement dynamics and socioeconomic selection rather than a unidirectional causal relationship.
Socioeconomic constraints further increase vulnerability among new migrants. Limited income, insecure housing, and weak social networks restrict their ability to invest in protective measures or access support during floods [58]. These conditions reinforce their high-risk status.
Over time, adaptive capacity improves. Long-term migrants benefit from stronger social networks, local knowledge, and incremental housing improvements, such as elevation and drainage connections. These processes reduce both exposure and vulnerability. However, risk reduction varies across migrant groups and follows a stepwise adaptation pattern. Some established communities face ageing infrastructure and institutional gaps that may constrain coping capacity, resulting in persistent or residual risk. This temporal dynamic aligns with global evidence indicating that migration status and settlement history influence both exposure and adaptive capacity [40,65].

4.4. Implications for Flood Risk Management

The findings highlight the structural nature of urban flood risk, where exposure and community-level conditions play a more decisive role than hazard intensity or household characteristics. Rapid urban expansion and wetland conversion increase exposure [42,55], while uneven infrastructure development exacerbates vulnerability.
These results suggest that flood risk reduction requires structural and community-based interventions. Urban planning should prioritise expanding drainage systems, conserving wetlands, and regulating peri-urban development [56,75]. Strengthening community-level disaster preparedness systems, including early warning and coordinated response mechanisms, is also essential.
Targeted support for newly arrived migrants is particularly important [8,63]. Early-stage interventions—such as access to basic infrastructure, secure housing, and inclusion in local disaster management systems—can significantly reduce exposure and vulnerability. These measures are critical for building equitable and adaptive flood resilience in rapidly urbanising cities.

4.5. Limitations

This study has several limitations that should be acknowledged. First, the analysis relies on cross-sectional data, which constrains the ability to fully capture long-term temporal dynamics. While migrant settlement duration is used as a proxy for temporal adaptation, this approach assumes that current long-term migrants experienced conditions similar to new migrants in the past. Consequently, cohort effects and historical changes in infrastructure, governance, or urban development may influence observed patterns. Differences across migrant groups should therefore be interpreted as associative rather than causal. Longitudinal studies would provide a more robust understanding of temporal changes in flood risk and adaptive capacity.
Second, the composite flood risk index depends on selected indicators and weighting schemes. Although the ROC method enhances consistency, some uncertainty remains in both indicator selection and weight assignment. Sensitivity analysis shows that differences between equal-weight and ROC-based schemes are minor, confirming the robustness of the index to moderate variations in weighting while retaining theoretical interpretability.
Third, the study focuses on selected peri-urban Sangkats in Phnom Penh. While these areas represent key flood-prone zones, findings may not fully generalise to urban contexts with different hydrological, socioeconomic, or institutional conditions.
Fourth, hazard indicators are derived from reported flood experiences rather than hydrodynamic modelling. As a result, extreme or future flood scenarios under climate change may not be fully captured. Additionally, multivariate influences such as income, education, and housing conditions are not isolated, and potential reverse causality or selection bias in migration may influence observed risk patterns.
Finally, survey data may contain inconsistencies, and rapidly changing peri-urban conditions could introduce aggregation challenges. Cross-validation or independent dataset testing was not performed, and future research could apply these methods to strengthen reliability and generalizability.
Despite these limitations, the study provides a robust, cross-scalar framework for analysing flood risk and offers actionable insights for policy and planning in rapidly urbanising cities.

5. Conclusions

This study quantifies spatially differentiated flood risk across peri-urban Phnom Penh using a multi-factor hazard-exposure-vulnerability-coping capacity (H-E-V-C) framework. The use of a composite, multi-factor framework provides a more complete assessment than a simple hazard index. It captures not only flood characteristics, but also population exposure, socioeconomic vulnerability, and coping capacity.
The ROC-based index improves the identification of dominant risk drivers and strengthens the robustness of spatial flood risk assessment. The Rank Order Centroid (ROC) integrates expert rankings systematically while reducing inconsistencies that can arise from conventional AHP pairwise comparisons. This ensures that weights reflect both technical knowledge and local context.
Flood risk varies sharply across Sangkats despite only moderate differences in hazard intensity. Exposure disparities—driven by rapid peri-urban expansion into wetlands and low-lying areas—emerge as the primary driver of spatial flood risk. Community-level vulnerability and coping capacity play a decisive role in shaping risk outcomes. Household preparedness alone cannot compensate for deficits in community infrastructure and Sangkat-level arrangements. Effective early warning systems, dedicated disaster budgets, and coordinated response mechanisms substantially moderate flood impacts. These findings reinforce the argument that flood risk is socially produced and collectively mediated through community structures and spatial planning.
Migration introduces a temporal dimension. New migrants face the highest risk due to elevated exposure and vulnerability, while long-term migrants benefit from improved conditions over time. However, migration duration alone does not guarantee a reduction in risk. The key factors in reducing flood risk are institutional inclusion, social networks, and environmental stability.
Overall, flood risk is structurally produced and spatially differentiated. Exposure remains the primary driver, while multi-factor assessment using ROC provides a robust, policy-relevant framework for identifying high-risk areas and vulnerable groups.

Supplementary Materials

The following supporting information can be downloaded at https://www.mdpi.com/article/10.3390/w18101152/s1, S1: Survey Questionnaires for Sangkat and Household; S2: Method for Calculating Impervious Surface Ratio; S3: Method for Calculating Wetland Loss; S4: Method for house values exposed to flooding; S5: Table of adjusted ROC weighted values; S6: Detials of sensitive analyses; S7: Table of Equal and ROC weights by component and Sangkat; S8: Table of Equal and ROC weights by component and migrant group; S9: Table of key statistics—including mean, standard deviation, variance, and confidence intervals—for all Sangkat-level and migrant groups. References [91,92,93,94] are cited in the Supplementary Materials.

Author Contributions

Conceptualization, T.K. (Toru Konishi) and M.N.; methodology, T.K. (Toru Konishi) and M.N.; validation, T.K. (Toru Konishi), M.N. and Y.I.; formal analysis, M.N.; investigation, H.A. and T.K. (Takuto Kumagae); resources, Y.I.; data curation, M.N., H.A. and T.K. (Takuto Kumagae); writing—original draft preparation, M.N.; writing—review and editing, T.K. (Toru Konishi) and Y.I.; visualisation, M.N.; supervision, Y.I.; project administration, Y.I.; funding acquisition, Y.I. All authors have read and agreed to the published version of the manuscript.

Funding

This study was supported by the Tokyo Metropolitan University.

Institutional Review Board Statement

The study was conducted in accordance with the Declaration of Helsinki, and the protocol was approved by the Ethics Committee of the Ministry of Interior General Department of Administration (No. 090 N./GDA.) on 5 March 2025.

Informed Consent Statement

Informed consent was obtained from all participants involved in the study.

Data Availability Statement

Data access is subject to ethical and privacy restrictions. Publicly available datasets were utilised in this study. Land Use/Land Cover (LULC) data were obtained from the Phnom Penh (Cambodia)—Land Use/Land Cover Maps (ESA EO4SD-Urban) [World Bank Data Catalogue], https://datacatalog.worldbank.org/search/dataset/0038964/phnom-penh-cambodia-land-use-land-cover-maps-esa-eo4sd-urban (accessed 4 October 2025). Population data at the Sangkat/Commune level were provided by the Ministry of Planning (MOP), Cambodia, and can be obtained from the corresponding author upon request and with MOP approval. Certain datasets generated during this study are not publicly available as they are part of ongoing research; access requests should be directed to the corresponding author.

Acknowledgments

The authors sincerely thank the Phnom Penh municipality and Sangkat authorities for their support and coordination throughout the fieldwork. We are also grateful to the students from the Department of Sustainable Urban Planning and Development at the Royal University of Phnom Penh for their essential assistance with data collection. We sincerely thank all participants for their valuable time in responding to the survey questionnaires. Special appreciation is extended to the 13 experts who generously contributed their insights and ranked the indicators based on their relative importance in this study.

Conflicts of Interest

The authors declare no conflicts of interest.

Abbreviations

The following abbreviations are used in this manuscript:
CVcoefficient of variation
DRRdisaster risk reduction
H-E-V-Chazard, exposure, vulnerability, and coping capacity
AHPanalytic hierarchy process
MADmean absolute difference
MCDAmulti-criteria decision analysis
MOPMinistry of Planning
MOVEMethods for the Improvement of Vulnerability Assessment in Europe
MOWRAMMinistry of Water Resources and Meteorology
NGOnon-governmental organisation
ROCRank Order Centroid

Appendix A. Flood Risk Assessment Indicators

Table A1. Indicators used for flood risk assessment, including definitions, measurement, data types, sources, and references.
ComponentCodeIndicatorDefinitionMeasurementData TypeData SourceReference
HazardH01Flood frequencyNumber of flood events per year0; 1–2; 3–4; 5–6; 7–10; >10Ranked categoricalSangkat Survey[69,72,95,96]
H02Flood depthFlood depth (m)0; 0–0.5 m; 0.5–1.0 m; 1.0–1.5 m; 1.5–2.0 m; >2.0 mRanked categoricalSangkat Survey[69,72,95]
H03Flood durationDuration of flood events (days)0; <1 day; 1 day–1 week; 1–2 weeks; 2 weeks–1 month; >1 monthRanked categoricalSangkat Survey[69,72,95]
ExposureE01Exposed population% of population in flood-prone areasContinuous (%)PercentageSangkat Survey[16,69,73,97,98]
E02Exposed roads% of road length inundated by floodingContinuous (%)PercentageSangkat Survey[73,97,98,99]
E03Exposed schools% of schools in flood-prone areasContinuous (%)PercentageSangkat Survey[100]
E04Housing value exposureTotal value of housing exposed (USD)Continuous (USD)ContinuousSurvey + CBRE Cambodia [67] and MLMUPC and Habitat [68][100,101]
Community VulnerabilityVC01No evacuation access% households without evacuation accessContinuous (%)PercentageSangkat Survey[72,102]
VC02Solid waste blockage% households affected by drainage blockageContinuous (%)PercentageSangkat Survey[103,104]
VC03Unsafe drinking water% households without safe waterContinuous (%)PercentageSangkat Survey[96,105]
VC04Drainage connectivity% households not connected to drainageContinuous (%)PercentageSangkat Survey[96,106]
VC05Impervious surface ratio% built-up impervious areaContinuous (%)PercentageWorld Bank [52][83,99,107,108,109]
VC06Wetland loss% wetland loss (2003–2017)Continuous (%)PercentageWorld Bank [52][110]
VC07Population densityPopulation per km2Continuous (persons/km2)ContinuousCommune Database (2022) [111][12,112]
VC08Distance to health facilityDistance to nearest clinic/hospital (km)Continuous (km)ContinuousCommune Database 2022 [111][72,112]
Individual VulnerabilityVI01Dependency ratioRatio of dependents to working-age population<0.25; 0.25–0.50; 0.50–0.75; 0.75–1; >1Ranked categoricalHousehold Survey[16,69,73,105]
VI02Elderly populationHousehold members aged >650; 1; 2; >2OrdinalHousehold Survey[99,113,114,115]
VI03Chronic illnessHousehold members with chronic illness0; 1; 2; >2OrdinalHousehold Survey[113,114]
VI04Disability prevalenceHousehold members with disabilities0; 1; 2; >2OrdinalHousehold Survey[110,113,114,115]
VI05Informal housingInformal or non-owned housingNo/YesBinaryHousehold Survey[96,104]
VI06Number of floorsHousing elevation capacity3 + floors; 2; 1 Ranked categoricalHousehold Survey[96,116]
VI07Proximity to waterDistance to river/canal>1 km; 0.5–1 km; 100–500 m; 10–100 m; ≤10 m Ranked categoricalHousehold Survey[48,95]
VI08Poverty statusHousehold below the poverty lineNo/YesBinaryHousehold Survey[16,117]
VI09Unimproved sanitationLack of improved toilet facilitiesNo/YesBinaryHousehold Survey[72,96]
VI10Female-headed householdFemale household headNo/YesBinaryHousehold Survey[24,72,116]
VI11Informal labourIncome from informal employmentContinuous (%)PercentageHousehold Survey[48,118]
VI12Housing tenureOwning vs. Renting No/YesBinaryHousehold Survey[48,95,110,115]
VI13Length of residence (local experience proxy)Duration of residence reflecting familiarity with flood risk and social integration)>30 years; 21–30 years; 11–20 years; 1–10 yearsRanked categoricalHousehold Survey[119,120,121]
Community Coping CapacityCC01DRR supportAvailability of disaster resources (%)Continuous (%)PercentageSangkat Survey[75,122]
CC02Healthcare supportHealth service coverage (%)Continuous (%)PercentageSangkat Survey[16,72,115,123]
CC03Disaster groupsPresence of response groupsNo/YesBinarySangkat Survey[72,75]
CC04Response planningExistence of preparedness plansNo/YesBinarySangkat Survey[72,75]
CC05Training frequencyFrequency of flood trainingNever; Rarely; Sometimes; Often; AlwaysOrdinalSangkat Survey[72,75]
CC06Early warning systemAvailability of warningsNo; Sometimes; YesOrdinalSangkat Survey[75,99]
CC07Hazard map qualityAccuracy and update statusNot accurate; Moderate; Very accurateOrdinalSangkat Survey[70,124]
CC08Wetland restorationNature-based solutionsNo/YesBinarySangkat Survey[73,110]
CC09Tree plantingReforestation activitiesNo/YesBinarySangkat Survey[110]
CC10Emergency sheltersNumber of sheltersCountCountCommune Database 2022 [111][70,123]
Individual Coping CapacityCI01Household incomeMonthly income category<USD 300; 300–600; 600–900; >900OrdinalHousehold Survey[72,73,89]
CI02Access to creditAccess to loans/microfinanceNo/YesBinaryHousehold Survey[72,75,115]
CI03Flood preventionHousehold preparedness measuresContinuous (%)PercentageHousehold Survey[70,101]
CI04Warning receptionTimely receipt of warningsNo; Sometimes; YesOrdinalHousehold Survey[72,125]
CI05Social supportFamily/community supportNo/YesBinaryHousehold Survey[72,75]
CI06House improvementStructural improvementsZinc; Wood; Mixed; ConcreteRanked categoricalHousehold Survey[72,126]
CI07Digital readinessAccess to communication toolsContinuous (%)PercentageHousehold Survey[72,115,127]
CI08Future preparednessPreparedness for future floodsNo/YesBinaryHousehold Survey[72,90]
CI09Insurance coverageAccess to IDPoor/insuranceNo/YesBinaryHousehold Survey[72,75]
CI10Education levelAdult education attainmentContinuous (%)PercentageHousehold Survey[72,75]

References

  1. Cea, L.; Costabile, P. Flood risk in urban areas: Modelling, management and adaptation to climate change. A review. Hydrology 2022, 9, 50. [Google Scholar] [CrossRef]
  2. Jha, A.K.; Bloch, R.; Lamond, J. Cities and Flooding: A Guide to Integrated Urban Flood Risk Management for the 21st Century; World Bank: Washington, DC, USA, 2012; Available online: https://hdl.handle.net/10986/2241 (accessed on 24 January 2025).
  3. Yang, Q.; Zheng, X.; Jin, L.; Lei, X.; Shao, B.; Chen, Y. Research progress of urban floods under climate change and urbanization: A scientometric analysis. Buildings 2021, 11, 628. [Google Scholar] [CrossRef]
  4. Adger, W.N. Vulnerability. Glob. Environ. Change 2006, 16, 268–281. [Google Scholar] [CrossRef]
  5. Winter, A.K.; Karvonen, A. Climate governance at the fringes: Peri-urban flooding drivers and responses. Land Use Policy 2022, 117, 106124. [Google Scholar] [CrossRef]
  6. Lorenzo, T.E.; Kinzig, A.P. Double exposures: Future water security across urban Southeast Asia. Water 2020, 12, 116. [Google Scholar] [CrossRef]
  7. Tierolf, L.; de Moel, H.; van Vliet, J. Modeling urban development and its exposure to river flood risk in Southeast Asia. Comput. Environ. Urban Syst. 2021, 87, 101620. [Google Scholar] [CrossRef]
  8. Shaikh, S.; Kolata, A.L.; Johnson, J.; Binford, M.W. Home and away: Drivers and perceptions of migration among urban migrants and their rural families in the Lower Mekong River Basin of Cambodia. Migr. Dev. 2023, 12, 13–48. [Google Scholar] [CrossRef]
  9. Ricci, L. Linking adaptive capacity and peri-urban features: The findings of a household survey in Dar es Salaam. In Springer Climate; Springer: Cham, Switzerland, 2014; pp. 89–107. [Google Scholar] [CrossRef]
  10. Ricci, L. Peri-urban livelihood and adaptive capacity. Consilience 2019, 21, 121–139. [Google Scholar]
  11. Birkmann, J.; Cardona, O.D.; Carreño, M.L.; Barbat, A.H.; Pelling, M.; Schneiderbauer, S.; Kienberger, S.; Keiler, M.; Alexander, D.; Zeil, P.; et al. Framing vulnerability, risk and societal responses: The MOVE framework. Nat. Hazards 2013, 67, 193–211. [Google Scholar] [CrossRef]
  12. Imamura, Y. Development of a method for assessing country-based flood risk at the global scale. Int. J. Disaster Risk Sci. 2022, 13, 87–99. [Google Scholar] [CrossRef]
  13. Nong, M.; Konishi, T.; Kumagae, T.; Amaguchi, H.; Imamura, Y. Socioeconomic dimensions of dynamic urban flood risk, migration, vulnerability, and coping capacity: The case of peri-urban Phnom Penh, Cambodia. Water 2026, 18, 583. [Google Scholar] [CrossRef]
  14. IPCC. Climate Change 2014: Synthesis Report (AR5); Intergovernmental Panel on Climate Change: Geneva, Switzerland, 2014; Available online: https://www.ipcc.ch/report/ar5/syr/ (accessed on 7 April 2025).
  15. Feng, D.; Shi, X.; Renaud, F.G. Risk assessment for hurricane-induced pluvial flooding in urban areas using a GIS-based multi-criteria approach: A case study of Hurricane Harvey in Houston, USA. Sci. Total Environ. 2023, 904, 166891. [Google Scholar] [CrossRef]
  16. Ikram, Q.D.; Jamalzi, A.R.; Hamidi, A.R.; Ullah, I.; Shahab, M. Flood risk assessment of the population in Afghanistan: A spatial analysis of hazard, exposure, and vulnerability. Nat. Hazards Res. 2024, 4, 46–55. [Google Scholar] [CrossRef]
  17. Scheuer, S.; Haase, D.; Meyer, V. Exploring multicriteria flood vulnerability by integrating economic, social and ecological dimensions of flood risk and coping capacity: From a starting point view towards an end point view of vulnerability. Nat. Hazards 2010, 58, 731–751. [Google Scholar] [CrossRef]
  18. Beco, Y.; Sisay, G. Challenges of mainstreaming institutional policy and frameworks of disaster risk management in Ethiopia. Environ. Hazards 2025, 24, 413–426. [Google Scholar] [CrossRef]
  19. Langill, J.C.; Abizaid, C.; Takasaki, Y.; Coomes, O.T. Integrated multi-scalar analysis of vulnerability to environmental hazards: Assessing extreme flooding in western Amazonia. Glob. Environ. Change 2022, 76, 102585. [Google Scholar] [CrossRef]
  20. Azizi, E.; Mostafazadeh, R.; Hazbavi, Z.; Esmali-Ouri, A.; Mirzaei, S. Geospatial flood risk assessment: Multi-criteria approach integrating hydro-climatic hazard, exposure, vulnerability. Geomat. Nat. Hazards Risk 2025, 16, 2551814. [Google Scholar] [CrossRef]
  21. Cutter, S.L.; Burton, C.G.; Emrich, C.T. Disaster resilience indicators for benchmarking baseline conditions. J. Homel. Secur. Emerg. Manag. 2010, 7, 51. [Google Scholar] [CrossRef]
  22. Birkmann, J.; Cutter, S.L.; Rothman, D.S.; Welle, T.; Garschagen, M.; van Ruijven, B.; O’nEill, B.; Preston, B.L.; Kienberger, S.; Cardona, O.D.; et al. Scenarios for vulnerability: Opportunities and constraints in the context of climate change and disaster risk. Clim. Change 2015, 133, 53–68. [Google Scholar] [CrossRef]
  23. Chen, Y.; Yu, J.; Khan, S. Spatial sensitivity analysis of multi-criteria weights in GIS-based land suitability evaluation. Environ. Model. Softw. 2010, 25, 1582–1591. [Google Scholar] [CrossRef]
  24. Hadipour, V.; Vafaie, F.; Deilami, K. Coastal flooding risk assessment using a GIS-based spatial multi-criteria decision analysis approach. Water 2020, 12, 2379. [Google Scholar] [CrossRef]
  25. Malczewski, J. Ordered weighted averaging with fuzzy quantifiers: GIS-based multicriteria evaluation for land-use suitability analysis. Int. J. Appl. Earth Obs. Geoinf. 2006, 8, 270–277. [Google Scholar] [CrossRef]
  26. Rad, M.; Sonesson, U.; Höglund, E.; Östergren, K. Multi-criteria decision analysis (MCDA) for sustainability assessment–How reliable are the results? Sustain. Futures 2026, 11, 101657. [Google Scholar] [CrossRef]
  27. Orencio, P.M.; Fujii, M. A localized disaster-resilience index to assess coastal communities based on an analytic hierarchy process (AHP). Int. J. Disaster Risk Reduct. 2013, 3, 62–75. [Google Scholar] [CrossRef]
  28. Ahn, B.S. Compatible weighting method with rank order centroid: Maximum entropy ordered weighted averaging approach. Eur. J. Oper. Res. 2011, 212, 552–559. [Google Scholar] [CrossRef]
  29. Hatefi, M.A. An improved rank order centroid method (IROC) for criteria weight estimation: An application in the engine/vehicle selection problem. Informatica 2023, 34, 249–270. [Google Scholar] [CrossRef]
  30. Ahmed, M.N.Q.; Givens, J.E.; Arredondo, A. The links between climate change and migration: A review of South Asian experiences. SN Soc. Sci. 2024, 4, 64. [Google Scholar] [CrossRef]
  31. Ahsan, M.N.; Warner, J. The socioeconomic vulnerability index: A pragmatic approach for assessing climate change led risks—A case study in the south-western coastal Bangladesh. Int. J. Disaster Risk Reduct. 2014, 8, 32–49. [Google Scholar] [CrossRef]
  32. Maharjan, A.; de Campos, R.S.; Singh, C.; Das, S.; Srinivas, A.; Alam Bhuiyan, M.R.; Ishaq, S.; Umar, M.A.; Dilshad, T.; Shrestha, K.; et al. Migration and household adaptation in climate-sensitive hotspots in South Asia. Curr. Clim. Change Rep. 2020, 6, 1–16. [Google Scholar] [CrossRef]
  33. Manandhar, B.; Cui, S.; Wang, L.; Shrestha, S. Urban flood hazard assessment and management practices in South Asia: A review. Land 2023, 12, 627. [Google Scholar] [CrossRef]
  34. Sarmah, T.; Das, S.; Narendr, A.; Aithal, B.H. Assessing human vulnerability to urban flood hazard using the analytic hierarchy process and geographic information system. Int. J. Disaster Risk Reduct. 2020, 50, 101659. [Google Scholar] [CrossRef]
  35. Brandt, R.; Kaenzig, R.; Lachmuth, S. Migration as a risk management strategy in the context of climate change: Evidence from the Bolivian Andes. In Migration, Risk Management and Climate Change: Evidence and Policy Responses. Global Migration Issues; Milan, A., Schraven, B., Warner, K., Cascone, N., Eds.; Springer: Cham, Switzerland, 2016; Volume 6. [Google Scholar] [CrossRef]
  36. Merz, B.; Aerts, J.; Arnbjerg-Nielsen, K.; Baldi, M.; Becker, A.; Bichet, A.; Blöschl, G.; Bouwer, L.M.; Brauer, A.; Cioffi, F.; et al. Floods and climate: Emerging perspectives for flood risk assessment and management. Nat. Hazards Earth Syst. Sci. 2014, 14, 1921–1942. [Google Scholar] [CrossRef]
  37. Paranunzio, R.; Guerrini, M.; Dwyer, E.; Alexander, P.J.; O’Dwyer, B. Assessing coastal flood risk in a changing climate for Dublin, Ireland. J. Mar. Sci. Eng. 2022, 10, 1715. [Google Scholar] [CrossRef]
  38. Ramos, E.P.; de Salles Cavedon-Capdeville, F. Regional responses to climate change and migration in Latin America. In Research Handbook on Climate Change, Migration and the Law; Edward Elgar Publishing: Cheltenham, UK, 2017. [Google Scholar] [CrossRef]
  39. Flower, B. Cambodia’s Urbanisation: Key Trends and Policy Priorities; CDRI: Phnom Penh, Cambodia, 2012; Available online: https://cdri.org.kh/publication/cambodia-s-urbanisation-key-trends-and-policy-priorities (accessed on 26 December 2025).
  40. Liu, Z.; Balk, D. Urbanisation and differential vulnerability to coastal flooding among migrants and nonmigrants in Bangladesh. Popul. Space Place 2020, 26, e2334. [Google Scholar] [CrossRef]
  41. Mialhe, F.; Gunnell, Y.; Navratil, O.; Choi, D.; Sovann, C.; Lejot, J.; Gaudou, B.; Se, B.; Landon, N. Spatial growth of Phnom Penh, Cambodia (1973–2015): Patterns, rates, and socio-ecological consequences. Land Use Policy 2019, 87, 104061. [Google Scholar] [CrossRef]
  42. Son, T.N.; Trang, N.T.T.; Bui, X.T.; Da, C.T. Remote sensing and GIS for urbanization and flood risk assessment in Phnom Penh, Cambodia. Geocarto Int. 2022, 37, 6625–6642. [Google Scholar] [CrossRef]
  43. Heng, S.; Ly, S.; Chhem, S.; Kruy, P. Analysis of public perceptions on urban flood in Phnom Penh, Cambodia. In Water Security in Asia. Springer Water; Babel, M., Haarstrick, A., Ribbe, L., Shinde, V.R., Dichtl, N., Eds.; Springer: Cham, Switzerland, 2021; pp. 687–701. [Google Scholar] [CrossRef]
  44. Lee, Y.; Pal, I.; Sopath, S.; Baskota, A. Assessing urban resilience for climate disasters in Phnom Penh, Cambodia. In Springer Climate; Springer: Singapore, 2025; pp. 189–214. [Google Scholar] [CrossRef]
  45. Horton, A.J.; Triet, N.V.K.; Hoang, L.P.; Heng, S.; Hok, P.; Chung, S.; Koponen, J.; Kummu, M. The Cambodian Mekong floodplain under future development plans and climate change. Nat. Hazards Earth Syst. Sci. 2022, 22, 967–983. [Google Scholar] [CrossRef]
  46. Kumagae, T.; Nong, M.; Konishi, T.; Amaguchi, H.; Imamura, Y. Enhancing flood inundation simulation under rapid urbanisation and data scarcity: The case of the lower Prek Thnot River Basin, Cambodia. Water 2025, 17, 3222. [Google Scholar] [CrossRef]
  47. Nguon, V.; Kawamura, K.; Trong, D.P.; On, N.V.; Gong, Z.; Lim, J.; Khom, S.; Bunly, C. MODIS-based investigation of flood areas in Southern Cambodia from 2002–2013. Environments 2019, 6, 57. [Google Scholar] [CrossRef]
  48. Nop, S.; Thornton, A. Urban resilience building in modern development: A case of Phnom Penh City, Cambodia. Ecol. Soc. 2019, 24, 23. [Google Scholar] [CrossRef]
  49. Heng, S.; Kheav, K.; Hok, P.; Chhuon, K.; Ly, S.; Kinouchi, T. Urban flood modeling in Phnom Penh using Flo-2D: Consideration of climate change effect. Techno-Sci. Res. J. 2021, 9, 33–40. [Google Scholar]
  50. Srey, S.; Yaguchi, T. Peri-urban landscape interface contribution to flood management of the metropolis, the case of Phnom Penh. J. Archit. Plan. 2023, 88, 1648–1659. [Google Scholar] [CrossRef]
  51. Huang, W.; Park, E.; Wang, J.; Sophal, T. The changing rainfall patterns drive the growing flood occurrence in Phnom Penh, Cambodia. J. Hydrol. Reg. Stud. 2024, 55, 101945. [Google Scholar] [CrossRef]
  52. GAF AG and Partners. Earth Observation for Sustainable Development: Urban Phnom Penh Operations Report; GAF AG: Phnom Penh, Cambodia, 2019; Available online: https://datacatalog.worldbank.org/search/dataset/0038964/phnom-penh-cambodia-land-use-land-cover-maps-esa-eo4sd-urban (accessed on 24 May 2025).
  53. Asif, F.; Beckwith, L.; Ngin, C. People and politics: Urban climate resilience in Phnom Penh, Cambodia. Front. Sustain. Cities 2023, 4, 972173. [Google Scholar] [CrossRef]
  54. Sahmakum Teang Tnaut. The Phnom Penh Survey 2023: A Study on Urban Settlements in Phnom Penh; STT: Phnom Penh, Cambodia, 2023; Available online: https://teangtnaut.org/en/research/reports/the-phnom-penh-survey-in-2023-a-study-on-urban-settlements-in-phnom-penh (accessed on 7 May 2025).
  55. Beckwith, L.; Marschke, M.; Darbari, V.; Hackney, C.R. Exploring how sand infill is transforming Phnom Penh’s Tompun-Cheung Ek wetland. Extr. Ind. Soc. 2025, 24, 101713. [Google Scholar] [CrossRef]
  56. Hak, K. Flood risk management in Phnom Penh, Cambodia. In Cross-Cultural Perspectives on Climate Change Adaptation; Kim, K.G., Atkin, C., Eds.; Springer: Cham, Switzerland, 2024; pp. 197–210. [Google Scholar] [CrossRef]
  57. Sahmakum Teang Tnaut. Access to Public Services and the Impact of Climate Change: Analysis of Six Urban Poor Resettlement Locations in Phnom Penh and Kandal; STT: Phnom Penh, Cambodia, 2023; Available online: https://teangtnaut.org/en/research/reports/access-to-public-service-and-the-impact-of-climate-change-analysis-of-six-urban-poor-resettlement-locations-in-phnom-penh-and-kandal (accessed on 7 June 2025).
  58. Marks, D.; Baird, G.I. The urban political ecology of worsening flooding in Phnom Penh, Cambodia. Int. J. Disaster Risk Reduct. 2025, 118, 105229. [Google Scholar] [CrossRef]
  59. Laot, D.; Ly, V. Socio-Dynamic Study of the Phnom Penh Urban Poor Communities; Planète Enfants & Développement Cambodia: Phnom Penh, Cambodia, 2020; Available online: https://planete-eed.org/wp-content/uploads/2020/12/Cambodia_sociodynamic-study_phnom-penh_dec2020-min.pdf (accessed on 15 June 2025).
  60. Khan, L. An economic assessment of urban flooding in Cambodia: A case study of Phnom Penh. Cambodia J. Basic Appl. Res. 2019, 1, 149. [Google Scholar] [CrossRef]
  61. Seak, S.; Sok, T.; Sponn, V.; Phat, C.; Tep, M.; Ilan, I.; Kao, C.; Seak, S. Socio-economic Impacts of Flooding on Urban Ecosystem in Southern Phnom Penh: A Case Study in Khan Kamboul, Dangkao, Pur Senchey and Mean Chey. Cambodia J. Basic Appl. Res. 2025, 7, 1. [Google Scholar] [CrossRef]
  62. Flower, B.; Fortnam, M.; Kol, L.; Sasin, P.; Wood, R.G. Using participatory methods to uncover interacting urban risks: A case study of three informal settlements in Phnom Penh, Cambodia. Environ. Urban. 2018, 30, 301–316. [Google Scholar] [CrossRef]
  63. Flower, B.; Fortnam, M. Urbanising Disaster Risk: Vulnerability of the Urban Poor in Cambodia to Flooding and Other Hazards; People in Need: Phnom Penh, Cambodia, 2015; Available online: https://reliefweb.int/report/cambodia/urbanising-disaster-risks-vulnerability-urban-poor-cambodia-flooding-and-other (accessed on 29 July 2025).
  64. Revi, A.; Satterthwaite, D.; Aragón-Durand, F.; Corfee-Morlot, J.; Kiunsi, R.B.R.; Pelling, M.; Roberts, D.; Solecki, W.; Gajjar, S.P.; Sverdlik, A. Towards transformative adaptation in cities: The IPCC’s Fifth Assessment. Environ. Urban. 2014, 26, 11–28. [Google Scholar] [CrossRef]
  65. Few, R.; Ramírez, V.; Armijos, M.T.; Hernández, L.A.Z.; Marsh, H. Moving with risk: Forced displacement and vulnerability to hazards in Colombia. World Dev. 2021, 144, 105482. [Google Scholar] [CrossRef]
  66. Yamane, T. Statistics: An Introductory Analysis, 3rd ed.; Harper and Row: New York, NY, USA, 1973. [Google Scholar]
  67. CBRE Cambodia. Average Land Price in Phnom Penh by District in H2 2024; CBRE Cambodia: Phnom Penh, Cambodia, 2024; Available online: https://aps.com.kh/wp-content/uploads/2024/11/Average-Land-Price-_PDF.pdf?download=2025-03-13 (accessed on 25 November 2025).
  68. MLMUPC; Habitat for Humanity Cambodia. Overview of Urban Housing for Low-Income Households in Cambodia; MLMUPC: Phnom Penh, Cambodia, 2024; Available online: https://habitatcambodia.org/wp-content/uploads/2025/02/En-Overview_of_Urban_Housing_for_Low_Income_Households_in_Cambodia.pdf (accessed on 25 November 2025).
  69. Erena, S.H.; Worku, H. Urban flood vulnerability assessments: The case of Dire Dawa city, Ethiopia. Nat. Hazards 2019, 97, 495–516. [Google Scholar] [CrossRef]
  70. Giannakidou, C.; Diakoulaki, D.; Memos, C.D. Vulnerability to coastal flooding of industrial urban areas in Greece. Environ. Process. 2020, 7, 749–766. [Google Scholar] [CrossRef]
  71. Rana, I.A.; Jayant, K.R. Socioeconomic vulnerability assessment: A case study of flood prone urban communities of Pakistan. In Disaster Risk Reduction in Urban Communities; Springer: Berlin/Heidelberg, Germany, 2020; pp. 123–139. [Google Scholar] [CrossRef]
  72. Rana, I.A.; Routray, J.K. Integrated methodology for flood risk assessment in urban communities of Pakistan. Nat. Hazards 2018, 91, 239–266. [Google Scholar] [CrossRef]
  73. Shah, M.A.R.; Wang, X. Assessing social-ecological vulnerability and risk to coastal flooding. Int. J. Disaster Risk Reduct. 2024, 106, 104450. [Google Scholar] [CrossRef]
  74. OECD/European Union/EC-JRC. Handbook on Constructing Composite Indicators: Methodology and User Guide; OECD Publishing: Paris, France, 2008. [Google Scholar] [CrossRef]
  75. Thanvisitthpon, N.; Shrestha, S.; Pal, I.; Ninsawat, S.; Chaowiwat, W. Assessment of flood adaptive capacity of urban areas in Thailand. Environ. Impact Assess. Rev. 2020, 81, 106363. [Google Scholar] [CrossRef]
  76. Li, F.; Phoon, K.K.; Du, X.; Zhang, M. Improved AHP method and its application in risk identification. J. Constr. Eng. Manag. 2013, 139, 312–320. [Google Scholar] [CrossRef]
  77. Saaty, T.L. Decision making with the analytic hierarchy process. Int. J. Serv. Sci. 2008, 1, 83–98. [Google Scholar] [CrossRef]
  78. Barron, F.H.; Barrett, B.E. The efficacy of SMARTER—Simple multi-attribute rating technique extended to ranking. Acta Psychol. 1996, 93, 23–36. [Google Scholar] [CrossRef]
  79. Roszkowska, E. Rank ordered criteria weighting methods: A comparative overview. Optim. Stud. Econ. 2013, 5, 14–33. [Google Scholar] [CrossRef]
  80. De Brito, M.M.; Evers, M. Multi-criteria decision-making for flood risk management: A survey of the current state of the art. Nat. Hazards Earth Syst. Sci. 2016, 16, 1019–1033. [Google Scholar] [CrossRef]
  81. Saaty, T.L. Some mathematical concepts of the analytic hierarchy process. Behaviormetrika 1991, 18, 1–9. [Google Scholar] [CrossRef]
  82. Anderson, C.C.; Renaud, F.G.; Hagenlocher, M.; Day, J.W. Assessing multi-hazard vulnerability and dynamic coastal flood risk in the mississippi delta: The global delta risk index as a social-ecological systems approach. Water 2021, 13, 577. [Google Scholar] [CrossRef]
  83. Lee, J.S.; Choi, H.I. Comparison of flood vulnerability assessments to climate change by construction frameworks for a composite indicator. Sustainability 2018, 10, 768. [Google Scholar] [CrossRef]
  84. Choi, H.I. Assessment of aggregation frameworks for composite indicators in measuring flood vulnerability to climate change. Sci. Rep. 2019, 9, 19371. [Google Scholar] [CrossRef]
  85. Gigović, L.; Pamučar, D.; Bajić, Z.; Drobnjak, S. Application of GIS-interval rough AHP methodology for flood hazard mapping in urban areas. Water 2017, 9, 360. [Google Scholar] [CrossRef]
  86. Kara, R.; Singh, P. Flood assessment for Lower Godavari basin using the application of GIS-based analytical hierarchy process. Int. J. Syst. Assur. Eng. Manag. 2024, 1–23. [Google Scholar] [CrossRef]
  87. Slocum, T.A.; McMaster, R.B.; Kessler, F.C.; Howard, H.H. Thematic Cartography and Geovisualization, 4th ed.; CRC Press: Boca Raton, FL, USA, 2022. [Google Scholar] [CrossRef]
  88. Councils of Sangkats. Records of Flood Impacts of Sangkats (2012–2024); Unpublished Data; Councils of Sangkats.: Phnom Penh, Cambodia, 2025. [Google Scholar]
  89. Brouwer, R.; Akter, S.; Brander, L.; Haque, E. Socioeconomic vulnerability and adaptation to environmental risk: A case study of climate change and flooding in Bangladesh. Risk Anal. 2007, 27, 313–326. [Google Scholar] [CrossRef]
  90. Rahman, M.M.; Shobuj, I.A.; Islam, R.; Islam, R.; Hossain, T.; Alam, E.; Al Hattawi, K.S.; Islam, K. Flood preparedness in rural flood-prone areas: A holistic assessment approach in Bangladesh. Geomat. Nat. Hazards Risk 2024, 15, 2379599. [Google Scholar] [CrossRef]
  91. Arnold, C.L.; Gibbons, C.J. Impervious Surface Coverage: The Emergence of a Key Environmental Indicator. J. Am. Plan. Assoc. 1996, 62, 243–258. [Google Scholar] [CrossRef]
  92. Brabec, E.A. Imperviousness and Land-Use Policy: Toward an Effective Approach to Watershed Planning. J. Hydrol. Eng. 2009, 14, 425–433. [Google Scholar] [CrossRef]
  93. Zhang, Y.; Slaughter, D.C.; Staab, E.S. Robust Hyperspectral Vision-Based Classification for Multi-Season Weed Mapping. ISPRS J. Photogramm. Remote Sens. 2012, 69, 65–73. [Google Scholar] [CrossRef]
  94. Open Development Cambodia (ODC). Administrative Boundary Phnom Penh District 2012 [Shapefile]. 2012. Available online: https://data.opendevelopmentcambodia.net/en/dataset/administrative-boundary-phnom-penh-district-2012 (accessed on 24 May 2025).
  95. Esariti, L.; Handayani, W.; Sunarti; Purnomo, M.S. Vulnerability assessment of tidal flood prone disaster settlement of Muarareja Tegal. IOP Conf. Ser. Earth Environ. Sci. 2024, 1394, 012036. [Google Scholar] [CrossRef]
  96. Salami, R.O.; von Meding, J.K.; Giggins, H. Urban settlements’ vulnerability to flood risks in African cities: A conceptual framework. Jàmbá J. Disaster Risk Stud. 2017, 9, 370. [Google Scholar] [CrossRef][Green Version]
  97. Papilloud, T.; Röthlisberger, V.; Loreti, S.; Keiler, M. Flood exposure analysis of road infrastructure–Comparison of different methods at national level. Int. J. Disaster Risk Reduct. 2020, 47, 101548. [Google Scholar] [CrossRef]
  98. Singh, P.; Sinha, V.S.P.; Vijhani, A.; Pahuja, N. Vulnerability assessment of urban road networks from urban flood. Int. J. Disaster Risk Reduct. 2018, 28, 237–250. [Google Scholar] [CrossRef]
  99. Leis, J.L.; Kienberger, S. Climate risk and vulnerability assessment of floods in Austria: Mapping homogenous regions, hotspots and typologies. Sustainability 2020, 12, 6458. [Google Scholar] [CrossRef]
  100. Yousefi, S.; Pourghasemi, H.R.; Emami, S.N.; Rahmati, O.; Tavangar, S.; Pouyan, S.; Tiefenbacher, J.P.; Shamsoddini, S.; Nekoeimehr, M. Assessing susceptibility of schools to flood events in Iran. Sci. Rep. 2020, 10, 18114. [Google Scholar] [CrossRef]
  101. Park, K.; Lee, M.H. The development and application of the urban flood risk assessment model for reflecting upon urban planning elements. Water 2019, 11, 920. [Google Scholar] [CrossRef]
  102. Ermagun, A.; Smith, V.; Janatabadi, F. High urban flood risk and no shelter access disproportionally impacts vulnerable communities in the USA. Commun. Earth Environ. 2024, 5, 2. [Google Scholar] [CrossRef]
  103. Majumder, T.; Chakraborty, P.; Das, B. Management of urban flood-induced solid waste in some metropolitan cities: An overview. In Effective Waste Management and Circular Economy; CRC Press: Boca Raton, FL, USA, 2022; pp. 255–266. [Google Scholar] [CrossRef]
  104. Zehra, D.; Mbatha, S.; Campos, L.C.; Queface, A.; Beleza, A.; Cavoli, C.; Achuthan, K.; Parikh, P. Rapid flood risk assessment of informal urban settlements in Maputo, Mozambique: The case of Maxaquene A. Int. J. Disaster Risk Reduct. 2019, 40, 101270. [Google Scholar] [CrossRef]
  105. Tascón-González, L.; Ferrer-Julià, M.; Ruiz, M.; García-Meléndez, E. Social vulnerability assessment for flood risk analysis. Water 2020, 12, 558. [Google Scholar] [CrossRef]
  106. Bathrellos, G.D.; Karymbalis, E.; Skilodimou, H.D.; Gaki-Papanastassiou, K.; Baltas, E.A. Urban flood hazard assessment in Athens metropolitan city, Greece. Environ. Earth Sci. 2016, 75, 319. [Google Scholar] [CrossRef]
  107. Xu, T.; Xie, Z.; Zhao, F.; Li, Y.; Yang, S.; Zhang, Y.; Yin, S.; Chen, S.; Li, X.; Zhao, S.; et al. Permeability control and flood risk assessment of urban underlying surface: A case study of Runcheng south area, Kunming. Nat. Hazards 2021, 111, 661–686. [Google Scholar] [CrossRef]
  108. Armenakis, C.; Du, E.X.; Natesan, S.; Persad, R.A.; Zhang, Y. Flood risk assessment in urban areas based on spatial analytics and social factors. Geosciences 2017, 7, 123. [Google Scholar] [CrossRef]
  109. Li, C.; Cheng, X.; Li, N.; Du, X.; Yu, Q.; Kan, G. A framework for flood risk analysis and benefit assessment of flood control measures in urban areas. Int. J. Environ. Res. Public Health 2016, 13, 787. [Google Scholar] [CrossRef]
  110. Kotzee, I.; Reyers, B. Piloting a social-ecological index for measuring flood resilience: A composite index approach. Ecol. Indic. 2016, 60, 45–53. [Google Scholar] [CrossRef]
  111. Ministry of Planning (MOP). Commune Database: 2022; Unpublished Dataset; Ministry of Planning (MOP) Commune Database: Phnom Penh, Cambodia, 2022.
  112. Taromideh, F.; Fazloula, R.; Choubin, B.; Emadi, A.; Berndtsson, R. Urban flood-risk assessment: Integration of decision-making and machine learning. Sustainability 2022, 14, 4483. [Google Scholar] [CrossRef]
  113. Garbutt, K.; Ellul, C.; Fujiyama, T. Mapping social vulnerability to flood hazard in Norfolk, England. Environ. Hazards 2015, 14, 156–186. [Google Scholar] [CrossRef]
  114. Percival, S.E.; Gaterell, M.; Hutchinson, D. Effective flood risk visualisation. Nat. Hazards 2020, 104, 375–396. [Google Scholar] [CrossRef]
  115. Allen, S.K.; Ballesteros-Cánovas, J.; Randhawa, S.S.; Singha, A.K.; Huggel, C.; Stoffel, M. Translating the concept of climate risk into an assessment framework to inform adaptation planning: Insights from a pilot study of flood risk in Himachal Pradesh, Northern India. Environ. Sci. Policy 2018, 87, 1–10. [Google Scholar] [CrossRef]
  116. Karunarathne, A.Y.; Lee, G. Developing a multi-facet social vulnerability measure for flood disasters at the micro-level assessment. Int. J. Disaster Risk Reduct. 2020, 49, 101679. [Google Scholar] [CrossRef]
  117. Rayhan, M.I. Assessing poverty, risk and vulnerability: A study on flooded households in rural Bangladesh. J. Flood Risk Manag. 2010, 3, 18–24. [Google Scholar] [CrossRef]
  118. Moghadas, M.; Asadzadeh, A.; Vafeidis, A.; Fekete, A.; Kötter, T. Multi-criteria approach for assessing urban flood resilience in Tehran, Iran. Int. J. Disaster Risk Reduct. 2019, 35, 101069. [Google Scholar] [CrossRef]
  119. Seebauer, S.; Winkler, C. Should I stay or should I go? Factors in household decisions for or against relocation from a flood risk area. Glob. Environ. Change 2020, 60, 102018. [Google Scholar] [CrossRef]
  120. Shah, A.A.; Ye, J.; Shaw, R.; Ullah, R.; Ali, M. Factors affecting flood-induced household vulnerability and health risks in Pakistan: The case of Khyber Pakhtunkhwa (KP) Province. Int. J. Disaster Risk Reduct. 2020, 42, 101341. [Google Scholar] [CrossRef]
  121. Bhattacharjee, K.; Behera, B. Determinants of household vulnerability and adaptation to floods: Empirical evidence from the Indian State of West Bengal. Int. J. Disaster Risk Reduct. 2018, 31, 758–769. [Google Scholar] [CrossRef]
  122. Adelekan, I.O. Vulnerability of poor urban coastal communities in Lagos, Nigeria. Environ. Urban. 2010, 22, 433–450. [Google Scholar] [CrossRef]
  123. Zhou, X.; Wang, S.; Yao, S.; Fang, L. Influence of urban flooding on the spatial equity of access to emergency medical services among nursing homes in Shanghai. Land 2025, 14, 309. [Google Scholar] [CrossRef]
  124. Jamshed, A.; Puriya, A.; Puriya, A.; Iqbal, N.; Rana, I.A.; McMillan, J.M.; Pandey, R.; Altaf, S.; Mehmood, R.T.; bin Saad, U. Flood resilience assessment from the perspective of urban (in)formality in Surat, India: Implications for sustainable development. Nat. Hazards 2024, 120, 9297–9326. [Google Scholar] [CrossRef]
  125. Acosta-Coll, M.; Ballester-Merelo, F.; Martinez-Peiró, M.; De la Hoz-Franco, E. Real-time early warning system design for pluvial floods—A Review. Sensors 2018, 18, 2255. [Google Scholar] [CrossRef]
  126. Lianxiao; Morimoto, T.; Jin, H.; Tong, S.; Bao, Y. Assessment of flood risk of residential buildings using AHP-CRITIC method: A case study of the Katsushika Ward, Tokyo. Buildings 2025, 15, 2016. [Google Scholar] [CrossRef]
  127. Sawangnate, C.; Chaisri, B.; Kittipongvises, S. Flood hazard mapping and flood preparedness literacy of the elderly population residing in Bangkok, Thailand. Water 2022, 14, 1268. [Google Scholar] [CrossRef]
Figure 1. Conceptual Framework on Dynamic Flood Risk.
Water 18 01152 g001
Figure 2. Spatial distribution of study Sangkats with elevation (in metres above sea level) from FABDEM V1-2. Major rivers, the Lower Prek Thnot River Basin, and surveyed households by settlement duration are shown. Relief shading depicts metropolitan topography.
Water 18 01152 g002
Figure 3. ROC-Weighed Moderate Variation Composite Hazard Index Among Sangkats.
Water 18 01152 g003
Figure 4. ROC-Weighed Spatial Variation in Exposure: Concentration of Population and Assets Drives Flood Risk in Dangkao and Chaom Chau Ti2.
Water 18 01152 g004
Figure 5. ROC-Weighed Vulnerability and Coping Capacity at the Community and Individual Level by Sangkat.
Water 18 01152 g005
Figure 6. ROC-Weighed Flood Risk Components by Sangkat.
Water 18 01152 g006
Figure 7. ROC-weighted Vulnerability and Coping Capacity at the Community and Individual Level by Migrant Group.
Water 18 01152 g007
Figure 8. ROC-Weighed Flood Risk Components by Migrant Group.
Water 18 01152 g008
Table 1. Key Characteristics of the Four Peri-Urban Sangkats.
SangkatElevation (m)Urbanisation (ha)Wetlands Retained (ha)Flood ExposureDrainage Capacity
Dangkao9.8210340HighPoor
Chaom Chau Ti210.01115480ModerateModerate
Cheung Aek9.8713890HighPoor
Prey Veaeng13.71290639LowWeak
Note: Source: Adapted from Nong et al. (2026) [13].
Table 2. Sample Size Allocation by Sangkat.
SangkatHouseholdsSample Size (Target)Collected
Dangkao15,172179183
Cheung Aek5410103107
Prey Veaeng2047101114
Chaom Chau Ti210,873128156
Total33,502511560
Notes: Initial proportional allocations for Cheung Aek (≈64) and Prey Veaeng (≈24) were increased to 103 and 101, respectively, to ensure adequate statistical reliability. Overall, 511 households were targeted, of which 560 were successfully surveyed.
Table 3. List of Experts and Their Expertise.
No.ExpertiseInstitutionCountry
1Green city and environmental economicsUniversityCambodia
2Urban and climate resilienceUniversityCambodia
3Hydrologist and urban flood modellingResearch InstituteCambodia
4Hydrology and river basinNGOCambodia
5Hydrology and river basinUniversityCambodia
6Flood risk and social vulnerability assessmentPrivate SectorPhilippines
7Urban developmentUniversityCambodia
8Flood risk and social vulnerability assessmentUniversityCambodia
9Urban climate resilienceUniversityCambodia
10Hydrology and river basinGovernmentCambodia
11Hydrology and river basinUniversityCambodia
12Climate change, forest managementUniversityCambodia
13Flood hazard modelling, hydrology, and disaster risk managementUniversityCambodia
Disclaimer/Publisher’s Note: The statements, opinions and data contained in all publications are solely those of the individual author(s) and contributor(s) and not of MDPI and/or the editor(s). MDPI and/or the editor(s) disclaim responsibility for any injury to people or property resulting from any ideas, methods, instructions or products referred to in the content.