1. Introduction
Access to safe water intended for human consumption is a fundamental requirement for public health and a central component of the One Health framework, which emphasizes the interdependence between environmental quality and human well-being [
1,
2]. Ensuring water safety requires not only compliance with regulatory standards but also continuous assessment of contaminants that may pose risks to human populations. Among these, trace metals remain of particular concern due to their toxicity, persistence, and potential to accumulate in biological systems, even at low concentrations [
3,
4,
5].
Trace metals such as arsenic (As), cadmium (Cd), chromium (Cr), lead (Pb), manganese (Mn), nickel (Ni), and selenium (Se) originate from both natural (geogenic) and anthropogenic sources. Geological formations, particularly in sedimentary basins, can naturally enrich groundwater with elements such as arsenic, while human activities may further contribute to contamination [
3,
4,
6]. Chronic exposure through ingestion has been associated with multiple adverse health outcomes, including carcinogenic effects and systemic toxicity [
5,
7,
8].
The assessment of health risks associated with trace metals in water intended for human consumption has become a priority in both research and regulatory contexts. International guidelines, such as those developed by the World Health Organization, and European legislation, including Directive (EU) 2020/2184, promote risk-based approaches to water quality monitoring and management [
9,
10]. In addition, established methodologies for human health risk assessment, such as those provided by the U.S. Environmental Protection Agency, support the evaluation of both carcinogenic and non-carcinogenic risks associated with environmental exposure [
11,
12].
In many regions of Eastern Europe, groundwater represents a primary source of drinking water, particularly in rural areas where centralized supply systems are limited. Within the Pannonian Basin, geogenic arsenic contamination in reducing aquifers is well documented and is commonly associated with the reductive dissolution of Fe-oxyhydroxides under methanogenic or sulfate-reducing conditions [
3,
6]. In southwestern Romania (Timiș–Bega area, Western Banat), arsenic concentrations as high as 168–364 µg/L have been reported in groundwater, reflecting strongly reducing hydrogeochemical environments [
13,
14]. Similar patterns of geogenic enrichment have also been identified in northwestern Romania, including Satu Mare County, where studies on private wells have highlighted spatial variability and the occurrence of elevated arsenic concentrations [
15,
16].
While these studies provide important evidence of regional contamination, most have focused on specific localities, individual elements (primarily arsenic), or single sampling campaigns. Comprehensive assessments integrating multi-element analysis, spatial–temporal variability, and human health risk evaluation across both urban and rural water supply systems remain comparatively limited at the regional scale in Romania.
Therefore, the aim of this study was to provide a multi-year (2022–2024), multi-element assessment of trace metals (As, Cd, Cr, Mn, Ni, Pb, and Se) in water intended for human consumption in Satu Mare County, Romania, by integrating spatial–temporal analysis with human health risk assessment and explicitly comparing centralized urban supply systems with decentralized rural groundwater sources.
2. Materials and Methods
2.1. Data Source and Study Design
This retrospective observational study was conducted in Satu Mare County (northwestern Romania) using routine water quality monitoring data collected between 2022 and 2024 by the Public Health Directorate of Satu Mare County as part of the National Drinking Water Surveillance Program. Additional analyses performed upon request by individuals or local authorities were also included in the dataset. The use of the dataset for scientific purposes was authorized by the competent public health authority.
The unit of analysis was the individual sample. The final dataset comprised 271 samples collected from 122 localities across Satu Mare County, including 116 samples in 2022, 64 in 2023, and 91 in 2024. Localities were classified as urban or rural according to official administrative status under Romanian territorial organization (urban: municipalities/towns; rural: communes and affiliated villages). Based on this classification, the dataset included 98 rural and 18 urban samples in 2022, 56 rural and 8 urban samples in 2023, and 81 rural and 10 urban samples in 2024.
Sampling locations reflected the heterogeneous water-supply structure of the county and included samples from centralized public distribution networks (n = 181), private sources (n = 15; e.g., private wells), sampling points at system entry or exit (n = 2), and records with an unspecified source type (n = 73). All samples, including those with an unspecified source type, were classified as urban or rural based on locality. Records with unspecified source types were retained to preserve dataset completeness and avoid selective exclusion bias. A sensitivity analysis restricted to samples with known source type (n = 181) confirmed that the overall statistical patterns and risk estimates were not materially affected. For exposure assessment, all samples were considered representative of water used for human consumption at the household level.
Satu Mare County lies within the hydrogeological context of the Pannonian Basin, characterized by sedimentary aquifers, variable redox conditions, and groundwater–rock interactions that may influence the natural occurrence and mobility of trace elements. Urban populations are predominantly supplied through centralized distribution systems subject to routine monitoring, whereas rural populations rely to a greater extent on locally managed or decentralized water sources.
Data curation included harmonization of units (µg/L), verification of sampling year and locality identifiers, and removal of duplicate records where applicable. Concentrations reported below the analytical limit of detection (LOD) were substituted with LOD/2 for statistical analyses and risk assessment calculations. Records missing essential metadata (sampling year or concentration value) were excluded. All analyses were conducted on anonymized monitoring data, without processing personal information.
Because the dataset is derived from routine monitoring and request-based sampling, the set of sampled localities varies between years and does not represent a fixed sampling network. Consequently, differences in sample size and spatial coverage occur between years and reflect the structure of the monitoring system rather than a predefined study design. Therefore, interannual differences in summary statistics should not be interpreted as temporal trends at the same locations, but rather as variations influenced by sampling coverage, including the inclusion of additional private groundwater sources (e.g., wells) in certain years.
The higher number of rural samples reflects the greater reliance on decentralized water sources and the inclusion of request-based sampling. Accordingly, the analysis focuses on structural comparisons (urban vs. rural systems) rather than temporal trend evaluation.
2.2. Chemical Analysis
Concentrations of As, Cd, Cr, Mn, Ni, Pb, and Se were determined by high-resolution continuum source graphite furnace atomic absorption spectrometry (HR-CS GFAAS) using a contrAA 800 D instrument (Analytik Jena GmbH, Jena, Germany). Analyses were performed by a RENAR-accredited laboratory in accordance with SR EN ISO 15586:2004 [
17].
Water samples were preserved by acidification with Suprapur® grade, 65% nitric acid (HNO3) (Merck KGaA, Darmstadt, Germany) immediately after collection and analyzed within 14 days. For mineralization, 10 mL of sample was digested with 3 mL of concentrated HNO3 using microwave-assisted digestion (START D, Milestone, Sorisole Italy) up to 200 °C. Digests were diluted to volume with ultrapure water (18.2 MΩ·cm) produced using a Milli-Q® system (Merck Millipore, Darmstadt, Germany).
Calibration was performed using five-point external calibration curves within the linear range of the instrument (R2 > 0.995). Analytical precision (RSD) was below 5% for all analytes. Each sample was analyzed in duplicate. Calibration standard solutions were prepared from Certipur® single-element standard solutions (Merck KGaA, Darmstadt, Germany), with concentrations covering the linear range of the instrument for each analyte.
Quality control included procedural blanks and certified reference materials (Certipur®, Merck KGaA, Darmstadt, Germany). Recoveries ranged between 95% and 105% for all analytes, confirming analytical accuracy. Measurement uncertainty was estimated at 10% for all analytes.
Potential matrix effects were evaluated using the standard addition method (n = 10), and no significant interferences were observed. For arsenic determination by HR-CS GFAAS, no hydride generation step was involved, and no spectral or chemical interferences were identified under the applied analytical conditions.
Limits of detection (LOD) and quantification (LOQ) are presented in
Table 1. LOD and LOQ were calculated as 3σ and 10σ of blank measurements, respectively, in accordance with IUPAC recommendations. All elements were analyzed using the same standardized method (SR EN ISO 15586:2004) [
17].
2.3. Health Risk Assessment
Human health risk associated with exposure to trace metals via ingestion of water intended for human consumption was evaluated following the methodology recommended by the U.S. Environmental Protection Agency (US EPA) Risk Assessment Guidance for Superfund (RAGS), using toxicological reference values from the Integrated Risk Information System (IRIS) and ATSDR databases [
11,
18,
19]. Exposure parameters applied in the present study are summarized in
Table 2.
Non-carcinogenic risk was assessed for both adults and children using chronic daily intake (CDI) and the health risk index (HRI), following US EPA human health risk assessment frameworks [
11].
The general equation for CDI is:
where the parameters are defined according to US EPA guidance [
11].
For non-carcinogenic effects, averaging time equals exposure duration (AT = ED × 365). Assuming continuous daily exposure (EF = 365 days/year), the equation simplifies to:
The health risk index (HRI) was calculated as:
where RfD represents the oral reference dose for each metal obtained from the US EPA IRIS database and ATSDR toxicological profiles [
18,
19].
Lead (Pb) was not included in the HRI assessment due to the absence of an established oral reference dose (RfD) within the US EPA IRIS framework, as no safe exposure threshold has been identified [
18]. Instead, Pb risk assessment is typically conducted using biokinetic models such as the Integrated Exposure Uptake Biokinetic (IEUBK) model, which require detailed exposure parameters (e.g., age-specific intake, environmental sources, and blood lead calibration data) [
20] that were not available in the present study.
To provide a screening-level perspective, Pb concentrations were evaluated against the national maximum admissible concentration (CMA = 10 µg/L). In addition, a supplementary hazard quotient (HQ) was estimated using the EFSA benchmark dose lower confidence limit (BMDL01 = 1.50 µg/kg body weight/day) for systolic blood pressure effects in adults [
21]. This approach was used for contextual interpretation only and does not represent a full risk assessment.
Chromium was measured as total Cr without speciation. Therefore, human health risk assessment was conducted assuming the reference dose (RfD) for trivalent chromium (Cr(III)), which is generally considered the predominant and less toxic form in drinking water (U.S. EPA IRIS). This assumption was applied due to the absence of speciation data. The toxicological reference values used in the present study are summarized in
Table 3.
An HRI value < 1 indicates negligible risk, whereas HRI > 1 suggests potential non-carcinogenic health concern.
Lifetime average daily dose (LADD) was calculated as:
For carcinogenic effects, averaging time corresponds to lifetime exposure (AT = 70 years × 365 days), in accordance with US EPA guidance [
11].
The incremental lifetime cancer risk (ILCR) was calculated as:
ILCR values were interpreted using the benchmark range recommended by US EPA, where 10
−6 represents a de minimis risk level and 10
−4 represents the upper acceptable risk boundary [
12].
Because arsenic was measured as total arsenic without chemical speciation, ILCR values were interpreted conservatively, as the cancer slope factor applies specifically to inorganic arsenic [
10,
18,
22].
The assessment followed a deterministic point-estimate approach consistent with US EPA RAGS methodology [
11]. All risk calculations (CDI, HRI, and ILCR) were performed at the level of individual samples using measured concentrations. No temporal or spatial averaging was applied prior to risk estimation. Uncertainties arise from fixed exposure parameters, assumptions of continuous exposure, substitution of values below the limit of detection (LOD) with LOD/2 and values between the limit of detection (LOD) and the limit of quantification (LOQ) with LOQ/2, as well as from the use of total arsenic concentrations without speciation [
10,
18,
19]. Despite these limitations, the methodology provides a consistent framework for structural comparison between urban and rural datasets.
2.4. Statistical Analysis and Spatial Assessment
Spatial distribution patterns of metal concentrations were analyzed to identify localized hotspots and structural differences between urban and rural contexts. Concentration data were mapped using ArcGIS Online Map Viewer (
https://www.arcgis.com/index.html, (accessed on 23 March 2026). Esri, Redlands, CA, USA, accessed in 1 March 2026) with graduated symbols and harmonized color scales to ensure interannual comparability and facilitate visual identification of spatial persistence.
Descriptive statistics (mean, median, standard deviation, interquartile range, and minimum–maximum range) were computed separately by year and area type (urban versus rural). Data distributions were evaluated for normality using the Shapiro–Wilk test, selected over the Kolmogorov–Smirnov test due to its higher statistical power for small to moderate sample sizes, particularly in the urban subset. For descriptive purposes, pooled summary statistics were calculated across the full 2022–2024 dataset, while year-specific analyses were conducted to evaluate temporal variability.
Differences between urban and rural concentration distributions were assessed using the Mann–Whitney U test. Statistical significance was evaluated at α = 0.05. Given the number of comparisons performed, results were interpreted with caution to avoid overemphasis on marginal significance. Effect sizes are reported as rank-biserial correlation (r) alongside p-values.
Associations among metals were evaluated using Spearman’s rank correlation coefficient (ρ), calculated separately for urban and rural datasets. This method was selected due to its robustness to non-normal distributions and monotonic relationships. Correlation strength was interpreted as weak (|ρ| < 0.3), moderate (0.3–0.7), or strong (>0.7), with statistical significance defined at p < 0.05. Spearman correlation coefficients were calculated using pairwise complete observations (pairwise deletion), allowing the inclusion of all available data. As a result, the number of samples varied between individual metal pairs.
Multivariate relationships were explored using Principal Component Analysis (PCA), applied to standardized concentration data (z-scores) to ensure comparability across variables. PCA was conducted separately for urban and rural subsets to evaluate differences in association patterns and data structure. Components with eigenvalues > 1 were retained (Kaiser criterion), and loadings > |0.5| were considered significant. PCA results were interpreted as exploratory and used to support pattern recognition rather than infer causal relationships. PCA was performed using complete-case analysis. As manganese (Mn) was not analyzed in 2022, all samples from 2022 were excluded from the PCA, and the analysis was conducted using the 2023–2024 dataset. Complete PCA loading matrices are provided in
Supplementary Table S1.
Concentrations below the limit of detection (LOD) were replaced with LOD/2. Values reported as below the limit of quantification (<LOQ) were substituted with one-half of the corresponding LOQ specific to each measurement. Numerically reported concentrations below the LOQ were retained as measured values, acknowledging their higher analytical uncertainty [
23]. The proportion of values below analytical thresholds was quantified to assess the extent of left-censoring. This approach preserves available quantitative information while accounting for censored data.
To evaluate the robustness of the substitution approach for left-censored data, a sensitivity analysis was performed by repeating the calculations using LOD instead of LOD/2 for values below the detection limit. The results showed negligible differences in descriptive statistics, correlation structure, and risk estimates (HRI and ILCR), with no changes in risk classification. Therefore, the use of LOD/2 was considered appropriate for the present dataset. Due to unequal sample sizes between urban and rural datasets, non-parametric statistical methods were applied, and results were interpreted with caution. All statistical analyses were performed using JASP (v0.19.3.0) and MATLAB R2024b. Graphical outputs were generated using MATLAB and ArcGIS. All figures were exported at a minimum value of 300 dpi.
3. Results
3.1. Spatial Distribution of Metal Concentrations (Maps)
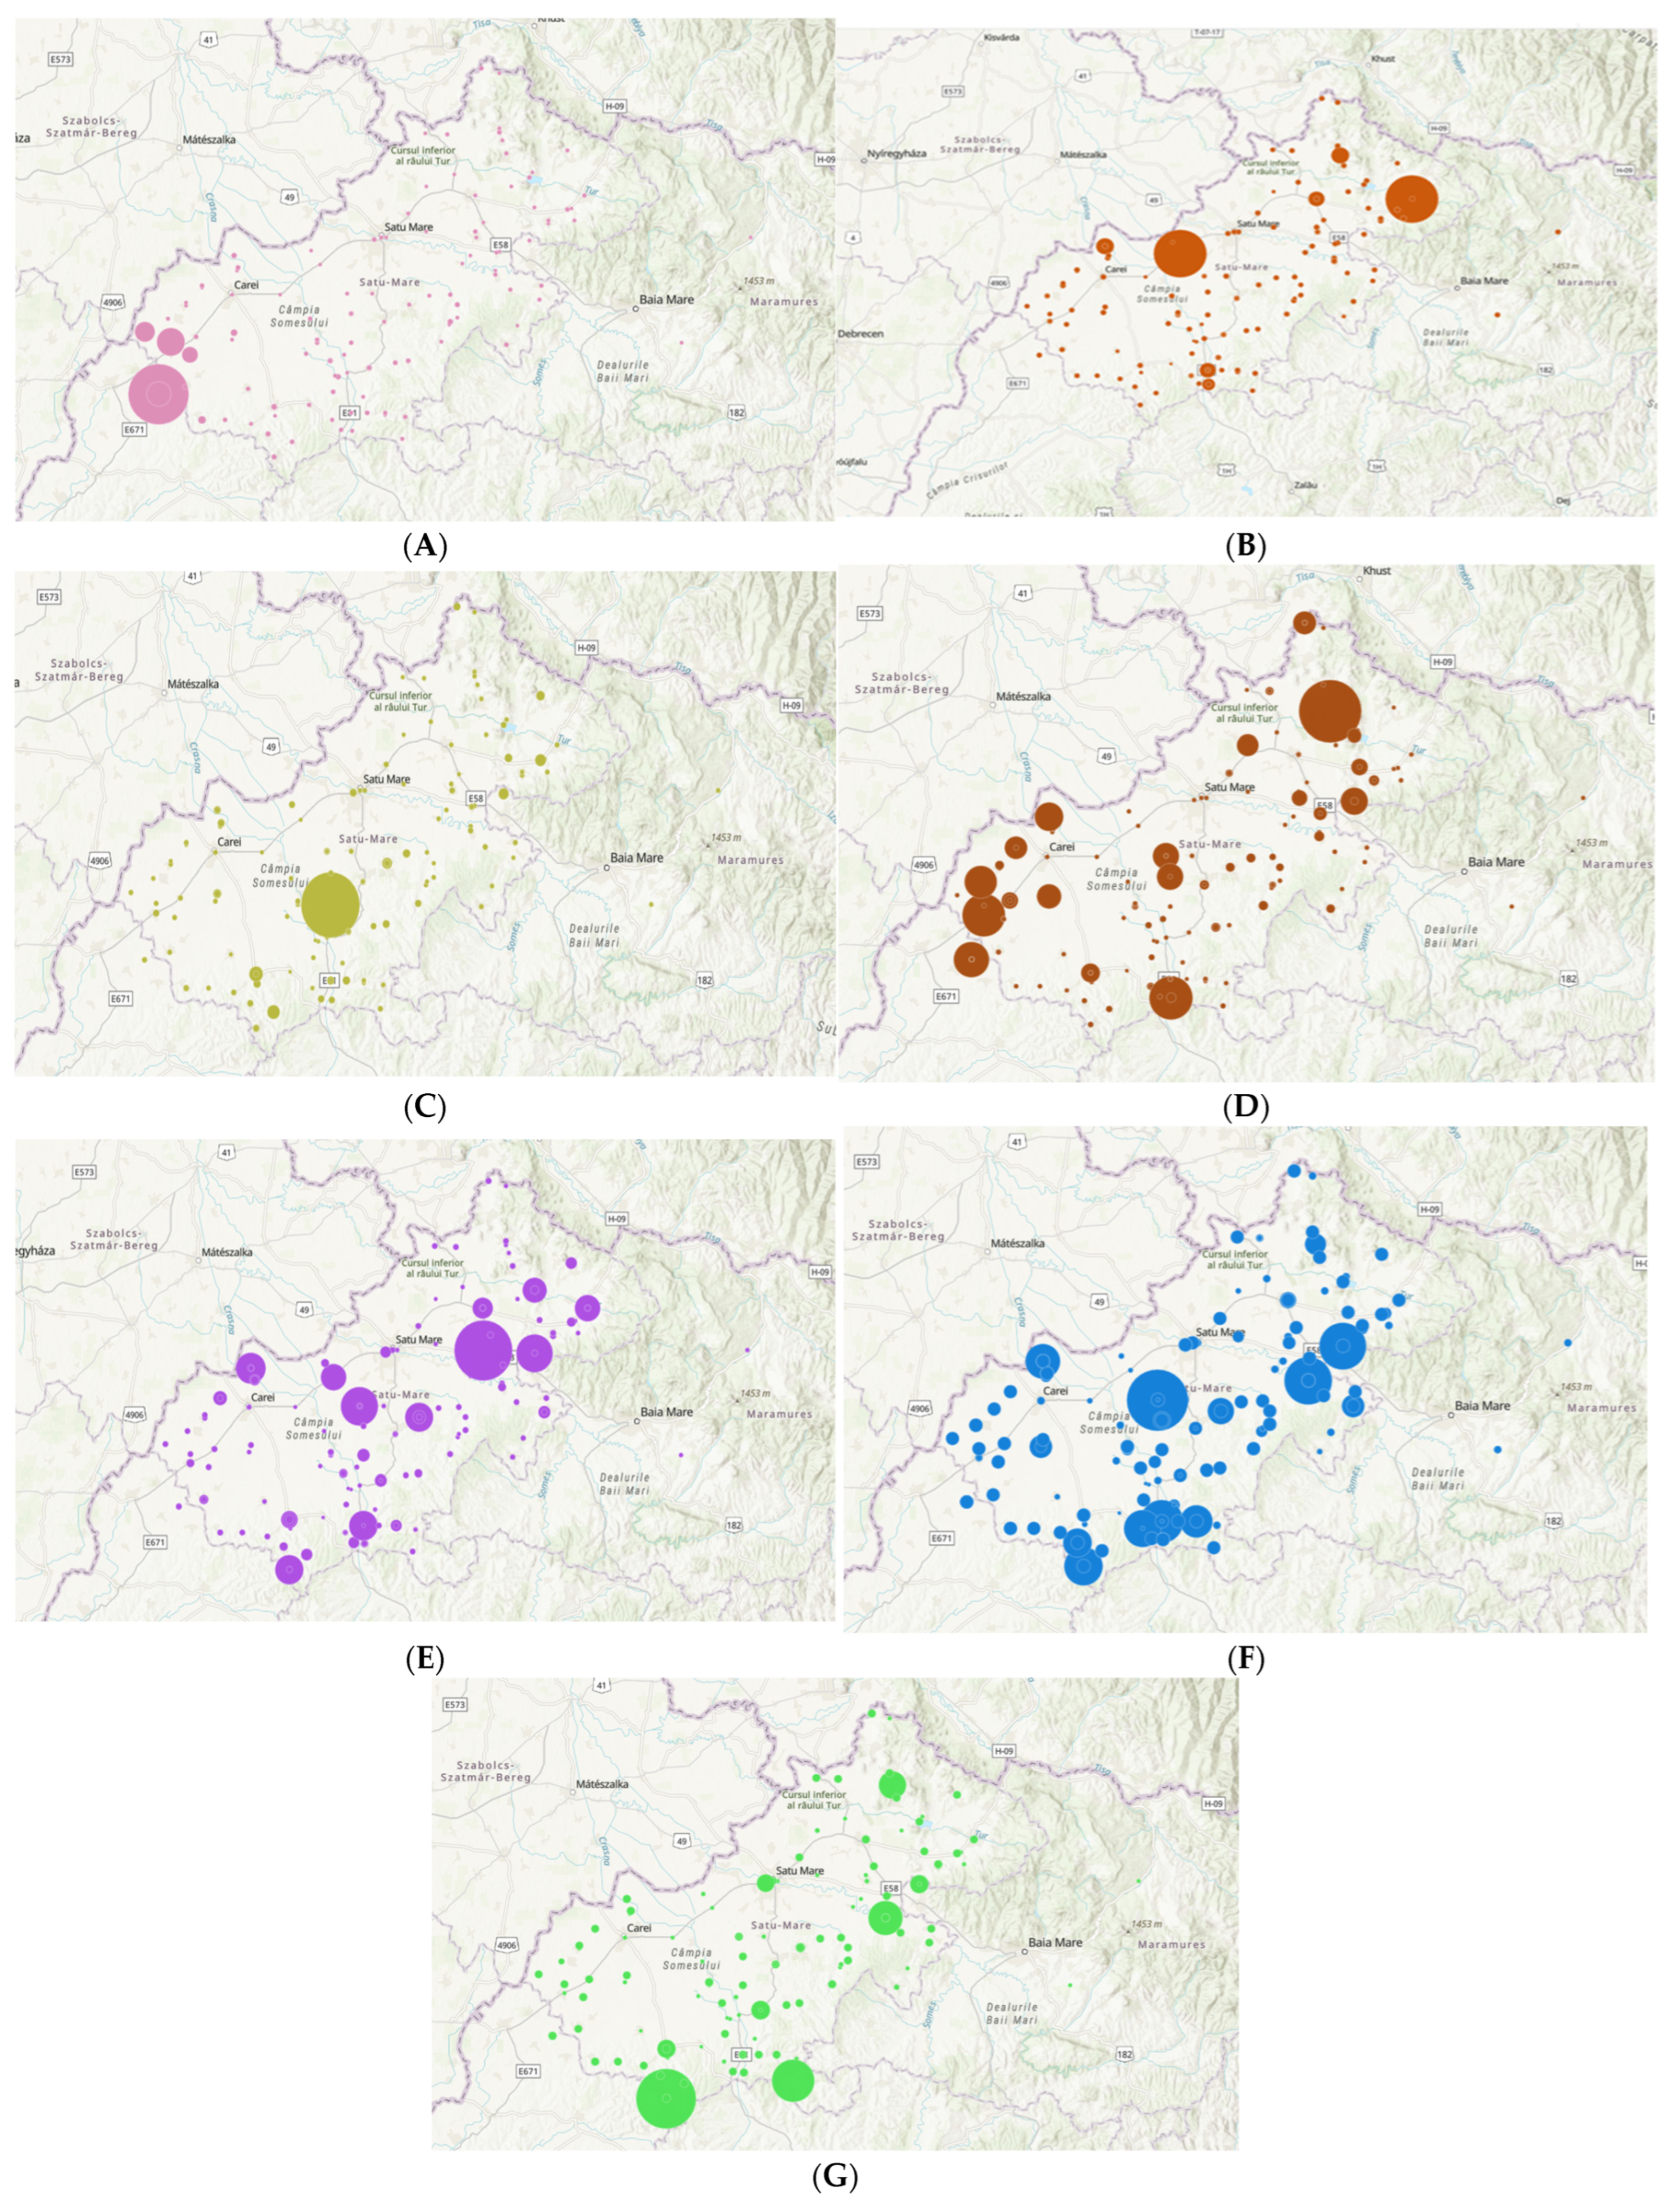
Figure 1 illustrates the spatial distribution of metal concentrations in water intended for human consumption across the investigated localities in Satu Mare County (northwestern Romania) during the 2022–2024 period. The maps reveal pronounced spatial heterogeneity, with most sampling sites exhibiting low-to-moderate concentrations and a limited number of localized hotspots characterized by elevated values, represented by larger graduated symbols.
Each panel (A–G) corresponds to one metal, and circle size is proportional to concentration (µg/L). The maps are intended to provide an exploratory visualization of spatial patterns and to support the identification of localized hotspots.
Based on the spatial patterns illustrated in
Figure 1, several element-specific distribution trends can be observed. Cd and Se displayed consistently low concentrations across the study area, with only isolated instances of moderately elevated values. Cr showed a relatively uniform spatial pattern, largely confined to low and moderate concentration ranges. In contrast, Pb, Ni, and Mn exhibited greater spatial variability, with several localized hotspots and a wider distribution of intermediate-to-high values.
Arsenic concentrations were generally low across most sites; however, distinct localized hotspots were observed, indicating site-specific elevations rather than diffuse regional enrichment. Elevated arsenic and manganese concentrations were more frequently identified in rural localities, whereas urban sites tended to show more uniform and lower concentration patterns.
3.2. Summary Statistics of Metal Concentrations by Year and Area Type
Metal concentrations exhibited substantial variability across sampling years and between rural and urban areas, with consistently higher dispersion observed in rural samples. Interannual differences should be interpreted with caution, as variations in sampling coverage, including the inclusion of additional private or decentralized water sources, may influence apparent temporal patterns rather than reflecting strictly comparable trends at fixed locations.
Arsenic showed the most pronounced spatial and interannual variability. In rural areas, higher mean concentrations were observed in 2024 (16.64 µg/L) compared to 2022 (1.25 µg/L), accompanied by increased median values and the occurrence of extreme concentrations (maximum: 320.50 µg/L). These differences likely reflect the inclusion of additional groundwater sources with elevated arsenic levels rather than a consistent temporal increase. In contrast, urban arsenic concentrations remained comparatively lower, although elevated mean values were observed in 2023 (4.36 µg/L), reflecting localized high measurements.
For the remaining metals, concentrations were generally low and showed limited variability across years. Cadmium, chromium, and lead remained well below the maximum admissible concentrations (CMA) across all years, with no consistent pattern indicative of temporal change. Nickel showed moderate variability, particularly in 2023, when higher mean values were observed in both rural and urban samples. Selenium concentrations were consistently low, with median values frequently equal to LOD/LOQ-derived values, indicating a high proportion of censored data and limited variability.
Manganese exhibited distinct behavior, with elevated concentrations and high variability in rural samples, particularly in 2023 (mean: 53.84 µg/L) and 2024 (mean: 28.32 µg/L), while urban values remained lower and more constrained. No manganese data were available for 2022 (
Table 4).
The occurrence of median values equal to LOD/2 or LOQ/2 (e.g., As = 0.25 µg/L, Mn = 0.38 µg/L, Se = 0.76 µg/L) reflects the presence of left-censored data, consistent with the analytical approach described in the
Section 2 and with the frequency distribution of values below detection and quantification limits. To further characterize this aspect, the proportion of samples below the limit of detection (LOD) and between the LOD and the limit of quantification (LOQ) was calculated for each metal (
Table 5). Selenium and cadmium exhibited the highest degree of censoring, with approximately 84% (Se) and 97% (Cd) of samples below the quantification limit. In contrast, arsenic showed a substantially lower proportion of censored values (5.33% below LOD and 29.51% between LOD and LOQ), with the majority of concentrations exceeding the quantification limit. Chromium, nickel, and lead displayed intermediate censoring patterns, while manganese was predominantly present at quantifiable concentrations despite a notable fraction of values below detection.
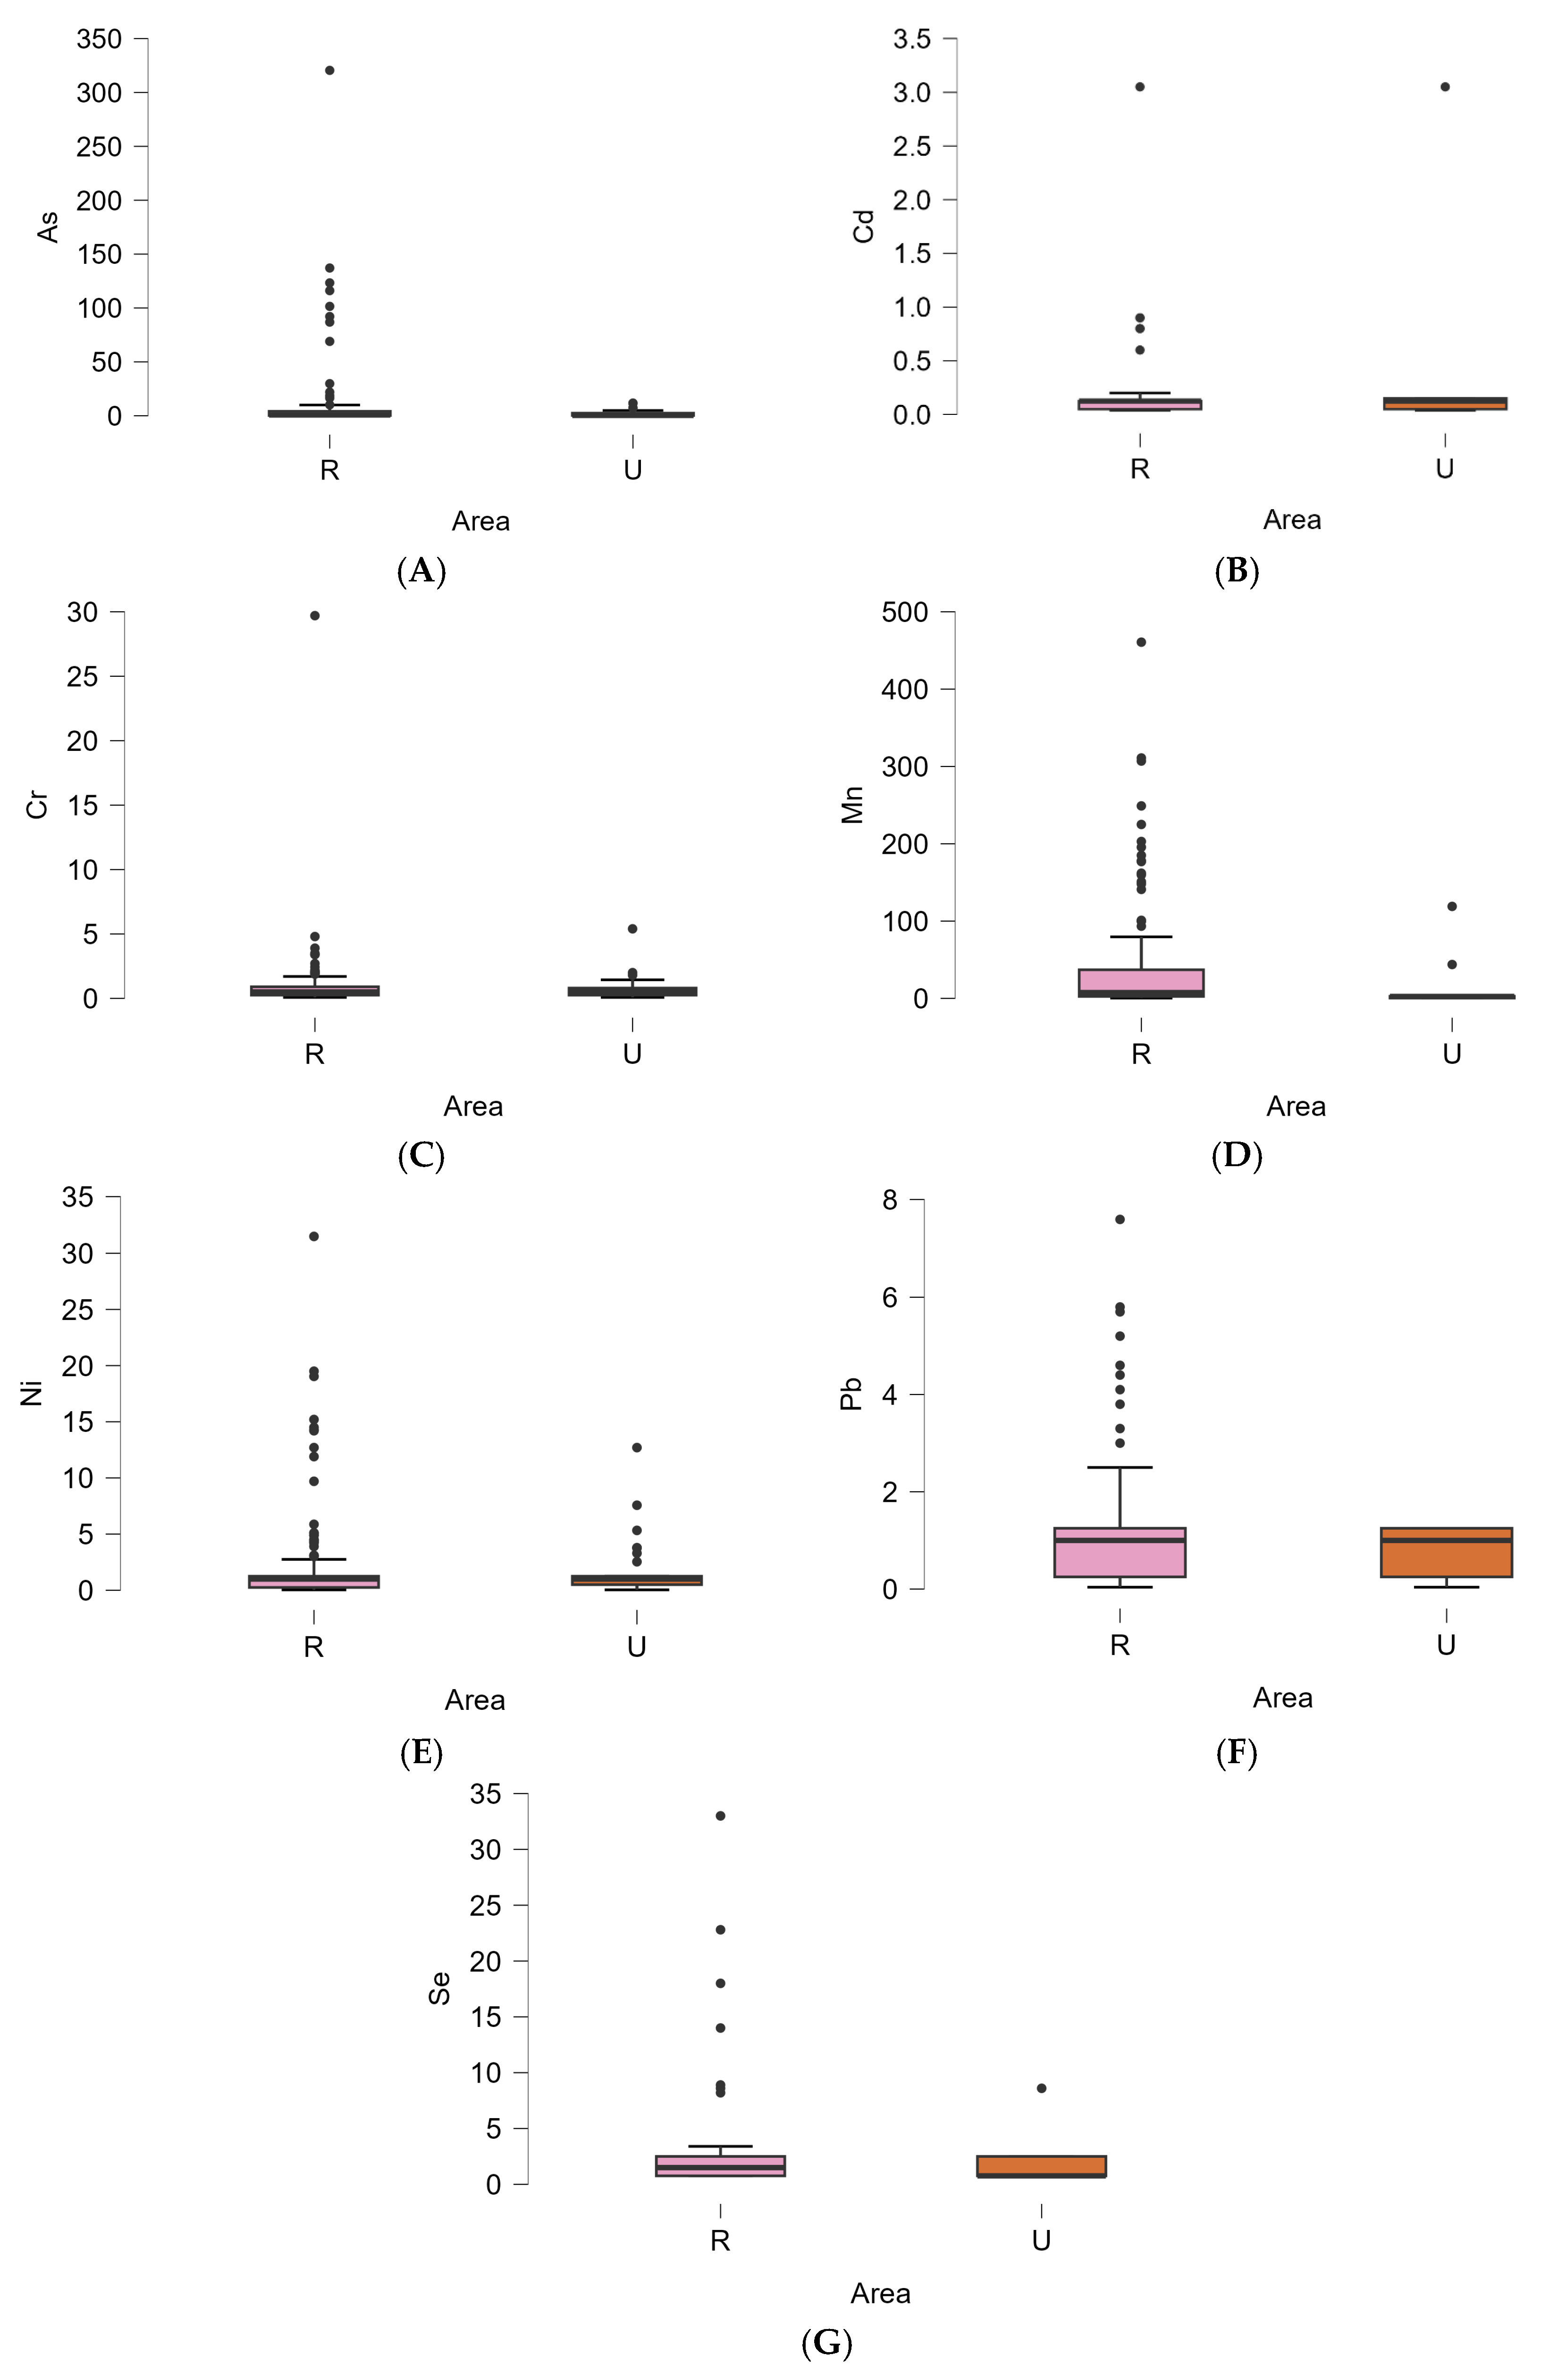
Differences between urban and rural samples were assessed using the Mann–Whitney U test due to non-normal data distribution. A statistically significant difference was observed only for manganese (U = 1705.5, p = 0.001), with a moderate effect size (rank-biserial correlation r = 0.460), indicating higher concentrations in rural samples.
For the remaining metals (Cd, Cr, Pb, Ni, Se, and As), no statistically significant differences were identified (
p > 0.05), and effect sizes were small (|r| < 0.2), suggesting comparable distributions between urban and rural areas. This pattern is also reflected in the box plots (
Figure 2).
Manganese was evaluated using data from 2023–2024 only due to the absence of measurements in 2022.
Exceedances of national maximum admissible concentrations (CMA, Ordinance 7/2023) were primarily associated with arsenic and manganese during 2023–2024. Arsenic exceedances were most evident in rural samples in 2024 (13/81; 16.05%), with a maximum concentration of 320.5 µg/L. Manganese exceedances were frequent in rural samples during 2023 (17/56; 30.36%) and remained present in 2024 (6/81; 7.41%).
3.3. Health Risk Assessment of Potentially Toxic Metals with Arsenic Carcinogenic Risk Evaluation
Summary statistics of the health risk index (HRI) for adults and children are presented in
Table 6. Variations in sample size between analyses reflect differences in data availability for individual metals. Non-carcinogenic risk was evaluated for both exposure groups using standard US EPA methodology.
For most metals (Cd, Cr, Mn, Ni, and Se), both mean and maximum HRI values remained well below the threshold of concern (HRI < 1) for adults and children, and no samples exceeded this limit.
In contrast, arsenic exhibited a distinct pattern. For adults, the mean HRI was 0.628, with a maximum value of 30.52, and 14 samples (5.74%) exceeded the threshold (HRI > 1). For children, higher exposure levels were observed, with a mean HRI of 1.466 and a maximum value of 71.22. A total of 50 samples (20.49%) exceeded the threshold, reflecting the higher intake-to-body-weight ratio in children.
These results indicate that while non-carcinogenic risk remains negligible for most metals, arsenic exposure may pose a health concern, particularly for children in specific localities.
To provide a screening-level perspective for Pb, a supplementary hazard quotient (HQ), calculated using the EFSA BMDL01 (1.50 µg/kg body weight/day), ranged from 0.0003 to 0.036, with all values below 1, indicating no significant health concern based on this approach. In addition, all Pb concentrations remained below the maximum admissible concentration (CMA = 10 µg/L) during the study period.
The spatial distribution of elevated risk was further explored at the sample level. Samples with HRI_As > 1 for adults are detailed in
Table 7. The number of samples reported in
Table 5 (
n = 14 for adults) represents all samples exceeding HRI > 1 across the full dataset, whereas
Table 6 presents the corresponding locations and concentrations for these exceedances. Duplicate entries for the same locality (e.g., repeated sampling or multiple records) are reported separately to preserve sample-level resolution. Elevated arsenic-related risk was observed at a limited number of locations, predominantly in 2024, indicating a localized rather than widespread pattern. For children, a substantially larger number of samples exceeded the HRI threshold, consistent with the higher exposure estimates presented in
Table 5. The same high-risk locations were consistently identified for both adults and children.
Carcinogenic risk associated with arsenic exposure was evaluated using the incremental lifetime cancer risk (ILCR). Year-wise results are presented in
Table 8.
In 2022 and 2023, ILCR values for both adults and children remained below 10−6. In contrast, exceedances were observed only in 2024, corresponding to higher arsenic concentrations recorded during that year, including localized extreme values.
Differences between adult and child ILCR values reflect exposure assumptions: although children have a higher intake-to-body-weight ratio, adult ILCR values are higher due to longer exposure duration (ED = 30 years vs. 6 years), resulting in a higher lifetime average daily dose (LADD).
Locations with ILCR > 10
−6 in 2024 are presented in
Table 9, highlighting spatial clustering of higher-risk values.
Because arsenic was measured as total arsenic without chemical speciation, ILCR estimates should be interpreted with caution, as the applied cancer slope factor refers specifically to inorganic arsenic.
3.4. Correlation Analysis
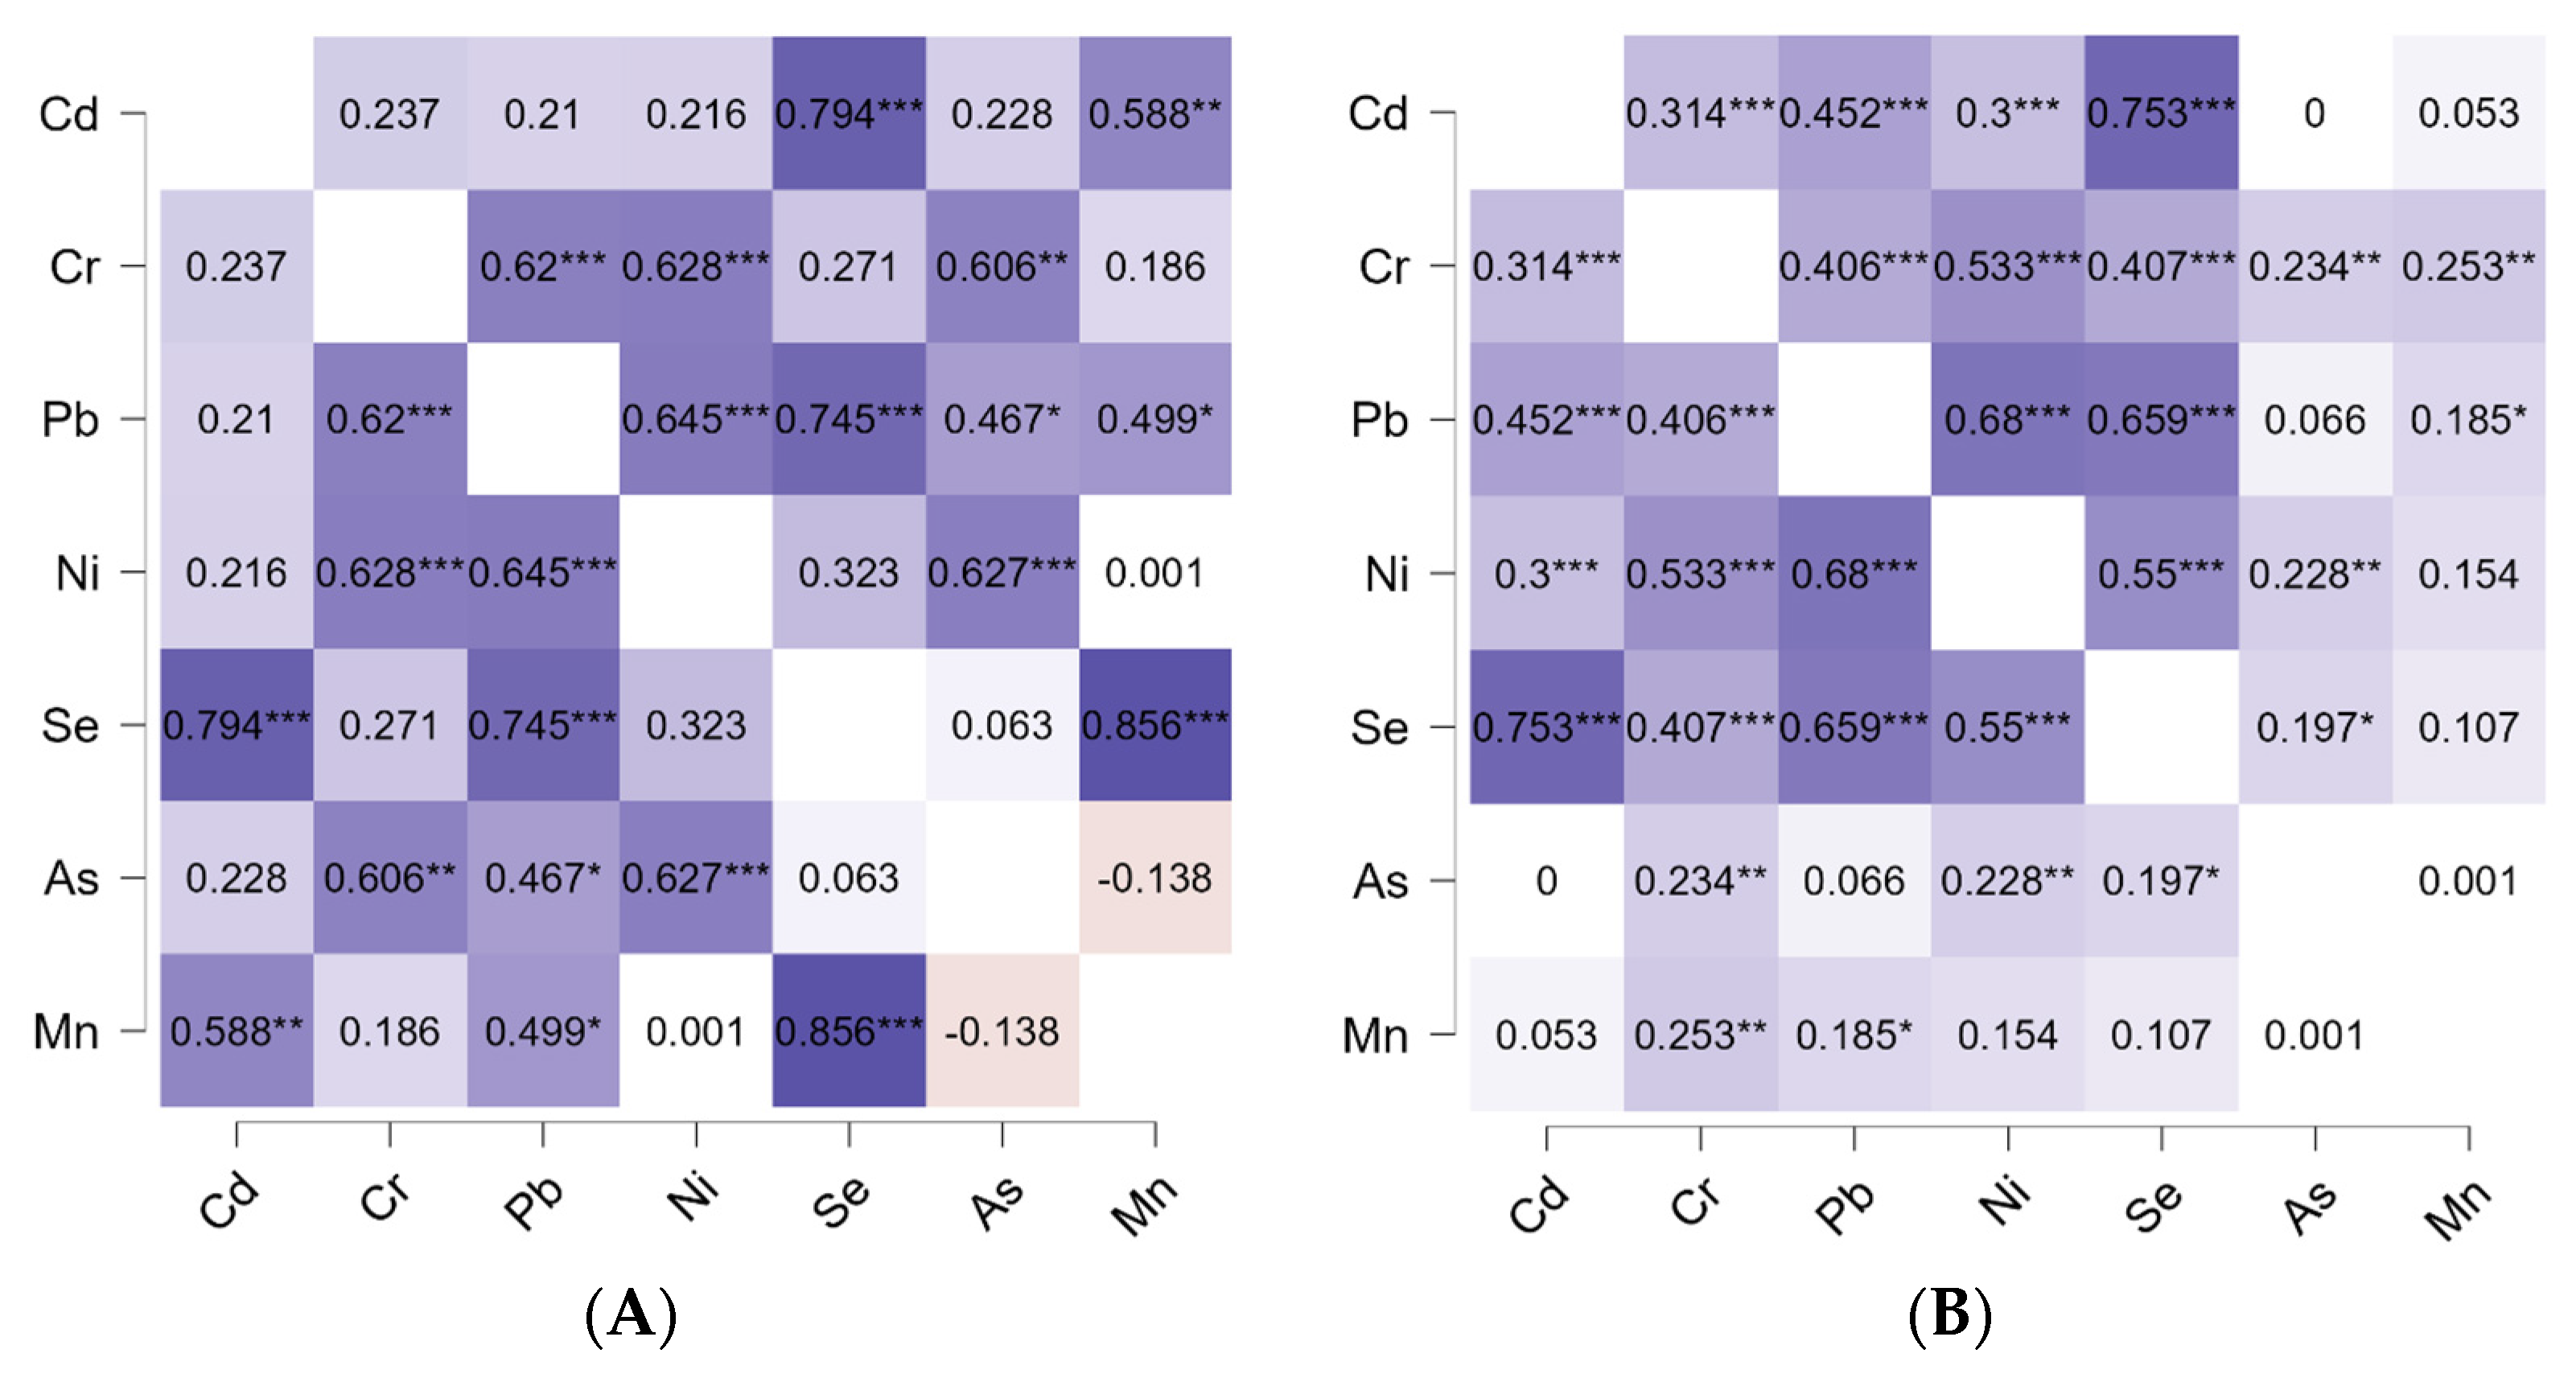
Spearman rank correlation analysis was performed separately for urban and rural datasets to assess monotonic associations among metals under non-normal distribution conditions.
In urban samples, strong positive correlations were observed among chromium, lead, and nickel (ρ = 0.620–0.645,
p < 0.001), indicating a consistent co-occurrence pattern. A second cluster involving cadmium, selenium, and manganese was also identified, with particularly strong associations between Cd–Se (ρ = 0.794,
p < 0.001) and Se–Mn (ρ = 0.856,
p < 0.001). Arsenic showed moderate correlations with chromium, nickel, and lead, but no significant association with manganese, suggesting a distinct geochemical behavior (
Figure 3A).
In rural samples, a more structured but element-specific pattern was observed. Strong correlations were identified within a cluster including lead, nickel, selenium, and cadmium (ρ = 0.550–0.753,
p < 0.001). Chromium exhibited moderate correlations with this group, suggesting a linking role within the system. In contrast, arsenic displayed only weak-to-moderate correlations with chromium, nickel, and selenium, and no association with lead, cadmium, or manganese, indicating relative independence from the main metal associations. Manganese showed limited correlations overall, supporting its sensitivity to localized hydrochemical conditions (
Figure 3B).
Principal Component Analysis (PCA), performed separately for urban and rural datasets on standardized concentration values (z-scores), revealed clear differences in association patterns among the analyzed metals.
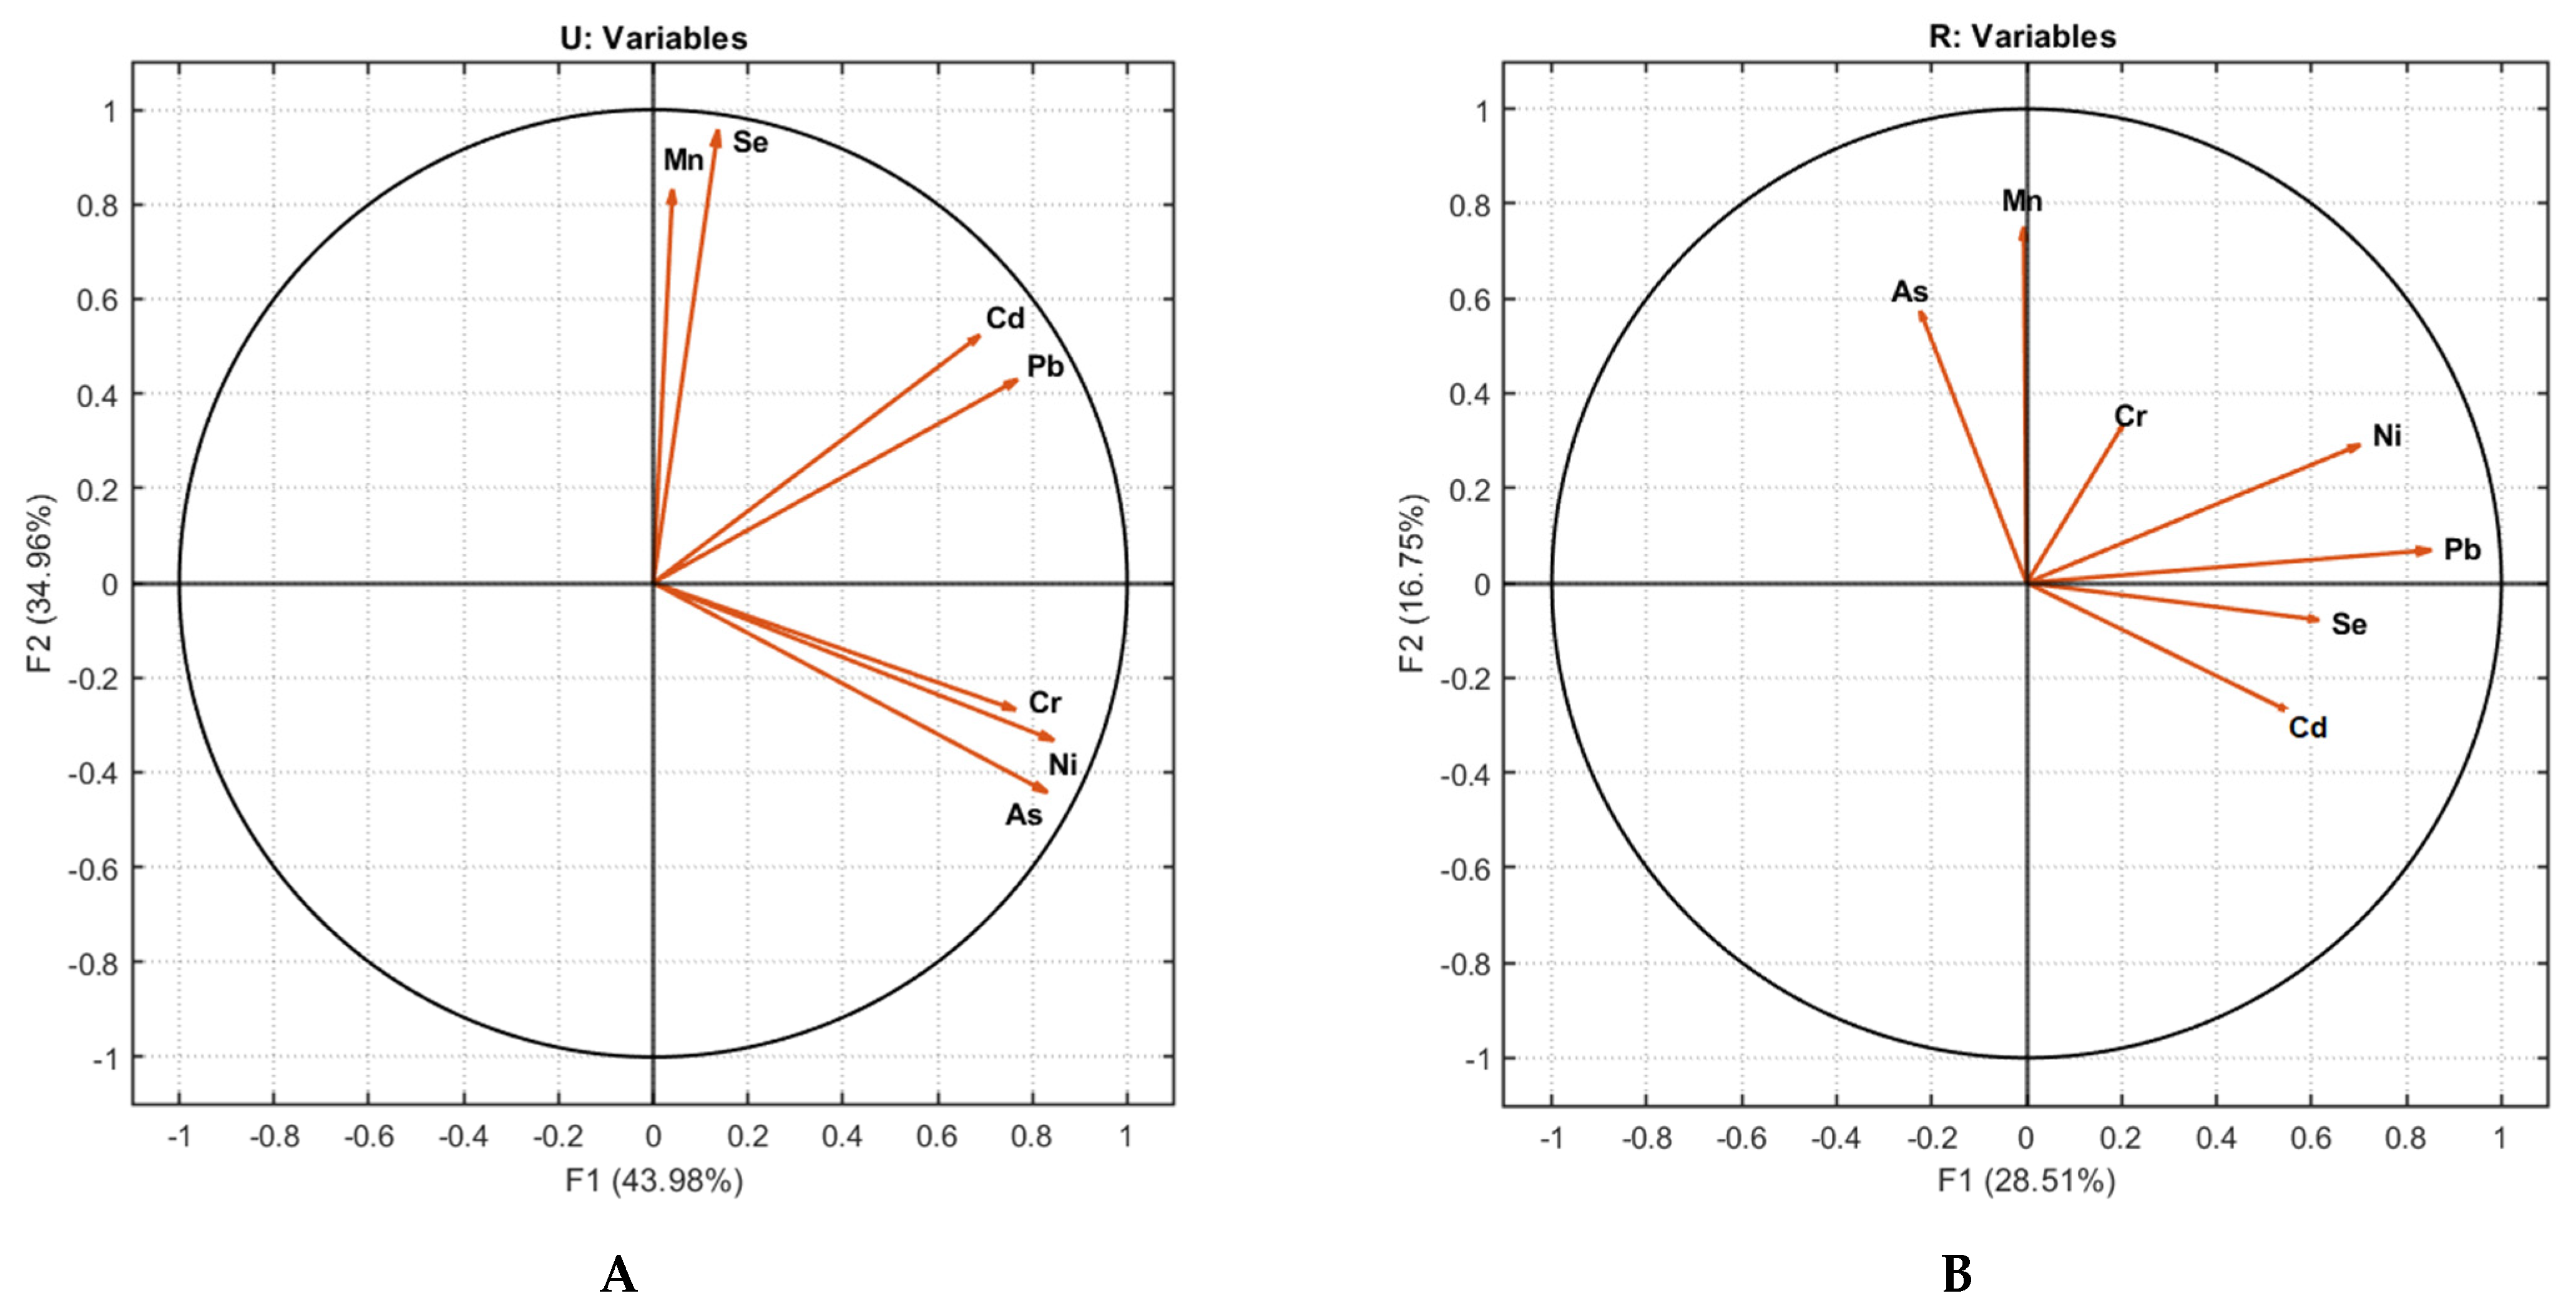
In urban samples, two principal components with eigenvalues > 1 were retained, explaining 78.9% of the total variance (PC1 = 42.5%, PC2 = 36.4%), indicating a well-defined and structured dataset. The first principal component (PC1) was characterized by strong positive loadings for As (0.943), Ni (0.903), Cr (0.811), and Pb (0.544), suggesting a coherent metal association that may reflect combined geogenic background and distribution system influences. The second principal component (PC2) showed high loadings for Se (0.938), Mn (0.781), and Cd (0.748), along with a moderate contribution from Pb (0.697), indicating a partially independent component likely influenced by redox-sensitive processes and local hydrochemical conditions (
Figure 4A).
In contrast, the rural dataset exhibited a more complex structure, with three principal components explaining 59.8% of the total variance (PC1 = 28.2%, PC2 = 16.1%, PC3 = 15.4%). The first principal component (PC1) was defined by Pb (0.855), Ni (0.709), Se (0.611), and Cd (0.532), indicating a mixed metal association potentially reflecting combined geogenic and localized influences. The second principal component (PC2) was dominated by Mn (0.918), highlighting its distinct redox-sensitive behavior. The third principal component (PC3) showed strong loadings for Cr (0.847) and As (0.578), suggesting a geochemically controlled association potentially linked to reductive processes within the aquifer system (
Figure 4B).
The PCA structure was consistent with the Spearman correlation analysis, supporting the robustness of the identified association patterns despite the presence of left-censored data. Detailed PCA loadings are provided in
Supplementary Table S1.
Overall, the urban dataset exhibits a more structured and compact pattern, whereas the rural dataset shows a more heterogeneous and multi-dimensional structure, reflecting the contrasting characteristics of centralized urban supply systems and decentralized rural groundwater sources.
4. Discussion
Understanding the spatial and temporal occurrence of trace metals in water intended for human consumption requires the integration of hydrogeological context, supply system characteristics, and health risk assessment. In this study, spatial mapping, non-parametric statistics, multivariate analysis, and deterministic risk assessment were combined to evaluate differences between centralized urban systems and decentralized rural groundwater supplies in Satu Mare County.
The dataset reflects the structure of routine drinking water monitoring, with a higher representation of rural samples due to the greater reliance on decentralized groundwater sources and the inclusion of request-based testing (e.g., private wells). Consequently, urban and rural datasets are inherently unbalanced and should be interpreted within this context.
The results indicate pronounced spatial heterogeneity, urban–rural differences, and localized arsenic-related risk hotspots, consistent with patterns reported in sedimentary aquifer systems [
3,
4,
6]. Previous studies in north-western Romania have reported spatial variability in groundwater quality and the occurrence of elevated trace metal concentrations, particularly in areas influenced by geological conditions or historical anthropogenic activities [
15,
16,
24,
25]. These findings support the need for continued monitoring and localized risk assessment in groundwater-dependent communities.
The hydrogeological framework of the study area, located within the Pannonian Basin, is consistent with the observed variability. The basin is characterized by multilayered Neogene and Quaternary sedimentary deposits, intercalated clay layers, and spatially variable redox gradients. Such environments are well recognized for promoting redox-sensitive mobilization of trace elements, particularly arsenic and manganese [
3,
10]. In reducing groundwater systems, arsenic is typically associated with iron oxyhydroxides and can be released through reductive dissolution processes, especially under low-oxygen (reducing) conditions [
3,
26]. The extreme arsenic concentration recorded in 2024 (320.5 µg/L) is consistent with geogenic mobilization processes rather than diffuse anthropogenic input. Similar geochemically driven arsenic enrichment has been documented in sedimentary basins worldwide, including Central Europe and other regions characterized by reducing aquifers [
6,
26].
Such behavior reflects redox stratification within the aquifer system. In sedimentary environments, manganese is typically mobilized under moderately reducing conditions, whereas arsenic release is more strongly associated with the reductive dissolution of Fe oxyhydroxides under more strongly reducing, often methanogenic conditions. Transitional redox zones may therefore result in differential mobilization or retention of these elements, leading to spatial decoupling, as observed in the present dataset.
The absence of key hydrochemical parameters such as pH, redox potential (Eh), and dissolved iron limits the direct interpretation of arsenic speciation and mobilization processes. Arsenic speciation (As(III) vs. As(V), organic vs. inorganic) was not determined in the present study. However, in reducing groundwater systems typical of the Pannonian Basin, arsenic is predominantly present in inorganic forms, with As(III) prevailing under low-oxygen conditions associated with reductive dissolution of iron oxyhydroxides. Therefore, risk assessment based on total arsenic concentrations represents a conservative approach.
In contrast, Cd and Se exhibited relatively low concentrations but showed strong and consistent associations, particularly in rural samples. This pattern suggests potential shared geogenic sources or similar geochemical behavior, potentially influenced by mineral composition and adsorption–desorption processes within the aquifer matrix. Chromium and nickel displayed moderate variability and were consistently associated with Pb and Se, indicating partially overlapping controls. Although minor anthropogenic contributions cannot be excluded, the absence of clear spatial clustering supports a predominantly geogenic background for these elements.
Across the international literature, the magnitude and spatial variability of arsenic observed in this study are consistent with those reported in other sedimentary basin environments. Maximum concentrations recorded in Satu Mare County (320.5 µg/L) fall within the upper range documented in the Pannonian Basin (up to ~364 µg/L) and are comparable to values reported in major arsenic-affected regions such as Bangladesh, Cambodia, and Vietnam, where reducing aquifer conditions drive geogenic mobilization [
6,
13,
14,
26].
In contrast, the concentrations of Cd, Ni, Pb, and Se in the present study are generally lower than those reported in mining-impacted regions or heavily industrialized areas, where anthropogenic inputs dominate [
24]. This supports the interpretation that trace metal occurrence in the study area is primarily controlled by natural hydrogeochemical processes rather than diffuse pollution sources. The observed urban–rural contrast is also consistent with findings from other European regions, where centralized systems tend to exhibit lower variability due to source mixing and treatment, while decentralized groundwater supplies show higher spatial heterogeneity and greater susceptibility to geogenic contaminants [
13,
14,
27]. These findings are consistent with global patterns observed in sedimentary aquifer systems, where arsenic occurrence is typically spatially heterogeneous and controlled by local hydrogeochemical conditions rather than uniform regional contamination.
A key structural finding of the study is the divergence between centralized urban systems and decentralized rural groundwater supplies. Urban datasets showed higher explained variance in PCA (78.9%) and the more consistent grouping of variables. Two principal components were identified, separating As–Cr–Ni associations from Se–Mn–Cd groupings, with Pb contributing to both components. This pattern may reflect the influence of centralized supply systems, where source mixing, treatment processes, and controlled distribution reduce variability and attenuate localized geochemical signals. Infrastructure-related factors, including pipe materials and corrosion processes, may further contribute to observed associations within urban networks [
28]. PCA results are interpreted as exploratory and do not allow direct inference of geochemical processes in the absence of supporting hydrogeological parameters (e.g., pH, Eh, dissolved Fe
2+).
In contrast, rural datasets demonstrated lower explained variance in PCA (60.1%) and a more heterogeneous but structured pattern of associations. A distinct cluster involving Pb, Ni, Se, and Cd was identified, supported by strong correlations and consistent PCA loadings. Chromium showed moderate associations with this cluster, suggesting a linking role within the geochemical system. These patterns are characteristic of groundwater-dependent systems, where local lithology, aquifer conditions, recharge dynamics, and well characteristics exert a stronger influence on water composition [
14,
27]. Arsenic displayed weak-to-moderate correlations with other elements and remained largely independent of the main association cluster, consistent with its distinct behavior in PCA. This supports the interpretation that arsenic mobilization is primarily governed by redox-sensitive geochemical processes rather than co-occurrence with other trace metals. Manganese similarly showed limited and variable associations, further indicating sensitivity to localized hydrochemical conditions.
The integration of correlation analysis and PCA highlights the presence of two dominant geochemical behaviors: (i) a cluster of elements (Pb–Ni–Se–Cd) reflecting shared sources or similar mobilization pathways, and (ii) redox-controlled elements (As and Mn) exhibiting more independent and spatially variable behavior. This distinction underscores the role of heterogeneous hydrogeochemical conditions in shaping trace metal distribution, particularly in rural groundwater systems.
The greater variability and occurrence of localized concentration extremes in rural samples emphasize the structural vulnerability of decentralized groundwater supplies. In the absence of blending and advanced treatment, geochemical processes directly influence water quality, increasing the likelihood of localized exposure risks. Similar urban–rural contrasts have been reported in other European regions, where decentralized groundwater systems show higher variability and susceptibility to naturally occurring contaminants [
13,
14,
27].
From a regulatory perspective, exceedances of national maximum admissible concentrations were primarily driven by As and Mn. The magnitude of As exceedances in 2024, particularly in rural wells, indicates episodic exceedances of regulatory thresholds. Such localized hotspots align with findings from other sedimentary basin environments, where arsenic mobilization is spatially heterogeneous and controlled by site-specific hydrogeochemical conditions rather than uniform regional enrichment. The localities with the highest arsenic concentrations (R9, R6, R8, R11) are located in the southern part of Satu Mare County, in areas characterized by deep Neogene sedimentary deposits and reducing groundwater conditions. These hydrogeological settings are known to favor arsenic mobilization through reductive dissolution of iron oxyhydroxides.
No major industrial or mining activities are documented in these areas, supporting a predominantly geogenic origin of arsenic rather than anthropogenic contamination. This pattern is consistent with previous studies from the Pannonian Basin reporting elevated arsenic concentrations in reducing aquifer systems [
6,
26].
The health risk assessment results further clarify the public health implications of these findings. For cadmium, chromium, nickel, selenium, and manganese, non-carcinogenic risk indices remained well below the threshold of concern under the adult exposure scenario. This suggests that, at the regional scale, chronic ingestion exposure to these metals does not indicate substantial health risk under the applied exposure scenario. Arsenic, however, presents a distinct profile. Non-carcinogenic risk (HRI > 1) was identified in 5.74% of samples, and carcinogenic risk values (ILCR > 10
−6) were observed in several rural locations during 2024. Although none of the ILCR values exceeded 10
−4—the upper boundary commonly referenced in regulatory risk frameworks [
11,
12]—the presence of repeated exceedances above 10
−6 indicates the presence of non-negligible long-term exposure in specific locations.
The inclusion of child-specific exposure scenarios provides critical insight into population vulnerability. Although non-carcinogenic risk for most metals remained below the threshold of concern for both adults and children, arsenic exhibited a markedly different pattern. The proportion of samples exceeding the HRI threshold increased from 5.74% in adults to 20.49% in children, emphasizing the importance of incorporating age-specific exposure in risk assessments. This difference reflects the higher intake-to-body-weight ratio in children and highlights increased vulnerability under the same exposure conditions. This finding underscores the importance of considering sensitive population groups in drinking water risk assessment, particularly in regions affected by geogenic arsenic contamination. Similar patterns have been reported in groundwater-dependent systems, where children are more susceptible to elevated exposure due to physiological and behavioral factors.
Despite these differences, the spatial distribution of high-risk locations remained consistent, indicating that arsenic-related health risks are driven primarily by localized hydrogeochemical conditions rather than widespread contamination. These results support the need for targeted monitoring and mitigation strategies in rural groundwater systems, with particular attention to vulnerable populations.
Although Pb was not included in the HRI framework due to the absence of an established US EPA oral reference dose and the lack of a recognized safe exposure threshold [
29], all measured concentrations remained below the regulatory limit (CMA = 10 µg/L). A supplementary screening-level assessment based on the EFSA BMDL01 [
21] indicated no significant health concern; however, Pb risk is more appropriately evaluated using biokinetic models such as the IEUBK model [
20]. Therefore, continued monitoring and targeted biomonitoring are recommended in areas where concentrations approach regulatory thresholds.
The maximum recorded arsenic concentration substantially exceeded both national regulatory limits and WHO guideline values. Even though such extreme values were localized, their magnitude underscores the importance of targeted mitigation strategies. These may include well-specific monitoring, alternative water sources, point-of-use treatment technologies, and improved risk communication in affected communities. Because total arsenic was measured without chemical speciation, ILCR values were interpreted conservatively, as the applied cancer slope factor refers specifically to inorganic arsenic [
5,
11]. Nevertheless, given the high measured concentrations, the public health relevance remains significant even under potential speciation uncertainty.
The findings align with the preventive, risk-based approach promoted by Directive (EU) 2020/2184, which emphasizes systematic risk assessment across the entire supply chain [
9]. Rather than applying uniform monitoring intensity, the results suggest prioritization of surveillance efforts toward rural groundwater-dependent localities identified as geochemically susceptible. Integration of spatial mapping, multivariate analysis, and periodic arsenic screening may enhance early detection of emerging hotspots and support adaptive management strategies.
Within a One Health framework, groundwater contamination represents a cross-sectoral issue linking geological processes, ecosystem dynamics, infrastructure systems, and human exposure pathways [
2]. Identifying environmental drivers of contaminant mobilization contributes to improved anticipation of population-level risk and supports evidence-based water management. The structural differences identified between centralized and decentralized systems highlight the importance of tailoring monitoring and intervention strategies to local hydrogeological conditions.
Several limitations should be acknowledged. Arsenic speciation was not performed, and key hydrochemical parameters such as pH, redox potential (Eh), and dissolved iron were not available, limiting detailed interpretation of geochemical processes. Chromium speciation was also not determined; therefore, risk assessment was conducted assuming Cr(III), which may underestimate potential health risks if Cr(VI) is present. Values below the LOD were substituted with LOD/2, and probabilistic uncertainty analysis was not conducted. The study is based on routine monitoring data rather than a fixed-location longitudinal design; therefore, spatial coverage varies between years, and apparent interannual differences may reflect changes in sampling distribution rather than true temporal trends. The imbalance between urban and rural sample sizes represents an inherent limitation of the dataset, although non-parametric methods were used to mitigate this effect. A sensitivity analysis restricted to samples with known source type confirmed that the overall risk characterization was not materially affected. Future research should incorporate arsenic speciation, redox-sensitive parameters, and probabilistic modeling approaches to refine uncertainty estimation and strengthen causal interpretation. The use of standardized exposure parameters (e.g., body weight and ingestion rate) represents a simplifying assumption of the deterministic risk assessment approach. Although these values are consistent with US EPA guidance, they may not fully reflect local population characteristics, potentially influencing the accuracy of risk estimates. Additionally, the present assessment considers only ingestion exposure, as it represents the primary pathway for drinking water; dermal exposure was not evaluated due to the lack of specific exposure parameters.
Overall, the study indicates that while most trace metals remain within acceptable risk thresholds, arsenic contamination in rural groundwater supplies represents a localized but relevant public health concern. The integration of hydrogeochemical interpretation with structured risk assessment provides a robust basis for targeted, risk-based water management within a One Health framework.