Article

Detection of Water Quality COD Based on the Integration of Laser Absorption and Fluorescence Spectroscopy Technology


Institute of Marine Optoelectronic Equipment, Harbin Institute of Technology, Weihai 264209, China
*
Author to whom correspondence should be addressed.
Water 2026, 18(1), 93; https://doi.org/10.3390/w18010093
Submission received: 27 November 2025 / Revised: 24 December 2025 / Accepted: 30 December 2025 / Published: 30 December 2025
(This article belongs to the Section Water Quality and Contamination)

Abstract

Chemical oxygen demand (COD) serves as a critical indicator for assessing the extent of water pollution caused by organic matter. This study proposes an integrated COD detection methodology that combines laser absorption spectroscopy with laser-induced fluorescence spectroscopy, enabling accurate measurement of COD parameters across a wide concentration range. For high-concentration COD, conventional ultraviolet absorption spectrophotometry based on the Lambert–Beer law is employed. However, since laser absorption spectrophotometry exhibits substantial errors in detecting low-concentration COD, laser-induced fluorescence spectroscopy is adopted for the precise quantification of trace-level COD. By integrating these two laser-based approaches, a spectroscopic COD detection system has been developed that simultaneously records absorbance after the laser passes through the sample and quantifies fluorescence intensity perpendicular to the beam with an image sensor, thereby achieving comprehensive COD analysis. Laboratory validation using COD standard solutions demonstrated relative errors below 11% across the concentration range of 2–220 mg/L. Further application to natural water samples confirmed that the integrated laser absorption–fluorescence spectroscopy approach achieves wide-range COD measurement with high sensitivity, a compact configuration, and rapid response, demonstrating strong potential for real-time online water quality monitoring.

1. Introduction

Amid worsening global water scarcity and contamination, a reliable assessment of water quality has become imperative. Chemical oxygen demand (COD), a core metric of organic pollution, is central to quantifying the extent of contamination in aquatic systems [1]. Among the available methods, conventional chemical COD determination provides reliable and reproducible results; however, it is time-consuming and involves complex analytical procedures [2]. Conventional chemical COD assays rely on costly, highly corrosive, and toxic reagents and generate substantial hazardous waste, posing a risk of secondary environmental pollution [1,3]. Optical methods have therefore become a focal point in water-quality monitoring, offering rapid, non-destructive, portable, and reagent-free measurements that eliminate hazardous waste [4,5].
Among the optical methods for measuring chemical oxygen demand (COD) in water bodies, ultraviolet (UV) absorption photometry is a primary approach. Since the 1960s, studies have confirmed that organic compounds exhibit strong absorption characteristics in the ultraviolet wavelength range [6]. Ultraviolet absorption spectrophotometry has been selected as the standard measurement method for COD by many countries [7]. Chen et al. [8] coupled their self-made variable optical path sample cell with a spectrophotometer. By rotating the threaded column, they could precisely adjust the effective optical path, enabling the same set of equipment to cover COD detection of wastewater with varying concentrations, across different processing stages, and at both high and low levels. Zhang et al. [9] constructed an orthogonal UV–IR optical path and subtracted the turbidity contribution from the 880 nm signal to obtain high-precision measurements over the 50–200 mg/L range. However, when COD was below 50 mg/L, the signal-to-noise ratio was insufficient, leading to a significant increase in error. Ultraviolet absorption photometry suffers from inherently low sensitivity at low concentrations, as the molar absorptivity of dissolved organic matter in pristine water is exceptionally low. Che et al. [10] adopted a dual-beam configuration operating at 254 nm and 365 nm. Even after wavelength-specific correction, the coefficient of determination between predicted and true values remained only 0.71 for the 0–5 mg/L interval, markedly below the 0.99 achieved across 0–200 mg/L, underscoring the method’s diminished fidelity at low concentrations. In addition to UV-absorption photometry, other approaches have also demonstrated high accuracy in determining elevated chemical oxygen demand. Jarmondi et al. [11] employed deep learning (DL) models to predict biochemical oxygen demand (BOD) and COD at Melbourne’s Eastern Treatment Plant, using a multi-domain dataset encompassing water-quality, flow, energy-consumption, and climatic variables. For COD monitoring (concentration range 400–1300 mg/L), their hybrid GRU-Transformer model achieved RMSE = 11.824 mg/L, MAE = 8.864 mg/L, and R2 = 0.96, outperforming the other architectures. Ahmed et al. [12] developed a reproducible and user-friendly laboratory-scale protocol for determining COD in fat-, oil- and grease-laden wastewater; using the non-ionic surfactant Tween 80 as an emulsifying-solubilizing agent, they precisely controlled its dosage and established a strong linear relationship with COD (R2 = 0.993–0.998).
Fluorescence spectroscopy offers high sensitivity, strong discrimination of organic compounds, and real-time measurement. It is a promising emerging research hotspot in water quality monitoring [12,13,14,15]. Over the past two decades, fluorescence spectroscopy detection instruments have been widely used in the field of water quality monitoring, including for assessing drinking water quality [16], detecting the content of dissolved organic matter (DOM) in water bodies [17,18,19], and calibrating ocean satellite data [20], among other environmental application areas. Laser-induced fluorescence (LIF) technology, based on laser-induced emission spectroscopy of water bodies, is a widely used rapid monitoring and analysis technique for water environments [21]. Compared with fluorescence excited by traditional light sources (LEDs or xenon lamps), lasers offer higher radiant brightness and narrower spectral line widths, thereby simultaneously enhancing detection sensitivity and spectral selectivity [22]. The LIF technology has been widely applied in the environmental field for practical detection, including the estimation of water transparency and turbidity [23,24], rapid detection of DOM in water [25], and detection of oil spills and other pollutants [26,27]. In the field of COD detection, Che et al. [28] used a 405 nm laser as the light source and employed fluorescence-Raman spectroscopy, achieving high-precision measurements within the concentration range of 0–12 mg/L. With the rapid development of electronics and computer science, image-processing-based water-quality detection systems have been widely adopted. These systems are highly praised for their high accuracy, high efficiency, and non-contact nature. By analyzing water sample images, feature information is extracted to achieve a rapid assessment of water quality parameters [29].
In recent years, feature extraction in the red–green–blue (RGB) color space, serving as one of the core tools of color image processing, has played a pivotal role in environmental monitoring, including the detection of target chemical substances in water bodies [30], microbial detection [31], and the assessment of aquatic ecological status [32,33]. Numerous studies have shown that subtle changes in RGB feature values are significantly correlated with water quality indicators, providing a data foundation for the subsequent accurate and reliable analysis of water body conditions. Guo et al. [34] excited water samples with a 405 nm laser and recorded the resulting fluorescence images using a CMOS sensor. After extracting the mean RGB intensities from characteristic regions, they built a COD prediction model with partial least-squares regression. The relative detection error remained below 10% across 0–12 mg/L. The LIF-based COD measurement method has high accuracy and sensitivity at low concentrations, but its measurement range is limited to the low-concentration COD interval and cannot accurately detect severely polluted water bodies.
Ultraviolet absorption spectrophotometry is suitable for water bodies with high COD, but it yields relatively large errors when measuring those with low COD. The LIF-based COD measurement method has high sensitivity and performs well at detecting low concentrations. This paper proposes a detection system that integrates the absorption method and laser-induced fluorescence, combining the advantages of both and enabling COD measurement over a wide range, from low to high concentrations, with high accuracy. Compared with previous studies, the COD concentration detection method proposed in this paper enables comprehensive real-time monitoring of the entire COD concentration range, including both high- and low-concentration COD intervals, through a single system, which is of great significance for rapid water quality detection applications.

2. Detection Principle and System Design

2.1. Ultraviolet Absorption Spectrophotometry

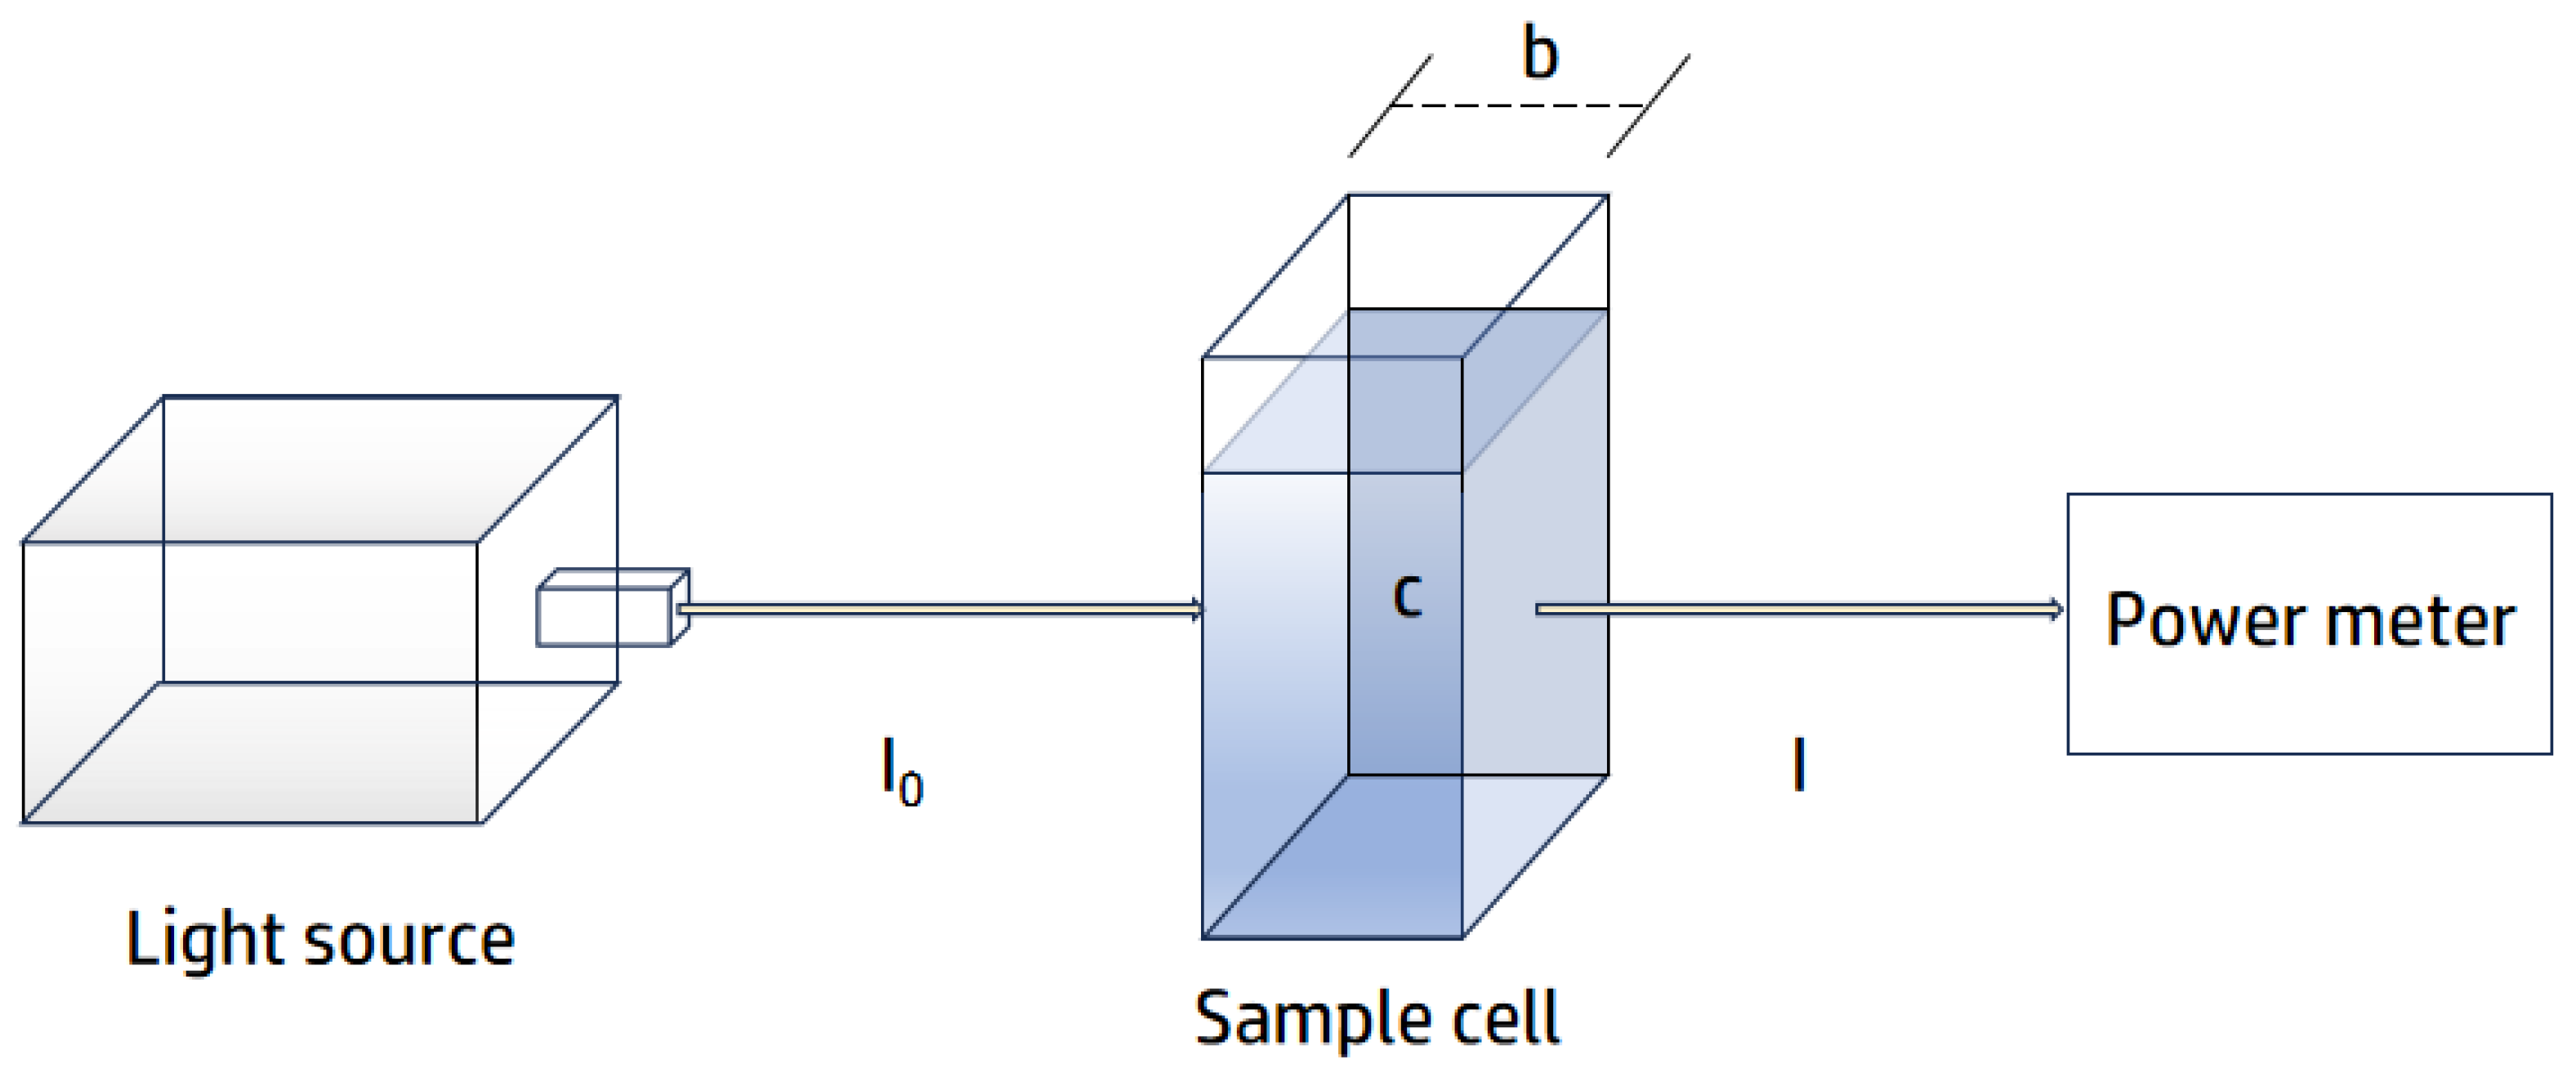
The basis for quantitative analysis of high-concentration COD parameters using ultraviolet absorption spectrophotometry is Lambert–Beer’s law. The schematic diagram is shown in Figure 1. When a beam of ultraviolet light passes through the solution, the absorbing substances absorb part of the light energy, reducing the intensity of the transmitted light. The degree of attenuation of the transmitted light is proportional to the solution. The absorbance of the medium is directly proportional to its thickness and the concentration of the substance [35]. The mathematical expression of Lambert–Beer is as follows:
A = l g I 0 I = l g 1 T = k b c
In Equation (1), A represents absorbance; T represents transmittance, defined as the ratio of transmitted light intensity I to incident light intensity I0; k represents the molar absorption coefficient related to the properties of the absorbing substance and the wavelength of the incident light; b represents the thickness of the absorbing layer, measured in cm; c represents the concentration of the absorbing substance, measured in mol/L. Previous studies have shown that potassium hydrogen phthalate (KHP) exhibits strong ultraviolet absorption, with significant absorption around 266 nm [36]. In this spectral region, the absorbance was found to be linear within experimental error, consistent with the Lambert–Beer law.
Figure 1. Schematic diagram of Lambert–Beer law detection principle.
Water 18 00093 g001

2.2. Laser Induce Fluorescence

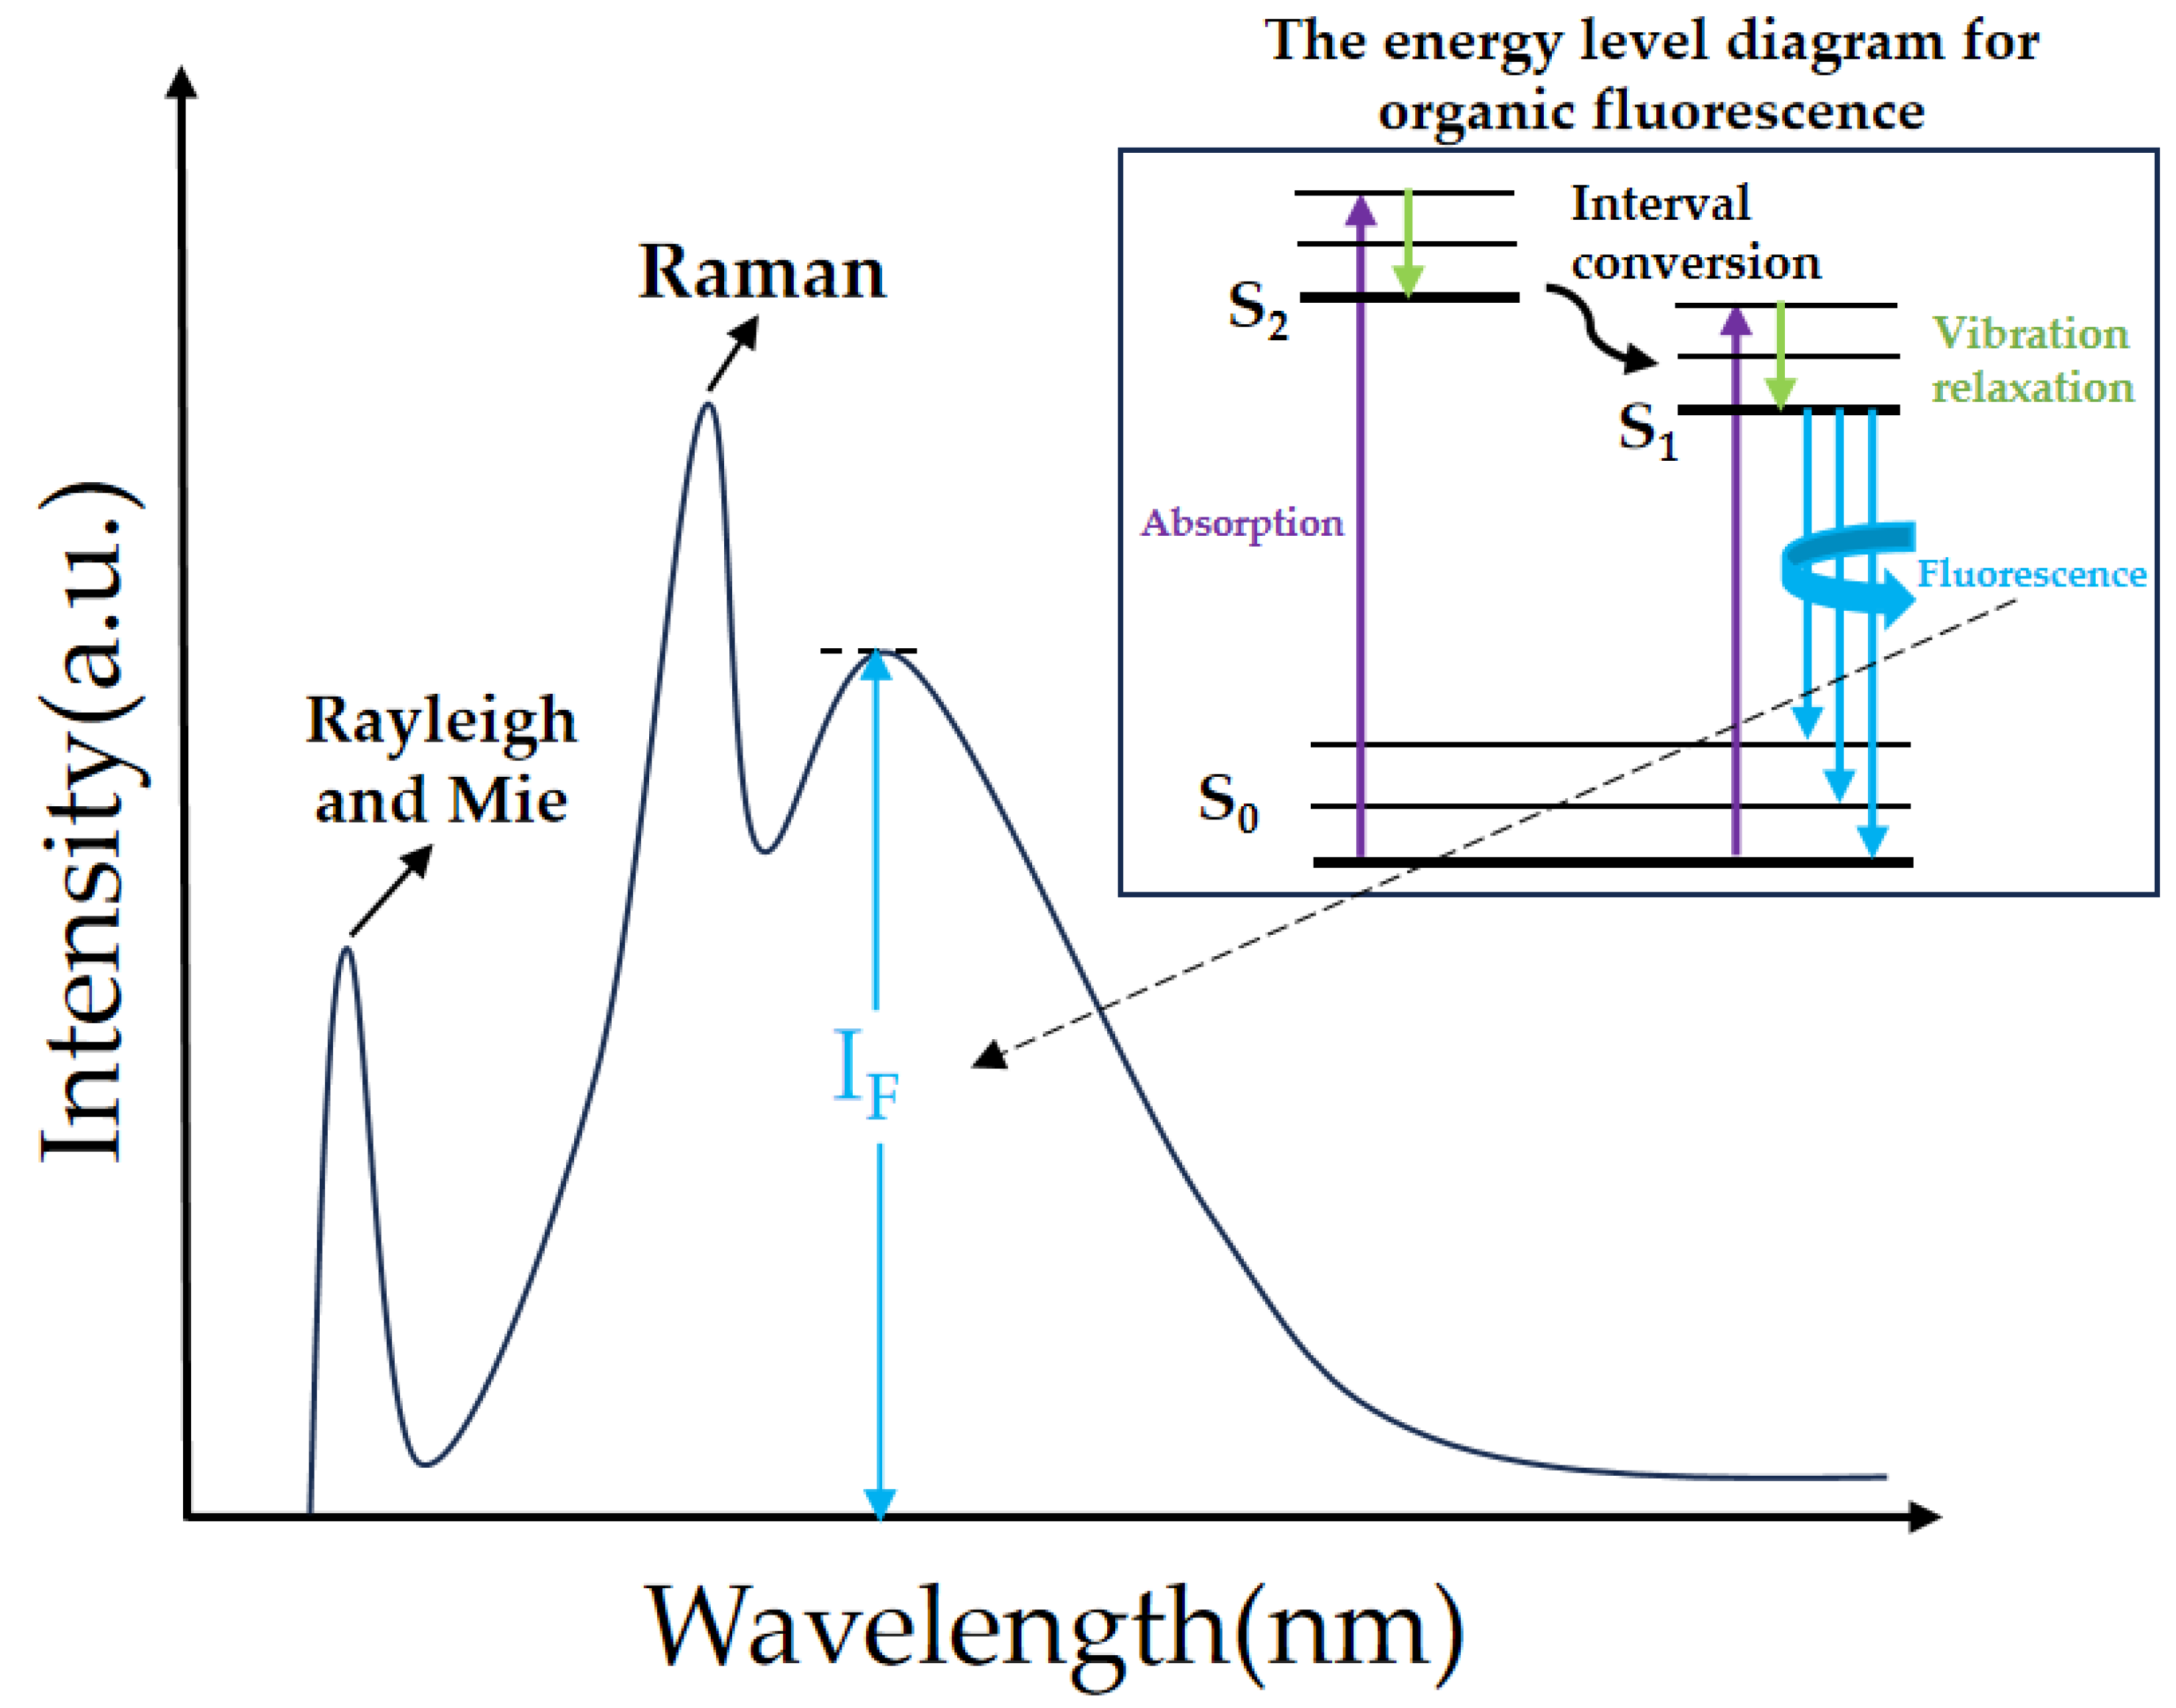
Laser-induced fluorescence (LIF) relies on molecular energy-level transitions. An ultraviolet laser irradiates the aqueous sample, promoting electrons from the ground state to an excited state. As the molecules relax back to the ground state, they emit photons at characteristic wavelengths; this fluorescence is collected for highly sensitive detection. The detailed process is illustrated in Figure 2.
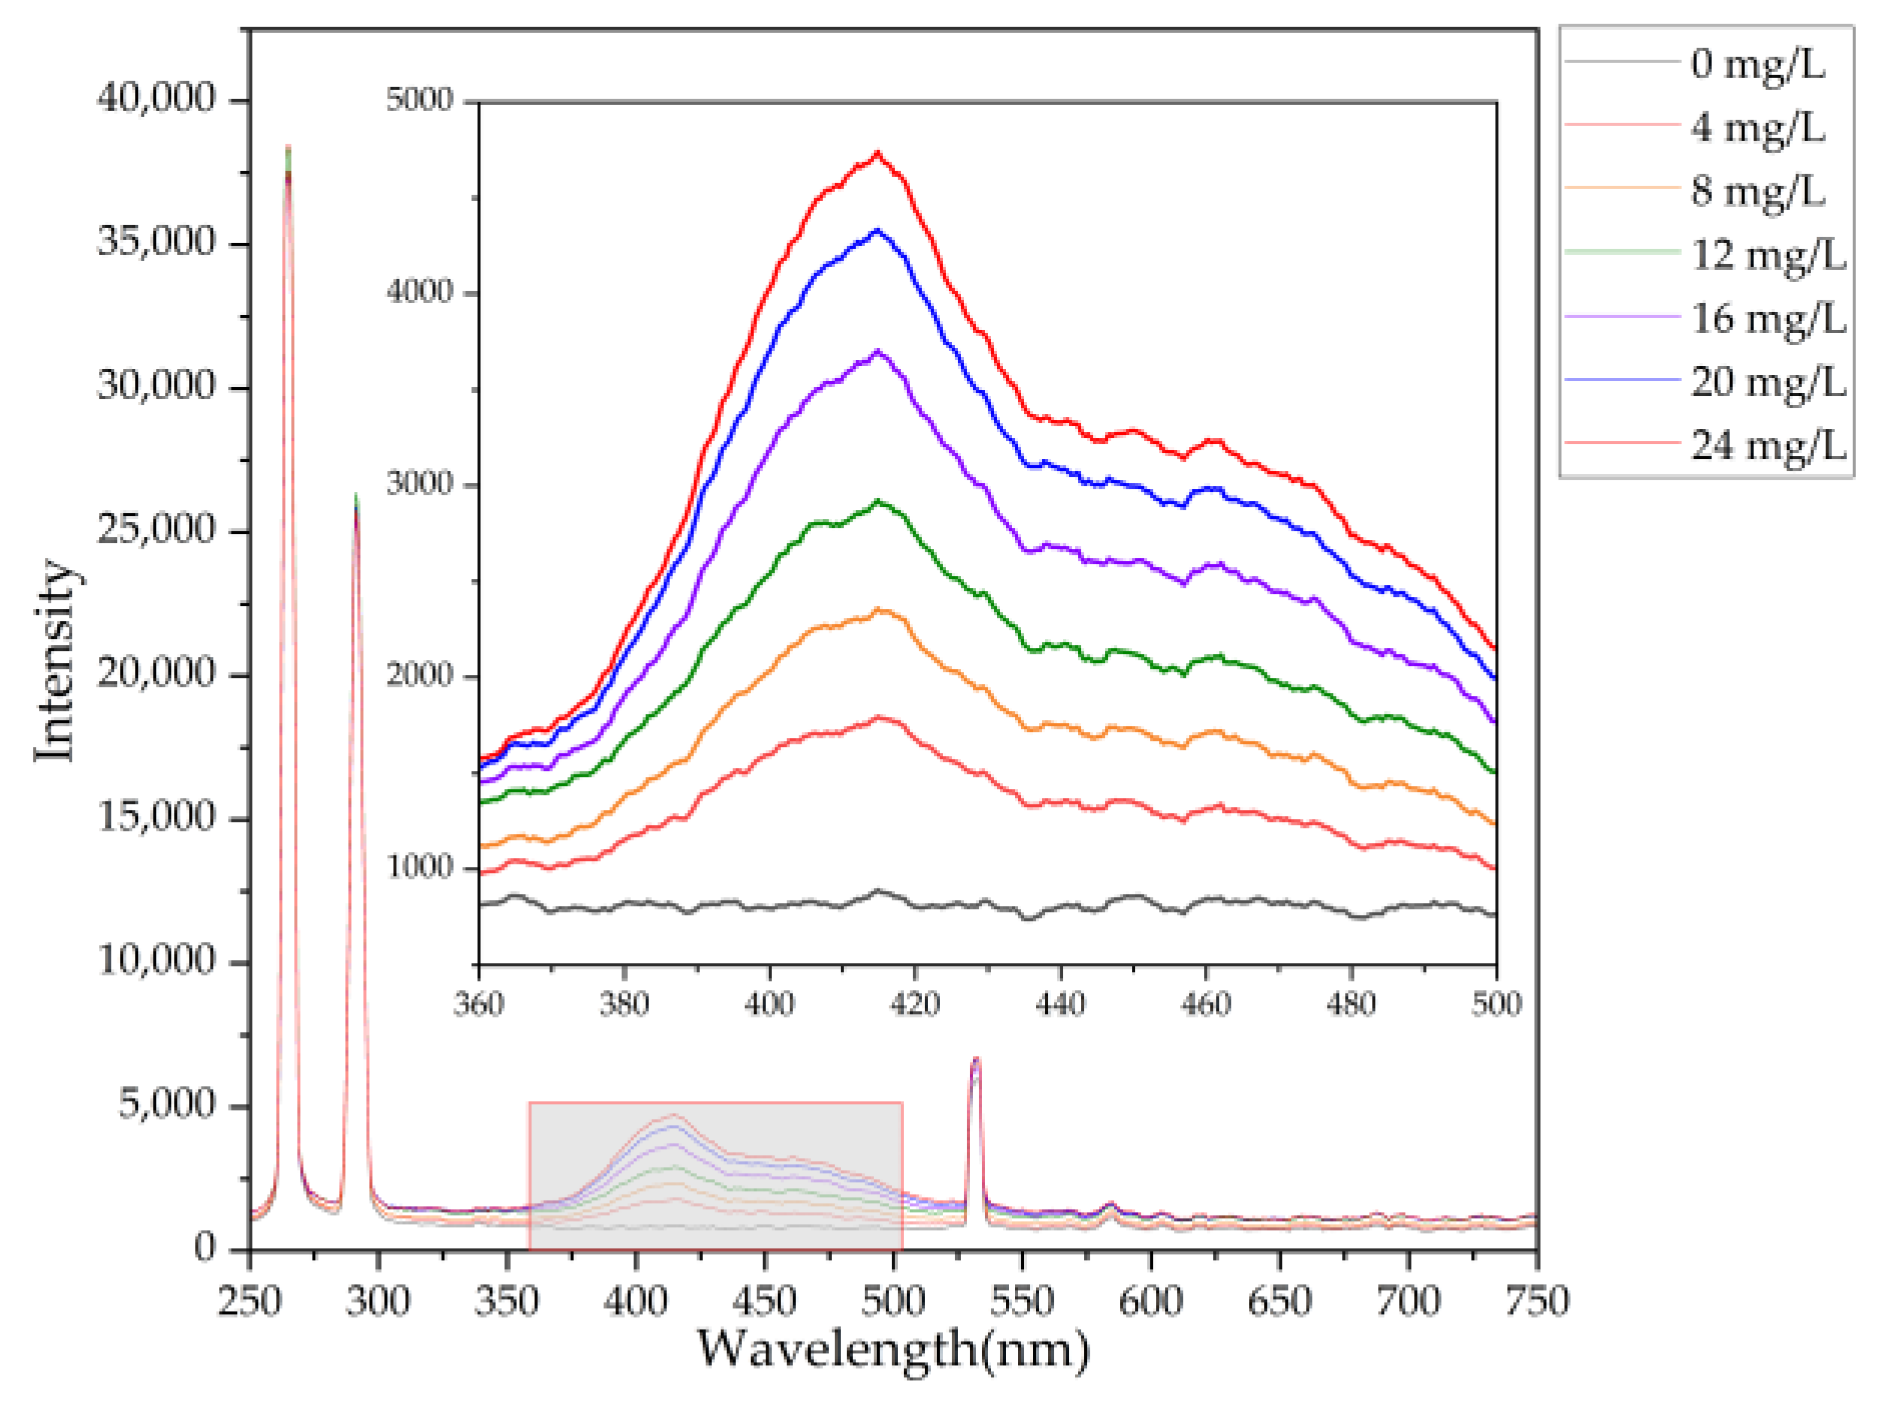
A typical spectrum produced by a laser incident on water is shown in Figure 2. The entire spectrum primarily comprises Rayleigh- and Mie-scattered laser signals from elastic scattering, Raman signals from inelastic scattering, and DOM (dissolved organic matter) fluorescence signals (IF). Upon laser irradiation, the fluorescence intensity increases linearly with dissolved organic matter concentration [28], indicating a proportional relationship between COD and fluorescence signal:
C = k × IF + b
In Equation (2), C represents the concentration of organic matter in the water sample to be tested, and IF represents the fluorescence intensity. The coefficients k and b are constants that can be determined through experiments [37].
In practical applications, imaging technology serves as an important tool for capturing and analyzing visual fluorescence signals. Two-dimensional sensors acquire fluorescence images generated by laser excitation of the sample and provide the basis for quantitative analysis [38]. The combined imaging and image-processing scheme has been used to verify and establish the quantitative relationship between fluorescence signals and COD concentration in numerous studies [39]. This technological combination lays an important theoretical foundation and technical guarantee for real-time, non-contact, and rapid assessment of water quality COD using laser-induced fluorescence and image processing technologies.

2.3. Design of Laser Absorption and Fluorescence Spectroscopy Fusion System

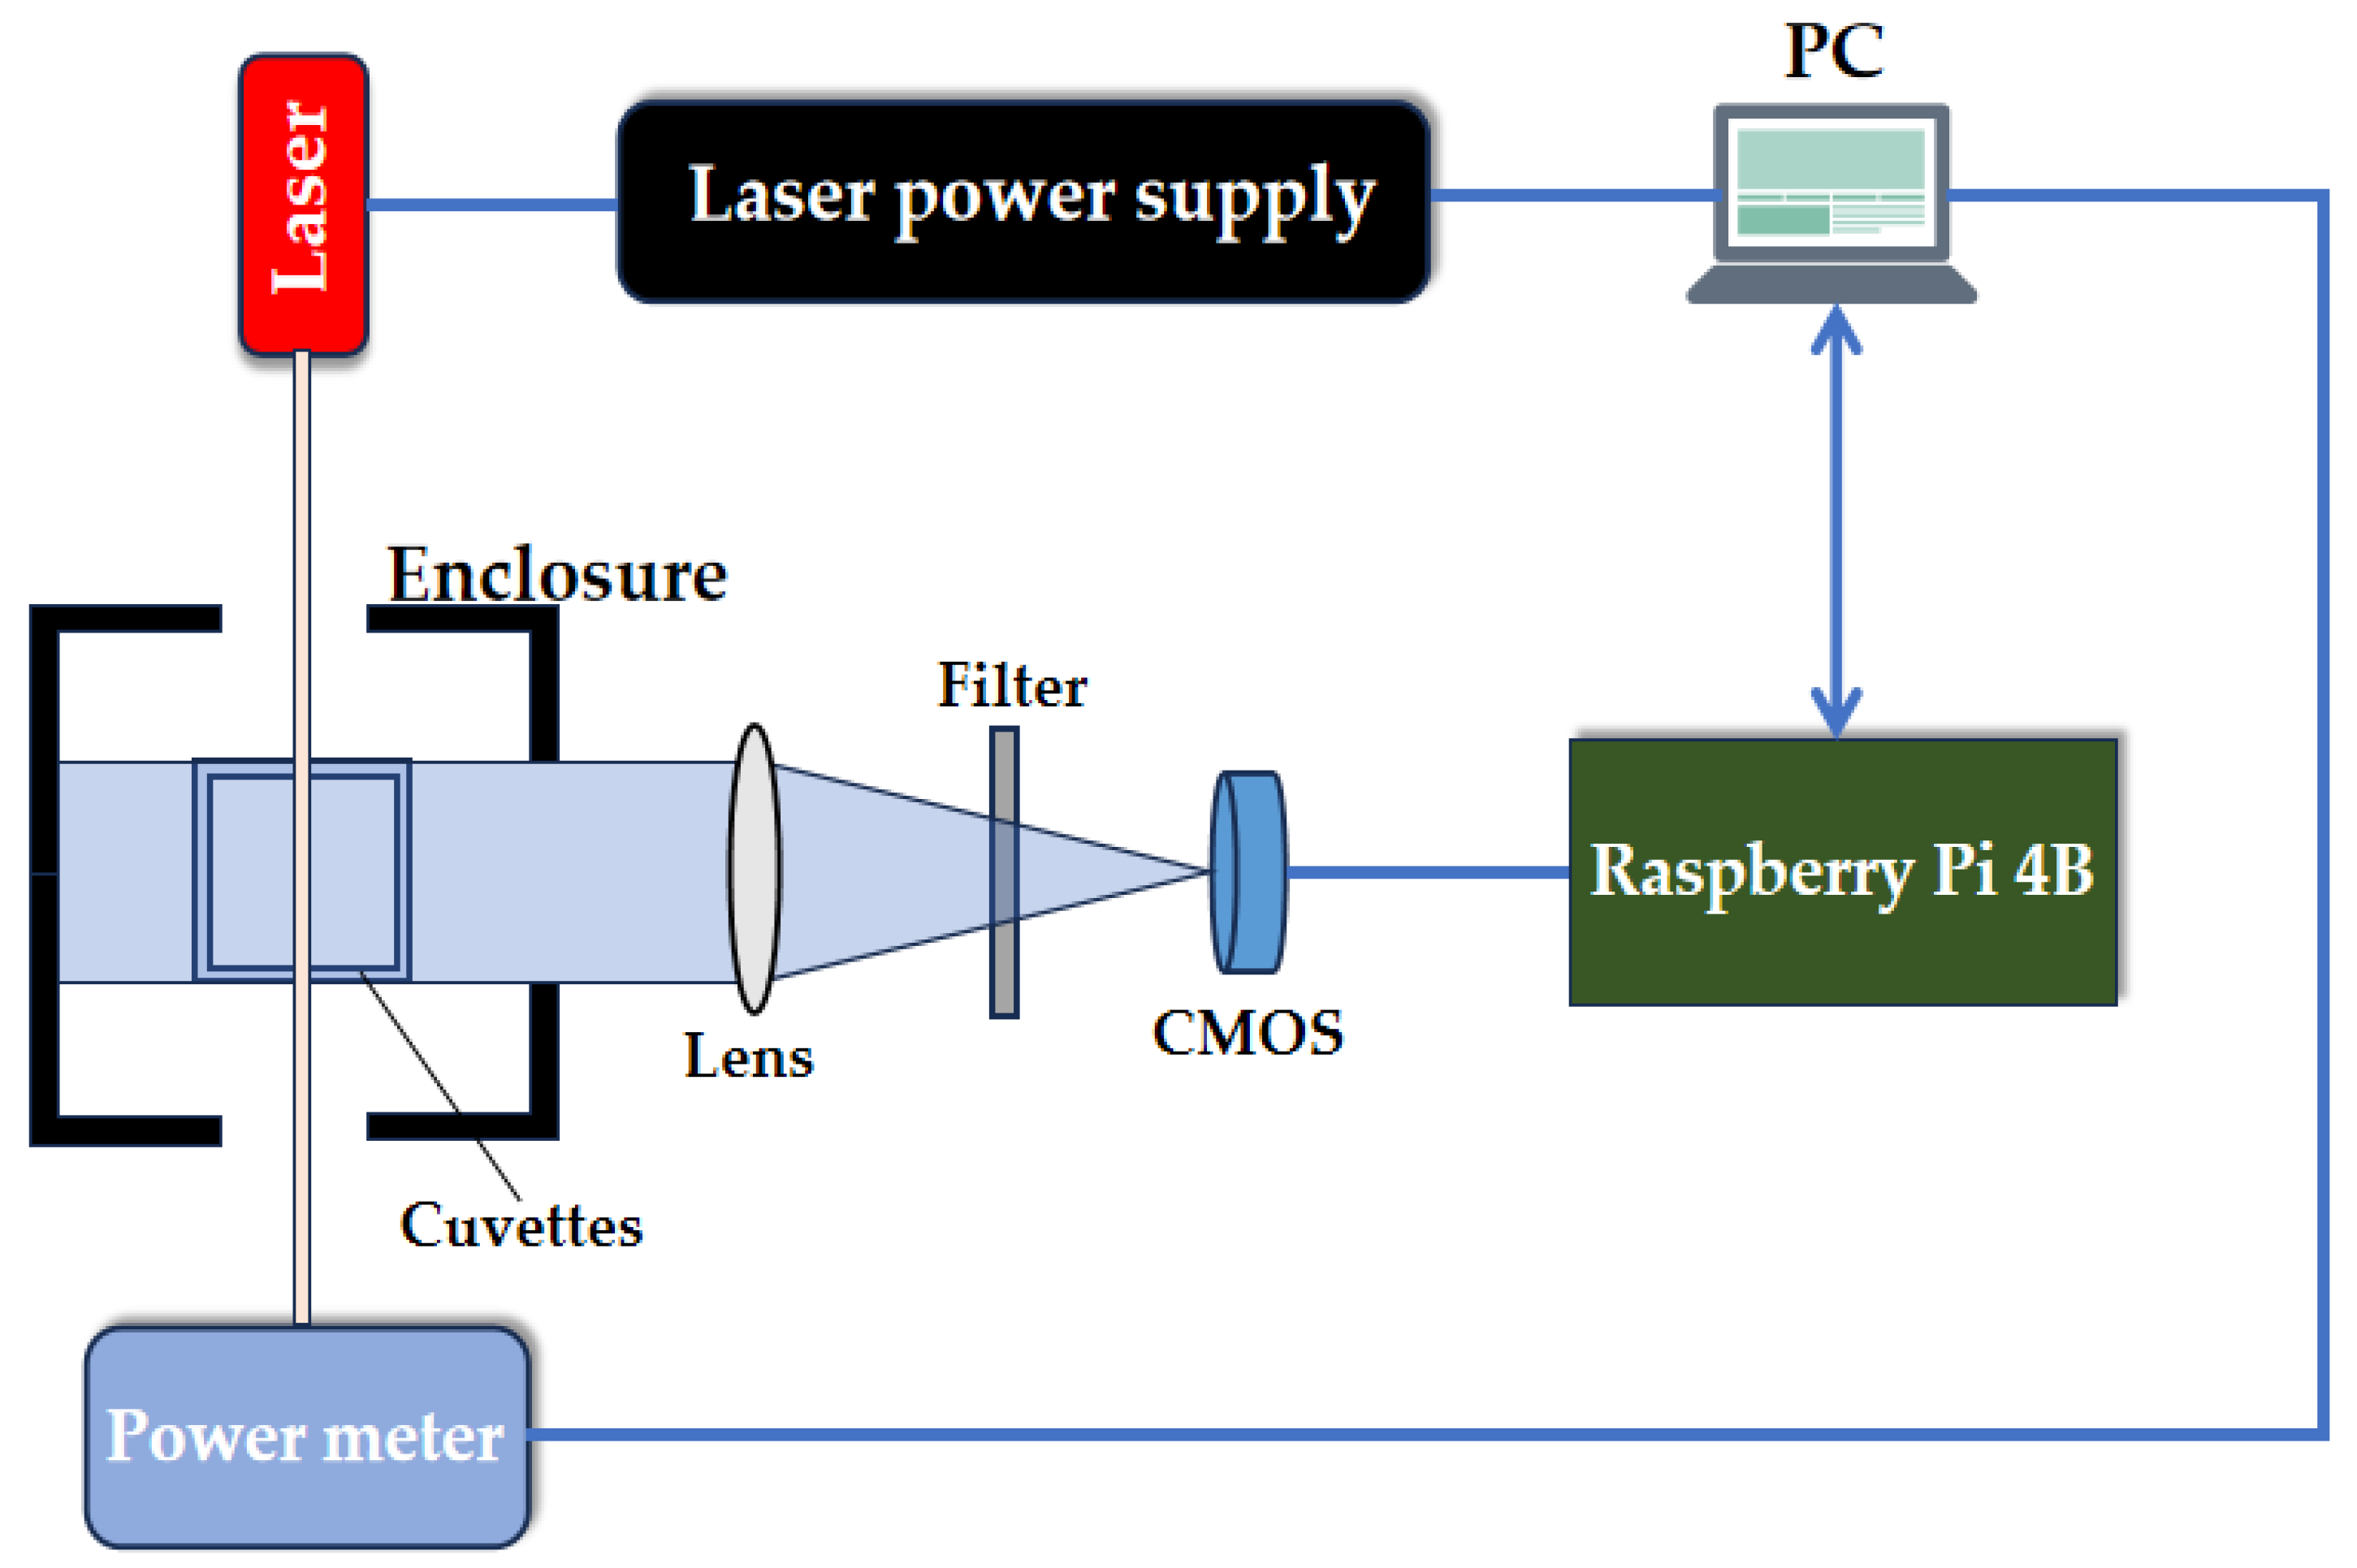
The structure of this system is shown in Figure 3. It consists of five parts: the laser emission unit, the image acquisition unit, the sample detection unit, the optical power meter, and the computer. The laser emission unit consists of a 266 nm microchip solid-state laser (MCA series, RealLight Technology Co., Ltd., Beijing, China) and its corresponding power supply, delivering 40 mW of pulsed laser output. The image acquisition stage comprises a lens, a long-pass filter, and a CMOS sensor controlled by a Raspberry Pi 4 Model B (Raspberry Pi Foundation, Cambridge, UK). The sample compartment employs a four-sided quartz cuvette enclosed by a light-tight shield. An optical power meter (VLP-2000, Beijing Yanbang Technology Co., Ltd., Beijing, China) is used to calibrate the laser output and to measure the transmitted power after the beam passes through the sample. The laboratory standard solution is a potassium hydrogen phthalate (KHP) solution prepared according to the Chinese national standard HJ 828–2017. We weighed 0.4251 g of potassium hydrogen phthalate (KHP, of superior purity, with a purity of ≥99.8%) that had been dried at 105 °C for 2 h, dissolved it in laboratory pure water, diluted it to 1000 mL, and mixed it well to obtain a standard solution with a COD concentration of 500 mg/L. All working standards used in the experiments were prepared by serial dilution of this standard solution with laboratory pure water. The sample cell is a four-sided light-transmitting quartz cuvette with dimensions of 10 mm × 10 mm × 30 mm. The image sensor is the Sony IMX219 CMOS image sensor (Isahaya-shi, Nagasaki, Japan) with an optical size of 3.68 mm × 2.76 mm and an effective pixel array of 3280 × 2464. The system employs Raspberry Pi 4B as the embedded core platform; its 2-lane MIPI CSI-2 interface provides 2 Gbps bandwidth, enabling stable 60 fps fluorescence image acquisition at 640 × 480 resolution while simultaneously performing 60 fps real-time display, satisfying high-speed and zero-latency imaging requirements, and it handles CMOS sensor driving and local RGB data buffering.
The specific working process of the detection system is as follows: The incident laser enters from the left, passes horizontally through the quartz cuvette, and is detected by an optical power meter, which displays the transmitted power on the host computer. Simultaneously, the beam excites fluorescence in the sample. A CMOS image sensor, oriented orthogonally to the incident beam, captures the fluorescence image; the image and RGB data are stored on the Raspberry Pi 4 Model B. Both the laser operating mode and power are controlled by the host computer, which also displays the fluorescence images and analytical results.

3. Experimental Detection and Result Analysis

3.1. COD Detection by Ultraviolet Absorption Spectrophotometry

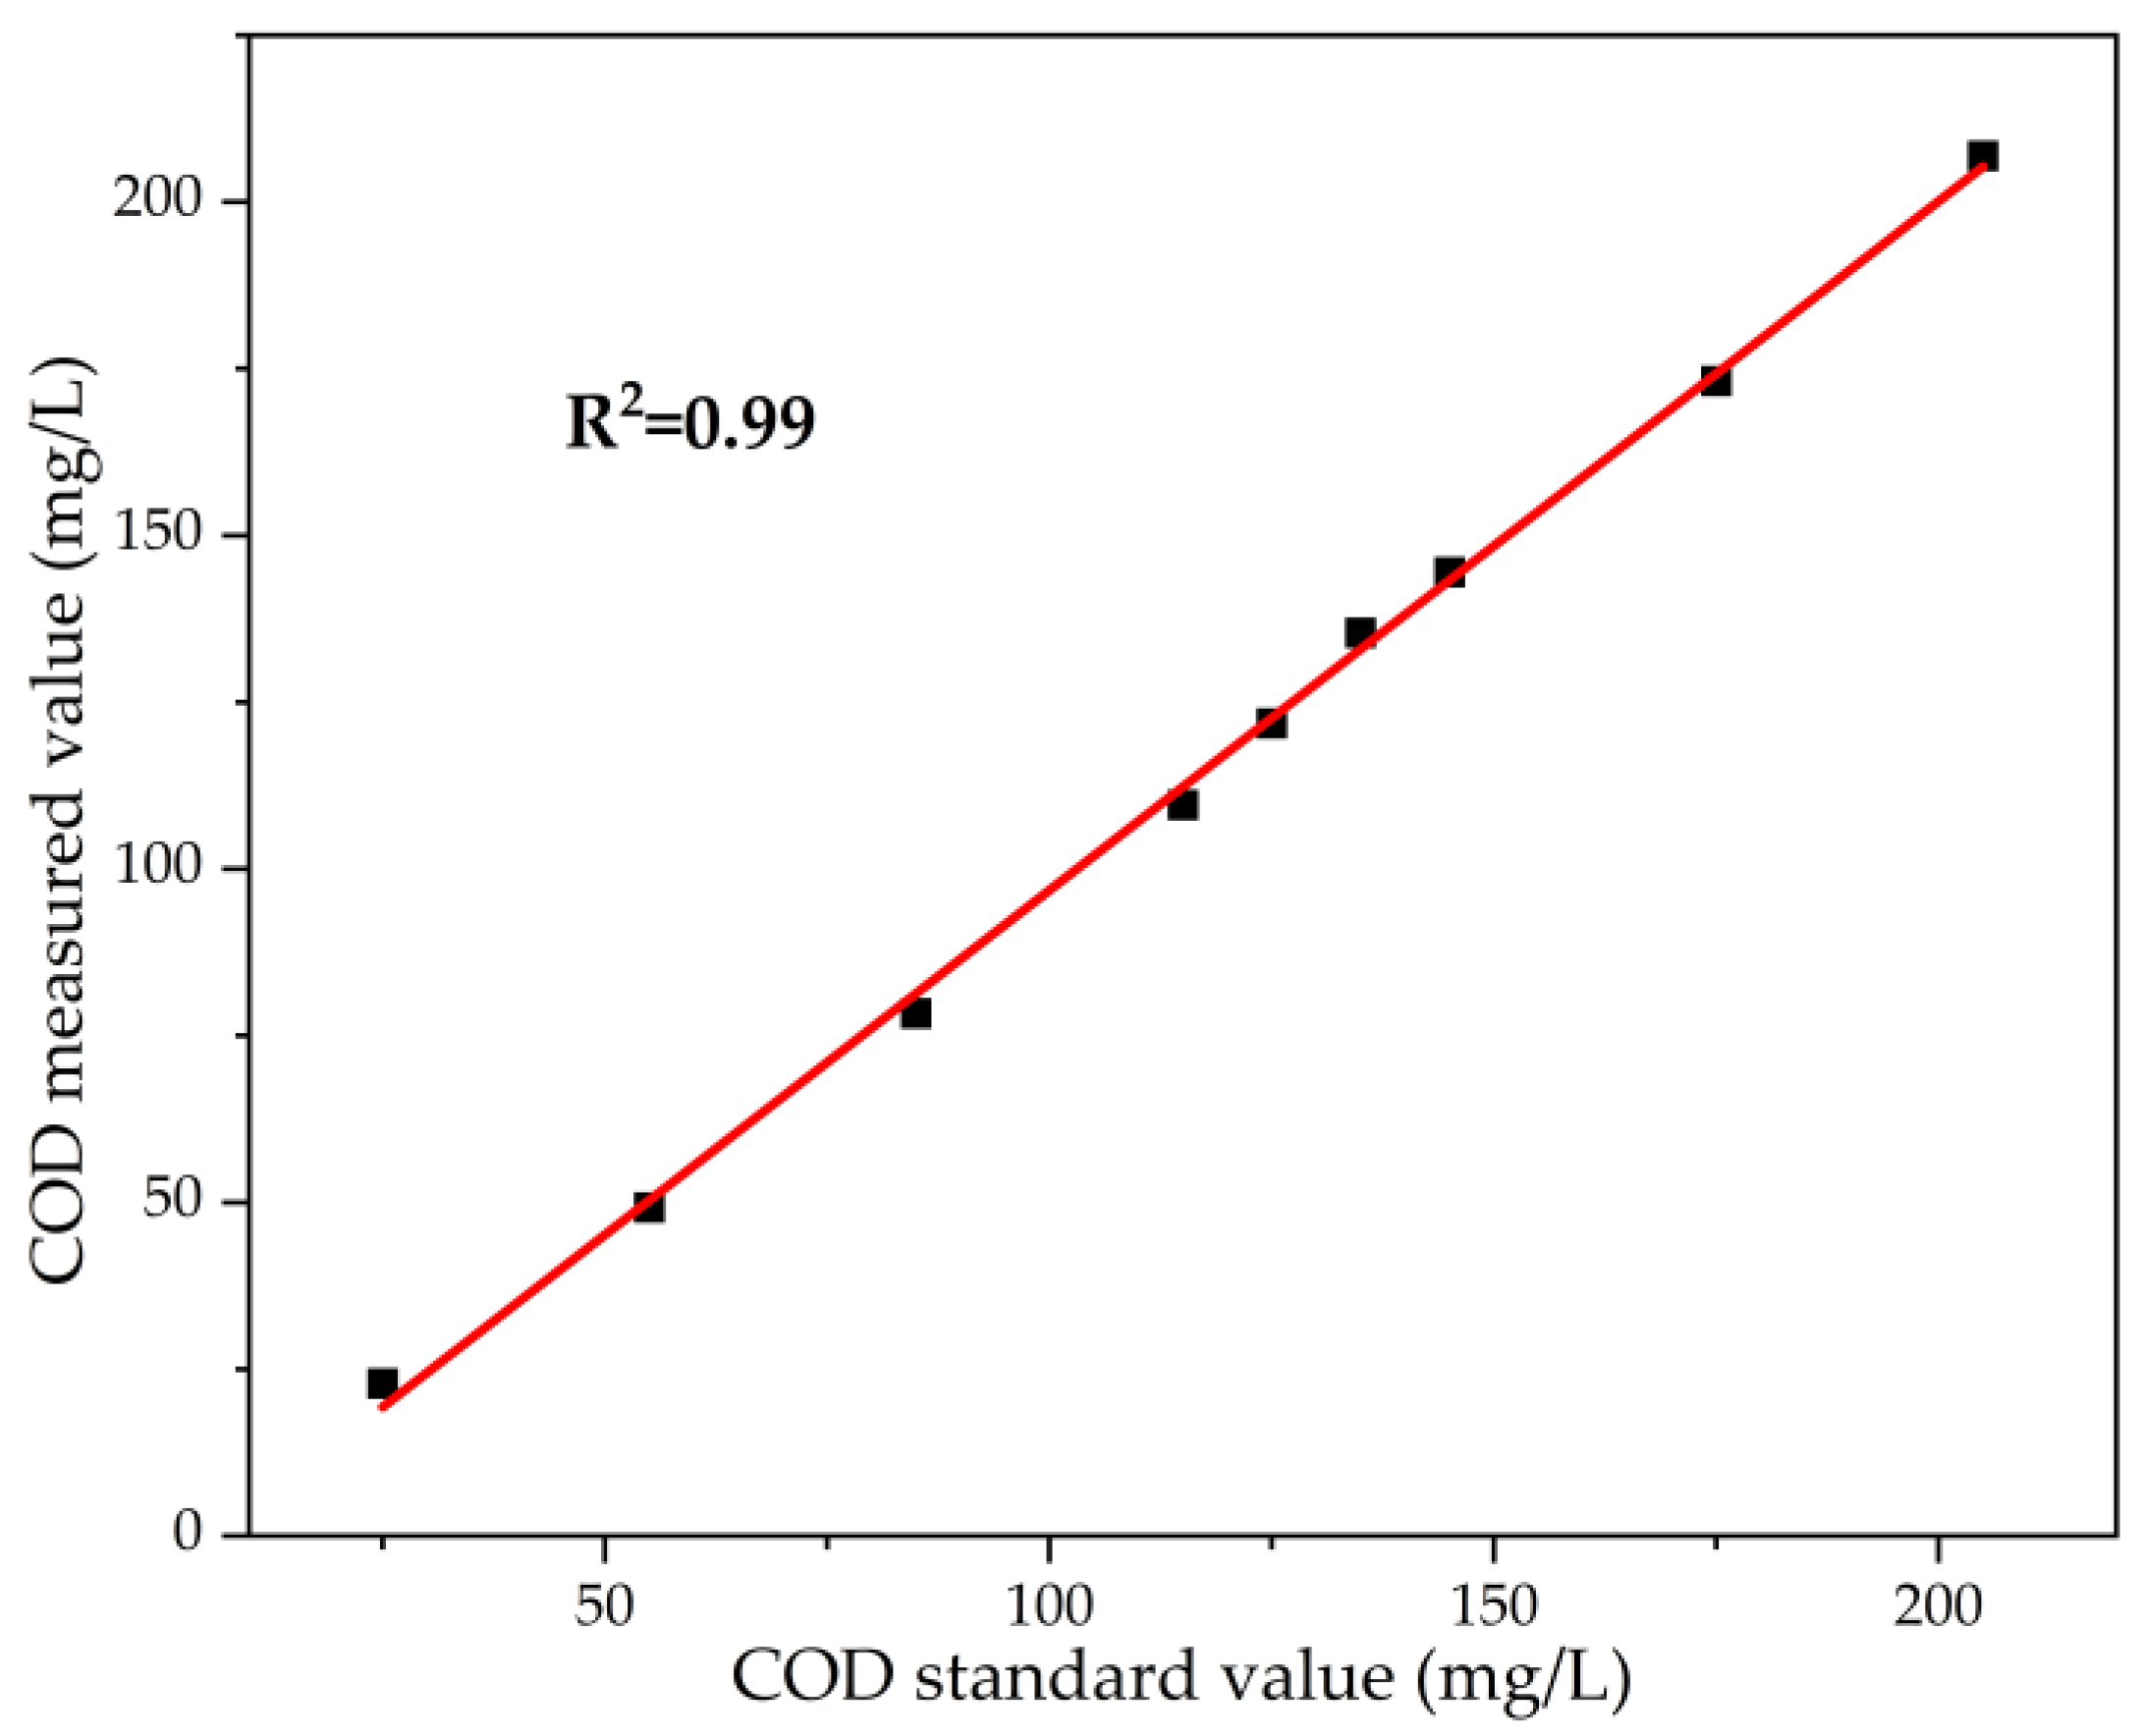
The COD module is detected by ultraviolet absorption photometry, which calculates the absorbance of the solution from measurements of incident and transmitted light powers. Within the concentration range of 20 mg/L to 220 mg/L, the absorbance of 20 groups of COD standard solutions with concentration differences of 10 mg/L was detected. The experimental results show a strong linear correlation between the COD solution concentration and absorbance. Based on this linear relationship, a calibration curve of absorbance versus COD concentration was constructed (R2 = 0.993). Absorbance data for solutions with different COD concentrations were recorded, and their model-predicted values were calculated from the resulting equation.
Table 1 presents the following information for each working point: 1. The original concentration values CCOD; 2. The fitted values Cm obtained from the regression model; 3. The differences fi between CCOD and Cm; 4. The relative errors δ between the model predictions and the actual values. The alignment between measured and actual values is displayed in Figure 4. From 25 mg/L to 115 mg/L, the relative error remains about 8%, whereas it drops below 3% in the 125–205 mg/L band, indicating the model’s higher accuracy at elevated concentrations.

3.2. COD Detection by Laser-Induced Fluorescence
The setup in Figure 3 can record fluorescence images but does not directly provide emission spectra. To maximize fluorescence signal collection, the fiber-optic spectrometer (M3000, Huntian Technology Co., Ltd., Beijing, China) was positioned at 90° to the laser beam, perpendicular to the excitation path, and focused on the center of the cuvette.
The spectral results are presented in Figure 5. The spectrum exhibits a laser-scattering peak at 266 nm, a Raman peak at 292 nm (corresponding to a wavenumber of 3400 cm−1, generated by the excitation of water molecules), and a secondary diffraction peak at 532 nm, originating from the 266 nm laser. Additionally, a broad fluorescence band ranging from 360 to 500 nm is observed, attributed to the laser-induced fluorescence of organic substances in the water. Notably, as the concentration of the COD standard solution increases, the fluorescence intensity in this region increases correspondingly, indicating a positive correlation between the two.
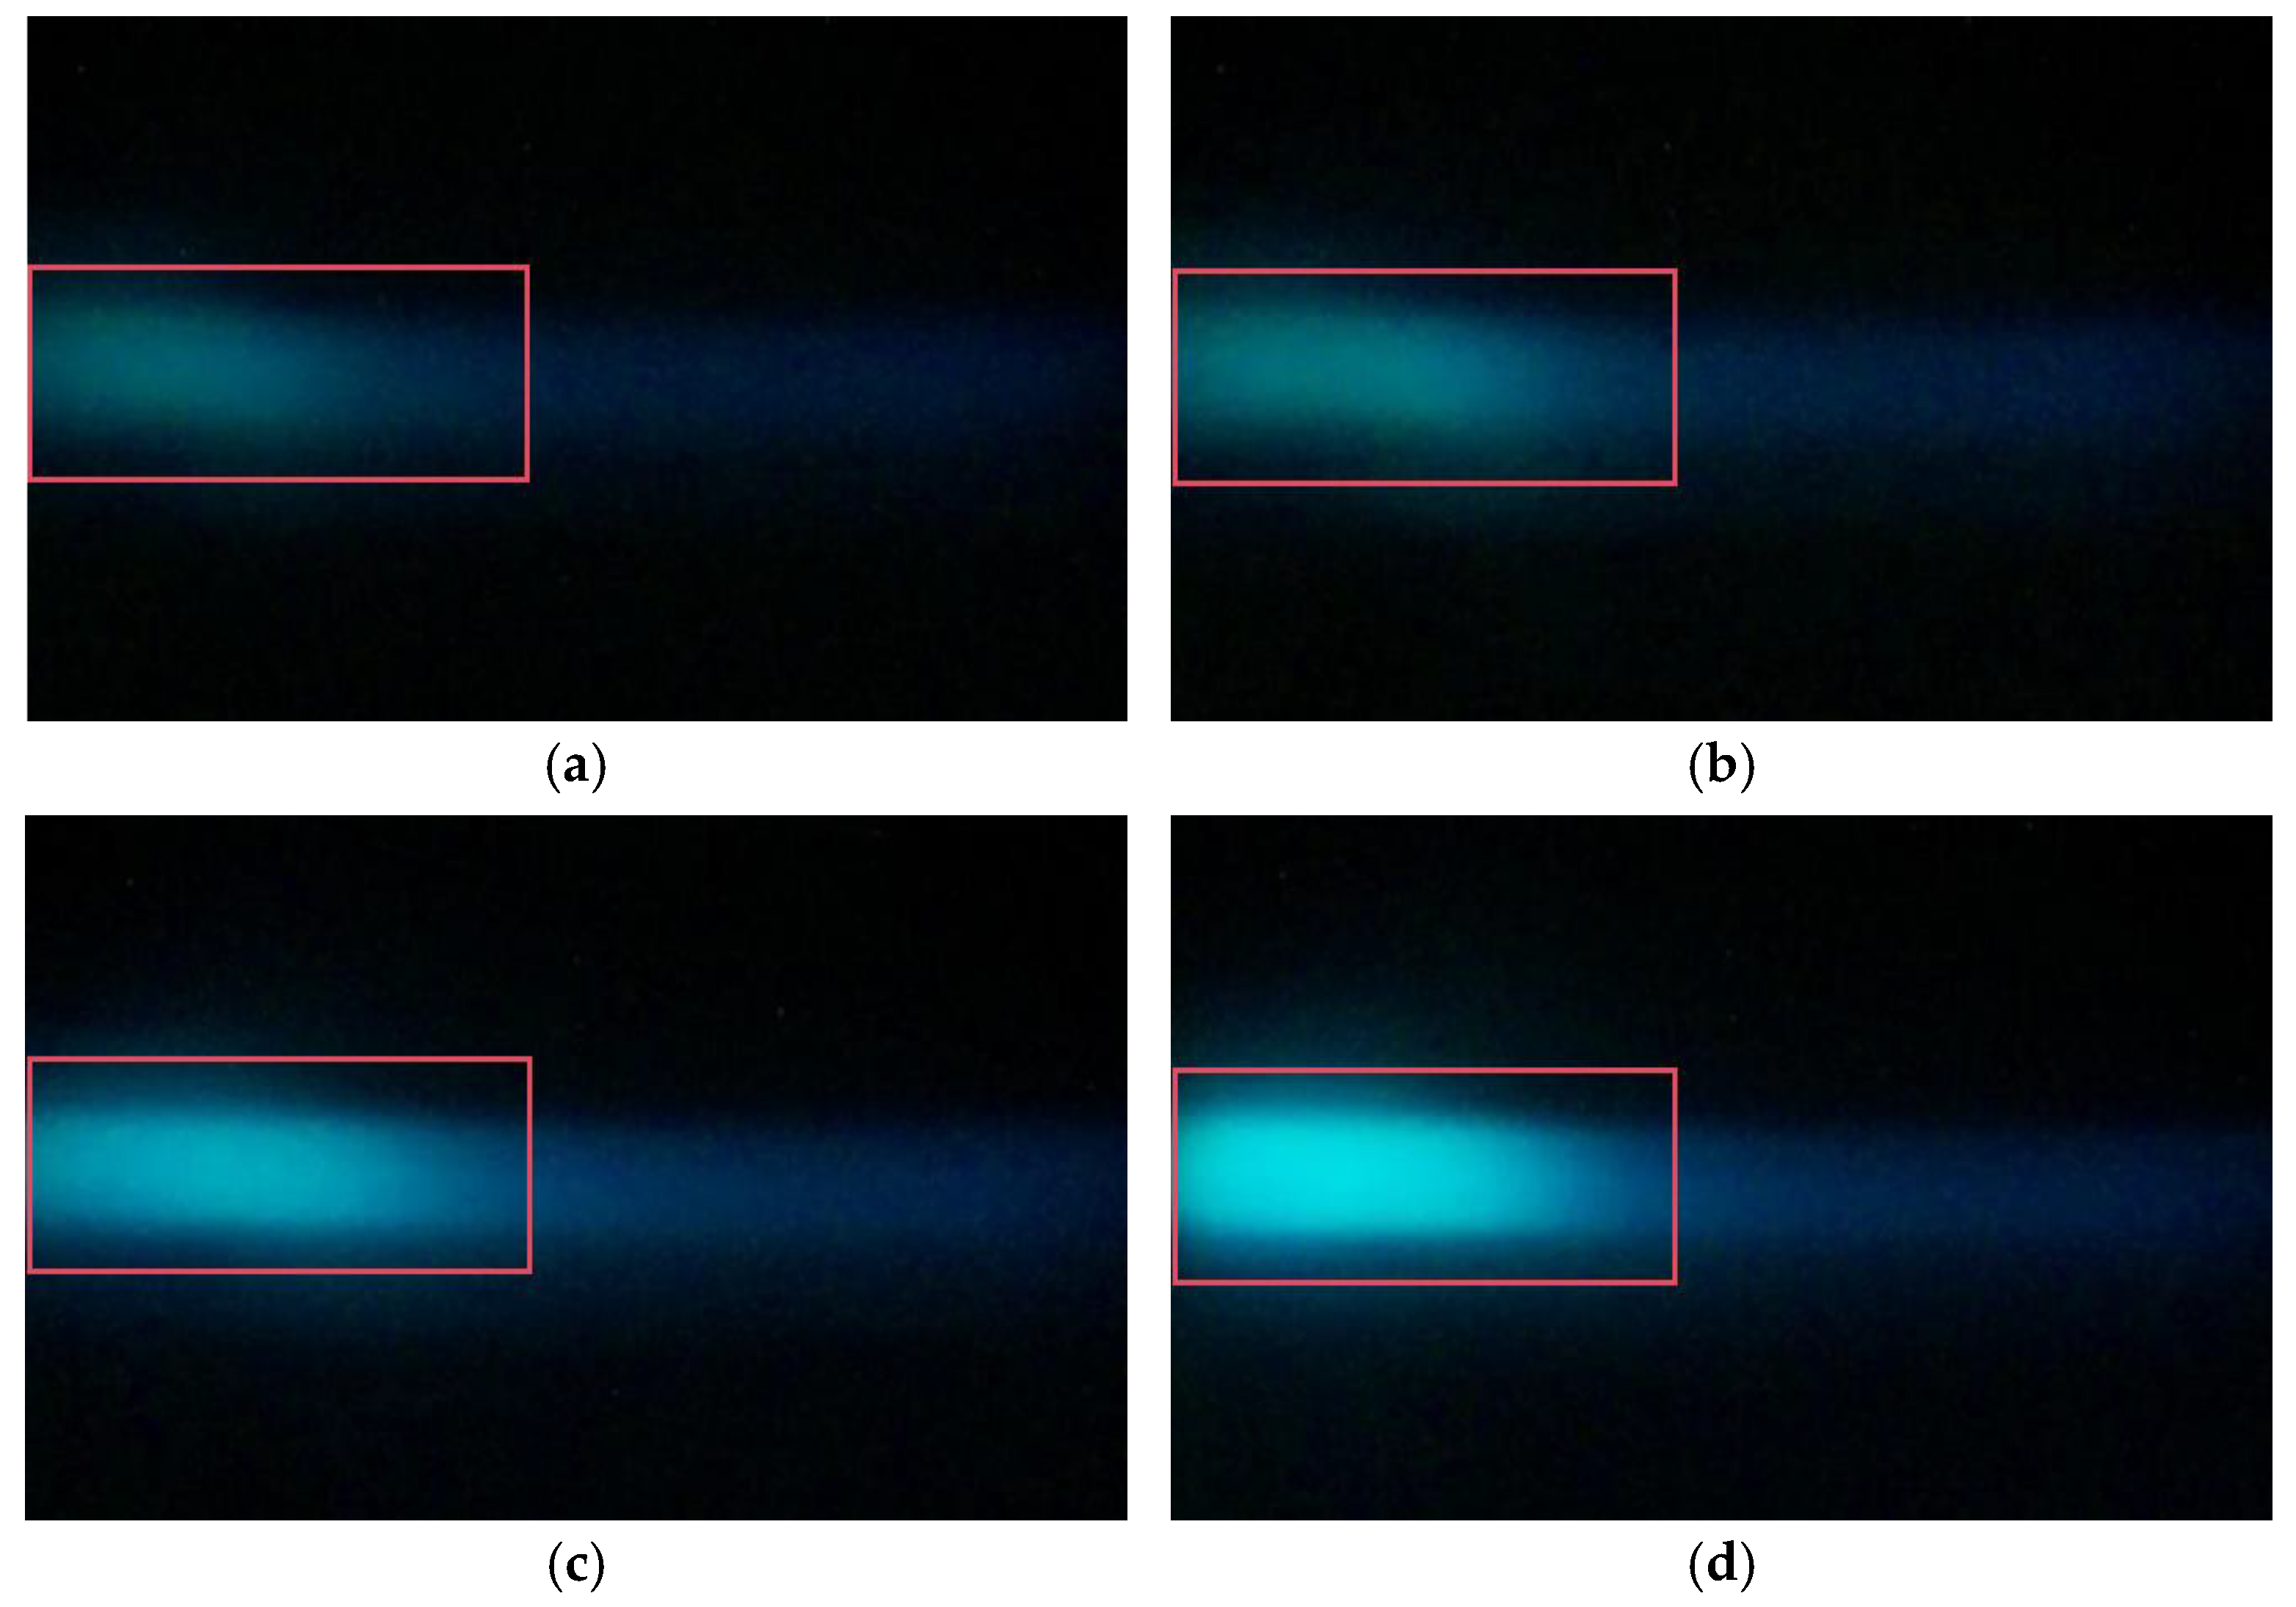
To capture the steep variation in fluorescence intensity at low concentrations, measurement points were concentrated in the 0–5 mg/L range (1 mg/L intervals) and spaced at 2 mg/L intervals for 6–30 mg/L. Due to the attenuation of fluorescence intensity along the optical path, the excitation fluorescence is stronger in the first half of the path. Accordingly, a 260 × 100-pixel region of interest (ROI) was defined in the front half of the optical path, where the fluorescence signal was strongest and least affected by propagation losses; the averaged RGB pixel value computed within this ROI was used to quantify fluorescence intensity as a function of concentration. The corresponding images captured by the camera showing the blue fluorescence induced by laser excitation in sample solutions of different concentrations are presented in Figure 6. This ROI selection enhances the efficiency of fluorescence-signal detection, reduces background interference, and accelerates image processing.
The CMOS image sensor used in this system follows the Bayer pattern. Each RGB channel has a different spectral range: the blue channel (B) covers approximately 400–500 nm, the green channel (G) covers approximately 500–580 nm, and the red channel (R) covers approximately 580–700 nm. According to the LIF spectrum shown in Figure 5, the fluorescence generated by laser excitation is extremely weak in the red wavelength range. The 266 nm secondary diffraction peak at 532 nm interferes with the green channel value. The fluorescence region (380–480 nm) is mainly located in the blue wavelength range. Therefore, in the image-processing step, only the blue-channel signal was used as the metric for laser-induced fluorescence, thereby simultaneously capturing emission within the blue band and effectively suppressing spectral cross-talk from the red and green channels. Bubbles and suspended particles can affect the color channel values in the image. Therefore, during image processing, two filtering steps were applied jointly: (1) to improve data stability, multi-frame averaging was used—each measurement was computed from 50 frames, increasing the signal-to-noise ratio while preserving the integrity of the fluorescence signal; (2) by examining the intensity of noisy pixels within the ROI, a high threshold well above the blue-channel values of the fluorescence-signal pixels was set, and any pixel exceeding this threshold was treated as a potential noise source and removed. During the investigation of laser-intensity effects on fluorescence images, a linear relationship between laser intensity and emitted signal was observed. Excessive laser intensity saturated and distorted the optical image, whereas insufficient laser intensity yielded signals too weak for accurate detection. Based on preliminary experiments and supporting calculations, the laser output power was set to 24 mW.
The detection was carried out on the test solutions in order of increasing concentration, and fluorescence images were acquired, as shown in Figure 6. Only a faint light-blue fluorescence was observed at the incident end; due to fluorescence attenuation, the intensity became extremely weak along the second half of the path. As the concentration of the tested solution increases, the fluorescence intensity at the incident point also increases. A distinct pale blue fluorescence outline is observed along the light path. Simultaneously, obvious fluorescence can be detected along the subsequent optical path. The fluorescence intensity within the ROI area is positively correlated with the concentration. As the concentration of the tested solution increases, the fluorescence intensity continues to rise. When the concentration of the tested solution reaches 22 mg/L, the fluorescence intensity within the ROI area gradually stabilizes and no longer increases significantly.
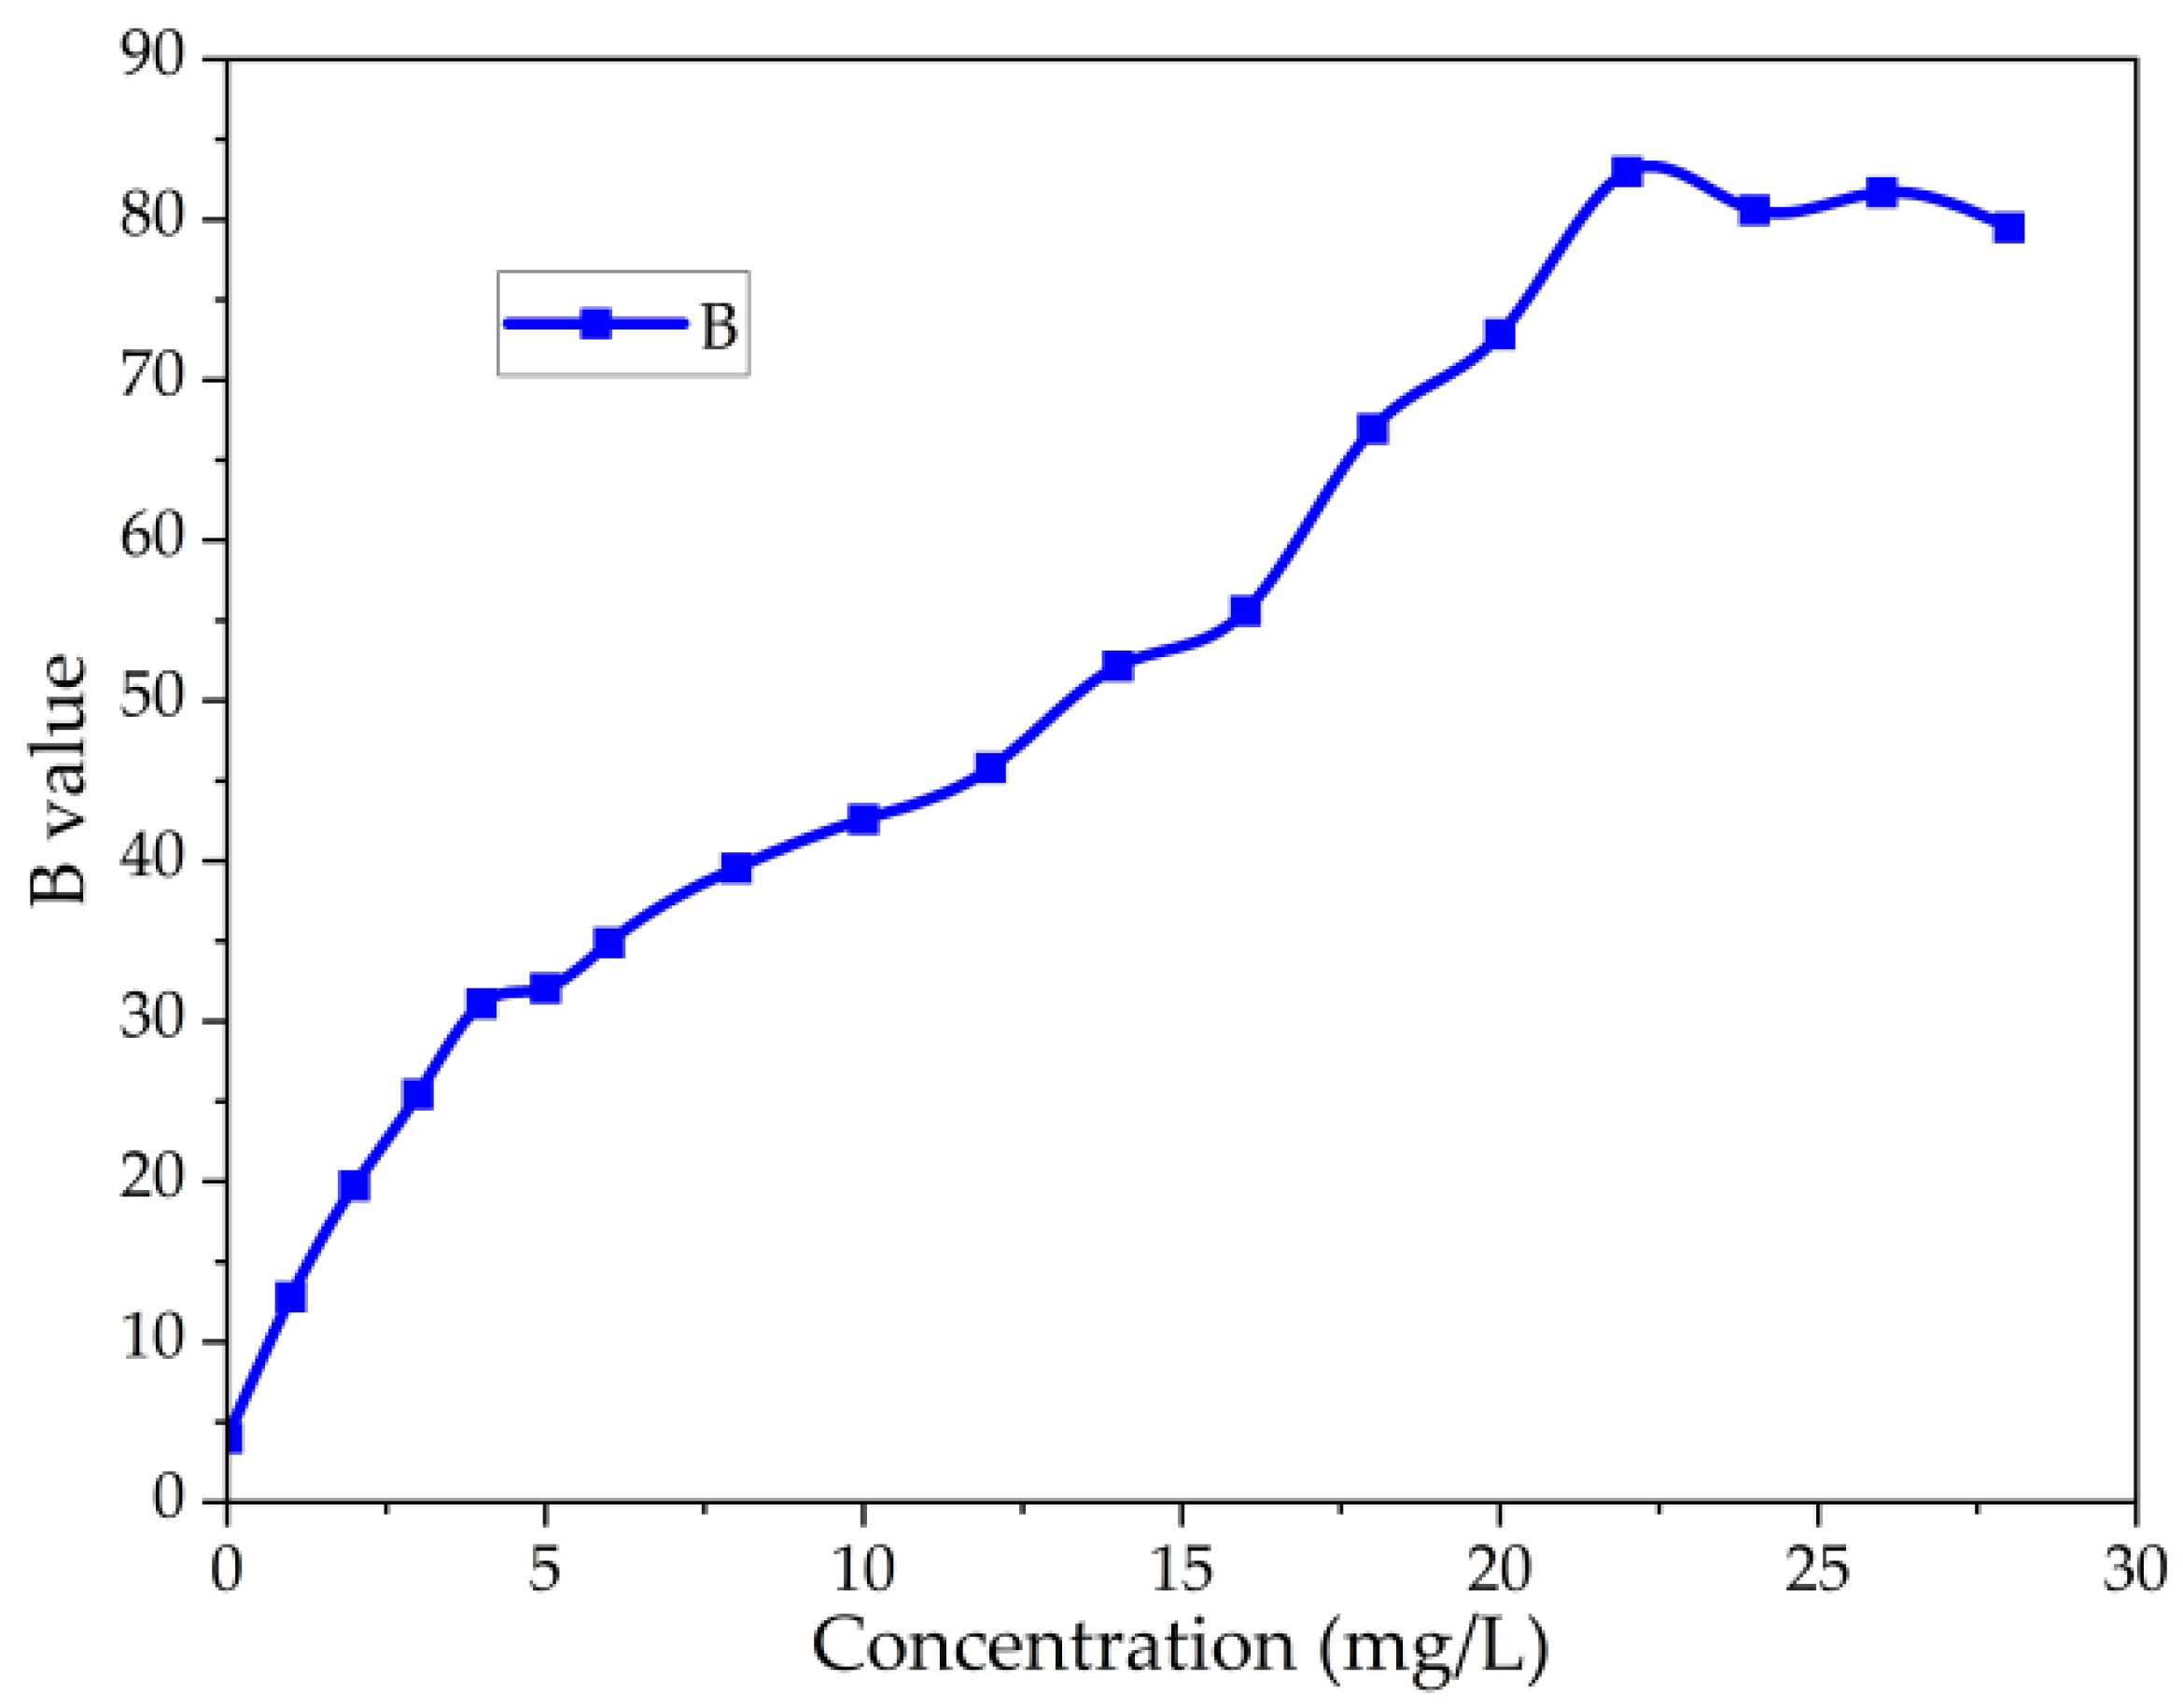
Figure 7 presents the mean blue-channel intensity within the fluorescence-image ROI as a function of COD concentration. A clear and robust linear correlation (0–22 mg/L) is observed; saturation is reached at 22 mg/L. Consequently, only the linear dataset (0–22 mg/L) was retained for further analysis to eliminate interference from nonlinear error. The corresponding linear relationship between the B value within the ROI and the concentration is:
CCOD = 0.32 × B − 4.25
Within the concentration range of 0–22 mg/L, the coefficient of determination R2 = 0.963. To visually assess the reliability of this linear regression equation, Table 2 provides the following information for each working point: 1. The original concentration value CCOD; 2. The fitted value Cm obtained by the regression model; 3. The difference fi between CCOD and Cm; 4. The relative error δ between the model prediction value and the actual concentration value.
Figure 7. Averaged blue-channel intensities from fluorescence regions of COD standard solutions at various concentrations.
Water 18 00093 g007
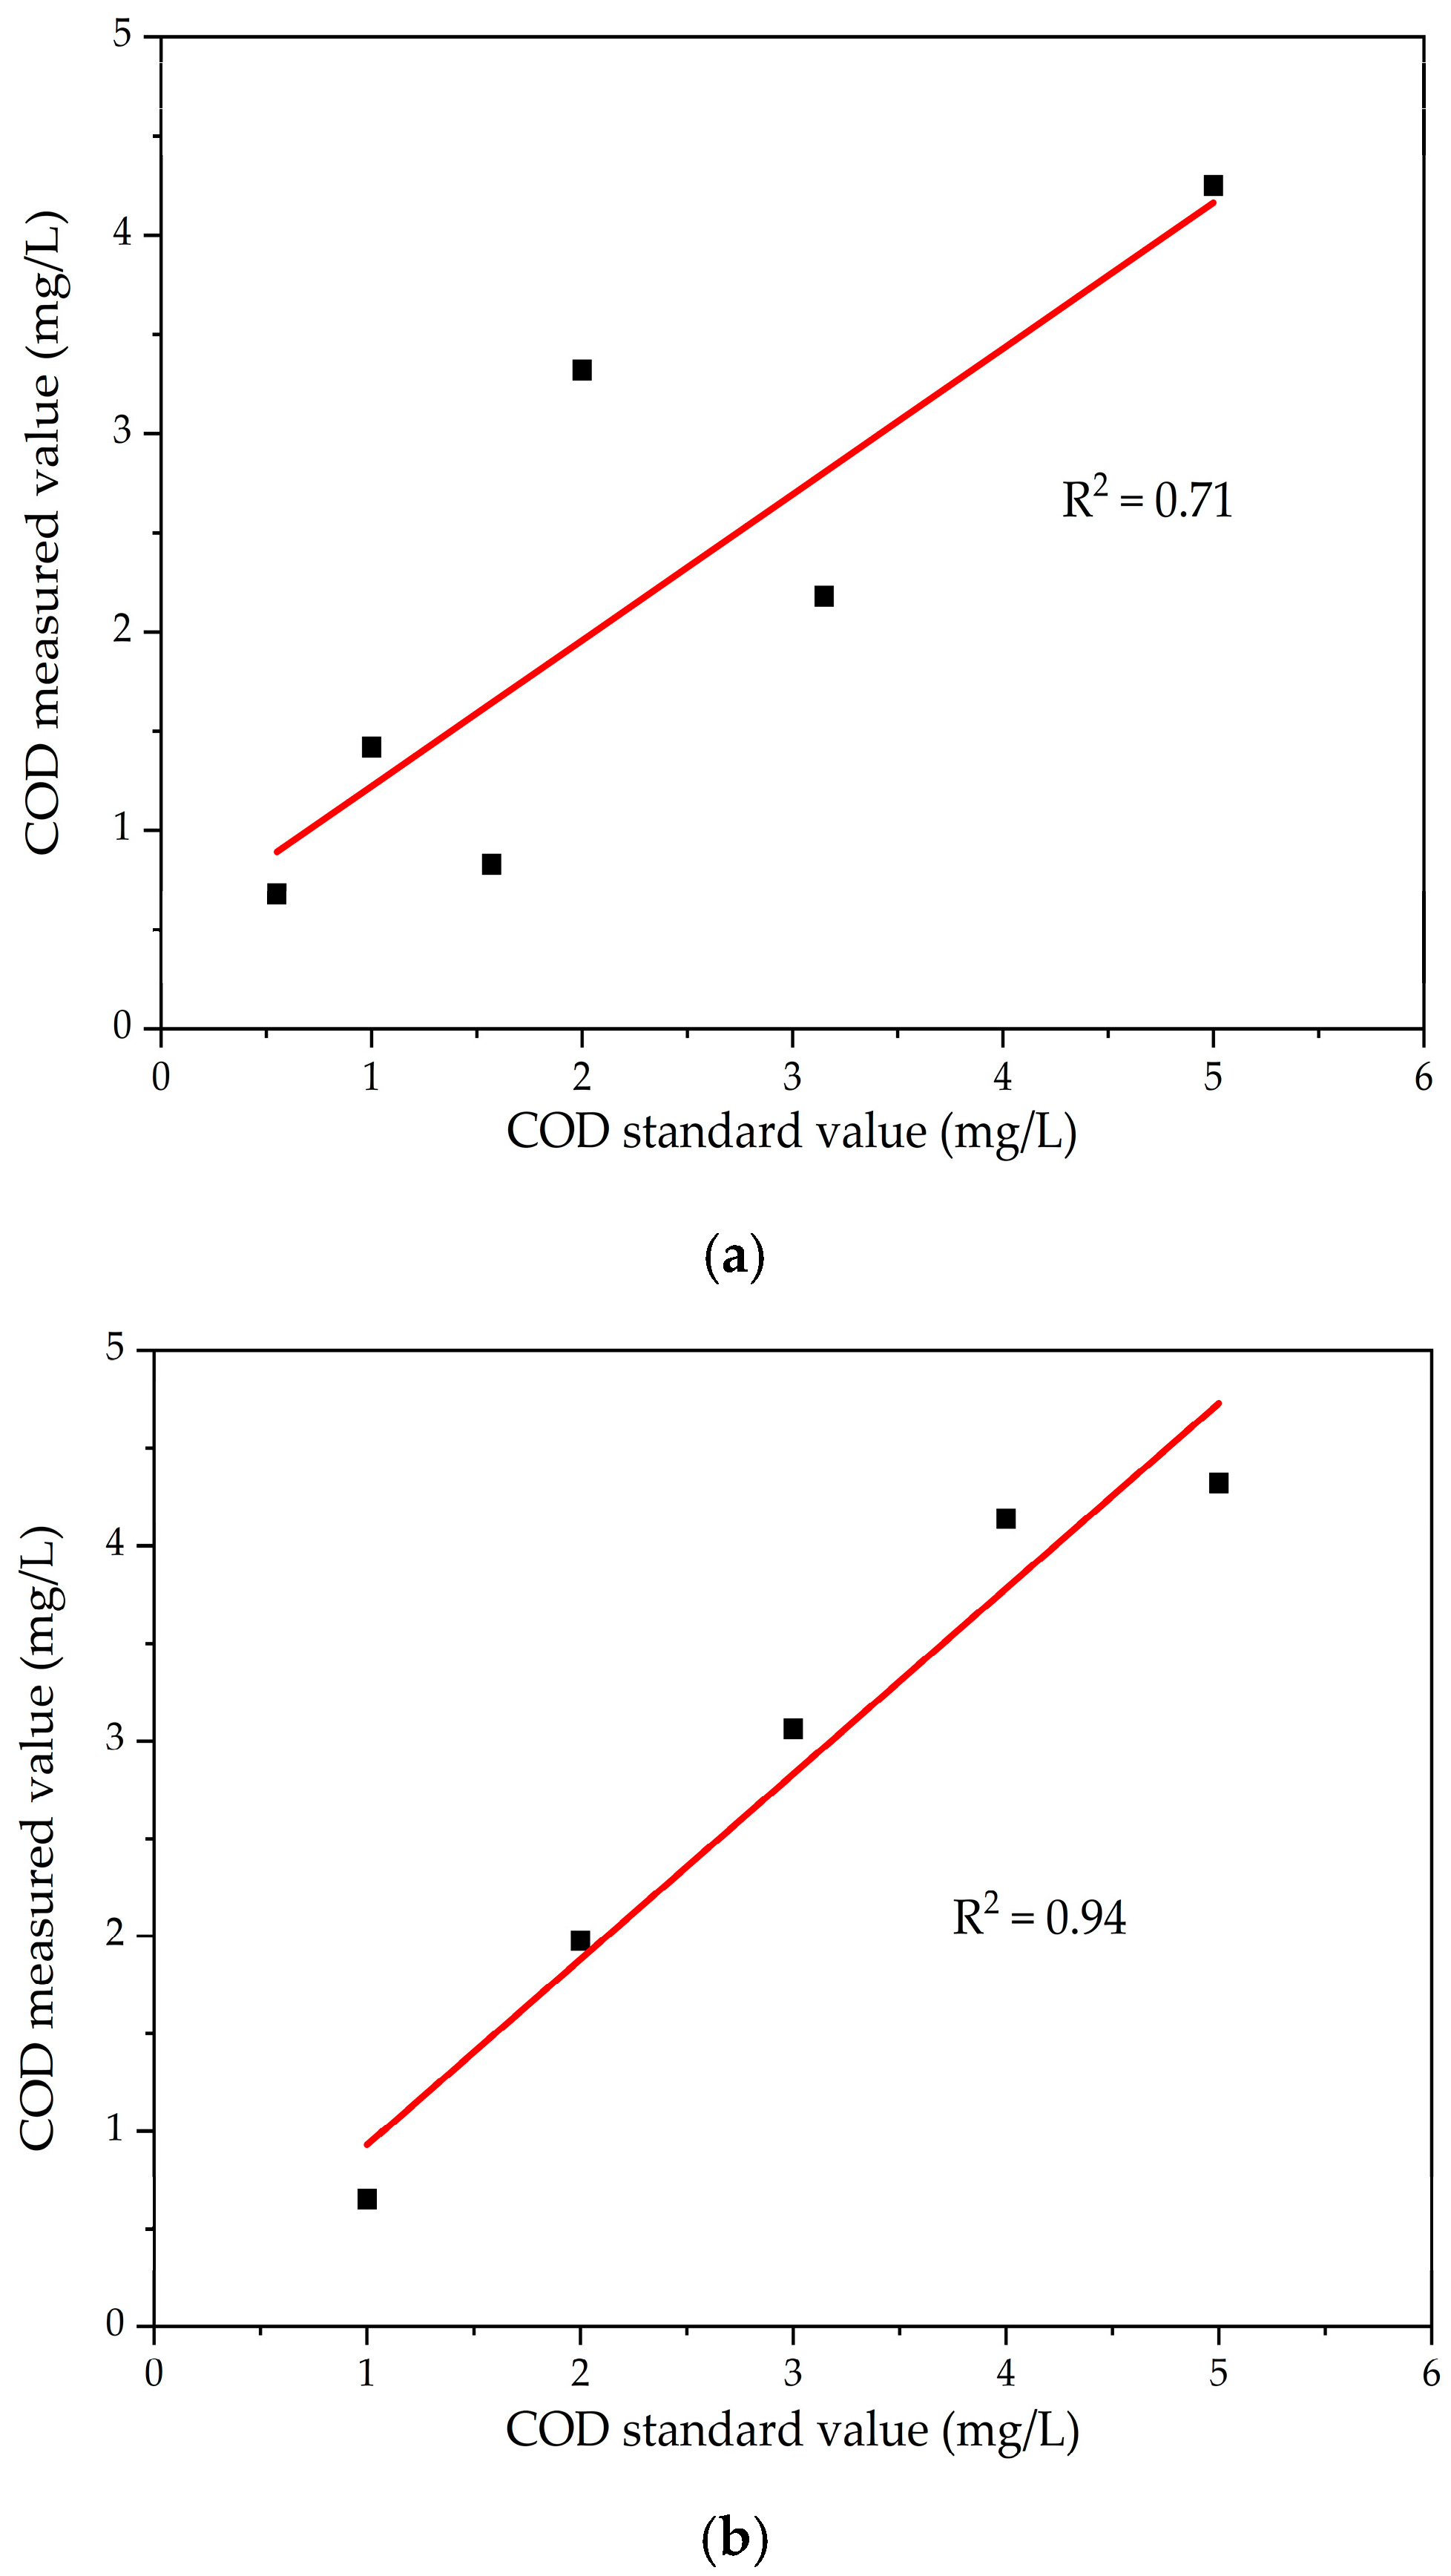
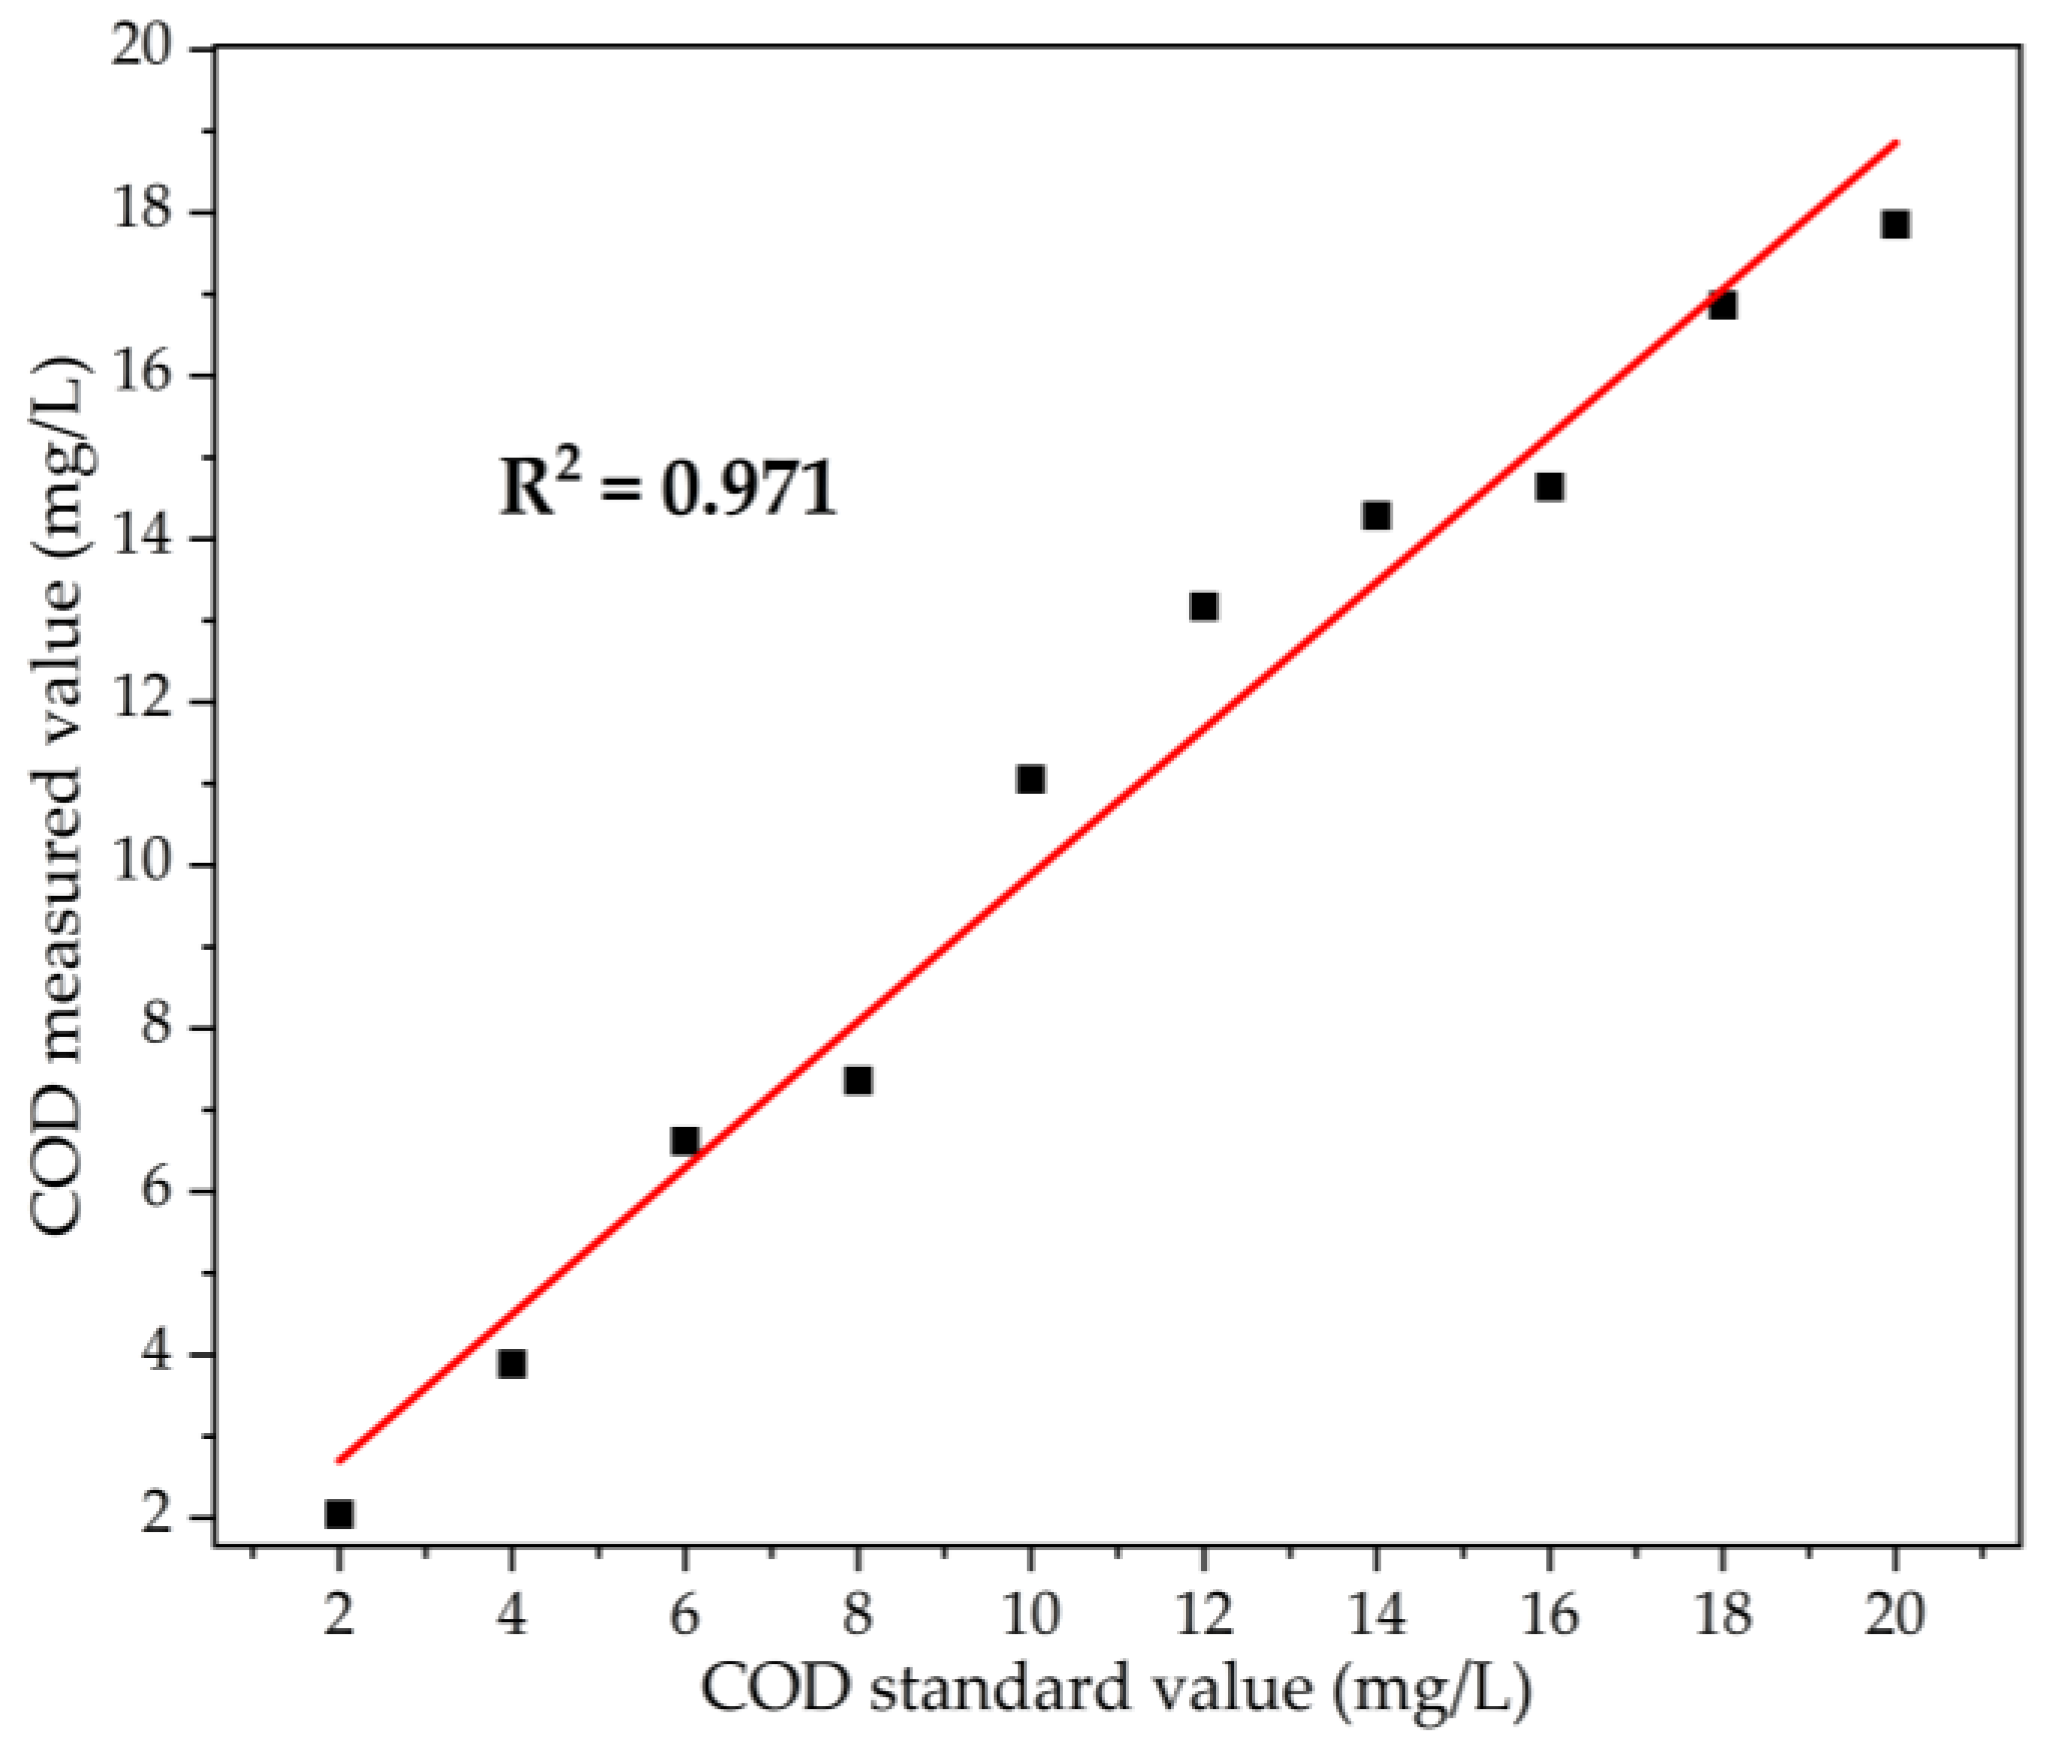
The results show that, within the 2–20 mg/L range, the proposed model maintains a relative error below 11%, indicating an acceptably accurate prediction. The comparison of predicted and actual COD values (Table 2 and Figure 8) demonstrates high accuracy for low-concentration samples. The model’s high coefficient of determination (R2 = 0.971) and low RMSE (0.845 mg/L) indicate robust predictive performance, underscoring its potential for real-time, low-level COD monitoring in natural waters. Using the LIF-based COD detection unit of this system, standard solutions in the 0–5 mg/L range were analyzed and compared with results from our previously developed UV-absorption COD analyzer (Figure 9) [10]. At low COD concentrations, the LIF unit demonstrates significantly higher sensitivity and accuracy than the UV-absorption method.

3.3. Stability and Consistency Verification

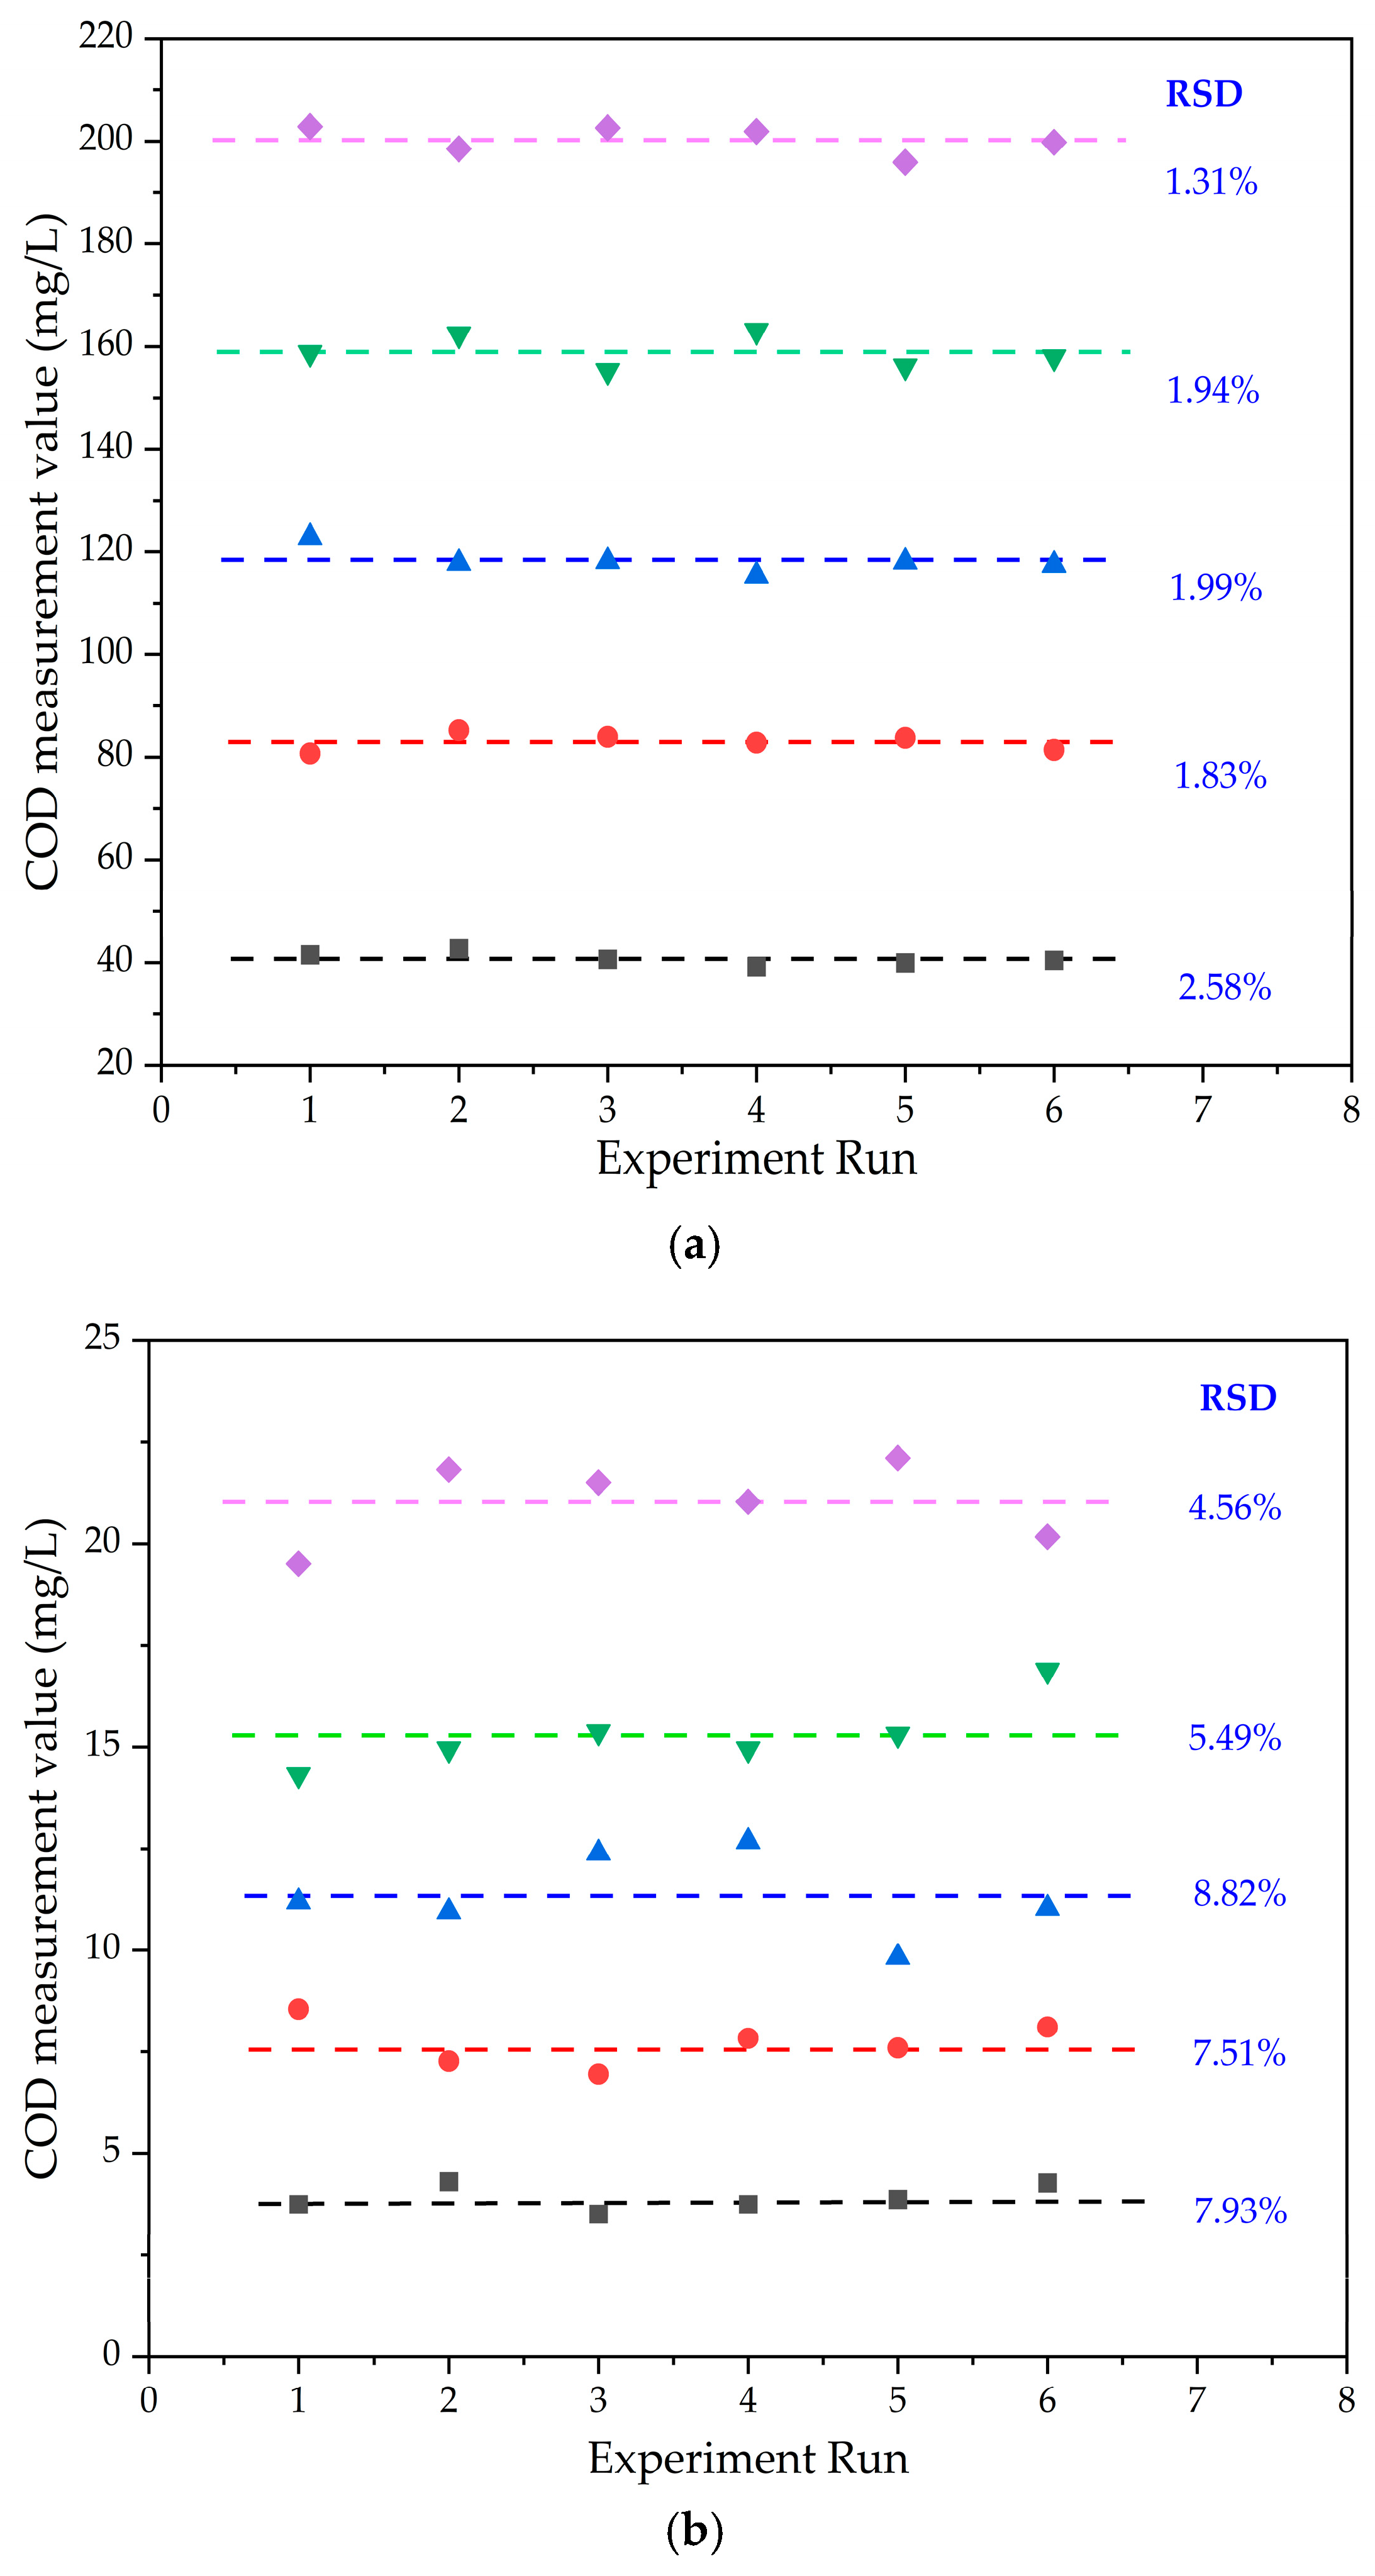
Precision experiments were conducted to evaluate the stability of the two detection methods, using laboratory-prepared COD standard solutions. Before each run, newly prepared COD standard solutions were diluted to the required concentrations and measured; the results are shown in Figure 10.
UV absorption COD measurements were performed with standard solutions of 40, 80, 120, 160, and 200 mg/L, while laser-induced fluorescence COD measurements employed 4, 8, 12, 16, and 20 mg/L standards. As shown in Figure 10, the relative standard deviations (RSDs) of the UV absorption determinations remained below 3%. Although the RSDs for the fluorescence-based determinations were higher, they did not exceed 9% and averaged 6.9%.
To verify the consistency between the two methods, a dilution-based validation experiment was conducted. High-concentration COD standard solutions were first analyzed using UV absorbance, then diluted tenfold and subsequently analyzed by laser-induced fluorescence. The results from both methods were compared and are presented in Table 3.
In the dilution-consistency verification test, standard solutions of 50, 100, 150, and 200 mg/L were selected for measurement; Table 3 presents the results for each working point: 1. standard solution concentration C; 2. concentration value Ch obtained by UV absorption measurement; 3. concentration value Cl obtained by laser-induced fluorescence measurement after ten-fold dilution of the standard solution; 4. multiplication of the Cl by ten; 5. difference fi between Ch and 10Cl; and 6. relative error δ between Ch and 10Cl. According to the results, for each standard solution, the concentration obtained by UV absorption measurement (before dilution) was compared with the measured value from laser-induced fluorescence after ten-fold dilution (multiplied by 10). The average relative error was 8.9%, and the maximum was 12.35%. The experimental results show that the two COD detection methods, UV absorption and laser-induced fluorescence, exhibit relatively good consistency.

3.4. Authentic Water Sample Testing

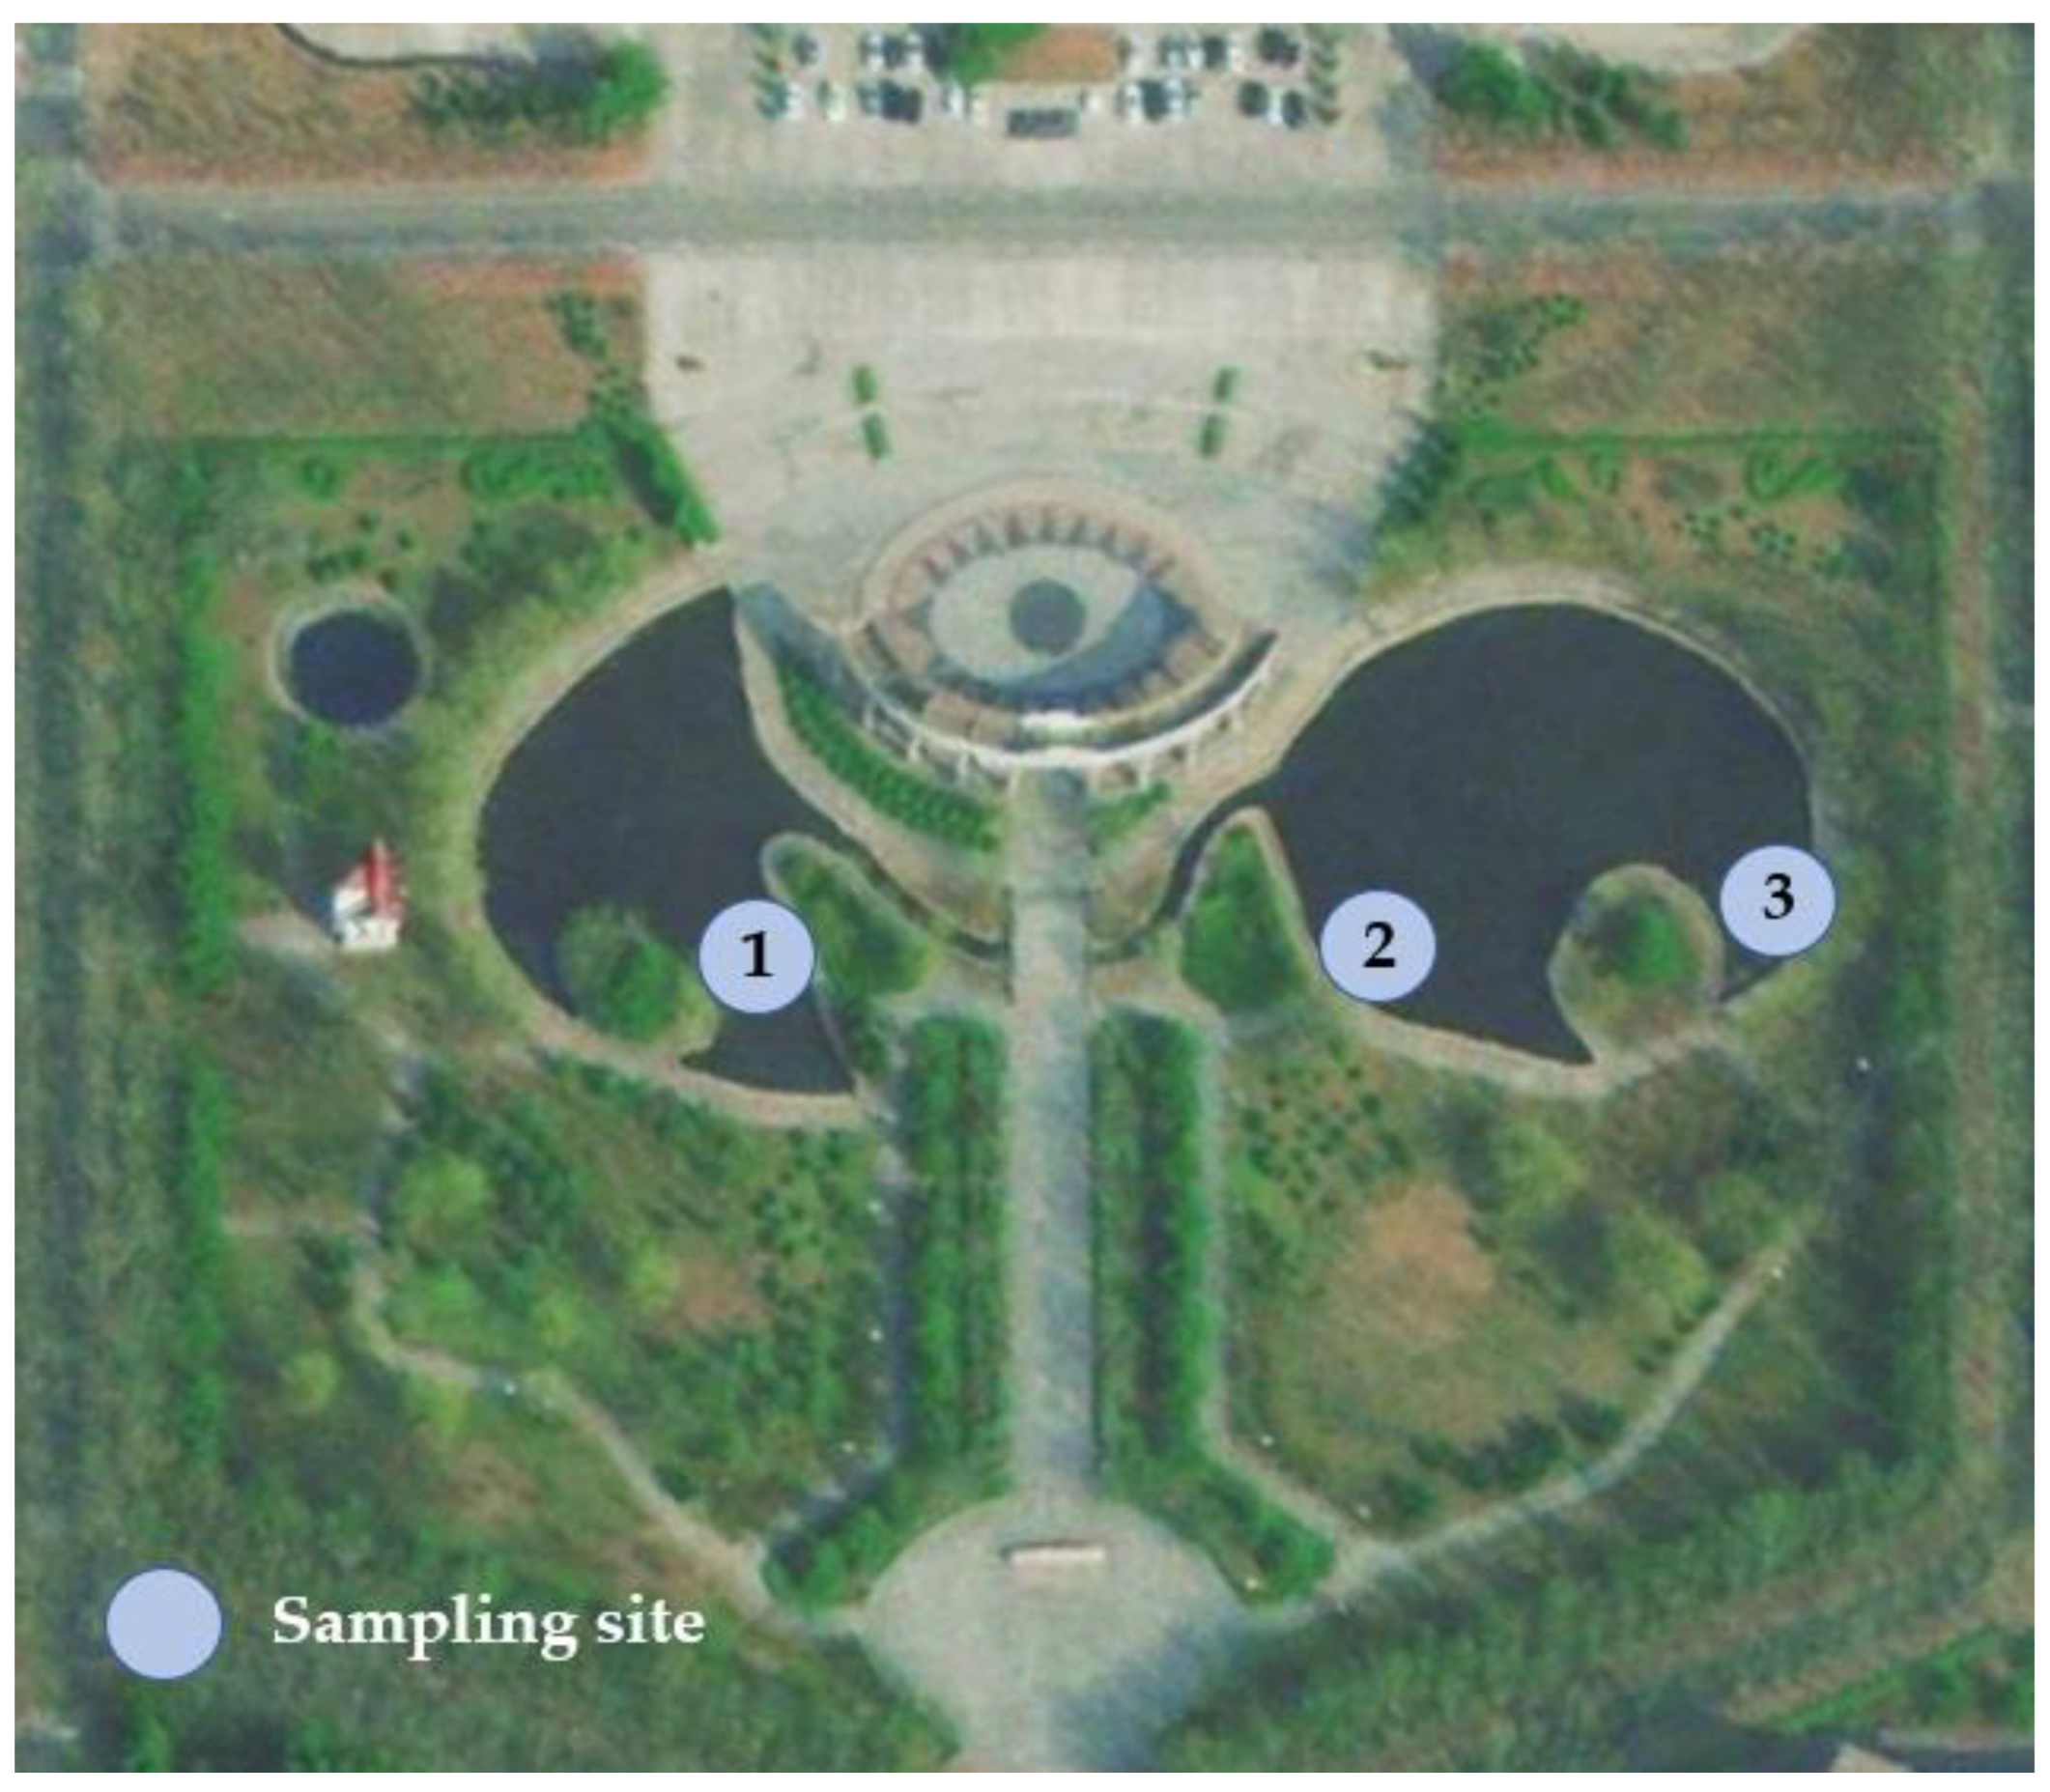
After laboratory validation, field tests were carried out with two independent modules: the UV-absorption photometry unit and the laser-induced fluorescence (LIF) image-detection unit. Extensive laboratory tests have established the valid absorbance range for COD determination by the laser-absorption method. Samples within this range are measured by UV absorption; those below the range are automatically switched to laser-induced fluorescence measurement. Surface-water samples were collected from three discrete sites in Riyue Lake on the Weihai campus of Harbin Institute of Technology (locations are shown in Figure 11). Each sample was split into two aliquots. One aliquot was analyzed with the integrated UV-absorption photometry module; the other was processed with a 5B-6C multi-parameter water-quality analyser (Lianhua Technology, Beijing, China). The 5B-6C instrument employs rapid-digestion spectrophotometry based on potassium dichromate oxidation and provides chemical oxygen demand (COD) results with an accuracy of ±8% for concentrations up to 50 mg/L. The comparative data are summarized in Table 4.
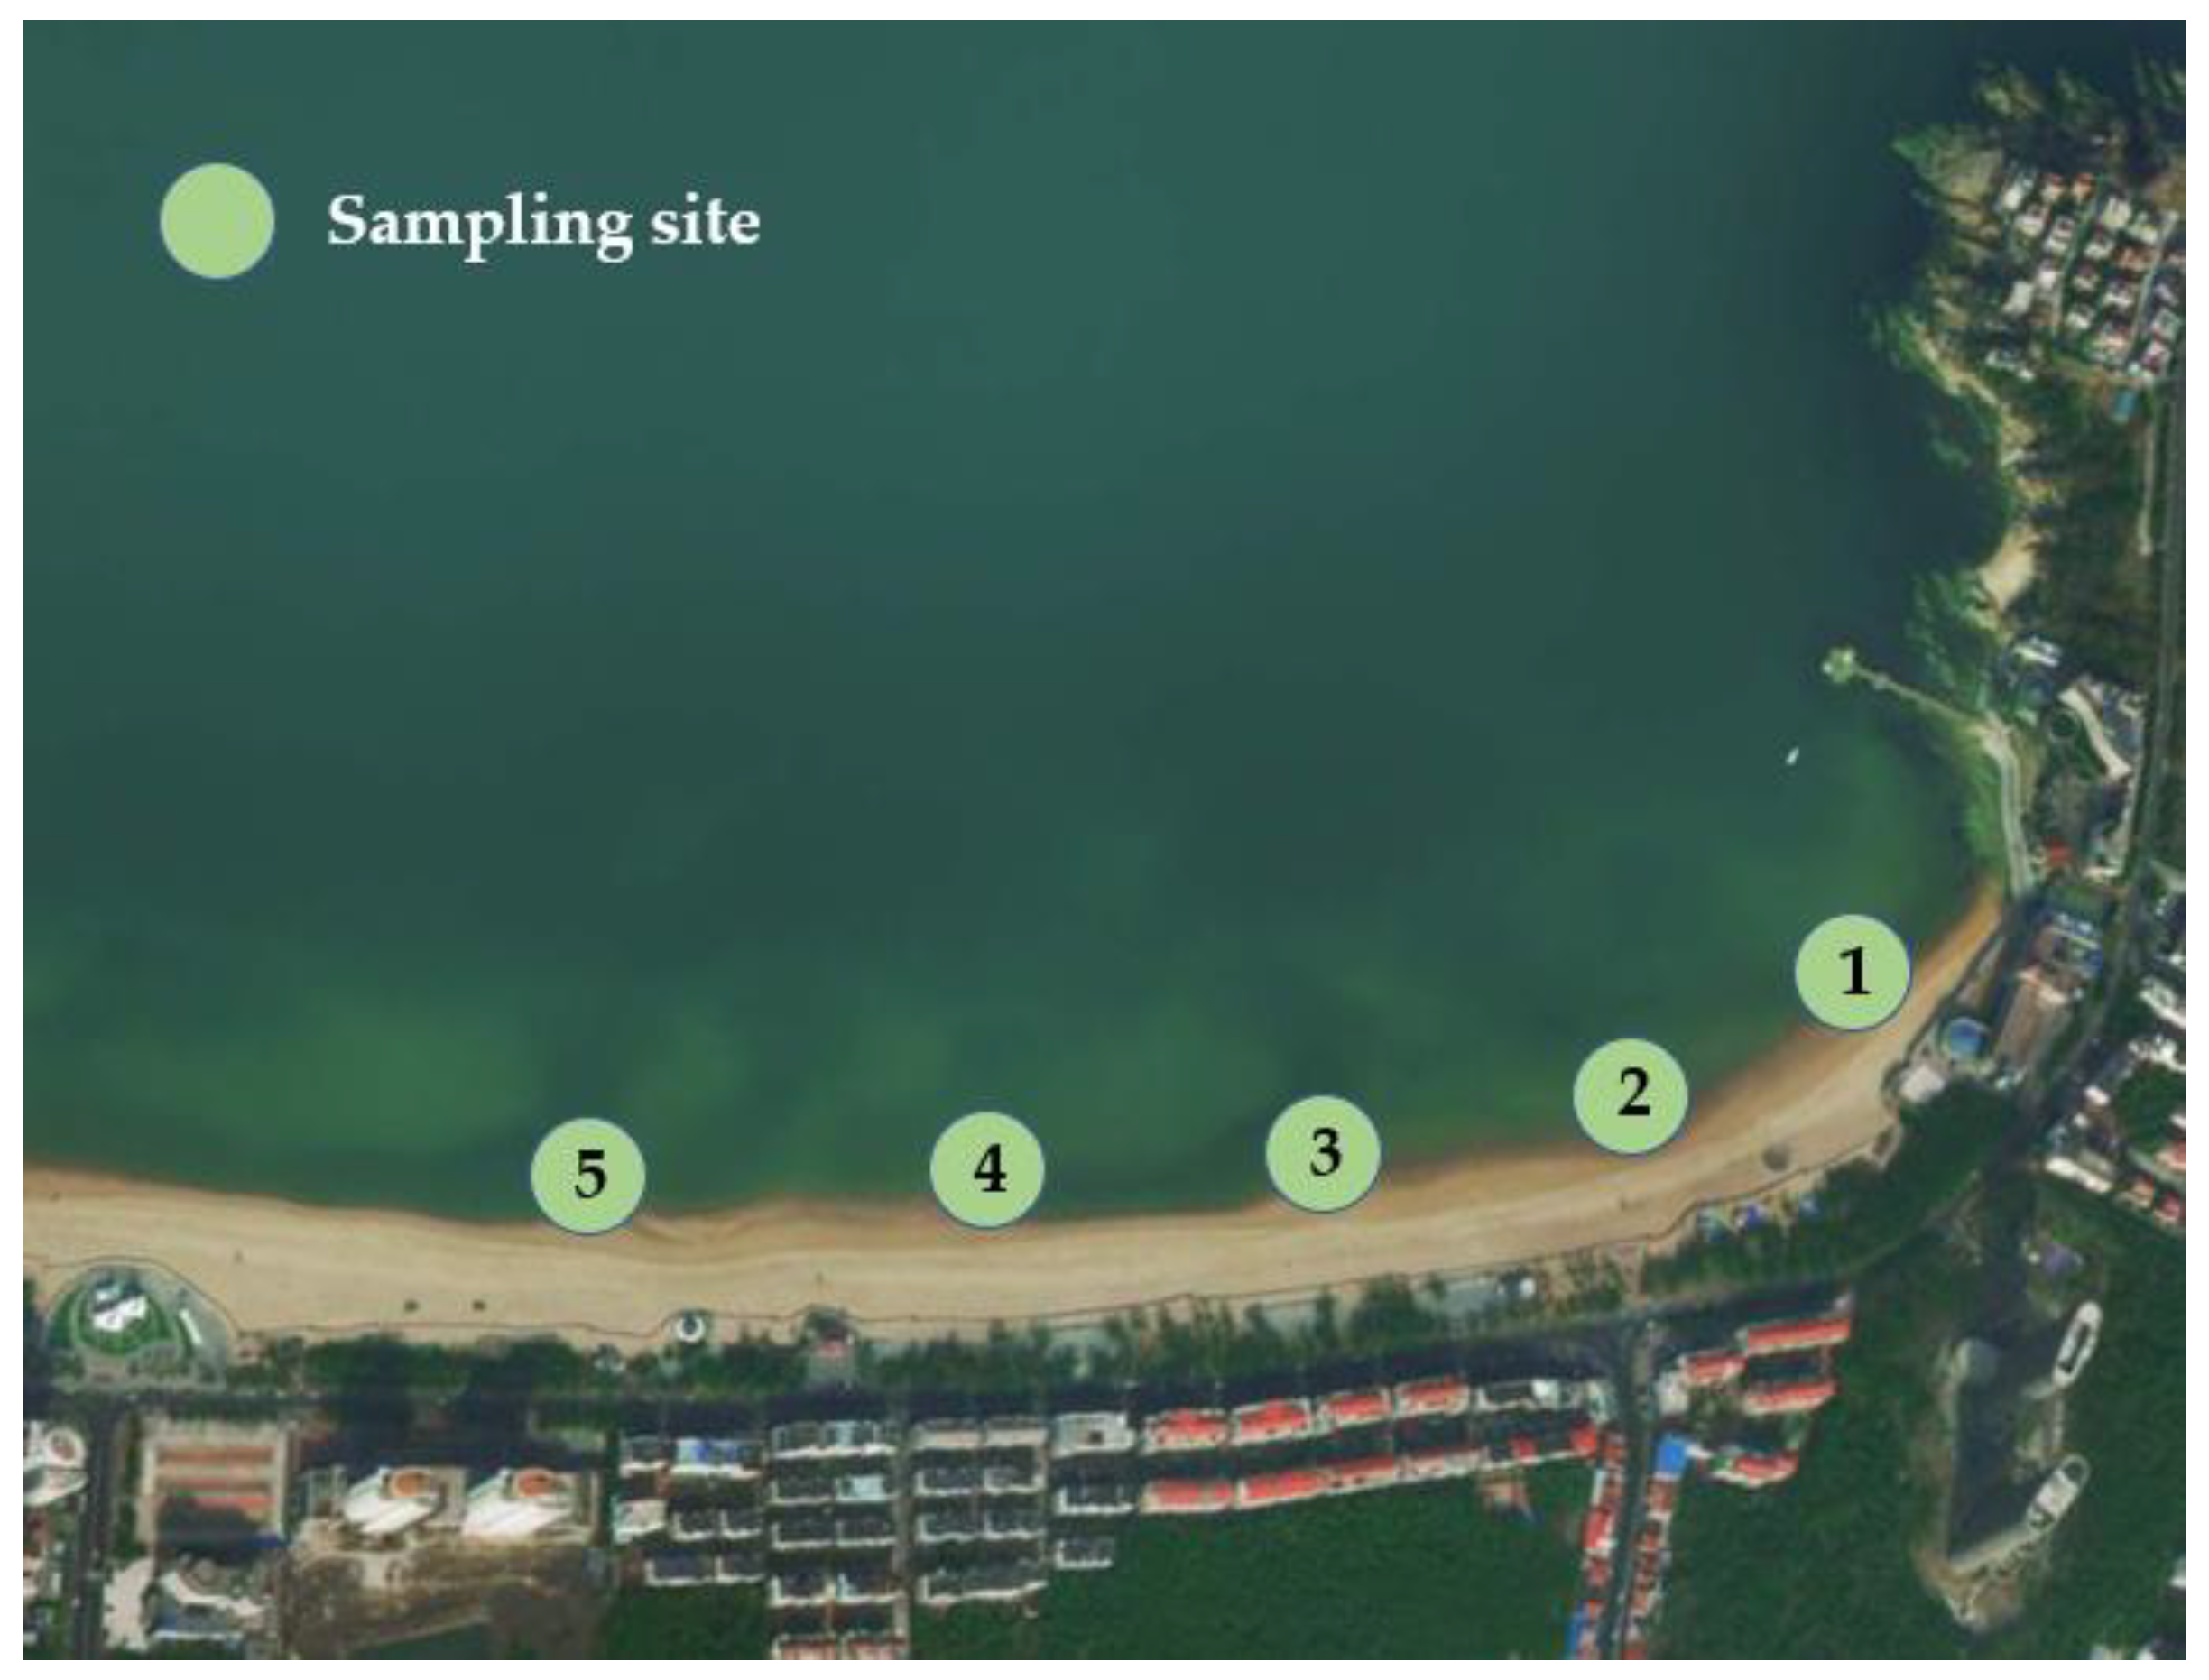
Additional samples were taken at five sites along the eastern beach of the Weihai International Seawater Bathing Beach (see Figure 12). Again, every sample was divided into two aliquots. One aliquot was measured with the LIF detection unit of the present system, and the other with a COD-408 on-line sensor (Chemins Technology, Hangzhou, China). These results are listed in Table 5.
As shown in Table 4, the relative errors in the determination results by ultraviolet absorption spectrophotometry and rapid digestion spectrophotometry were 3.7%, 13.6%, and 11.5%, respectively. In summer, water plants such as lotus in Riyue Lake grow vigorously, and fallen leaves and attached microorganisms accumulate, leading to relatively high COD levels in laker water. Because of the stringent space constraints imposed by the miniaturized optical path, no real-time turbidity or chromaticity compensation is implemented in the present laser-absorption module; as a result, the relative error of the COD estimates is systematically amplified. Table 5 shows that the average relative error of the determination results using the LIF image processing method and the ultraviolet absorption spectrophotometer is 6.81%, with a maximum of 12.11%, indicating that the detection results of the two methods are relatively consistent.

4. Conclusions

This paper presents a water quality detection system that integrates ultraviolet absorption spectrophotometry with laser-induced fluorescence (LIF) for rapid, broad-range COD measurements. The platform combines five functional units: laser excitation, image acquisition, sample handling, transmitted-light detection, and data processing. Potassium hydrogen phthalate (KHP) standards were employed to evaluate the system. High-concentration COD (20–220 mg/L) was quantified by 266 nm absorbance, which exhibited excellent linearity with standard values. Low-concentration COD (2–20 mg/L) was determined from laser-induced fluorescence images by extracting the blue-channel intensity, enabling the establishment of a detection model. Within the concentration range of 2–20 mg/L, the model maintained a relative error below 11%, with an R2 of 0.971 and an RMSE of 0.845 mg/L, indicating high accuracy. Field validation was conducted at three sites in Riyue Lake and five sites along Weihai International Seawater Bathing Beach; the COD values obtained agreed well with those determined by rapid-digestion spectrophotometry and laboratory UV spectrophotometry.
The primary contributions of this study are as follows: (1) This study systematically integrates spectroscopic techniques, image processing, and data analysis, and intuitively characterizes organic matter content in water bodies through a two-dimensional fluorescence image-based analytical approach. (2) A water quality detection system that synergistically incorporates laser absorption and laser-induced fluorescence was developed. This system leverages the complementary strengths of both methods, which exhibit high sensitivity for detecting water samples with high and low organic matter concentrations, respectively, thereby offering innovative design insights for advancing water quality instrumentation. (3) The system features a compact architecture, supports real-time monitoring, and enables rapid detection. It can be seamlessly integrated with cloud platforms, facilitating remote data analysis and storage, and demonstrates strong potential for deployment in complex environments.
However, the system currently has certain limitations. Firstly, the organic composition of complex water bodies is highly variable, leading to differences in fluorescence responses. Therefore, pre-experiments are necessary to detect different water bodies and establish a mapping relationship between the fluorescence intensity of the selected area and that under standard laboratory conditions. The system’s capability to identify organic compounds in complex water bodies remains limited. Future research should involve extensive experimental analysis to build a comprehensive fluorescence spectral database covering various types of complex water bodies, thereby improving the system’s ability to identify organic compounds in such environments. Secondly, to avoid optical crosstalk that could degrade the integrity of the laser-induced fluorescence image, the absorption module presently operates without multi-wavelength correction. Consequently, the UV absorption unit provides only limited rejection of matrix interferences such as turbidity or colority. Future work will accordingly assess whether a multi-wavelength correction scheme can be deployed without degrading the spatial fidelity of the fluorescence images.
In conclusion, a dual-mode COD sensor combining laser absorption and laser-induced fluorescence is presented, enabling accurate measurement across both high- and low-concentration ranges and thus extending the workable detection window. The system offers rapid response, high sensitivity, and a compact footprint, promising for online water-quality monitoring. The integrated approach provides a new technical route for environmental protection and water-resource management.

Author Contributions

Conceptualization and methodology, H.Z. and Z.T.; software, H.Z. and Y.G.; validation, H.Z., Y.G. and X.C.; investigation, H.Z., X.C. and Z.B.; data curation, H.Z.; visualization, H.Z.; writing—original draft preparation, H.Z. and Z.T.; writing—review and editing, H.Z., Z.T. and X.C. All authors have read and agreed to the published version of the manuscript.

Funding

This research was funded by the National Key R&D Projects of the Ministry of Science and Technology (Grant No. 2022YFC2807702) and the Key Joint Fund projects of the National Nature Fund (Grant No. U22A2008).

Data Availability Statement

The original contributions presented in this study are included in the article. Further inquiries can be directed to the corresponding author.

Conflicts of Interest

The authors declare no conflicts of interest.

Abbreviations

The following abbreviations are used in this manuscript:
CODChemical Oxygen Demand
DOMDissolved Organic Matter
UVUltraviolet
IRInfrared Radiation
DLDeep Learning
BODBiological Oxygen Demand
KHPPotassium Hydrogen Phthalate
LIFLaser-Induced Fluorescence
CMOSComplementary Metal Oxide Semiconductor
ROIRegion Of Interest

References

  1. Zhang, S.Q.; Li, L.H.; Zhao, H.J.; Li, G.Y. A portable miniature UV-LED-based photoelectrochemical system for determination of chemical oxygen demand in wastewater. Sens. Actuators B Chem. 2009, 141, 634–640. [Google Scholar] [CrossRef]
  2. Ye, S.; Chen, X.; Dong, D.M.; Wang, J.J.; Wang, X.Q.; Wang, F.Y. Rapid determination of water COD using laser-induced breakdown spectroscopy coupled with partial least-squares and random forest. Anal. Methods 2018, 10, 4879–4885. [Google Scholar] [CrossRef]
  3. Pereira, S.A.P.; Costa, S.P.F.; Cunha, E.; Passos, M.L.C.; Araújo, A.R.S.T.; Saraiva, M.L.M.F.S. Manual or automated measuring of antipsychotics’ chemical oxygen demand. Ecotoxicol. Environ. Saf. 2018, 152, 55–60. [Google Scholar] [CrossRef]
  4. Zhou, K.P.; Bi, W.H.; Zhang, Q.H.; Fu, X.P.; Wu, G.Q. Influence of temperature and turbidity on water COD detection by UV absorption spectroscopy. Optoelectron. Lett. 2016, 10, 4879–4885. [Google Scholar] [CrossRef]
  5. Qiao, S.D.; Sampaolo, A.; Patimisco, P.; Spagnolo, V.; Ma, Y. Ultra-highly sensitive HCl-LITES sensor based on a low-frequency quartz tuning fork and a fiber-coupled multi-pass cell. Photoacoustics 2022, 27, 100381. [Google Scholar] [CrossRef] [PubMed]
  6. Ogura, N.; Hanya, T. Ultraviolet absorbance as an index of the pollution of seawater. J. Water Pollut. Control Fed. 1968, 40, 464–467. [Google Scholar]
  7. Eaton, A. Measuring UV-absorbing organics: A standard method. J. Am. Water Works Assoc. 1995, 87, 86–90. [Google Scholar] [CrossRef]
  8. Chen, B.S.; Wu, H.N.; Li, S.F.Y. Development of variable pathlength UV–vis spectroscopy combined with partial-least-squares regression for wastewater chemical oxygen demand (COD) monitoring. Talanta 2014, 120, 325–330. [Google Scholar] [CrossRef]
  9. Zhang, Z.M.; Dai, X.W.; Shan, G.C.; Li, G.; Li, X.J.; Liu, X.B.; Qin, F. A low cost UV-IR dual wavelength optical sensor with Chirp modulation for in-situ chemical oxygen demand measurements. Sens. Actuators B Chem. 2022, 371, 132538. [Google Scholar] [CrossRef]
  10. Che, X.H.; Tian, Z.S.; Fu, D.M.; Bi, Z.J.; Wang, L.; Zhu, D.J. Research on COD parameter in water based on the combination of UV absorption photometry and laser spectroscopy. Environ. Technol. Innov. 2024, 35, 103730. [Google Scholar] [CrossRef]
  11. Jarmondi, K.D.S.; Tarinejad, R.; Pourali, H.; Salehi, A.H.; Nourani, V. Advancing wastewater treatment plant for monitoring BOD and COD through explainable AI and feature engineering techniques. J. Water Process Eng. 2025, 80, 109237. [Google Scholar] [CrossRef]
  12. Ahmed, N.; Straub, A. A Practical Approach for Measuring Chemical Oxygen Demand (COD) of Fats, Oils, and Grease (FOG) Using Tween 80 in Wastewater. ChemEngineering 2025, 9, 138. [Google Scholar] [CrossRef]
  13. Carstea, E.M.; Bridgeman, J.; Baker, A.; Reynolds, D.M. Fluorescence spectroscopy for wastewater monitoring: A review. Water Res. 2016, 95, 205–219. [Google Scholar] [CrossRef] [PubMed]
  14. Sciscenko, I.; Arques, A.; Micó, P.; Mora, M.; García-Ballesteros, S. Emerging applications of EEM-PARAFAC for water treatment: A concise review. Chem. Eng. J. Adv. 2022, 10, 100286. [Google Scholar] [CrossRef]
  15. Chen, P.; Pan, D.L.; Wang, T.Y.; Mao, Z.H.; Zhang, Y.W. Coastal and inland water monitoring using a portable hyperspectral laser fluorometer. Mar. Pollut. Bull. 2017, 119, 153–161. [Google Scholar] [CrossRef]
  16. Bridgeman, J.; Baker, A.; Brown, D.; Boxall, J.B. Portable LED fluorescence instrumentation for the rapid assessment of potable water quality. Sci. Total. Environ. 2015, 524, 338–346. [Google Scholar] [CrossRef] [PubMed]
  17. Karavanova, E.I.; Konovalov, A.G.; Terskaya, E.V. Applying the Method of Fluorescence Spectroscopy to Study Dissolved Organic Matter in Waters of the Moskva River. Environ. Sci. Mosc. Univ. Soil Sci. Bull. 2019, 74, 199–207. [Google Scholar] [CrossRef]
  18. Killinger, D.; Sivaprakasam, V. How water glows: Water monitoring with laser fluorescence. Opt. Photonics News 2006, 17, 34–39. [Google Scholar] [CrossRef]
  19. Sivaprakasam, V.; Shannon, R.; Luo, C.; Coble, P.; Boehme, J.; Killinger, D. Development and initial calibration of a portable laser-induced fluorescence system used for in situ measurements of trace plastics and dissolved organic compounds in seawater and the Gulf of Mexico. Appl. Opt. 2003, 42, 6747–6756. [Google Scholar] [CrossRef]
  20. Barbini, R.; Colao, F.; Fantoni, R.; Fiorani, L.; Kolodnikova, N.; Palucci, A. Laser remote sensing calibration of ocean color satellite data. Ann. Geophys. 2009, 49, 3146. [Google Scholar] [CrossRef]
  21. Chekalyuk, A.; Hafez, M. Advanced laser fluorometry of natural aquatic environments. Limnol. Oceanogr. Methods 2008, 6, 591–609. [Google Scholar] [CrossRef]
  22. Fukuda, Y.; Hayakawa, T.; Ichihara, E.; Inoue, K.; Ishihara, K.; Ishino, H.; Itow, Y.; Kajita, T.; Kameda, J.; Kasuga, S.; et al. Measurements of the solar neutrino flux from Super-Kamiokande’s first 300 days. Phys. Rev. Lett. 1998, 81, 1158–1162. [Google Scholar] [CrossRef]
  23. Babichenko, S. Laser remote sensing of the European marine environment: LIF technology and applications. In Remote Sensing of the European Seas; Barale, V., Gade, M., Eds.; Springer: Dordrecht, The Netherlands, 2008; pp. 189–198. [Google Scholar] [CrossRef]
  24. Ghervase, L.; Carstea, E.; Pavelescu, G.; Savastru, D. Laser induced fluorescence efficiency in water quality assessment. Rom. Rep. Phys. 2010, 62, 652–659. [Google Scholar]
  25. Chen, P.; Pan, D.L.; Mao, Z.H. Development of a portable laser-induced fluorescence system used for in situ measurements of dissolved organic matter. Opt. Laser Technol. 2014, 64, 213–219. [Google Scholar] [CrossRef]
  26. Brown, C.E.; Fingas, M.F. Review of the development of laser fluorosensors for oil spill application. Mar. Pollut. Bull. 2003, 47, 477–484. [Google Scholar] [CrossRef]
  27. Chubarov, V.V.; Fadeev, V.V. Ecological monitoring in the Caspian Sea (mouth zone of the River Volga) with a shipboard laser spectrometer. Proc. SPIE 2004, 5832, 147–152. [Google Scholar]
  28. Che, X.H.; Tian, Z.S.; Sun, F.H.; Liu, Q.C.; Bi, Z.J.; Chen, H.; Cui, Z.H. Research on chemical oxygen demand based on laser Fluorescence-Raman spectroscopy. Front. Phys. 2022, 10, 1055049. [Google Scholar] [CrossRef]
  29. Hong, S.M.; Morgan, B.J.; Stocker, M.D.; Smith, J.E.; Kim, M.S.; Cho, K.H.; Pachepsky, Y.A. Using machine learning models to estimate Escherichia coli concentration in an irrigation pond from water quality and drone-based RGB imagery data. Water Res. 2024, 260, 121861. [Google Scholar] [CrossRef] [PubMed]
  30. Gaiao, E.N.; Martins, V.L.; Lyra, W.S.; de Almeida, L.F.; da Silva, E.C.; Araújo, M.C.U. Digital image-based titrations. Anal. Chim. Acta 2006, 570, 283–290. [Google Scholar] [CrossRef]
  31. Tousi, E.G.; Duan, J.G.; Gundy, P.M.; Bright, K.R.; Gerba, C.P. Evaluation of E. coli in sediment for assessing irrigation water quality using machine learning. Sci. Total Environ. 2021, 799, 149286. [Google Scholar] [CrossRef]
  32. Hsu, P.H. Using SPOT images for monitoring water quality of reservoir. Sens. Mater. 2016, 28, 455–462. [Google Scholar]
  33. Bansod, B.; Singh, R.; Thakur, R. Analysis of water quality parameters by hyperspectral imaging in Ganges River. Spat. Inf. Res. 2018, 26, 203–211. [Google Scholar] [CrossRef]
  34. Guo, Y.; Tian, Z.; Bi, Z.; Che, X.; Yin, S. Research on Water Quality Chemical Oxygen Demand Detection Using Laser-Induced Fluorescence Image Processing. Sensors 2025, 25, 1404. [Google Scholar] [CrossRef]
  35. Guo, Y.; Liu, C.; Ye, R.; Duan, Q. Advances on Water Quality Detection by UV-Vis Spectroscopy. Appl. Sci. 2020, 10, 6874. [Google Scholar] [CrossRef]
  36. Tian, G.; Xu, G.; Tian, Q. A Piecewise Mathematical Model for COD Measurement of Water by UV Spectrometry. Spectrosc. Spectr. Anal. 2020, 40, 1741–1746. [Google Scholar]
  37. Tian, Z.S.; Chen, H.; Ding, Q.P.; Che, X.H.; Bi, Z.J.; Wang, L. Research on Small-Scale Detection Instrument for Drinking Water Combined Laser Spectroscopy and Conductivity Technology. Sensors 2023, 23, 2985. [Google Scholar] [CrossRef] [PubMed]
  38. Moroni, M.; Lupo, E.; Marra, E.; Cenedese, A. Hyperspectral image analysis in environmental monitoring: Setup of a new tunable filter platform. Procedia Environ. Sci. 2013, 19, 885–894. [Google Scholar] [CrossRef]
  39. Chen, X.; Li, Q.; Sun, W. Real-Time Detection of Organic Pollutants Using Fluorescence Imaging. Sens. Actuators B Chem. 2022, 345, 130432. [Google Scholar]
Figure 2. The typical spectrum produced by laser excitation of water.
Water 18 00093 g002
Figure 3. Overall structure diagram of the fusion detection system.
Water 18 00093 g003
Figure 4. Relationship between the COD concentration value of the standard solution and the fitted value.
Water 18 00093 g004
Figure 5. Laser-induced fluorescence spectra of COD standard solutions at different concentrations.
Water 18 00093 g005
Figure 6. Fluorescence images of testing solutions with different concentrations collected by the system. The red rectangular frame indicates the Region of Interest (ROI) selected for analysis. (a) 2 mg/L COD testing solution; (b) 8 mg/L COD testing solution; (c) 14 mg/L COD testing solution; (d) 20 mg/L COD testing solution.
Water 18 00093 g006
Figure 8. Relationship between the COD concentration values of the standard solution and the values predicted from the blue channel (B) intensity of fluorescence images.
Water 18 00093 g008
Figure 9. The correlation between measured and standard COD values in KHP standard solutions (0–5 mg/L). (a) UV absorbance COD detection; (b) Laser-induced fluorescence COD detection.
Water 18 00093 g009
Figure 10. Precision evaluation (RSD-based) of COD values in KHP standard solutions. (a) UV absorbance COD detection; (b) Laser-induced fluorescence COD detection.
Water 18 00093 g010
Figure 11. Riyue Lake Sampling Point.
Water 18 00093 g011
Figure 12. Sampling point on the eastern beach of Weihai International Seawater Bathing Beach.
Water 18 00093 g012
Table 1. Comparison of actual values with fitted values.
CCOD/(mg/L)Cm/(mg/L)fi/(mg/L)δ/(%)
2522.882.128.48
5549.255.7510.45
8578.396.617.78
115109.615.394.69
125121.873.132.50
135135.43−0.430.32
145144.500.500.35
175173.191.811.03
205206.96−1.960.96
Table 2. Comparison of actual and fitted values of COD based on Laser-induced fluorescence.
CCOD/(mg/L)Cm/(mg/L)fi/(mg/L)δ/(%)
22.04−0.042.15
43.890.112.78
66.62−0.6210.35
87.360.637.95
1011.05−1.059.59
1213.17−1.179.78
1414.29−0.282.04
1614.641.368.51
1816.871.136.29
2017.862.1410.70
Table 3. Dilution consistency verification results with COD standard solutions.
C/(mg/L)Ch/(mg/L)Cl/(mg/L)Cl/(mg/L)fi/(mg/L)δ/(%)
5047.34.4144.13.26.76
10099.211.03110.3–11.111.19
150151.413.27132.718.712.35
200202.921.35213.5–10.65.22
Table 4. Measurement results of water samples from Riyue Lake.
Sample NumberCOD Measurement Value (mg/L)Relative Error (%)
Rapid Digestion
Spectrophotometry
UV Absorption
Photometry
131.6030.463.74
249.6656.4213.61
346.6551.9911.46
Table 5. Measurement results of seawater samples from international bathing beaches.
Sample NumberCOD Measurement Value (mg/L)Relative Error (%)
Online COD SensorLIF Image Processing
16.86.0810.58
24.13.963.45
34.84.653.03
44.44.9312.11
55.15.354.90
Disclaimer/Publisher’s Note: The statements, opinions and data contained in all publications are solely those of the individual author(s) and contributor(s) and not of MDPI and/or the editor(s). MDPI and/or the editor(s) disclaim responsibility for any injury to people or property resulting from any ideas, methods, instructions or products referred to in the content.