Article

Effects of Changes in Environmental Factors on CO2 Partial Pressure in Mountainous River Systems
1
State Key Laboratory of Hydraulics and Mountain River Engineering, Sichuan University, Chengdu 610065, China
2
Sichuan Province Zipingpu Development Company Limited, Chengdu 610091, China
*
Author to whom correspondence should be addressed.
Water 2026, 18(1), 12; https://doi.org/10.3390/w18010012
Submission received: 11 November 2025 / Revised: 15 December 2025 / Accepted: 17 December 2025 / Published: 19 December 2025
(This article belongs to the Special Issue Research on the Carbon and Water Cycle in Aquatic Ecosystems)

Abstract

This study uses high-frequency monitoring across a river–barrier lake–reservoir continuum in the upper Minjiang River, southwestern China, to quantify the spatiotemporal dynamics and drivers of aquatic CO2 partial pressure (pCO2) and to identify the dominant controls under contrasting lotic and lentic conditions. River reaches were CO2-supersaturated throughout the year, with higher pCO2 in the wet season (mean 521 ppm) than in the dry season (421 ppm), indicating persistent CO2 evasion to the atmosphere. In contrast, the downstream canyon-type reservoir showed a pronounced seasonal reversal. During the wet season, surface-water pCO2 averaged 395 ppm, about 24% lower than that of the river and below atmospheric levels (~419 ppm); more than 55% of observations were undersaturated, with minima as low as 141–185 ppm, indicating temporary CO2-sink behavior. In the dry season, mean pCO2 increased to 563 ppm, exceeding both riverine and atmospheric levels and returning the reservoir to a CO2 source. The reservoir pCO2 variability was governed by the interaction of hydrology and metabolism: rising water levels and longer residence times likely enhanced CO2 accumulation from the decomposition of inundated organic matter, while warm temperatures, high light and monsoon-driven nutrient inputs promoted phytoplankton growth that removed dissolved CO2 and elevated dissolved oxygen, producing temporary sink behavior. In the river, short residence time and strong turbulence limited in-stream biological regulation, and pCO2 variability was mainly driven by catchment-scale carbon inputs along the elevation gradient. Overall, our results demonstrate that dam construction and impoundment can substantially modify carbon cycling in high-mountain rivers. Under specific conditions (warm water, sufficient nutrients, high algal biomass), lentic environments may strengthen photosynthetic CO2 uptake and temporarily transform typical riverine CO2 sources into sinks, with important implications for carbon-budget assessments and reservoir management in mountainous basins.

1. Introduction

Climate change is a critical global concern, with carbon dioxide (CO2) playing a significant role as a primary greenhouse gas [1,2]. Anthropogenic emissions from fossil fuel combustion, cement production and land-use change remain the dominant sources of atmospheric CO2 [1,3]. At the same time, inland waters have been increasingly recognized as active components of the global carbon cycle, acting as conduits that transport, transform and emit terrigenous carbon to the atmosphere [2,4,5]. Although their areal extent is small compared with the oceans and terrestrial ecosystems, rivers, lakes and reservoirs collectively represent important natural pathways by which carbon fixed on land is returned to the atmosphere, and can therefore modulate regional carbon budgets and partially offset land carbon sinks [2,3,6].
CO2 in inland waters originates primarily from terrestrial soil respiration and decomposition of organic matter within catchments, as well as in situ metabolism of aquatic organisms, and is further influenced by human activities such as land-use change, eutrophication and river regulation [7,8,9]. Depending on the balance between external inputs of dissolved and particulate carbon and in situ primary production and respiration, surface waters can either act as net CO2 sources or function as CO2 sinks. Under conditions of high allochthonous carbon inputs and intense heterotrophic respiration, inland waters typically become strong CO2 emitters [10,11,12,13]. In contrast, when high primary productivity and strong photosynthetic CO2 uptake coincide with relatively low external organic carbon loading and sufficiently long water residence times, lakes and reservoirs may exhibit low pCO2 and even shift from CO2 sources to sinks [14,15,16,17]. Such regime shifts have recently been reported for several eutrophic lakes that are strongly affected by anthropogenic disturbances [18,19,20]. River–reservoir systems represent sharp hydrological and biogeochemical transitions from lotic to lentic conditions. Impoundment increases water residence time, alters mixing and gas exchange, and changes the balance between external carbon inputs and in situ metabolism, which can fundamentally reorganize the controls on pCO2. Because reservoirs and backwater zones may act as CO2 “hotspots” or exhibit seasonal switching between source and sink behavior, considering the connected river–reservoir continuum is critical for reducing bias in basin-scale carbon budget assessments and for informing reservoir operation and water-management practices.
Globally, CO2 in inland waters has been monitored using a combination of discrete sampling (e.g., headspace equilibration and laboratory analysis) and, increasingly, in situ sensors that provide high-frequency records of pCO2 and related variables [10,11,21,22,23,24,25]. However, many existing datasets are based on low-frequency or campaign-style measurements, which can miss short-term variability and seasonal extremes [10,21,25]. Continuous high-resolution time series are still scarce, particularly for mountainous rivers and canyon-shaped reservoirs. In addition, current monitoring networks are spatially biased towards lowland lakes and large rivers, leaving headwater streams, high-relief basins and river–reservoir continua under-represented in global syntheses [12,26]. As a result, the responses of inland-water CO2 dynamics to hydrological alterations, especially in dammed mountain river systems, remain poorly constrained.
The construction of dams and reservoirs profoundly alters river hydrology, biogeochemistry and ecosystem metabolism [27,28]. Mountainous regions host a substantial proportion of the world’s hydropower infrastructure due to their steep elevation gradients and abundant water resources. In such settings, river sections are frequently transformed into canyon-type reservoirs, while natural disturbances (e.g., landslide-dammed lakes) may coexist with engineered impoundments. These regulated river–reservoir systems are of broad practical relevance because their CO2 emissions can influence the net climate benefits of hydropower, and their carbon dynamics are closely linked to sectors such as hydropower production, drinking-water supply, fisheries and aquatic ecosystem management [7,29]. Understanding CO2 dynamics in these systems is therefore important not only for carbon-cycle science, but also for environmental monitoring and for designing reservoir operations that are compatible with national carbon-neutrality and water-management goals.
The upper reaches of the Minjiang River Basin in the mountainous region of southwest China provide a representative case of such a regulated mountain river system. Along a single river corridor, earthquake-formed barrier lakes and a large canyon-type hydropower reservoir (Zipingpu) coexist, creating a natural laboratory for examining how the transition from river to lake/reservoir conditions affects aquatic pCO2 under strong topographic and climatic gradients. Similar combinations of steep headwater rivers and hydropower reservoirs occur in many mountainous regions worldwide (e.g., Andes, Alps, Himalayas), making insights from this system relevant beyond the local scale [7,27,30].
Despite numerous studies having monitored CO2 in freshwater systems such as lakes, rivers and wetlands [2,10,25,28], significant limitations remain in our understanding of pCO2 dynamics in river–reservoir continua. On the one hand, existing research has often relied on historical or low-frequency datasets to explore changes in CO2 emissions from inland waters and the effects of reservoir construction on CO2 budgets [5,25]. In-depth comparative analyses of different water-body types within continuous river–reservoir continua are still insufficient, especially in mountainous regions, and relatively few studies have focused on how environmental changes induced by reservoir construction affect pCO2 in water bodies [13,27]. On the other hand, constraints of earlier monitoring technologies mean that many studies are based on seasonal or point measurements, which cannot adequately capture the continuous temporal variability of aquatic pCO2 and its coupling to rapidly changing hydrological and meteorological drivers [11,21,23,24]. Consequently, the mechanisms by which transitions from lotic to lentic conditions in mountain rivers regulate pCO2, and the extent to which such transitions modify CO2 source–sink behavior at the basin scale, remain incompletely understood.
In this context, the present study focuses on the upper reaches of the Minjiang River Basin in southwest China, where earthquake-formed barrier lakes and a canyon-type reservoir coexist along a single mountainous river system. Along this continuous river–barrier-lake–reservoir continuum, we conducted high-frequency in situ monitoring of aquatic pCO2 and key environmental variables to generate both scientific and practical insights. Specifically, the study aims to: (1) quantify the spatiotemporal patterns of pCO2 across coexisting lotic and lentic segments in a steep, dam-impacted mountain river, and (2) identify the key environmental drivers and biophysical mechanisms controlling CO2 dynamics during the transition from lotic to lentic conditions in mountainous rivers. From a scientific perspective, the analyses disentangle the relative contributions of physical factors (e.g., hydrology, water level, temperature) and biogeochemical factors (e.g., pH, DO, Chl-a) to pCO2, and clarify the conditions under which canyon-type reservoirs and barrier lakes function as net CO2 sources or partial sinks. From a practical perspective, the results can help optimize environmental monitoring strategies and carbon accounting for hydropower reservoirs, and support reservoir operation, watershed management and ecological restoration under carbon-neutrality and climate-adaptation policies. Ultimately, this work enhances our understanding of how anthropogenic and natural hydrological alterations in mountain rivers influence inland-water CO2 dynamics at scales relevant to regional carbon budgets and water-resource management.

2. Materials and Methods

2.1. Study Area

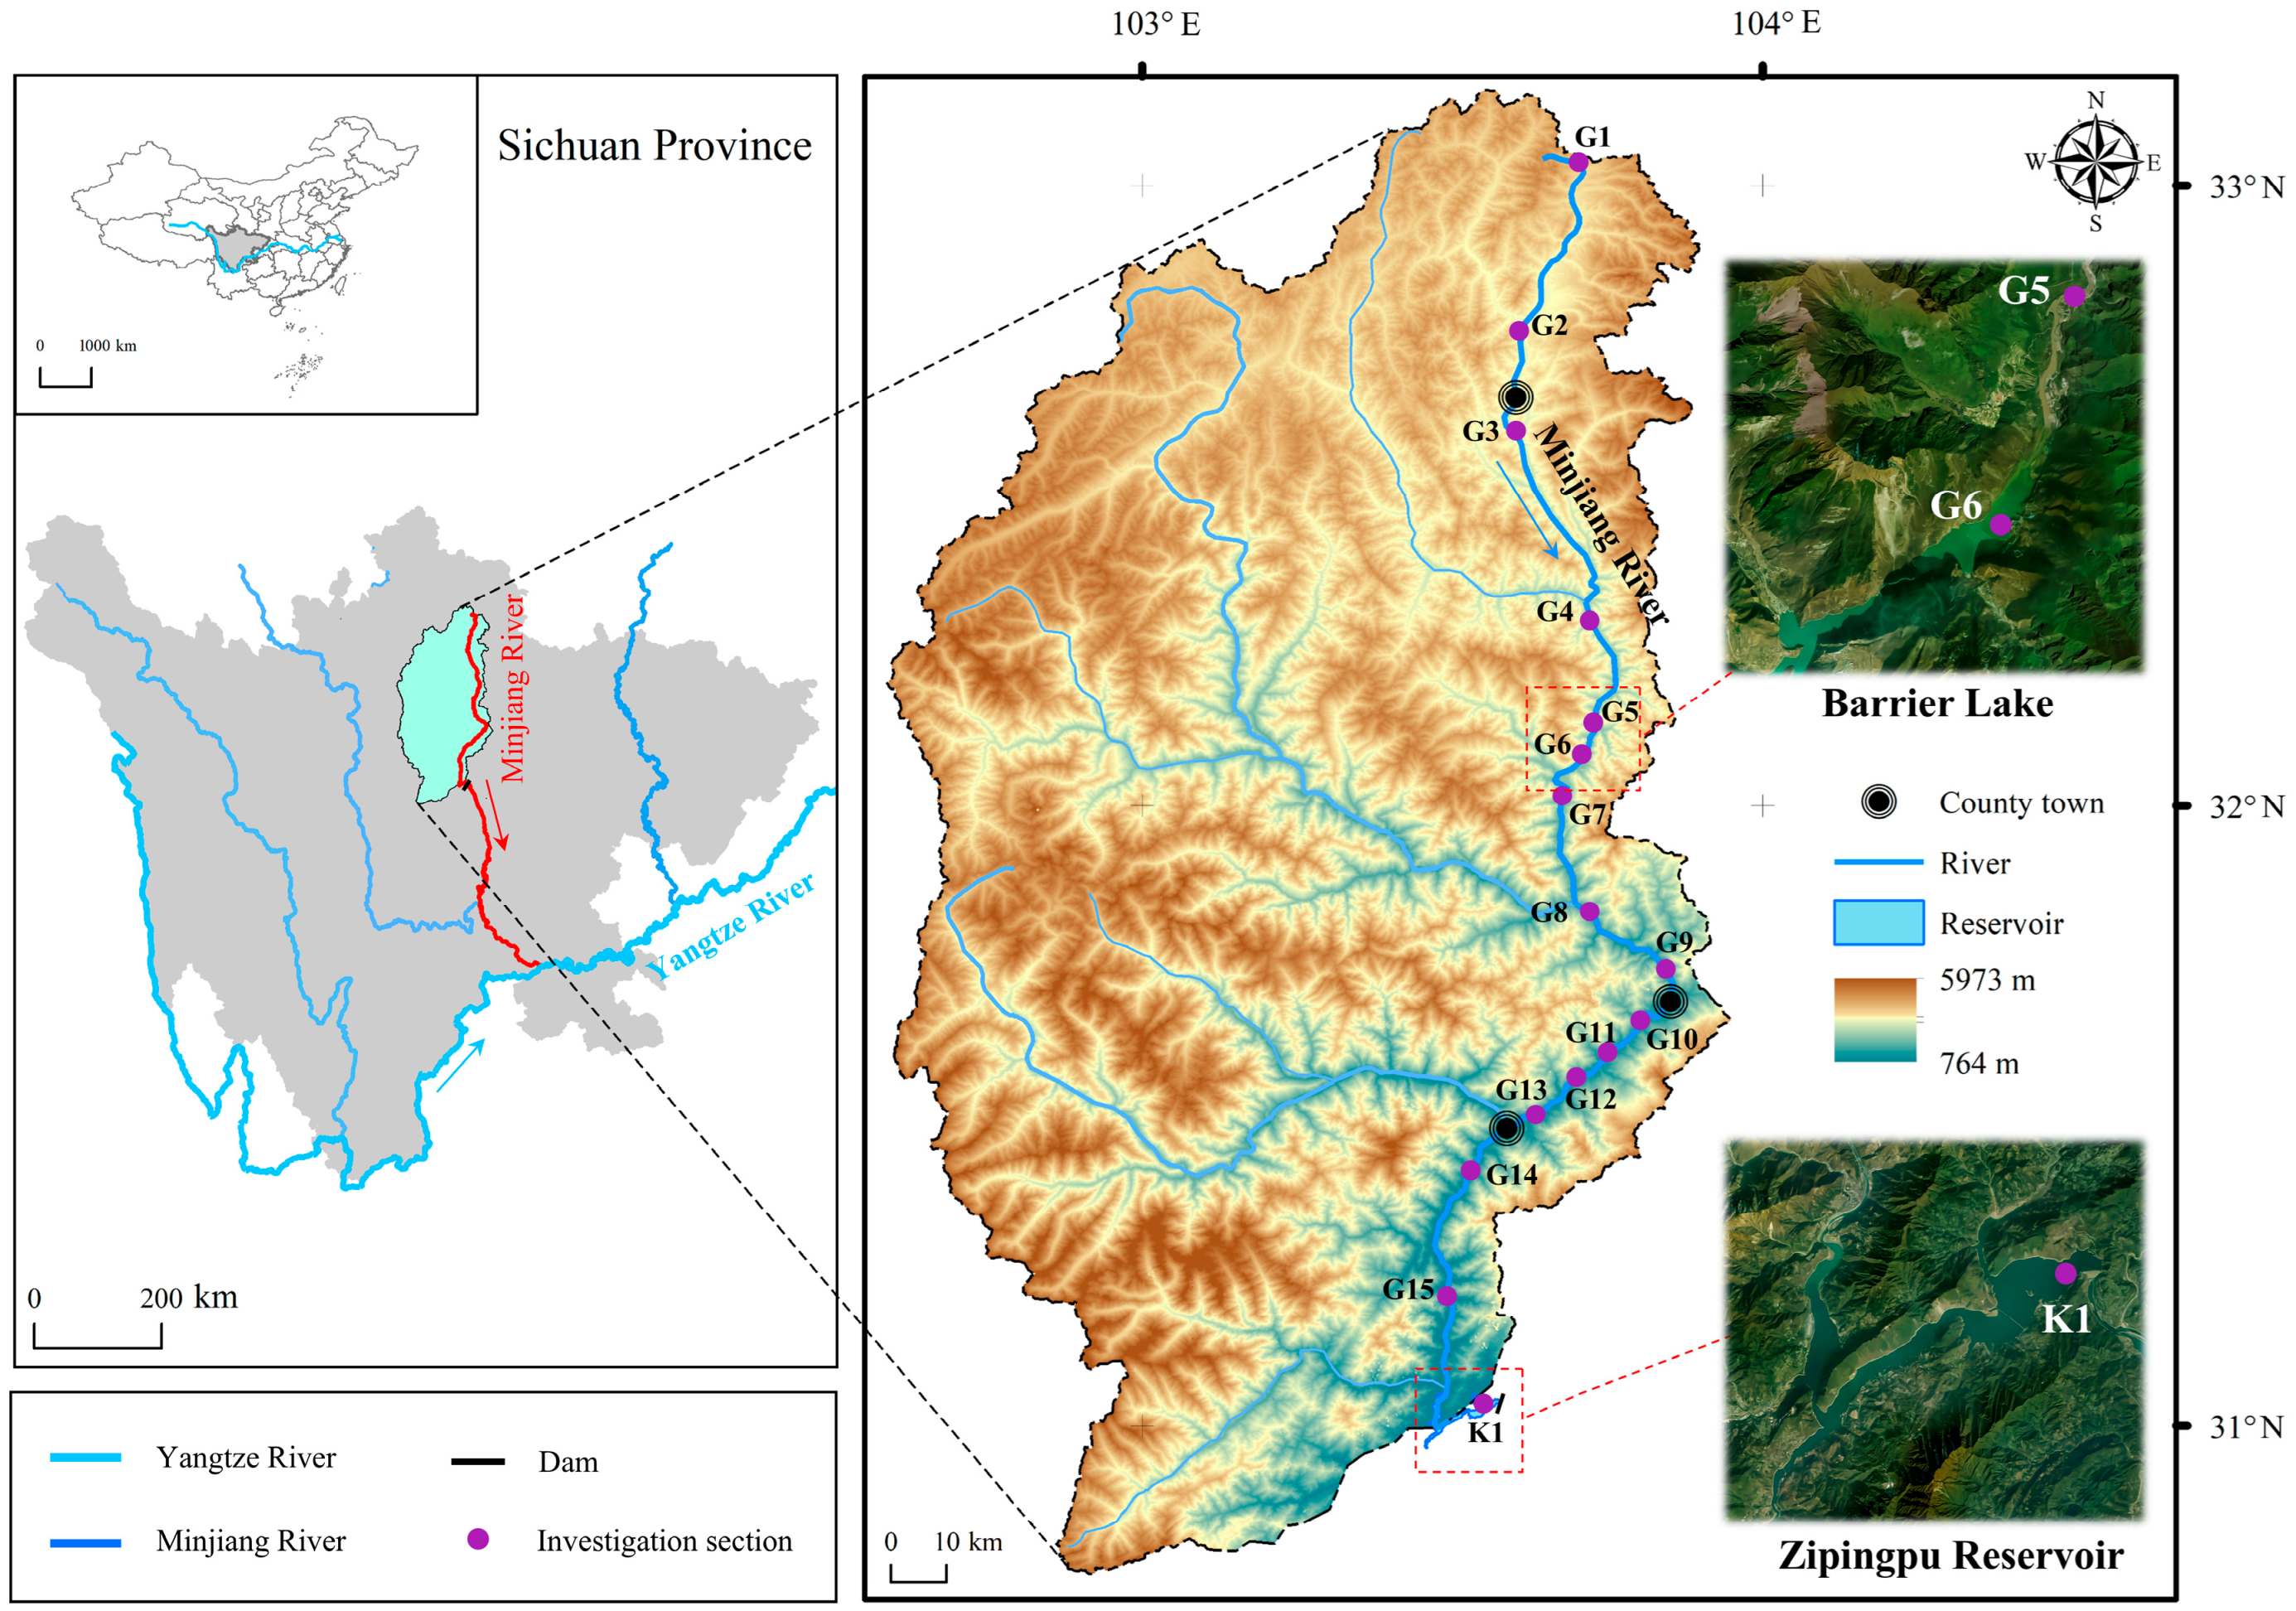
The Min River, located in the southwestern mountainous region of China (Figure 1), is an important tributary of the upper Yangtze River. It originates from the southern foot of the Min Mountains in Sichuan Province. The section from its source to the Dujiangyan area is defined as the upper Min River, with a length of 341 km, a basin area of 23,037 square kilometers, and a mouth flow of 483 m3/s. The upper Min River is characterized predominantly by canyon sections with rapid water flow and significant natural drops, resulting in an average channel gradient of 7.8‰. On 25 August 1933, approximately 35 km downstream from Zhenjianguan Township, the historically famous “Diexi Great Earthquake in China” occurred, forming a landslide lake with an average depth of 82 m, a water storage capacity of 150 million cubic meters, and a water surface area of more than 3.5 million square meters. The Zipingpu Water Conservancy Project, located upstream of Dujiangyan at the boundary between the upper and middle reaches of the Min River, is a large-scale comprehensive water conservancy project focused primarily on irrigation and water supply, combined with power generation and flood control functions. Its reservoir dam is 156 m high, with a total storage capacity of 1.112 billion cubic meters. The Zipingpu Water Conservancy Project controls a basin area of approximately 22,662 square kilometers, equivalent to 98% of the total area of the upper Min River. The flood season in the Min River Basin occurs from May to October, accounting for 80% of the annual rainfall, whereas the dry season is from November to April of the following year. In the upper Min River Basin, the temperature distribution increases from northwest to southeast. The precipitation distribution gradually decreases from Songpan County in northwestern China to Mao County in southeastern China and then sharply increases from Wenchuan County in southern China and from Guan County to the upper reaches of the Shouxi River and Baisha River in northwestern China. Heavy rainfall in the basin often occurs from May to September each year, with severe rainstorms occurring mostly in June and July.

2.2. Sample Collection and Analysis

We conducted field monitoring and water sampling in the upper reaches of the Min River in June, August, October, and December 2023. The study area mainly covers the mainstream section of the upper Minjiang River from Chuanzhusi Town to Zipingpu Reservoir (G1–G15) and the Zipingpu Reservoir area (K1). A total of 16 sampling sites were set up from an altitude of 700 m to 3000 m, and their locations are shown in Figure 1.
The monitoring design combined discrete campaign-based measurements in the river with continuous high-frequency monitoring in the reservoir. At the river mainstream sites (G1–G15), in situ measurements were conducted once during each field campaign, with pCO2 and associated environmental parameters measured a single time at every site, providing seasonal “snapshot” information for the river reaches. In contrast, at the reservoir site (K1), an autonomous sensor was deployed to record hourly pCO2 data and related environmental parameters from June to December 2023, thereby capturing the full temporal evolution of CO2 dynamics under lentic conditions.
For onsite meteorological parameter monitoring, we used the American Kestrel NK5500 (Kestrel Instruments, Nielsen-Kellerman Co., Boothwyn, PA, USA) handheld weather station to measure four indicators: air temperature, wind speed, humidity, and atmospheric pressure. We used an AML-6LRT multiparameter measuring instrument (AML Oceanographic, Sidney, BC, Canada) to measure onsite parameters, including water temperature (Tw), pH, dissolved oxygen (DO), turbidity (NTU), and chlorophyll a (Chl-a), at the sampling points. Chl-a was estimated in situ from the fluorometric channel of the AML-6LRT, and we note that such optical measurements involve some uncertainty, particularly at low concentrations; therefore, Chl-a is interpreted as an index of relative phytoplankton biomass rather than an exact absolute concentration. The AML-6LRT multiparameter instrument underwent pre- and post-deployment calibration following manufacturer protocols. It should be noted that in situ fluorometric measurements of chlorophyll-a may involve uncertainties due to factors such as sensor calibration and fluorescence quenching. In addition, surface illuminance was measured in the reservoir area using a light sensor (lux meter) co-located with the meteorological station. Illuminance was used to characterize incident light intensity at the water surface and served in this study as a proxy for light availability for phytoplankton. Hourly measurements were subsequently averaged to daily means for analysis.
Aquatic pCO2 was measured with a BSA/SZ-ZN (CO2) water-quality sensor (Basann Intelligent Technology Co., Ltd., Shenzhen, China), which is based on non-dispersive infrared (NDIR) absorption and is specifically designed for dissolved CO2 measurements in natural waters, with a manufacturer-specified accuracy on the order of 100 ppm within the environmental range encountered in this study. For the river sites (G1–G15), the sensor was used as a portable probe: at each site during each campaign, the probe was immersed at approximately 0.5 m below the water surface near the main flow, and pCO2 was recorded after the readings had stabilized. In the Zipingpu Reservoir (K1), the same model of pCO2 sensor was mounted on a fixed frame at ~0.5 m depth and programmed to log pCO2 once per hour from June to December 2023. Before deployment and during field campaigns, the pCO2 sensor was checked and calibrated according to the manufacturer’s instructions, including zero checks and inspection of the diffusion interface. Using the same sensor type and a consistent measurement depth (0.5 m) in both the river and reservoir ensured the comparability of pCO2 measurements across all sites. Using the same sensor type and a consistent measurement depth (0.5 m) in both the river and reservoir ensured the comparability of pCO2 measurements across all sites.

2.3. Data Analyses

To explore bivariate relationships between pCO2 and environmental variables, we first calculated Pearson correlation coefficients for the river reaches and for the reservoir. These correlations were used as an exploratory tool and to guide the choice of candidate predictors, but not as the sole basis for mechanistic interpretation. To account for collinearity among predictors and to identify their independent effects on pCO2, we further applied multiple linear regression. Separate models were built for the reservoir and for the river reaches. All the statistical analyses were performed using IBM SPSS Statistics, version 19.0 (IBM Corp., Armonk, NY, USA) and OriginPro 2022 (OriginLab Corp., Northampton, MA, USA). The graphical data were processed and visualized using Origin 2022 and Adobe Illustrator 2021 (Adobe Inc., San Jose, CA, USA).

3. Results

3.1. Temporal Characteristics of the Environmental Factors

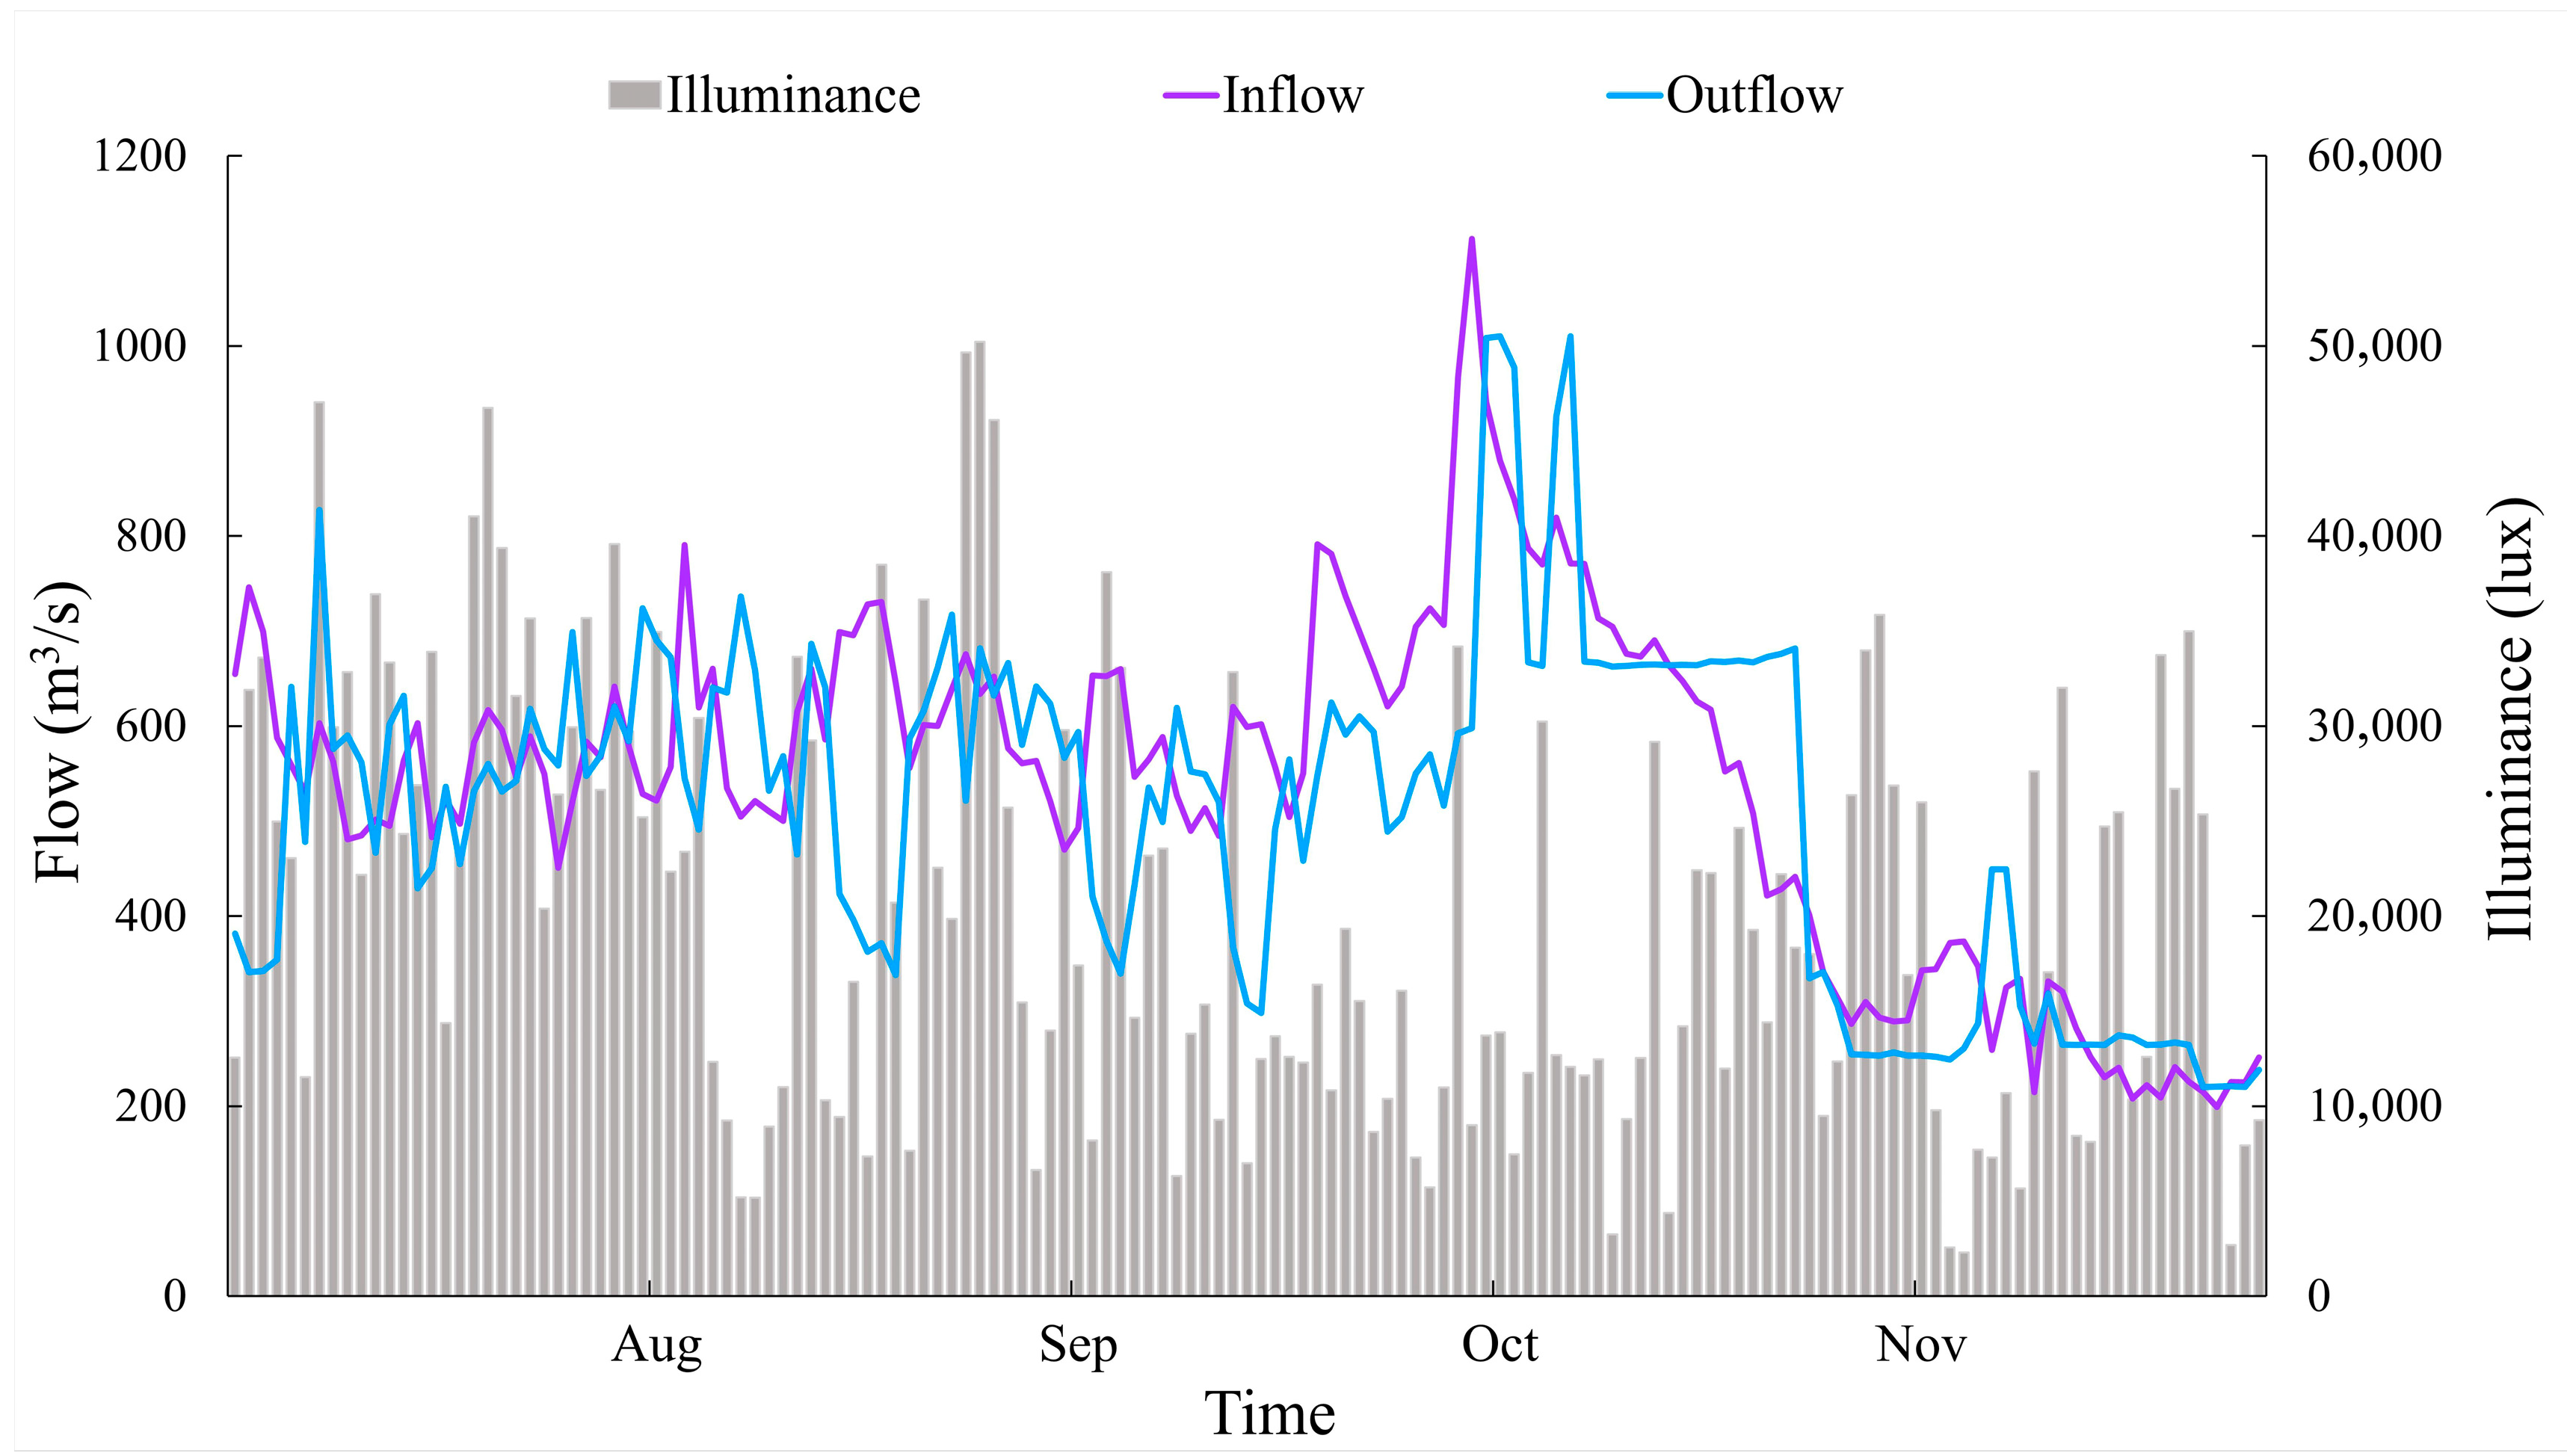
Table 1 presents the statistical results of key environmental factors in the upper reaches of the Minjiang River and Zipingpu Reservoir. In the mainstream of the Minjiang River, the water temperature (mean 12.34 °C) and chlorophyll level (mean 0.84 μg/L) were greater during the wet season than during the dry season (4.35 °C and 0.53 μg/L, respectively). Although Chl-a concentrations in the mainstream were generally low (mostly < 1 μg·L−1), this pattern is consistent with the steep, fast-flowing, and nutrient-poor character of the upper Minjiang River, where short water residence times and limited nutrient inputs constrain phytoplankton biomass. The highest chlorophyll concentration (5.22 μg/L) was detected in the upstream Diexi Lake reservoir area. Conversely, the dissolved oxygen levels were greater during the dry season. In the Zipingpu Reservoir, the water temperature and chlorophyll content were all relatively high during the wet season, whereas the dissolved oxygen concentration was relatively high during the dry season. Comparing the upper reaches of the Minjiang River with the static water areas of the Zipingpu Reservoir, the river section presented significantly lower water temperatures and chlorophyll levels but higher dissolved oxygen concentrations and pH values. The mainstream of the Minjiang River had a relatively high flow rate, with an average measured velocity of 0.43 m/s. The flow transitioned from dynamic to static at the upstream Diexi Lake and the Dujiangyan Zipingpu Reservoir, where the velocity decreased to near zero and the water depth increased substantially. The hydrological regime of the Zipingpu Reservoir during the study period was characterized by high inflow and outflow during the summer wet season and much lower discharge in late autumn and early winter (Figure 2). Daily mean inflow and outflow typically exceeded 500–700 m3 s−1 in July–August, but declined to below ~300 m3 s−1 from late October onwards. Surface illuminance showed a similar seasonal pattern, with highest daily mean values in summer and substantially reduced light levels in November.

3.2. Spatiotemporal Characteristics of pCO2 in Water

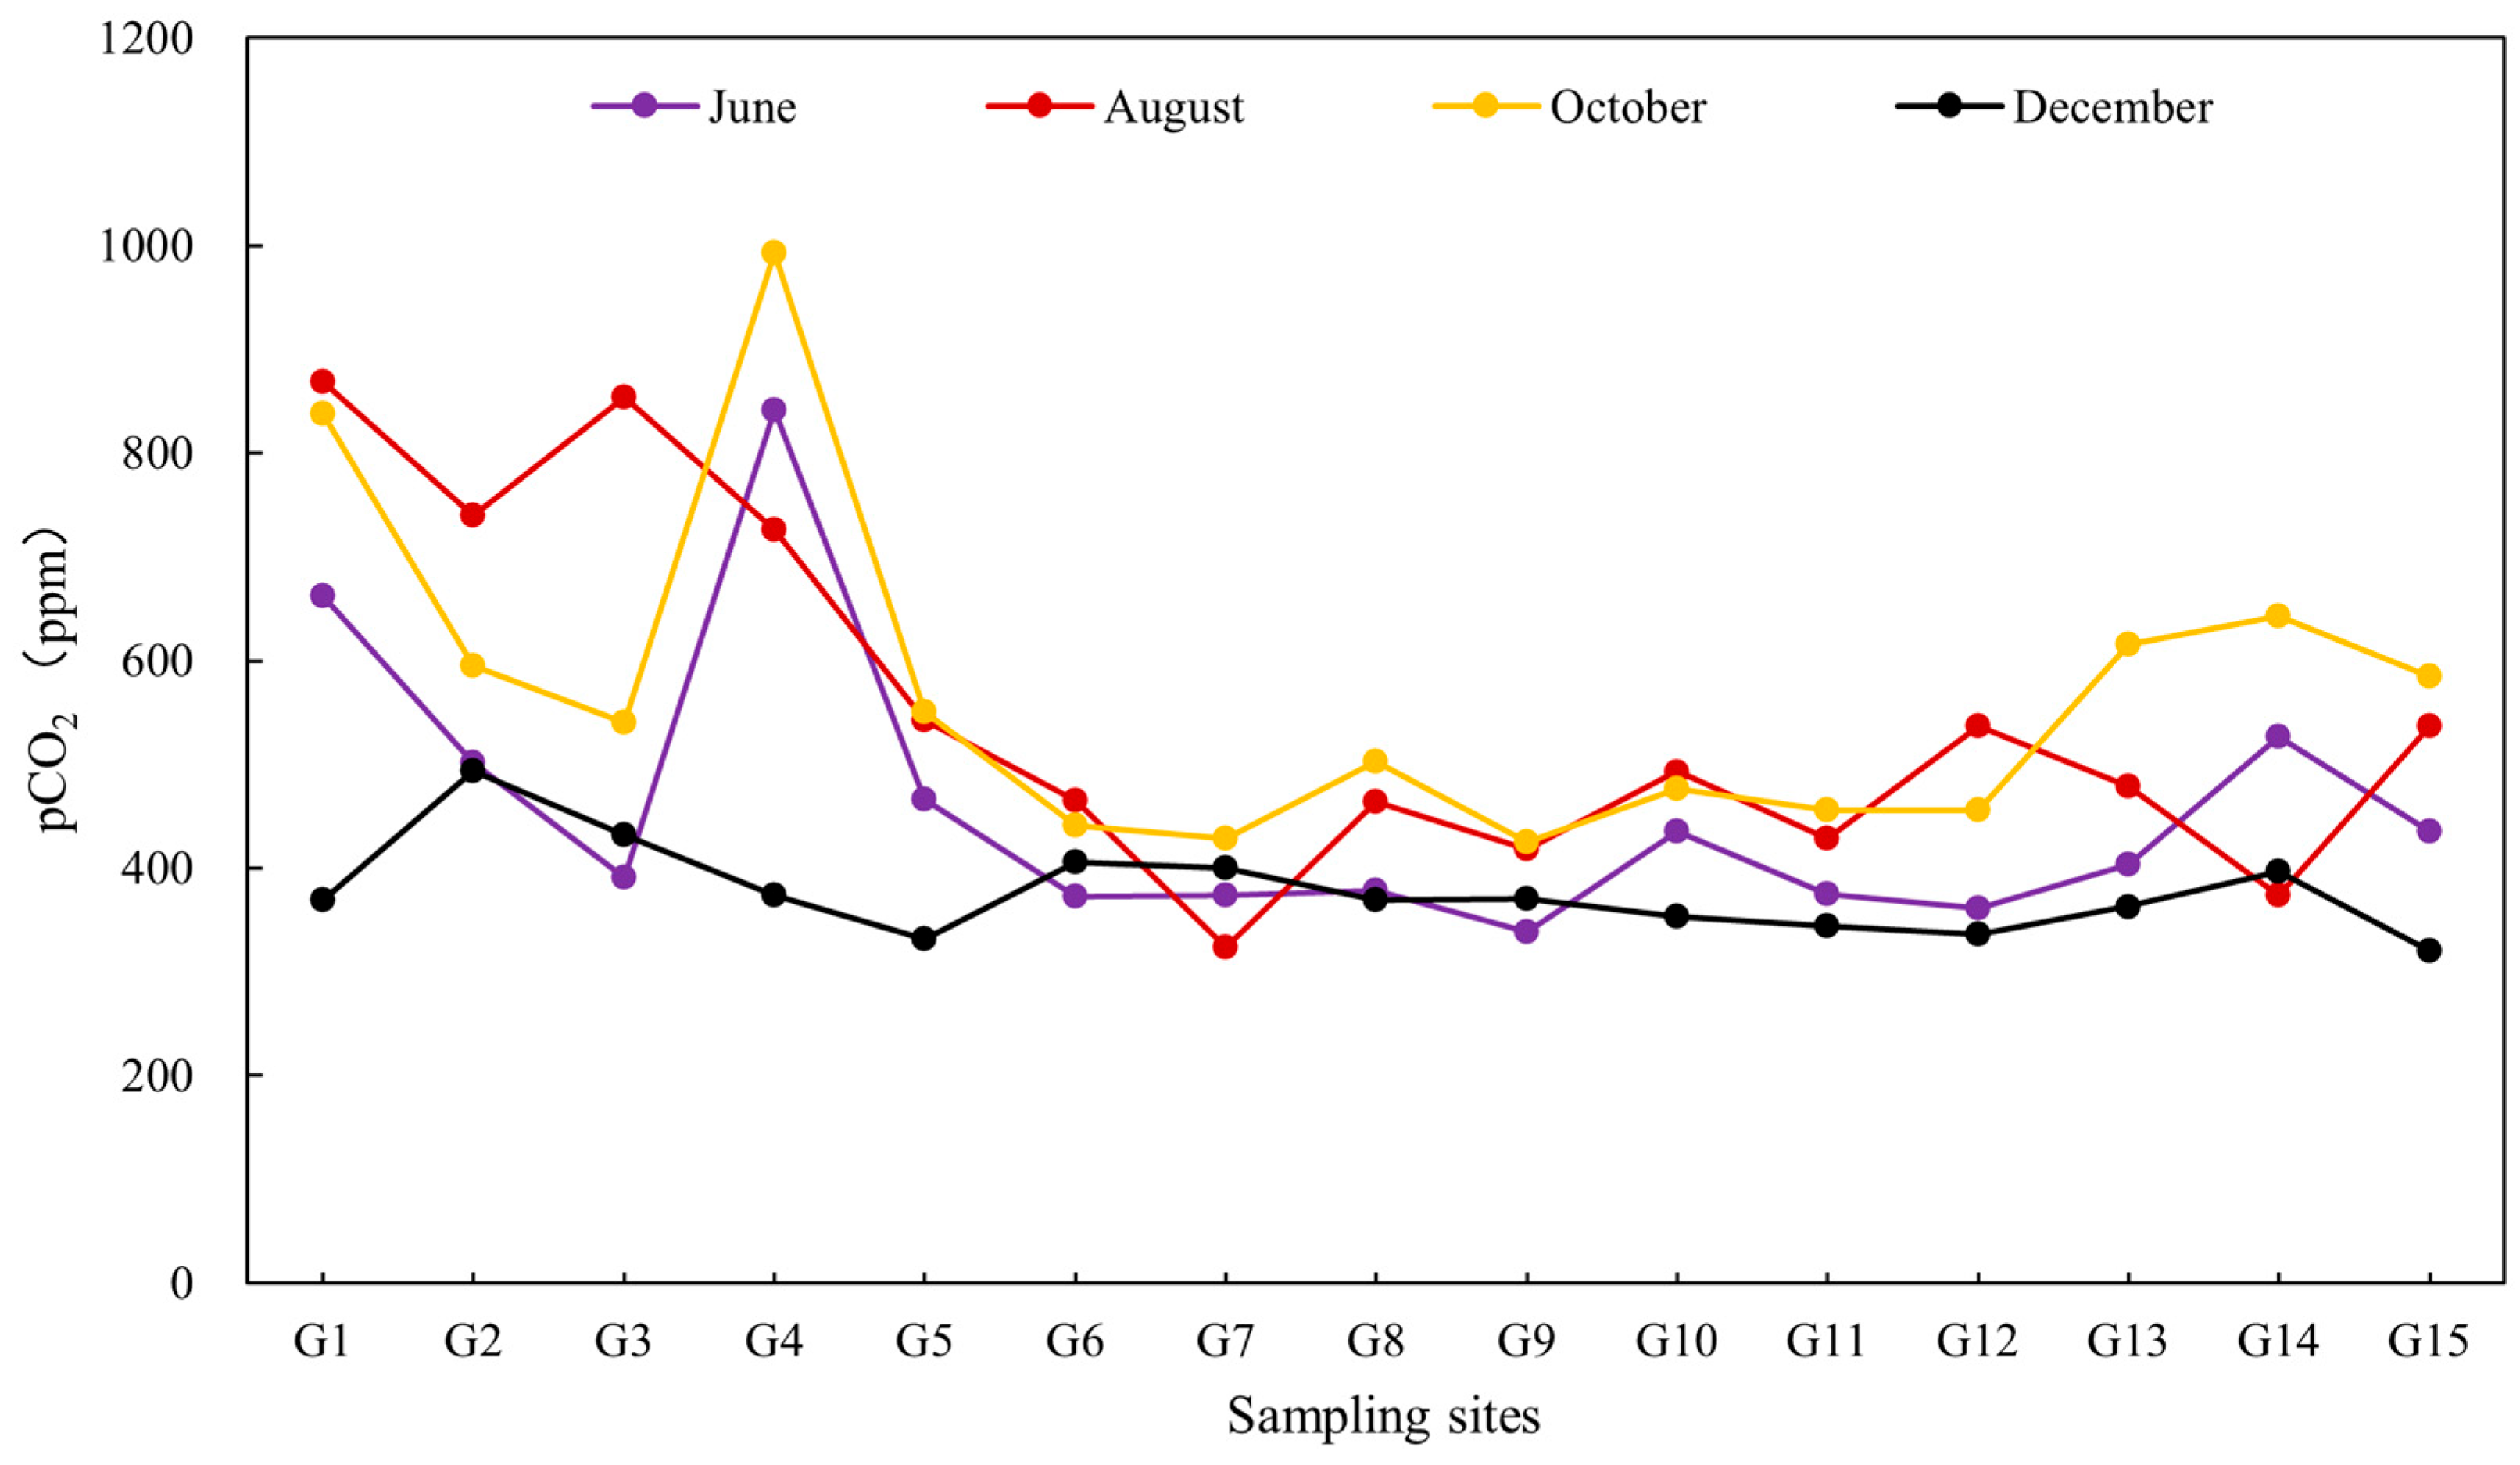
The spatial distribution of pCO2 in the water of the upper Minjiang River mainstream is illustrated in Figure 3. From June to December, the pCO2 consistently decreased from upstream to downstream. This trend was particularly pronounced during the wet season (June to October), whereas a slight decreasing trend was observed during the dry winter season in December. The formation of barrier lakes in the upper Minjiang River significantly altered the pCO2 patterns in the river water, which exhibited contrasting trends during the wet and dry seasons. During the wet season (June to October), the pCO2 decreased from the mainstream toward the lake center. Conversely, in the dry season (December), the pCO2 increased from the mainstream into the lake. Seasonally, pCO2 in the mainstream region showed significant variations. The pCO2 was greater in the wet season than in the dry season, in the following order: October > August > June > December.
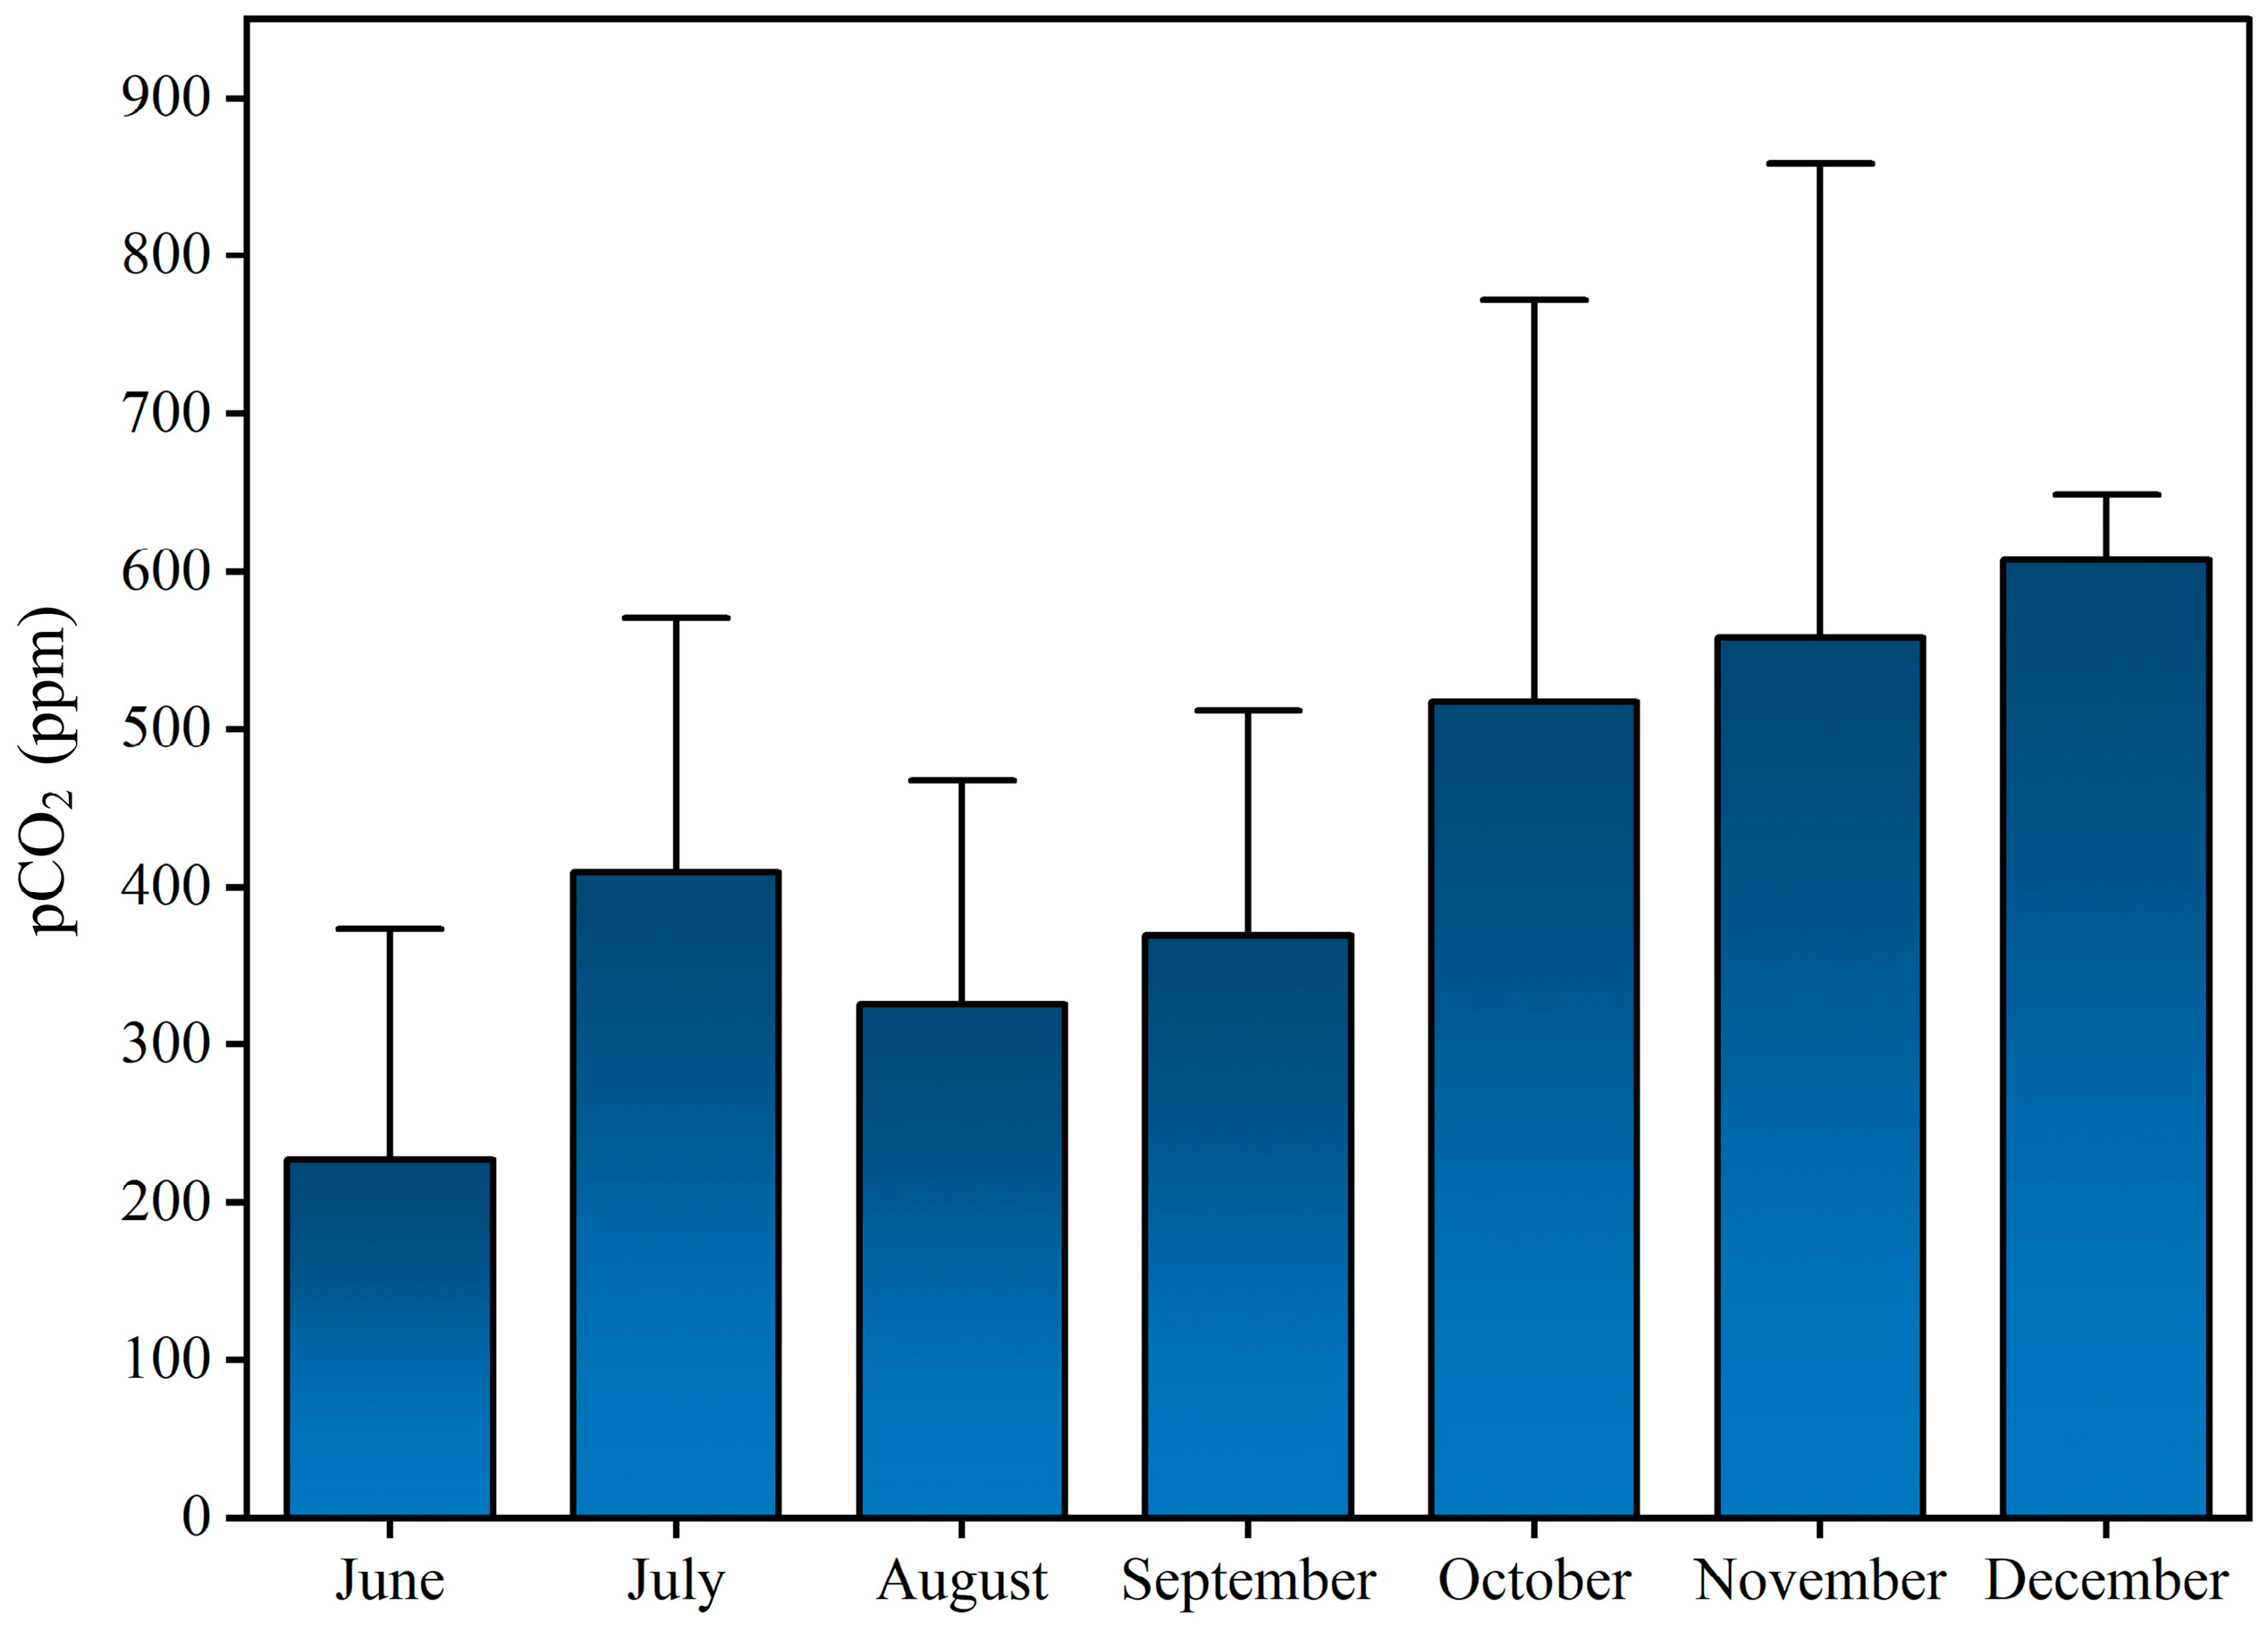
The temporal variation characteristics of pCO2 in the water of Zipingpu Reservoir are depicted in Figure 4. The temporal trend of pCO2 in the reservoir differed from that in the mainstream. In November, during the dry season, pCO2 was higher than that observed during the wet season (June to October). Overall, there was an increasing trend from June to December. There was a slight decrease in pCO2 from July to August, followed by a gradual increase thereafter.

3.3. pCO2 Differences Among the Mainstream, Reservoir Area, and Barrier Lakes

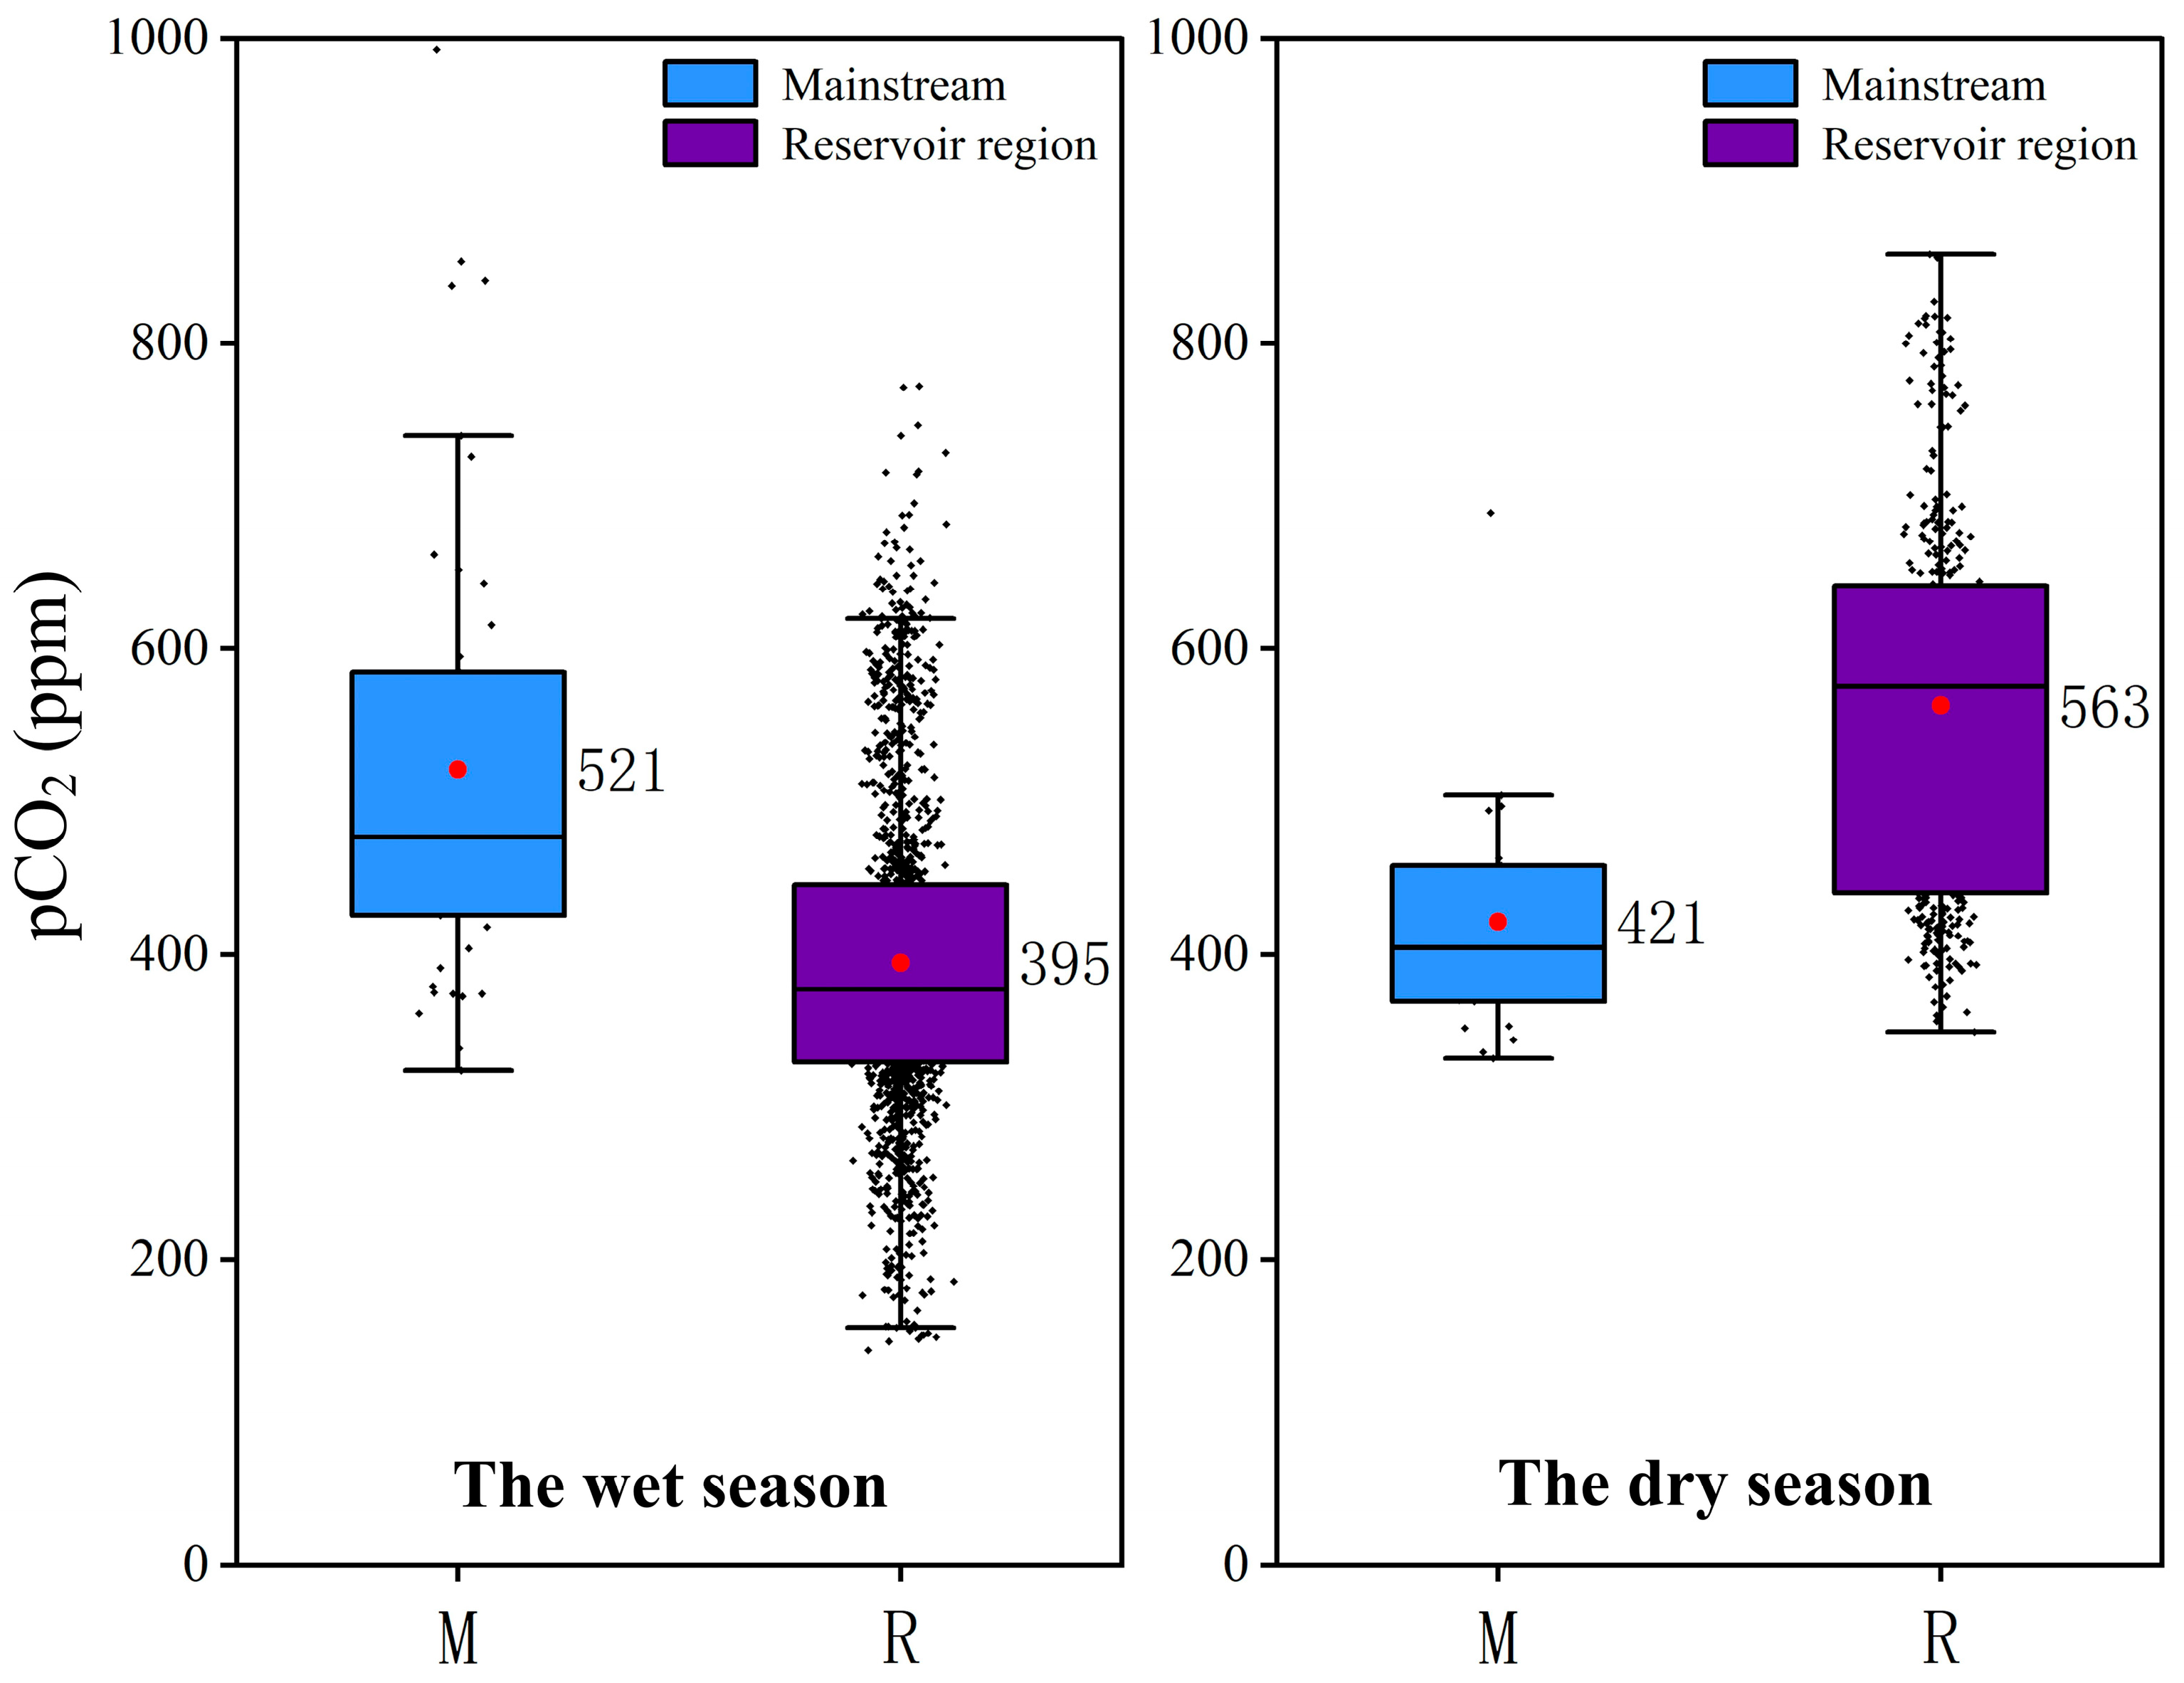
Figure 5 shows the comparison of pCO2 in the Zipingpu Reservoir and its upstream mainstream during the monitoring period, which was based on measured data. Significant differences in pCO2 between the mainstream and reservoir area were observed across different water periods. During the wet season, the average pCO2 in the mainstream and reservoir areas was 521 ppm and 395 ppm, respectively, with the mainstream having relatively high pCO2. During the dry season, the average pCO2 in the mainstream and reservoir areas was 421 ppm and 563 ppm, respectively, with the reservoir area generally having relatively high pCO2. The distribution of monitoring data points was more dispersed for both the mainstream and reservoir area during the wet season, whereas the data points were more clustered during the dry season. For the mainstream, the pCO2 was higher in the wet season than in the dry season. Conversely, in the reservoir area, the pCO2 was significantly lower in the wet season than in the dry season.
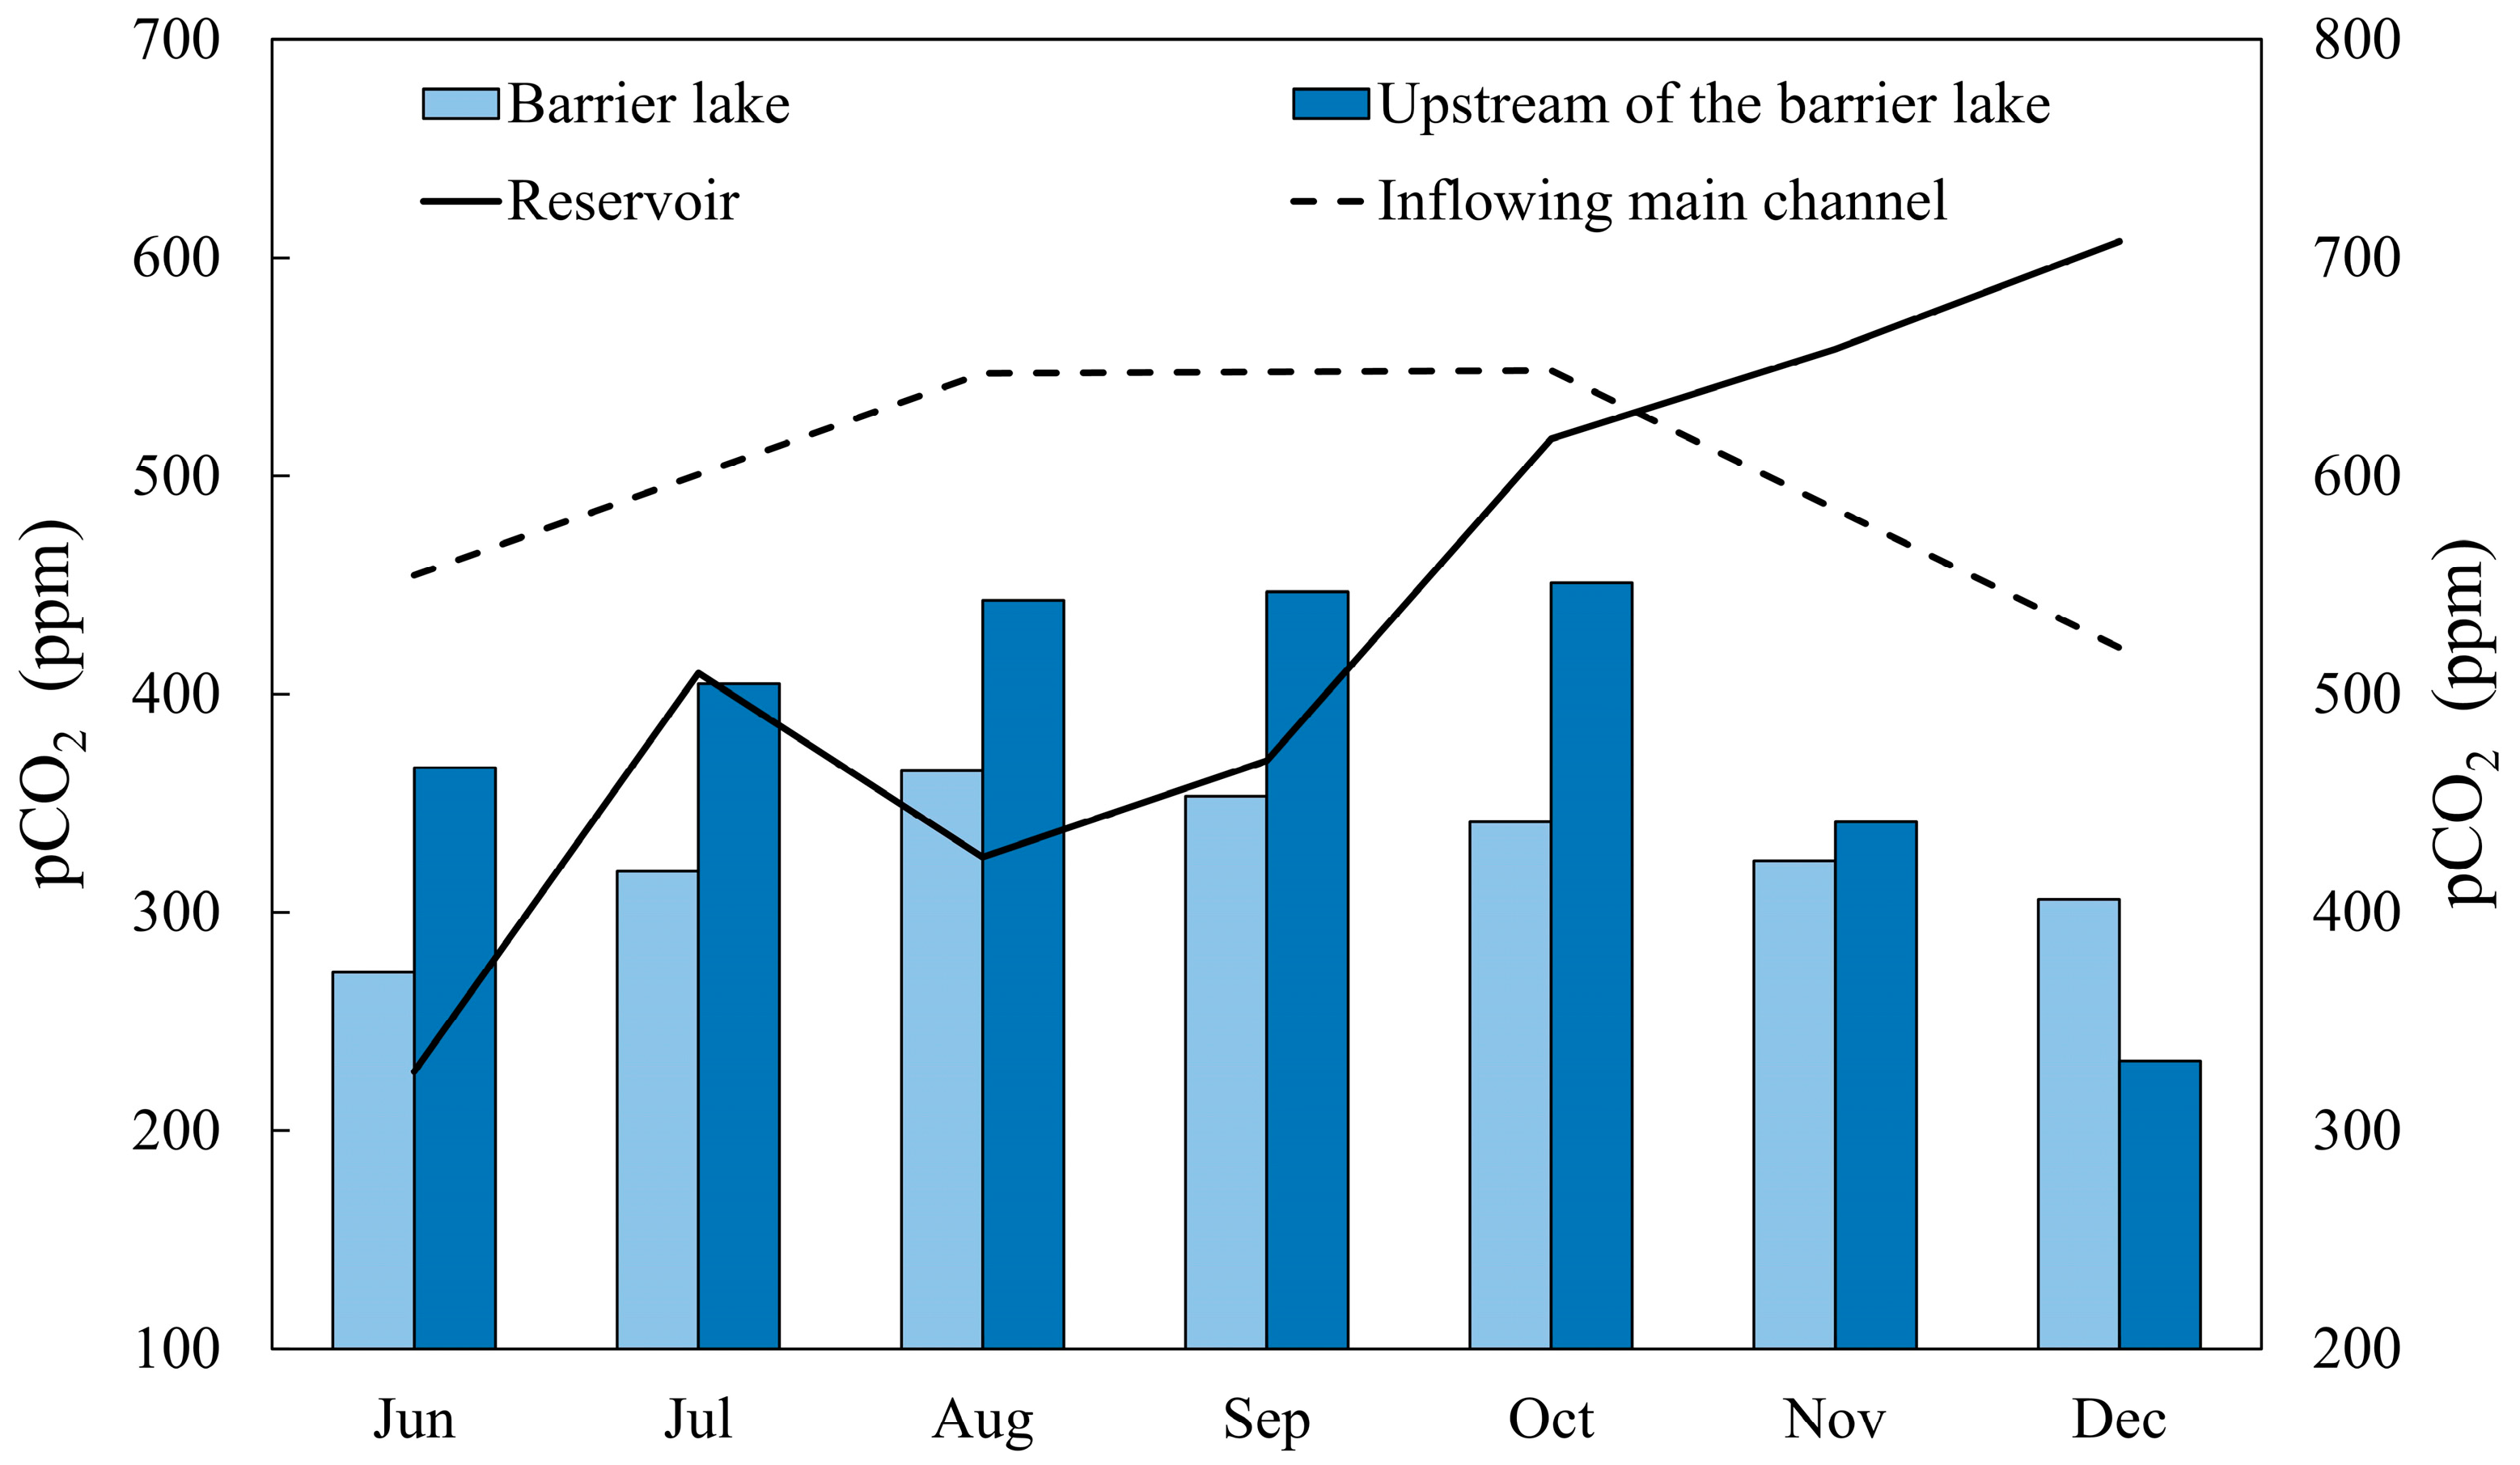
As shown in Figure 6, during the wet season (June to October), the pCO2 in the upstream of the Minjiang River was consistently higher than that in the Zipingpu Reservoir. During the dry season in November, the pCO2 in the mainstream began to decrease, whereas that in the reservoir continued to increase, even exceeding the pCO2 in the mainstream. This may be due to the lower water mobility in the reservoir, allowing for easier accumulation of CO2 produced by organic matter decomposition [11].
Similar characteristics were observed at Diexi Lake in the upper reaches of the Minjiang River (Figure 6). Diexi Lake is a barrier lake where the Minjiang River transitions from a river to a lake, significantly reducing the flow velocity and changing from flowing to still water, presenting hydrodynamic conditions similar to those of a reservoir. A comparison of the pCO2 from June to December in the upstream inflow and central sections of Diexi Lake revealed that during the wet season (June to October), the pCO2 in the barrier lake was lower than that in the mainstream. However, during the dry season (November to December), the pCO2 in the barrier lake exceeded that in the mainstream.

3.4. Correlation Between Aquatic pCO2 and Environmental Factors

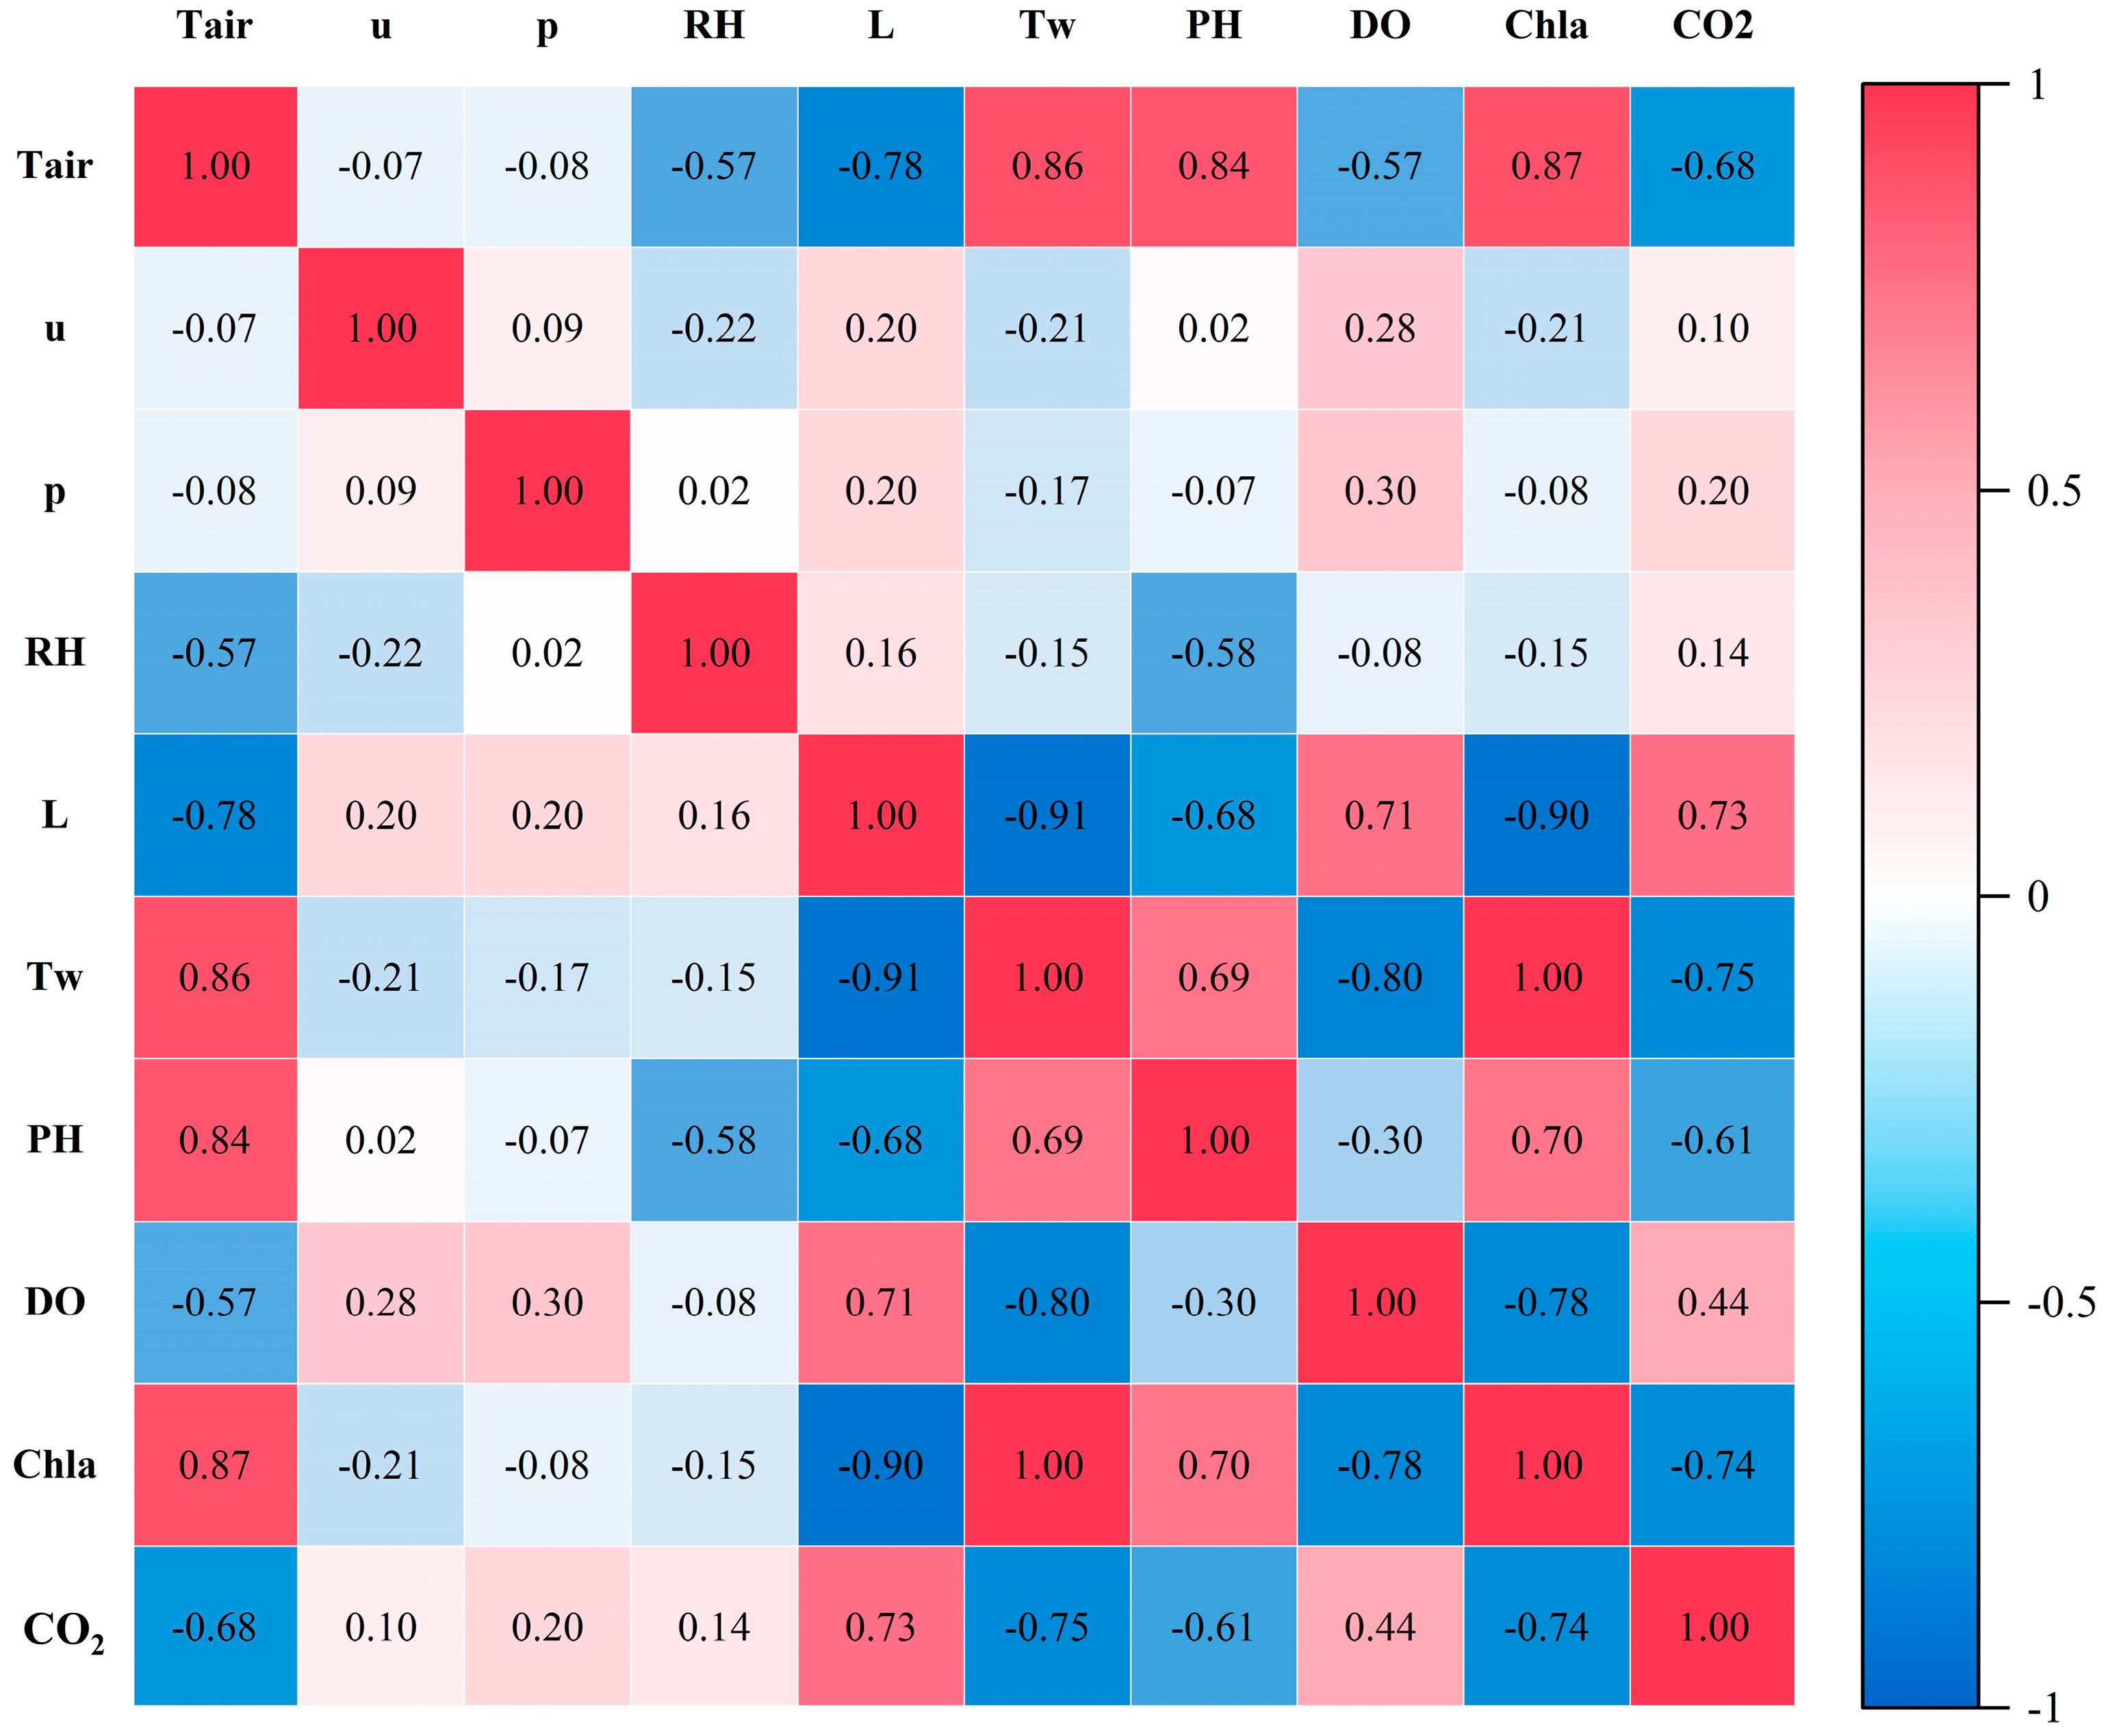
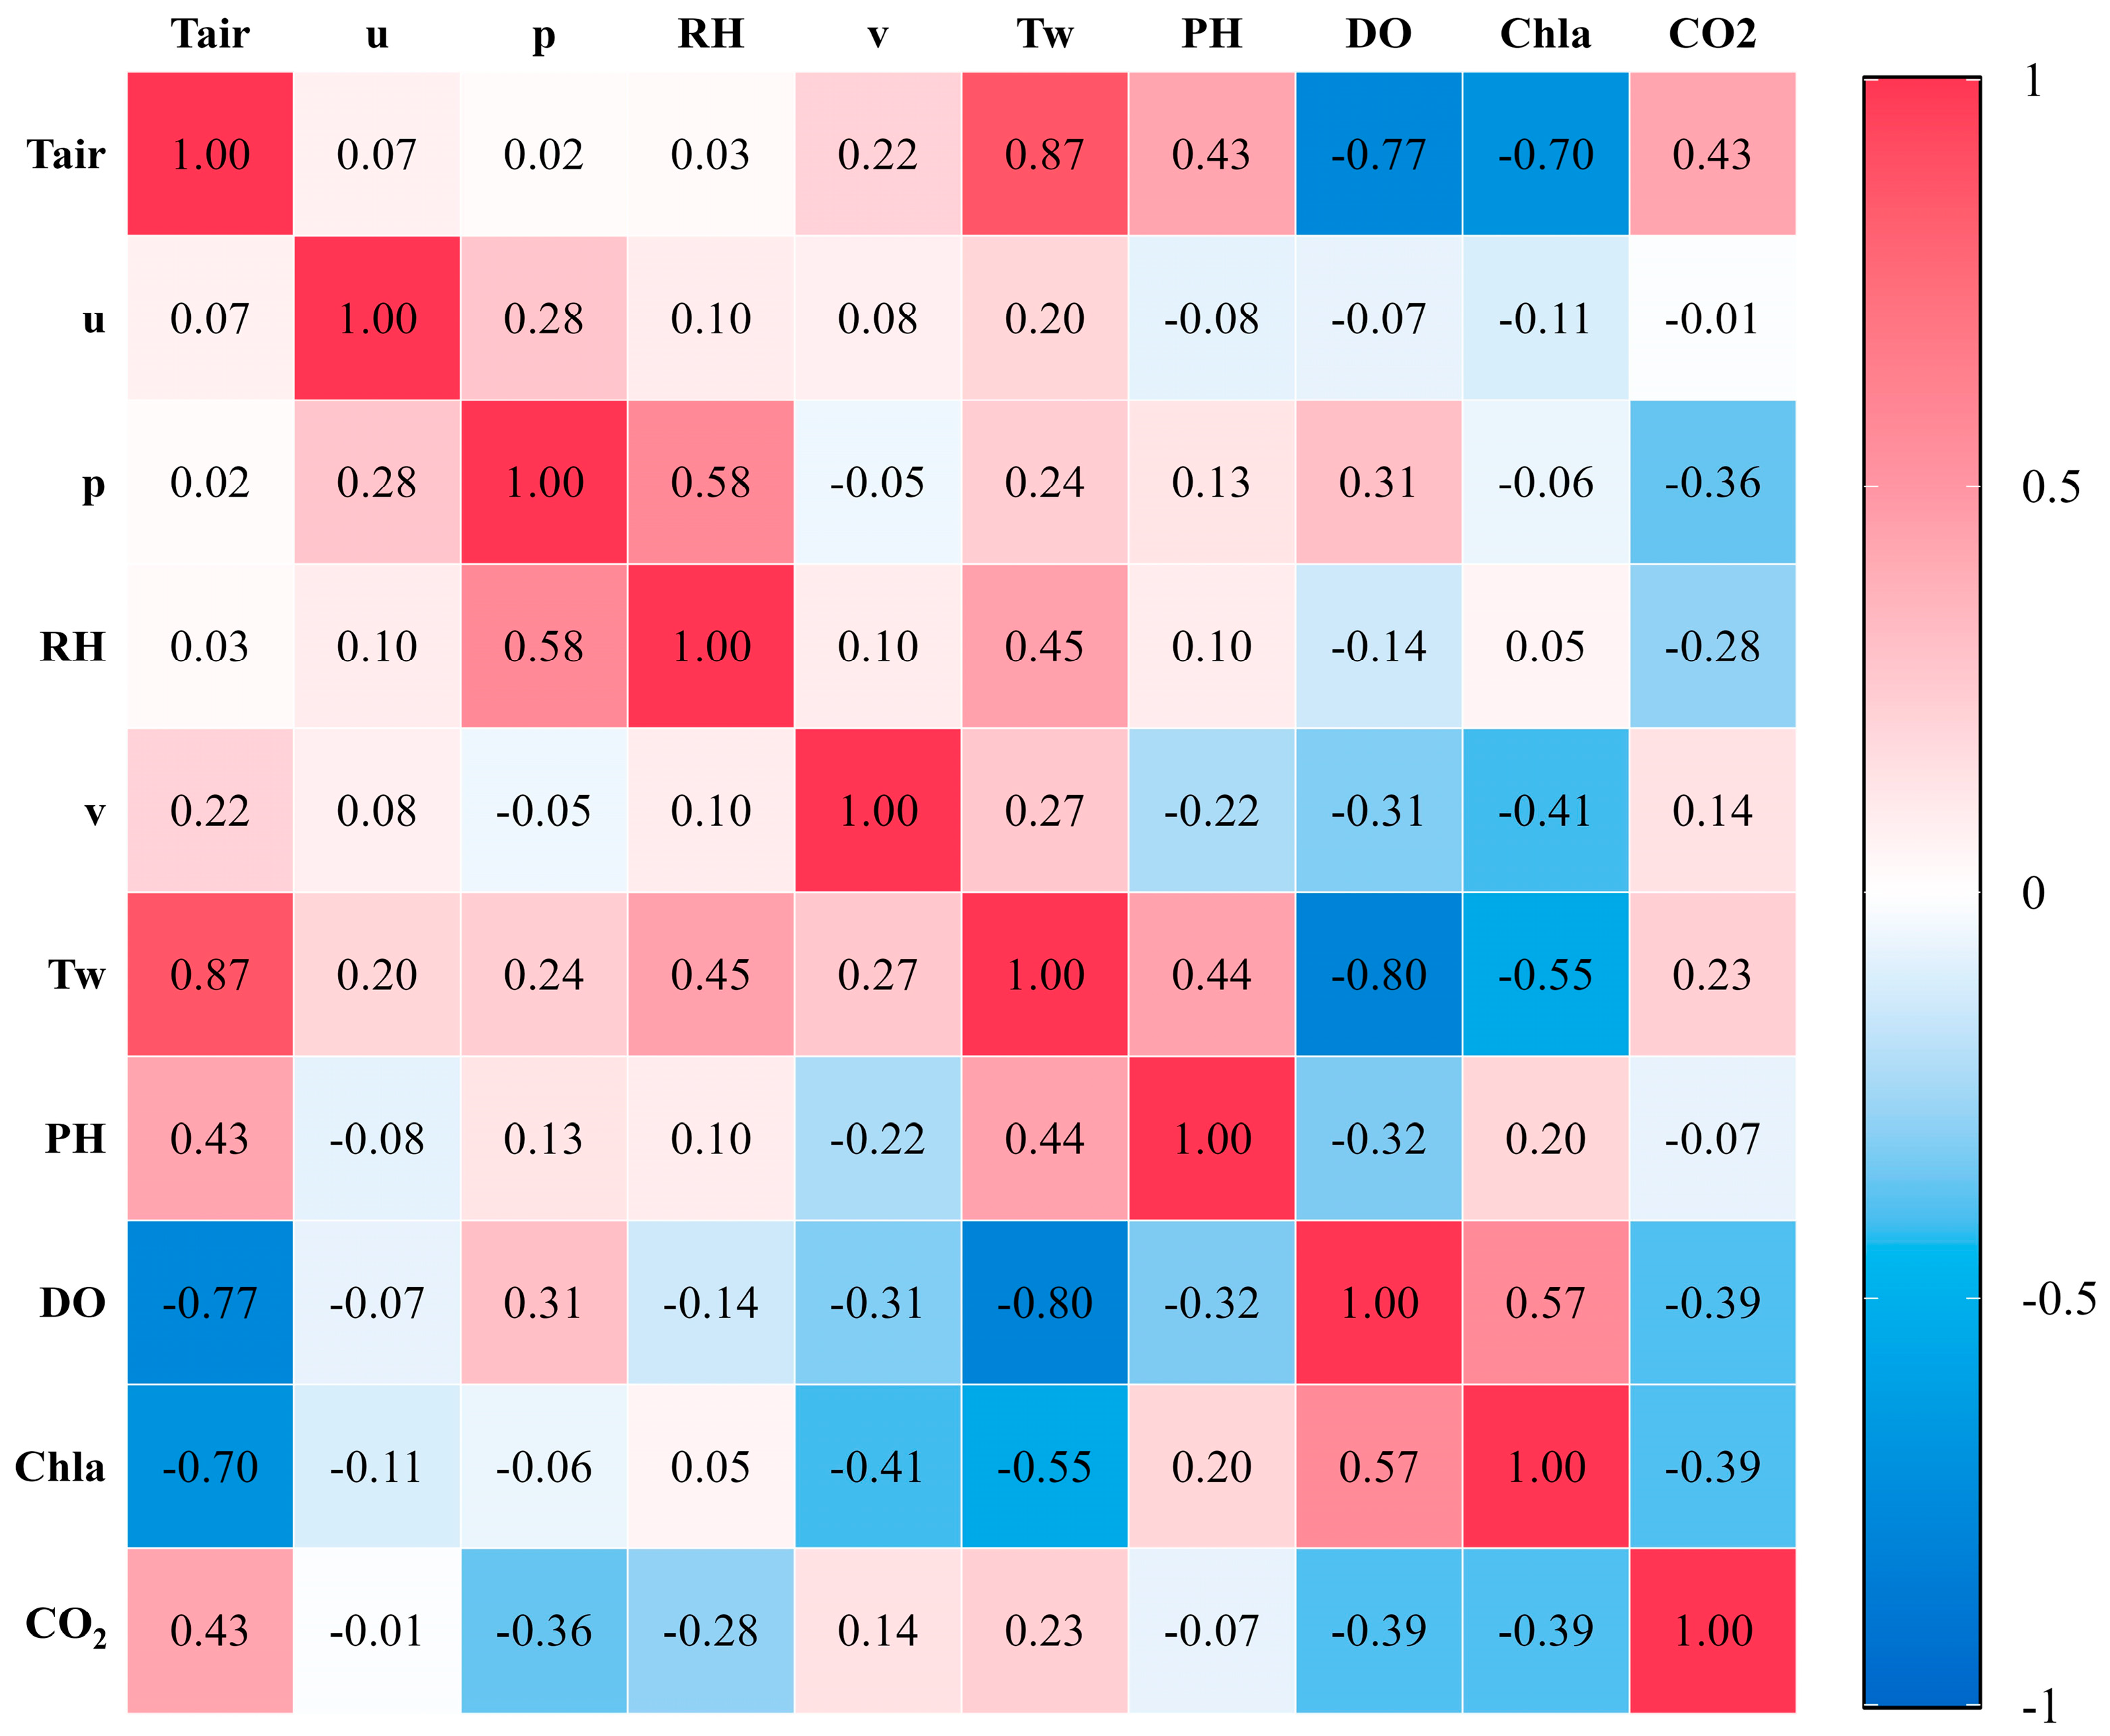
To investigate the relationships between aquatic pCO2 and various environmental factors, identify significant factors influencing pCO2 in both the mainstream and reservoir, and explore the reasons for pCO2 differences between these two water bodies, we employed Pearson correlation analysis on various monitored indicators. The results of the correlation analysis are shown in Figure 7 and Figure 8.
The correlation analysis results indicate that in the Zipingpu Reservoir, aquatic PCO2 was strongly correlated with water level, air temperature, dissolved oxygen, chlorophyll, water temperature, and pH. Specifically, pCO2 was significantly negatively correlated with water temperature, DO, and Chl-a, but positively correlated with water level. Multiple regression further confirmed that these relationships were not solely attributable to collinearity among the predictors (Table 2). In the final model, water level, DO, and Chl-a jointly accounted for 68% of the variance in daily mean pCO2 (R2 = 0.684, adjusted R2 = 0.677; F = 102.4, p < 0.001). Among these variables, Chl-a exhibited the strongest negative partial effect on pCO2 (standardized β = −0.869, p < 0.001), followed by DO (β = −0.388, p < 0.001), whereas water level showed a positive partial effect (β = 0.257, p = 0.026). After controlling for these variables, pH no longer displayed a significant independent effect, consistent with its tight coupling to pCO2 through carbonate chemistry. These findings indicate that periods characterized by high algal biomass and elevated DO correspond to lower pCO2, whereas higher water levels tend to promote CO2 accumulation within the reservoir.
In the upstream mainstream of the Minjiang River, aquatic pCO2 was strongly correlated with air temperature, atmospheric pressure, dissolved oxygen (DO), and Chl-a. Specifically, aquatic pCO2 was positively correlated with air temperature but negatively correlated with atmospheric pressure, DO, and Chl-a. The bivariate correlations between pCO2 and atmospheric pressure, water temperature, pH, DO, and Chl-a were generally weak to moderate (Figure 8). Moreover, a multiple regression model incorporating these five variables as predictors accounted for only a small fraction of the variance in pCO2 (R2 = 0.258, adjusted R2 = 0.204), and none of the partial regression effects were statistically significant (all p > 0.05). This outcome partly reflects the collinearity among water temperature, DO, and atmospheric pressure (VIF values up to ~8), and indicates that, at the spatial and temporal resolution of this study, riverine pCO2 is governed primarily by watershed-scale external inputs and seasonal dynamics rather than by any single in-stream parameter.

3.5. Relationships Between CO2 Concentration in Water and Key Environmental Factors

The pCO2 in aquatic systems is intricately linked to carbonate equilibrium and in situ biological metabolism. pH plays a crucial role in regulating the carbonate balance in water bodies, whereas DO and Chl-a serve as indicative factors. Water temperature is a key parameter affecting physical, chemical, and biological processes. Based on correlation analysis, we focused on examining the relationships between pCO2 and pH, DO, water temperature, and Chl-a in different water bodies of the upper Minjiang River. Additionally, we analyzed the effects of reservoir water level fluctuations and atmospheric pressure changes along the river on the pCO2 in water.
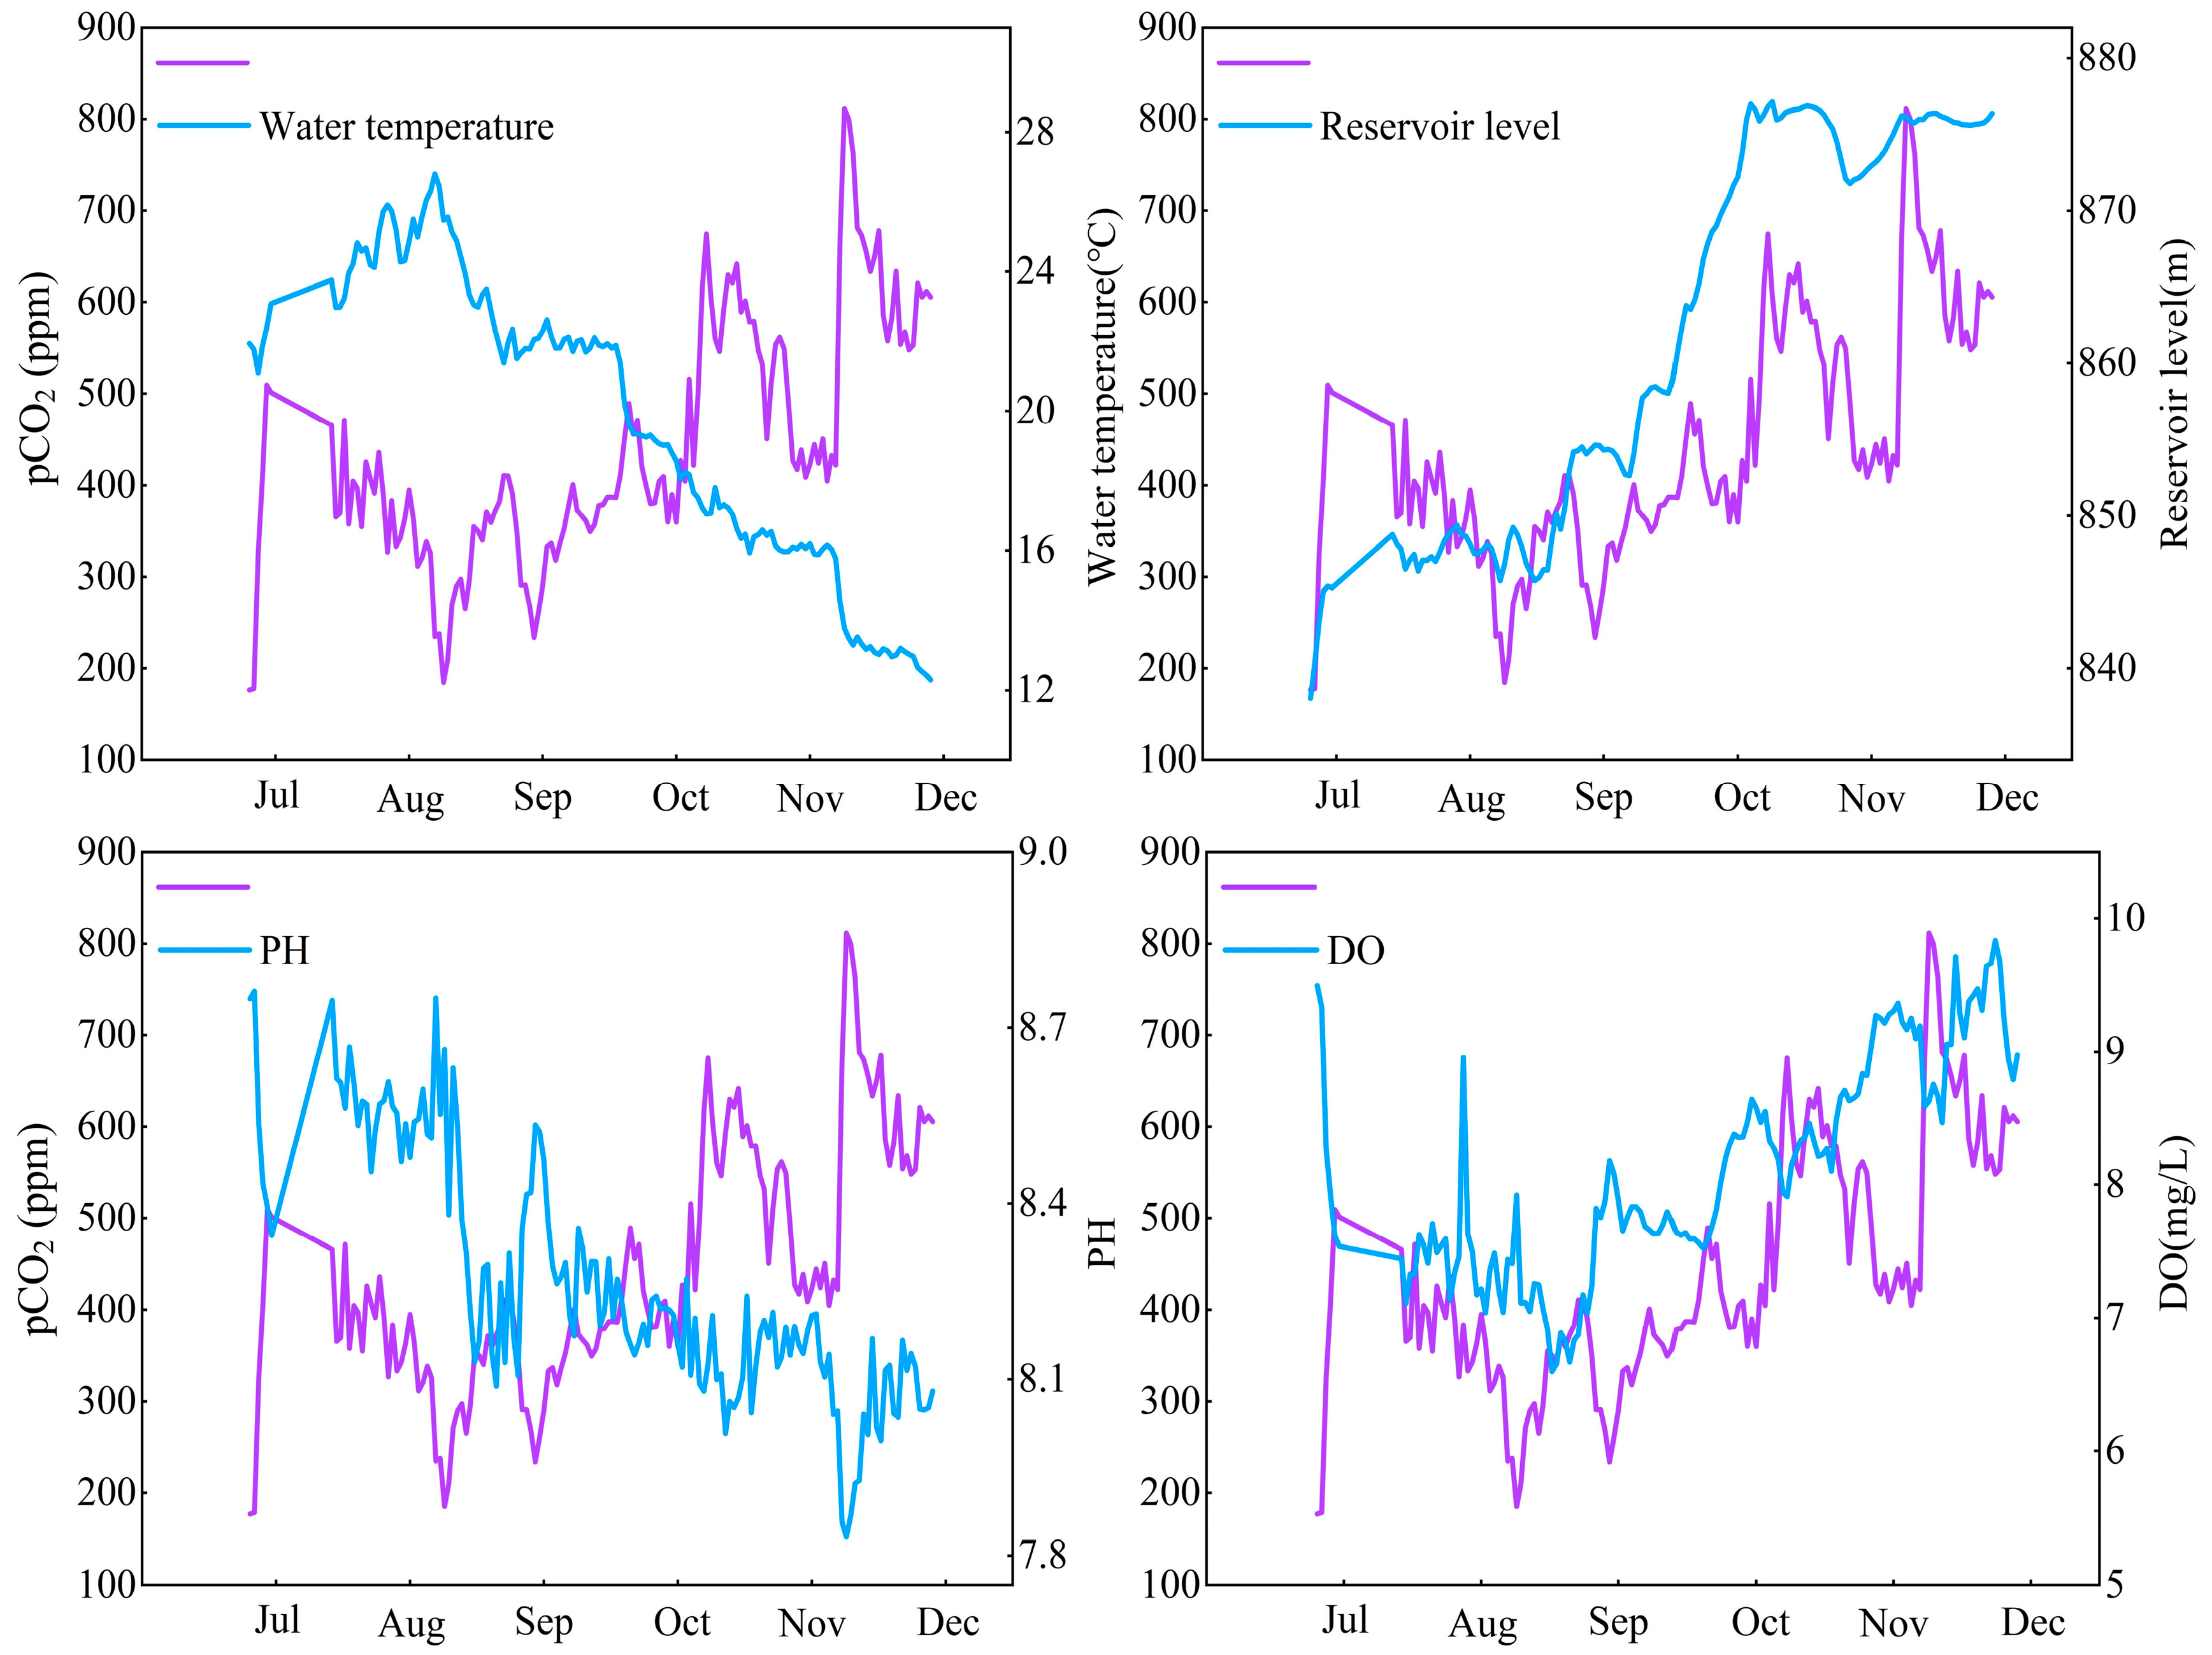
The temporal dynamics of aqueous pCO2 and pertinent environmental parameters in the Zipingpu Reservoir are depicted in Figure 9. Continuous measurement data revealed that the pCO2 in the reservoir area exhibited temporal trends similar to those of the water level and dissolved oxygen during the monitoring period. Generally, the pCO2 increased with increasing water level and DO concentration, indicating that water level changes due to reservoir storage significantly influence the pCO2 in water. Conversely, the pCO2 in the reservoir area exhibited opposite temporal trends to those of the water temperature and pH, generally increasing as the temperature and pH decreased. The pH indicator consistently displayed an inverse relationship with the pCO2 in both the long- and short-term analyses. The relationship between the dissolved oxygen and pCO2 in the reservoir area showed consistent trends in the long term, both initially decreasing and then increasing. However, in the short term, these factors exhibited opposite trends, demonstrating an inverse relationship.
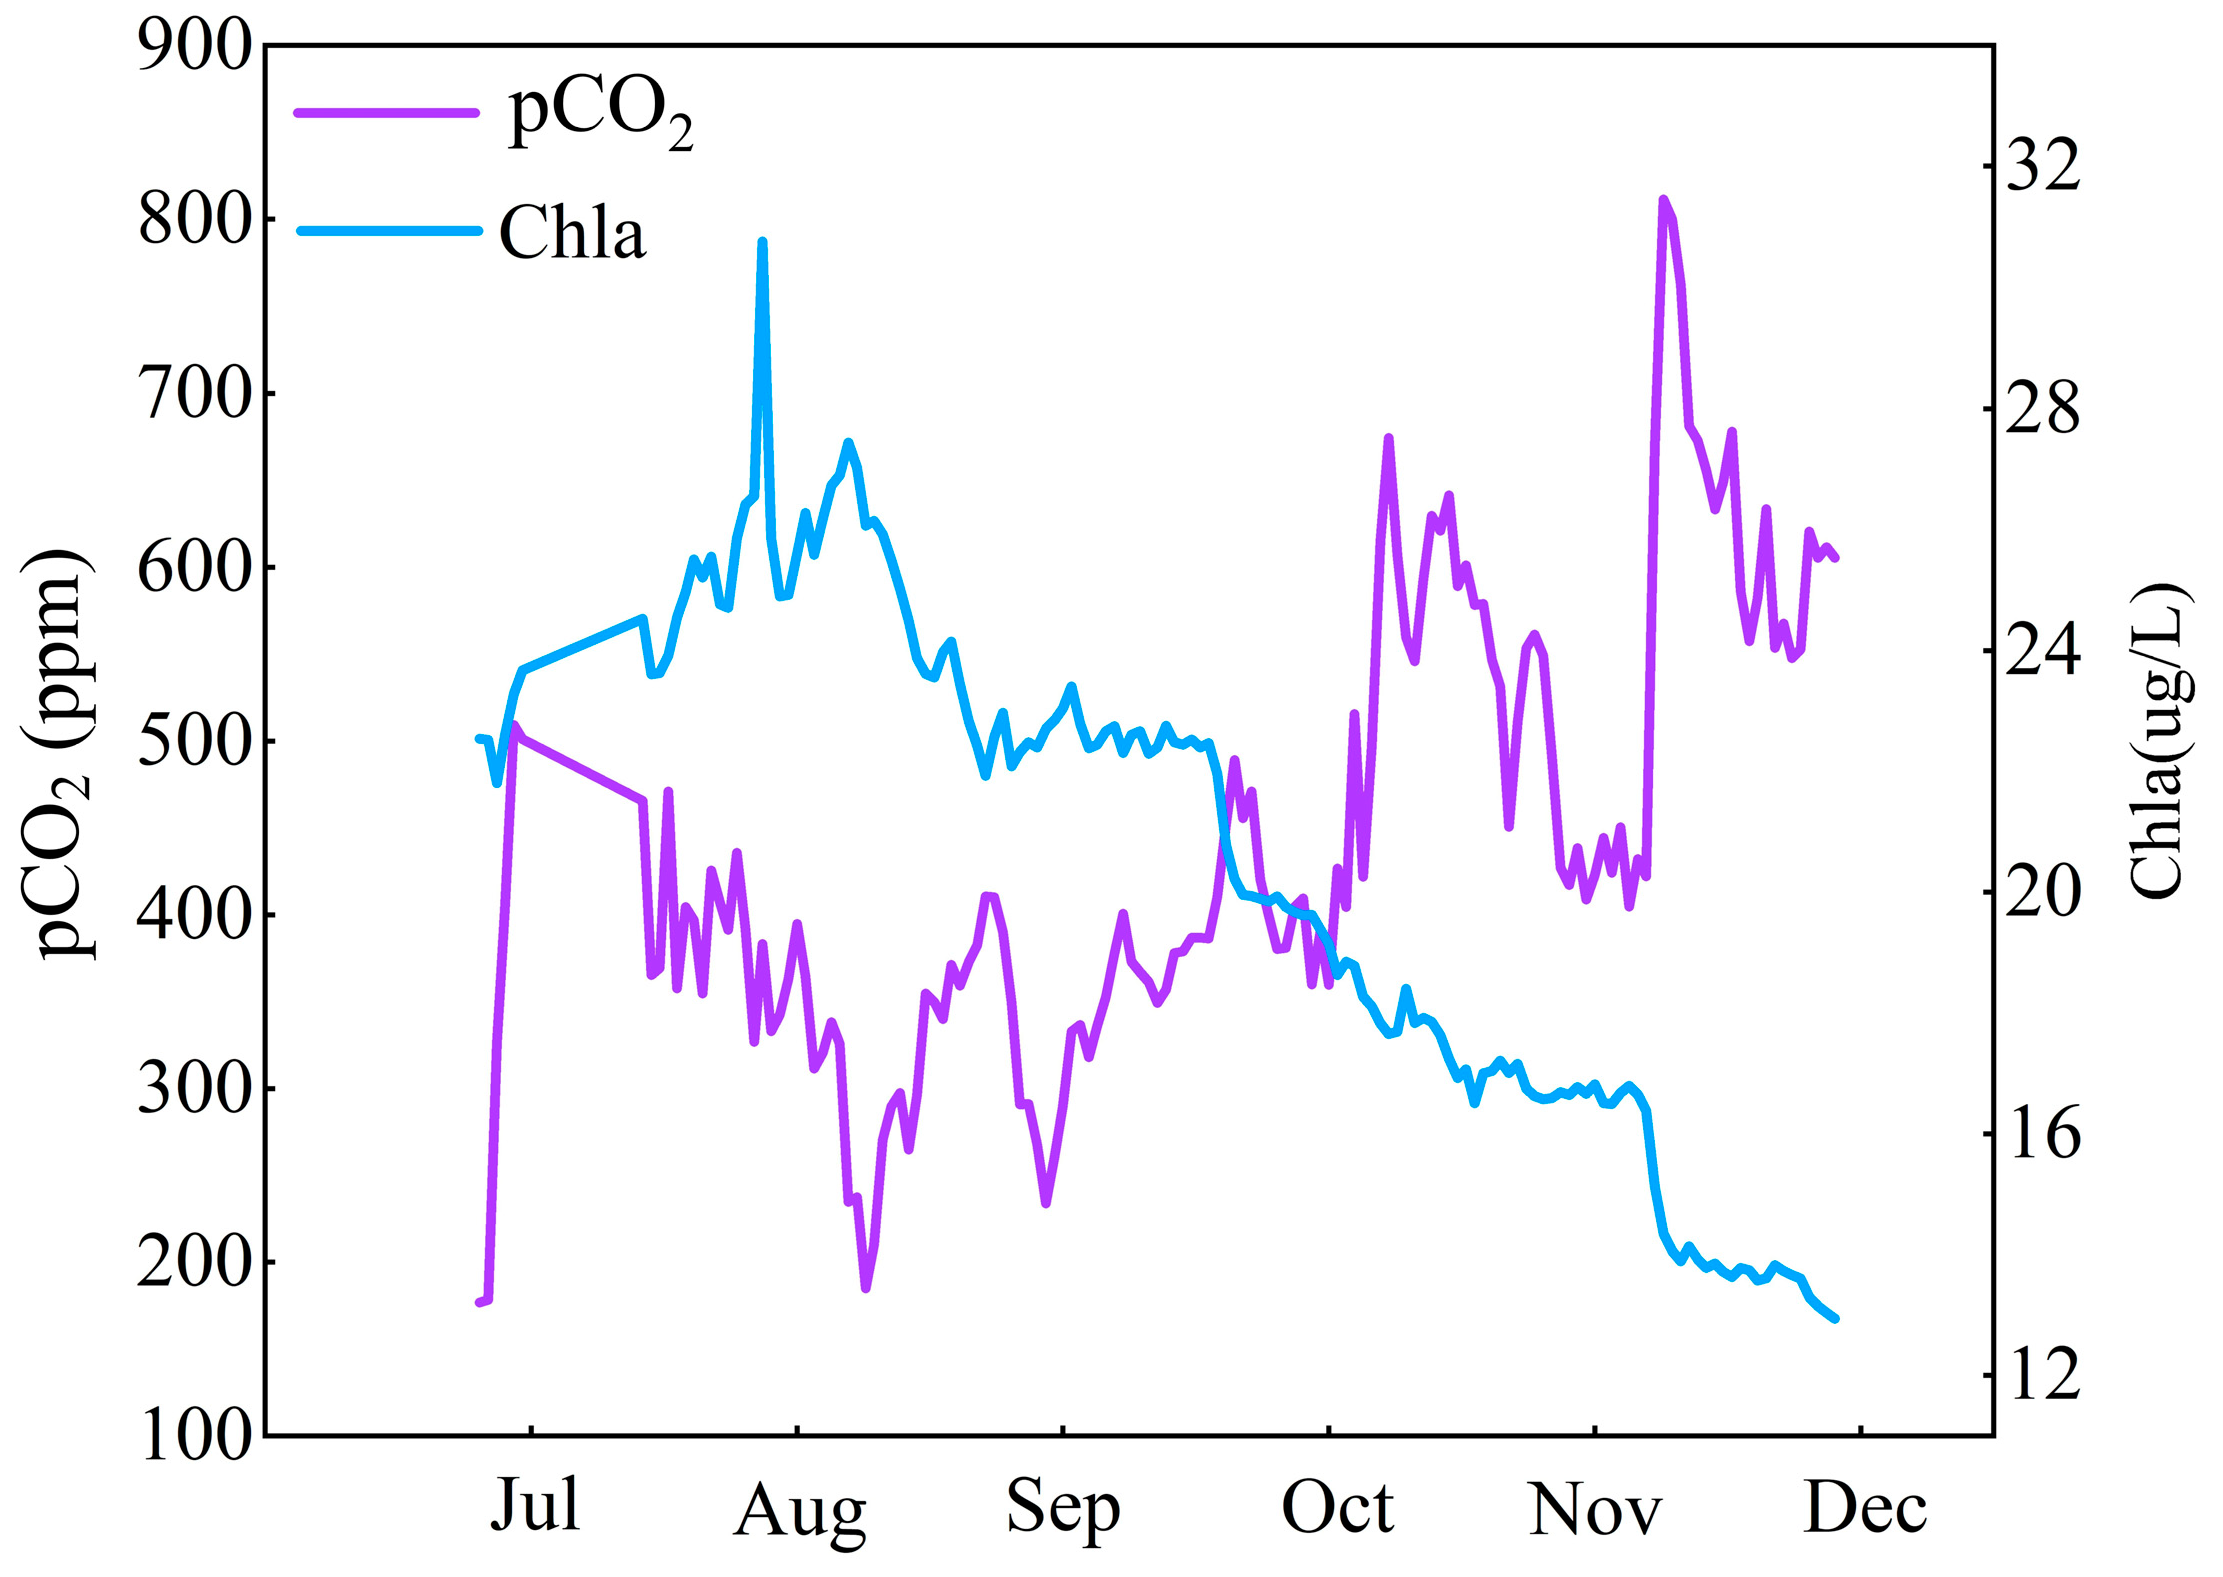
Similarly, we observed an inverse relationship between the pCO2 and chlorophyll-a level in the reservoir (Figure 10). Initially, the pCO2 decreased as the chlorophyll-a content increased, followed by a period in which the pCO2 increased as the chlorophyll-a content decreased. This pattern may be attributed to enhanced photosynthesis in aquatic plants during summer, which is characterized by high temperatures and strong light conditions. During this period, plants absorb significant amounts of CO2, resulting in decreased pCO2 in the water. As autumn approaches, declining water temperatures lead to reduced photosynthetic activity and slower plant growth, consequently causing an increase in the pCO2 in the water.

4. Discussion

4.1. Spatial and Temporal Patterns of pCO2 Along the River–Reservoir Continuum

This study reveals pronounced spatiotemporal heterogeneity in CO2 dynamics across a high-mountain river–reservoir continuum, findings that both align with and extend previous research. Consistent with global assessments, the riverine reaches in our study were generally supersaturated with CO2 and acted as net sources to the atmosphere. This supports the widely accepted view that inland waters—particularly rivers and streams—emit CO2 at magnitudes comparable to major carbon fluxes such as oceanic uptake [6,31,32]. Notably, we found that pCO2 levels were highest in headwater reaches, corroborating earlier observations that high-elevation headwaters, despite their limited spatial extent, may contribute disproportionately to CO2 evasion [33,34]. Together, these patterns confirm that headwater sections in mountainous basins function as important “hotspots” of riverine CO2 outgassing.
Importantly, this study does not focus on a single waterbody type but compares a continuum comprising rivers, a landslide-dammed lake, and a dam reservoir. This design enables a direct examination of how transitions from lotic to lentic conditions reshape CO2 dynamics—an area in which the existing literature remains sparse. We observed that during the summer high-flow period, surface-water pCO2 in the gorge-type reservoir was substantially lower than in the upstream river reaches and in some cases dropped below atmospheric equilibrium, indicating transient CO2-sink behavior in sharp contrast to the persistent source behavior of the river. This sink behavior was closely associated with high aquatic primary productivity within the reservoir, analogous to mechanisms reported for other highly productive lakes and reservoirs. For example, Schindler et al. [14] demonstrated in classic whole-ecosystem experiments that enhanced algal growth can shift lakes from net CO2 sources to net sinks through intensive uptake of dissolved CO2. Similarly, Gu et al. [15] documented unusually low pCO2 in a eutrophic subtropical lake driven by strong photosynthetic activity. Consistent patterns have also been observed in the highly eutrophic Lake Taihu, where eutrophication and temperature-driven increases in phytoplankton biomass and chlorophyll-a cause large variability in surface-water pCO2, with periods of high Chl-a often coinciding with pronounced CO2 undersaturation [35]. Our reservoir observations mirror these patterns: Chl-a concentrations peaked in midsummer, while surface-water pCO2 declined to strongly undersaturated values far below atmospheric levels. Such pronounced undersaturation indicates that phytoplankton blooms during this period consumed CO2 at rates exceeding both external inputs and internal production, thereby transforming the reservoir’s surface waters into a seasonal carbon sink.
This phenomenon is also evident at broader spatial scales. Recent studies of subtropical lakes in China have shown that, under increasing nutrient inputs and catchment vegetation recovery, lakes are exhibiting stronger CO2-sink behavior, contributing to declining CO2 emissions from inland waters [5,16]. Morana et al. [20] likewise reported that many transparent, low-humic African lakes are net autotrophic, with minimal or even negative CO2 efflux to the atmosphere. Our reservoir—characterized by monsoon-driven nutrient delivery and relatively high water transparency—fits well within this high-productivity/low-pCO2 framework. Notably, approximately 55% of our reservoir monitoring days showed pCO2 below atmospheric equilibrium [36], indicating frequent (though intermittent) CO2 uptake and supporting the view that reservoirs can act as carbon sinks during certain periods, contrary to the common assumption that reservoirs are generally greenhouse-gas sources. Although reservoirs are indeed major global sources of CO2 [37], our findings demonstrate that a eutrophic gorge reservoir embedded within a relatively oligotrophic, high-mountain setting can break this “source” paradigm during seasons of intense photosynthesis by reducing CO2 efflux through strong biological uptake. This complex and context-dependent behavior underscores the novelty of our study. By directly comparing free-flowing river reaches, a natural landslide-dammed lake and a constructed reservoir along the same mountainous river system, we demonstrate that impoundment can, under specific hydrological and biogeochemical conditions, substantially reduce pCO2 and CO2 evasion relative to unregulated river reaches. This aligns with evidence from some temperate systems—for example, Yan et al. [38] reported that several reservoirs in the Seine River basin markedly lowered downstream riverine pCO2, likely due to carbon sedimentation and biological assimilation within the reservoirs. Similarly, at the national scale, the widespread conversion of rivers to reservoirs in China in recent decades has been implicated in declining CO2 emissions from inland waters [5]. Our study provides mechanistic support for these large-scale observations, illustrating how reservoir formation—even in the case of landslide-dammed natural lakes—can partially mitigate CO2 emissions by creating conditions favorable for carbon assimilation.

4.2. Controls on pCO2 Distributions

To elucidate the drivers underlying the observed spatial patterns, we employed correlation analysis and multiple regression to examine relationships between pCO2 and a suite of environmental variables in both riverine and reservoir settings. It is important to note that these analyses are based on observational data and therefore reveal statistical associations rather than strict causal relationships.
For the river reaches, Pearson correlations between pCO2 and atmospheric pressure, water temperature, pH, DO, and Chl-a were generally weak to moderate, and the multiple linear regression model explained only about 20% of the variance in pCO2 (adjusted R2 ≈ 0.20), with none of the partial regression coefficients significant at the 0.05 level. This outcome partly reflects collinearity among variables such as temperature, pressure, and DO, and also indicates that, at the spatial and temporal resolution of this study, no single in-stream variable exerts an independently dominant control on riverine pCO2. Accordingly, we interpret the correlation analyses primarily as exploratory tools that may suggest potential environmental controls rather than as evidence of direct causation.
Nevertheless, several broad patterns are biogeochemically and physically reasonable. In the upstream reaches, the negative correlation between pCO2 and atmospheric pressure (R2 = 0.14; Figure S1) reflects an elevation-gradient effect: lower atmospheric pressure at high altitudes slightly enhances the potential for CO2 efflux to the atmosphere. However, contrary to the simple expectation that lower pressure should correspond to lower dissolved CO2, our upstream sites exhibited higher pCO2 under low-pressure conditions. This apparent “paradox” can be explained by the dominance of strong allochthonous CO2 inputs in shaping upstream carbon budgets. Mountain headwaters typically receive substantial CO2-rich groundwater and runoff from surrounding soils and wetlands [39]. We infer that soil respiration—and possibly carbonate weathering—delivers large amounts of dissolved CO2 to these reaches, elevating pCO2 and masking the physical effect of pressure on gas exchange. Similar mechanisms have been widely documented; for instance, studies of Alpine mountain streams have shown that a substantial portion of CO2 emissions originates from groundwater and lithologic sources within the catchment [26]. Our results are consistent with the broader conclusion that watershed-derived dissolved carbon inputs enhance aquatic respiration and CO2 production. Fundamentally, the primary control on upstream pCO2 appears to be the magnitude of soil-carbon delivery to the river [40,41]—a conclusion closely aligned with the view of Hotchkiss et al. [33] and others that “catchment respiration is the dominant source of stream CO2.”
In the river reaches, the correlation between pCO2 and DO was weak and statistically insignificant, consistent with the strong air–water gas exchange and the tendency of DO to approach atmospheric equilibrium under highly turbulent conditions. Locally, slightly lower DO in high-pCO2 segments may still indicate elevated heterotrophic respiration [42,43], but the multiple regression results suggest that such signals are easily obscured at our observational scales by concurrent variation in temperature, discharge, and catchment inputs. Overall, CO2 dynamics in rivers are better understood as the coupled outcome of physical factors (e.g., atmospheric pressure, channel slope, turbulence) that facilitate CO2 evasion and biogeochemical factors (e.g., allochthonous carbon inputs, in-stream metabolism) that replenish CO2, rather than as a system controlled by any single environmental driver.
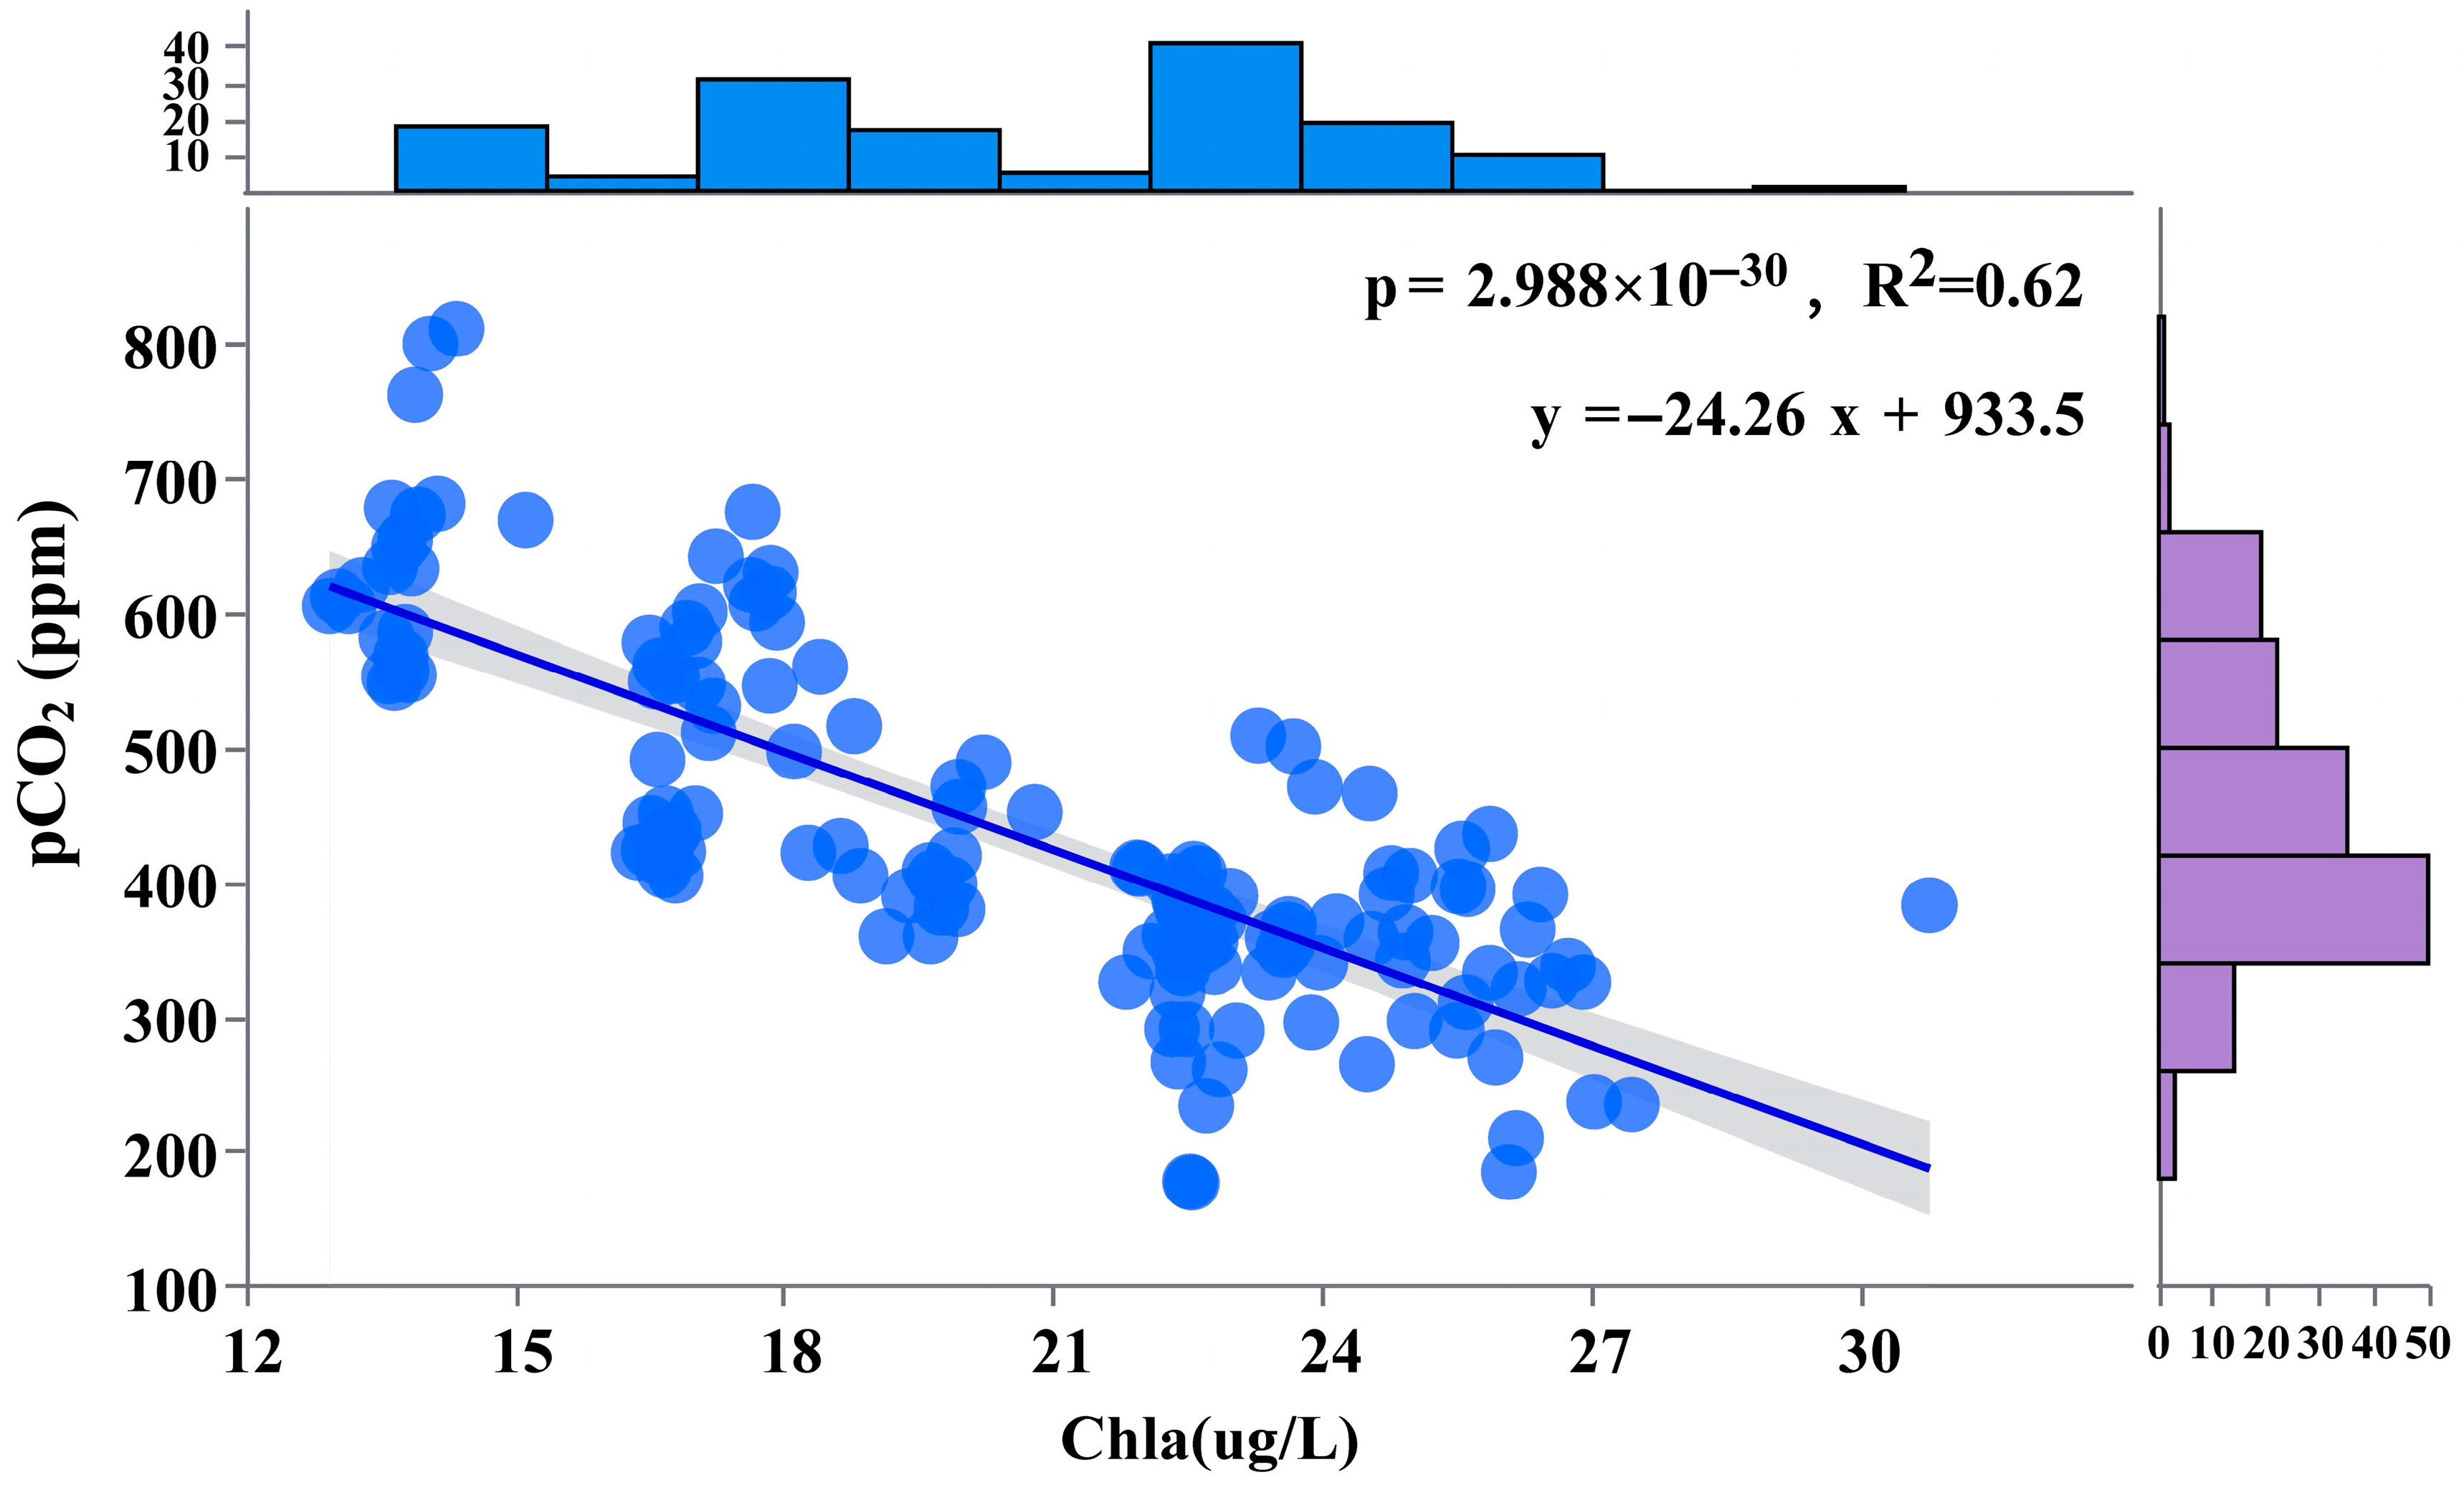
In contrast, the seasonal dynamics of CO2 in the reservoir exhibited clearer and more quantifiable environmental controls. Chl-a concentrations showed a strong negative relationship with pCO2 (linear regression: R2 = 0.62, p < 0.001, Figure 11), indicating that higher phytoplankton biomass coincided with lower pCO2 and supporting the role of photosynthetic CO2 uptake in modulating aquatic CO2 dynamics. Multiple linear regression further demonstrated that, after accounting for collinearity, water level, Chl-a, and DO were the key predictors of reservoir pCO2, jointly explaining ~68% of the variance in daily mean pCO2. Among them, Chl-a had the largest standardized partial regression coefficient (β ≈ −0.87, p < 0.001), indicating that variations in phytoplankton biomass exerted the strongest independent influence on pCO2; DO also showed a significant negative effect, whereas water level had a significant positive effect. After including these predictors, pH no longer had independent explanatory power, consistent with its tight coupling to pCO2 through carbonate equilibria.
Mechanistically, water-level fluctuations represent a central physical driver of reservoir CO2 dynamics. On one hand, rising water levels inundate a larger littoral zone, increasing the supply of organic substrates whose microbial decomposition produces CO2. On the other hand, deepened water columns and expanded surface areas frequently promote thermal stratification, allowing decomposition-derived CO2 to accumulate in deeper layers and delaying its release to the atmosphere [44,45,46]. This pattern has also been observed in tropical reservoirs—for example, in the Petit Saut Reservoir in French Guiana, water-level management strongly influences CO2 build-up and release [47]; Yan et al. [38] likewise reported that reservoir drawdown enhances downstream CO2 evasion, implying that high-water periods promote CO2 storage within the reservoir, which is subsequently “flushed” downstream as water levels fall. Thus, water level regulates both the spatial extent of inundated carbon sources and the timing of CO2 release, jointly controlling CO2 export from reservoirs [48].
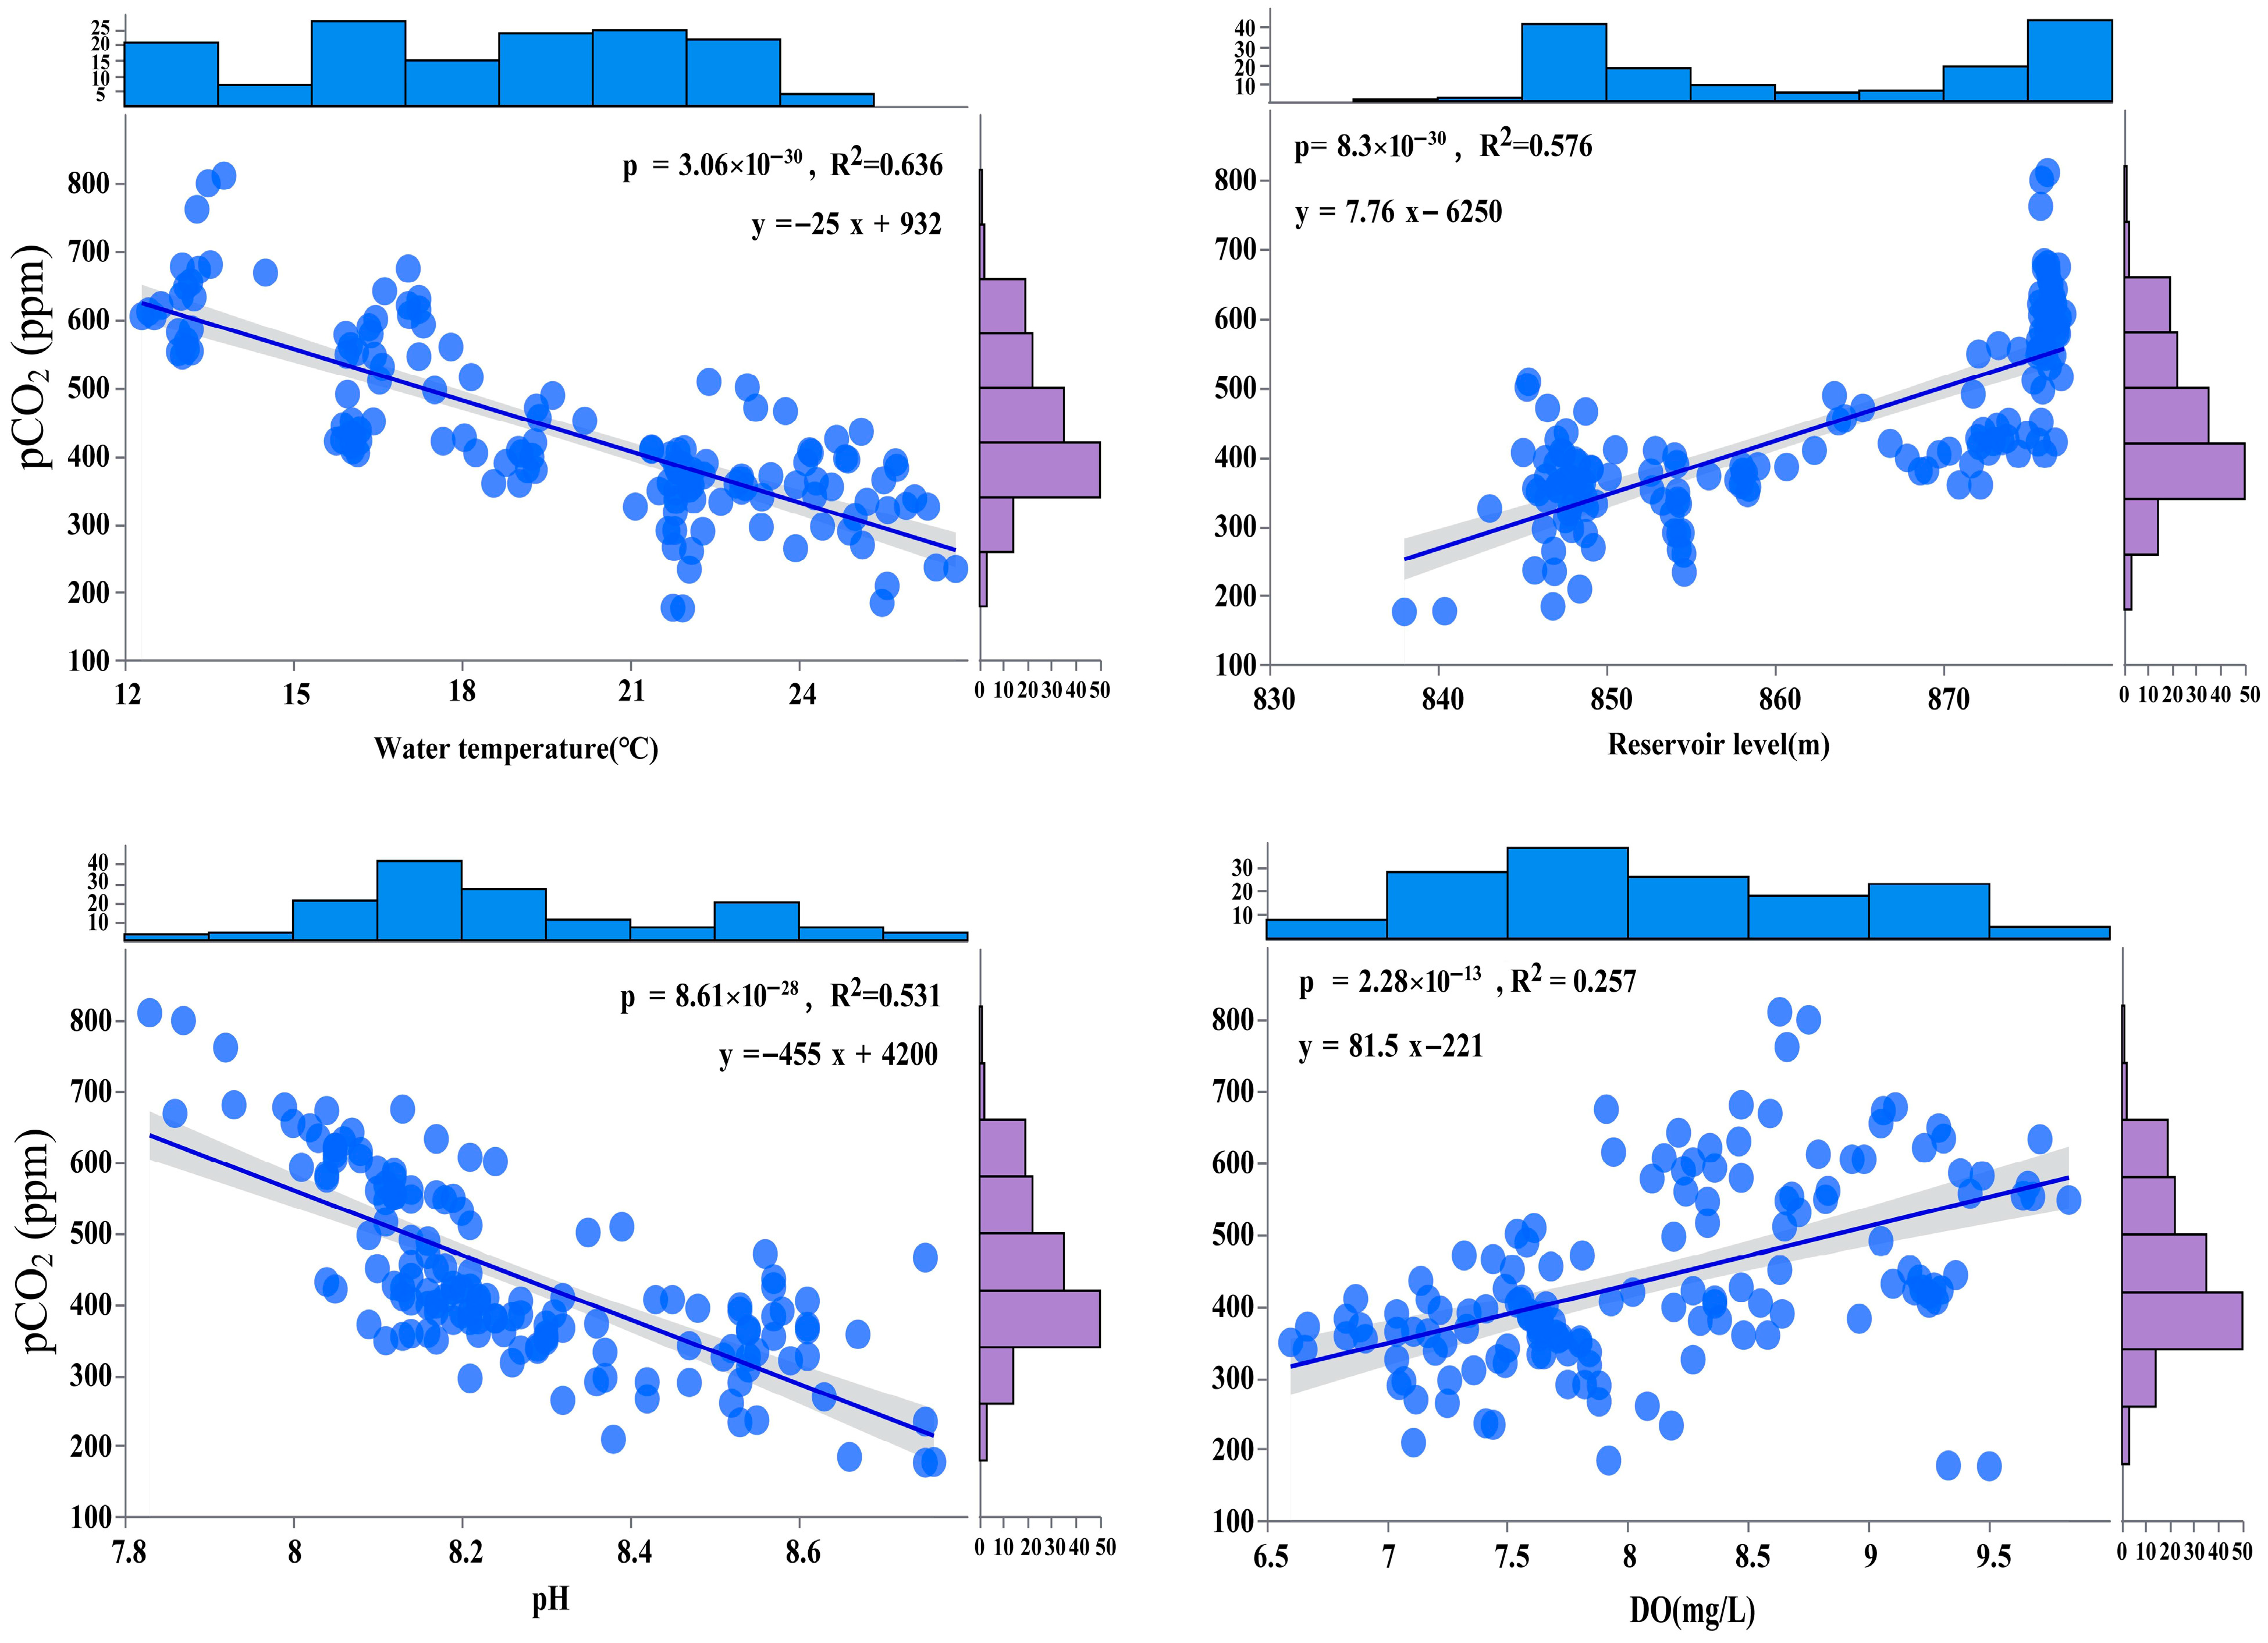
Water temperature influences pCO2 through both physical solubility effects and biological metabolic processes [49]. In our reservoir, water temperature showed a strong negative correlation with pCO2 (R2 ≈ 0.64): pCO2 was lower during the warm summer months and increased as temperatures declined in winter. Physically, cooler water holds more dissolved CO2; thus, declining temperatures enhance the capacity of the water column to retain CO2, while reduced gas-exchange efficiency and weaker turbulence in cold, stratified conditions further promote CO2 accumulation [50,51,52]; Biologically, low temperatures suppress phytoplankton photosynthesis and community metabolism, diminishing the strong summertime CO2 drawdown and allowing heterotrophically produced CO2 to accumulate [53,54]. Our multiple regression results indicate that, after controlling for water level and Chl-a, the independent effect of water temperature is relatively small, suggesting that temperature acts primarily through its influence on stratification and primary production.
Biological processes also play a central role in the reservoir carbon cycle. Chl-a concentrations were strongly negatively correlated with pCO2 (R2 ≈ 0.62), meaning that periods of high phytoplankton biomass corresponded to lower CO2 levels, underscoring the regulatory effect of photosynthesis on aquatic carbon dynamics. During the early monsoon season, when temperatures are high, irradiance is strong, and nutrients are abundant, phytoplankton proliferated rapidly (Figure 2), with Chl-a reaching ~30 µg·L−1. At this time, peak algal biomass coincided with some of the lowest pCO2 values of the year (~150 ppm), far below atmospheric equilibrium, indicating intense biological CO2 uptake. Similar inverse relationships between Chl-a and pCO2 are widely documented in productive lakes—for example, Borges et al. [17]. showed that eutrophication can shift lakes from CO2 sources to CO2 sinks. Our findings consistently demonstrate that phytoplankton growth substantially reduces reservoir CO2 supersaturation and can even drive net CO2 uptake (undersaturation) during summer. As algal biomass declines in autumn and winter (with decreasing Chl-a), photosynthetic CO2 consumption diminishes, allowing pCO2 to rebound and the water body to revert to a net CO2 source. This seasonal alternation reflects the well-known mechanism of “autotrophic suppression of CO2 evasion” and aligns with previous work. Furthermore, the reservoir’s transition to a net-autotrophic state during summer is facilitated by its long hydraulic residence time and stable stratification [55,56,57]—conditions that do not occur in high-velocity river channels. Consequently, the reservoir functions as a biogeochemical “filter” along the river continuum: it reduces CO2 emissions during the productive warm season, while cold-season retention may enhance CO2 accumulation and subsequent release during drawdown [7,58,59].
DO exhibited a more complex pattern within the reservoir. At the seasonal scale, simple correlations showed a moderate positive association between DO and pCO2, largely driven by temperature and stratification—cold water simultaneously has higher O2 and CO2 solubility. However, in the multiple regression analysis, after controlling for water level and Chl-a, the partial regression coefficient for DO became significantly negative, indicating that under similar hydrological and productivity conditions, periods of higher DO tended to coincide with lower pCO2. This is consistent with the metabolic signature of autotrophic dominance: high O2 and low CO2. Reservoir pH was also strongly negatively correlated with pCO2 (R2 ≈ 0.53, Figure 12): elevated pCO2 coincided with lower pH due to CO2 enrichment, whereas phytoplankton CO2 uptake shifted the carbonate equilibrium and raised pH [60,61]. During summer algal blooms, intensive CO2 removal increased pH by ~0.5 units, whereas wintertime CO2 accumulation lowered pH. Such patterns are consistent with carbonate-buffering principles and have been observed in other algal-rich lakes—for example, Xiao et al. [18] documented substantial pH increases in Lake Taihu during periods of strong algal CO2 uptake. Taken together, the multiple regression analyses indicate that hydrodynamic processes (water-level fluctuations and associated inundation and stratification), physical factors (temperature and gas solubility), and biological processes (phytoplankton production and respiration) jointly shape the seasonal evolution of pCO2 in the reservoir. During warm, well-lit, nutrient-rich periods with elevated water levels, the reservoir can shift into a predominantly autotrophic state that acts as a temporary CO2 sink with low pCO2. In contrast, during the cold season, low temperatures, high solubility, and long residence times facilitate CO2 accumulation, causing the reservoir to revert to a CO2 source. Compared with upstream free-flowing reaches, this multi-factor “filtering effect” highlights the capacity of reservoirs to suppress riverine CO2 emissions during warm seasons while potentially enhancing CO2 retention and downstream export during colder months.

4.3. Implications, Limitations, and Future Directions

This study provides important insights into the understanding and management of carbon cycling in mountain rivers subjected to natural or artificial impoundment. Our results show that CO2 dynamics in high-relief river systems undergo substantial shifts across the transition from lotic to lentic environments, with significant implications for regional carbon budgets. This finding aligns with the recent decline in CO2 emissions reported for inland waters in China and suggests that reservoirs, under specific environmental conditions, may mitigate rather than enhance greenhouse-gas emissions.
From a management perspective, identifying the conditions under which reservoirs act as CO2 sinks has practical value for optimizing operational strategies. Maintaining high and stable water levels and limiting external organic loading during the growing season may prolong periods of CO2 uptake. Conversely, during cold or low-flow seasons, long residence times and thermal stratification favor the accumulation of CO2 and CH4; thus, reservoir operation—such as selective withdrawal from deeper layers or enhanced mixing and aeration—may need to be adjusted to reduce potential emission risks. These considerations are particularly relevant for gorge-type mountain reservoirs, whose pronounced seasonal stratification and productivity cycles produce highly dynamic source–sink behavior.
Several limitations of this study should be acknowledged. The monitoring period did not span a full annual cycle; CH4 and other key greenhouse gases were not measured concurrently; and spatial sampling resolution was insufficient to identify potential biogeochemical hotspots. Future work should incorporate year-round, multi-year observations and integrate CO2 and CH4 flux measurements to obtain a more comprehensive assessment of net greenhouse forcing. In addition, combining high-resolution underway surveys with coupled eco-hydrodynamic modeling would help elucidate reservoir carbon-emission responses under alternative operational regimes and climate scenarios.

5. Conclusions

Along a river–barrier lake–reservoir continuum in the upper Minjiang River, we compared pCO2 dynamics under contrasting lotic and lentic conditions and evaluated the effects of impoundment on carbon cycling in a high-mountain gorge. (1) Strong spatial and seasonal gradients of pCO2. All river reaches were supersaturated with CO2 throughout the study, with the highest pCO2 in the upstream headwaters. Mean pCO2 reached 521 µatm in the wet season and 421 ppm in the dry season, indicating a persistent atmospheric CO2 source. In contrast, the downstream canyon-type reservoir exhibited a clear seasonal reversal: during the wet season, surface-water pCO2 averaged 395 ppm and more than half of the observations were below the atmospheric level (~419 ppm), whereas in the dry season mean pCO2 rose to 563 ppm and the reservoir reverted to a CO2 source. (2) Different controlling factors in river and reservoir segments. For the river, a multiple regression model using atmospheric pressure, water temperature, pH, dissolved oxygen and chlorophyll-a explained only about 20% of the variance in pCO2 and yielded no significant independent predictor, implying that catchment carbon inputs and elevation-related processes collectively maintain CO2 supersaturation. For the reservoir, multivariate analysis showed that water level (positive effect) and chlorophyll-a and dissolved oxygen (negative effects) together explained ~68% of the variance in pCO2, and that summer algal blooms could lower pCO2 to ~150 ppm and temporarily shift the system to net autotrophy. (3) Implications for carbon balance. Impoundment-induced lentic conditions therefore amplify seasonal contrasts in carbon balance: reservoirs can act as temporary CO2 sinks under warm, productive conditions but accumulate CO2 during cold, low-productivity periods. Under suitable conditions, such reservoirs do not inevitably increase greenhouse-gas emissions and may intermittently reduce riverine CO2 outgassing in mountainous basins.

Supplementary Materials

The following supporting information can be downloaded at: https://www.mdpi.com/article/10.3390/w18010012/s1, Figure S1: Relationship between pCO₂ and atmospheric pressure in the mainstream of the upper reaches of the Minjiang River. Figure S2: Relationship between pCO₂ and dissolved oxygen in the mainstream of the upper reaches of the Minjiang River.

Author Contributions

Conceptualization, L.Z. and Y.L.; Visualization, L.Z. and Z.W. Formal analysis, L.Z.; Writing—Original Draft, L.Z.; Writing—Review and Editing, L.Z. and Y.L.; Investigation, Z.W., H.W., X.Y. and B.S.; Resources, Z.W. and H.W.; Funding acquisition, Y.L.; Project administration, Y.L. All authors have read and agreed to the published version of the manuscript.

Funding

This paper was financially supported by the National Key Science and Technology Program (2022YFC3202403).

Data Availability Statement

The original contributions presented in this study are included in the article. Further inquiries can be directed to the corresponding author.

Conflicts of Interest

Author Hongwei Wang was employed by the company Sichuan Province Zipingpu Development Corporation Limited. The remaining authors declare that the research was conducted in the absence of any commercial or financial relationships that could be construed as a potential conflict of interest.

References

  1. Friedlingstein, P.; Bopp, L.; Ciais, P.; Dufresne, J.; Fairhead, L.; LeTreut, H.; Monfray, P.; Orr, J. Positive Feedback between Future Climate Change and the Carbon Cycle. Geophys. Res. Lett. 2001, 28, 1543–1546. [Google Scholar] [CrossRef] [Scilit]
  2. Raymond, P.A.; Hartmann, J.; Lauerwald, R.; Sobek, S.; McDonald, C.; Hoover, M.; Butman, D.; Striegl, R.; Mayorga, E.; Humborg, C.; et al. Global Carbon Dioxide Emissions from Inland Waters. Nature 2013, 503, 355–359. [Google Scholar] [CrossRef] [Scilit] [PubMed]
  3. Regnier, P.; Friedlingstein, P.; Ciais, P.; Mackenzie, F.T.; Gruber, N.; Janssens, I.A.; Laruelle, G.G.; Lauerwald, R.; Luyssaert, S.; Andersson, A.J.; et al. Anthropogenic Perturbation of the Carbon Fluxes from Land to Ocean. Nat. Geosci. 2013, 6, 597–607. [Google Scholar] [CrossRef] [Scilit]
  4. Tranvik, L.J.; Cole, J.J.; Prairie, Y.T. The Study of Carbon in Inland Waters—From Isolated Ecosystems to Players in the Global Carbon Cycle. Limnol. Ocean. Lett. 2018, 3, 41–48. [Google Scholar] [CrossRef] [Scilit]
  5. Ran, L.; Butman, D.E.; Battin, T.J.; Yang, X.; Tian, M.; Duvert, C.; Hartmann, J.; Geeraert, N.; Liu, S. Substantial Decrease in CO2 Emissions from Chinese Inland Waters Due to Global Change. Nat. Commun. 2021, 12, 1730. [Google Scholar] [CrossRef] [Scilit] [PubMed]
  6. Cole, J.J.; Prairie, Y.T.; Caraco, N.F.; McDowell, W.H.; Tranvik, L.J.; Striegl, R.G.; Duarte, C.M.; Kortelainen, P.; Downing, J.A.; Middelburg, J.J.; et al. Plumbing the Global Carbon Cycle: Integrating Inland Waters into the Terrestrial Carbon Budget. Ecosystems 2007, 10, 172–185. [Google Scholar] [CrossRef] [Scilit]
  7. Maavara, T.; Chen, Q.; Van Meter, K.; Brown, L.E.; Zhang, J.; Ni, J.; Zarfl, C. River Dam Impacts on Biogeochemical Cycling. Nat. Rev. Earth Environ. 2020, 1, 103–116. [Google Scholar] [CrossRef] [Scilit]
  8. Chen, S. Agricultural Land Use Changes Stream Dissolved Organic Matter via Altering Soil Inputs to Streams. Sci. Total Environ. 2021, 796, 148968. [Google Scholar] [CrossRef] [Scilit]
  9. Gong, C.; Yan, W.; Zhang, P.; Yu, Q.; Li, Y.; Li, X.; Wang, D.; Jiao, R. Effects of Stream Ecosystem Metabolisms on CO2 Emissions in Two Headwater Catchments, Southeastern China. Ecol. Indic. 2021, 130, 108136. [Google Scholar] [CrossRef] [Scilit]
  10. Keller, P.S.; Catalán, N.; Von Schiller, D.; Grossart, H.-P.; Koschorreck, M.; Obrador, B.; Frassl, M.A.; Karakaya, N.; Barros, N.; Howitt, J.A.; et al. Global CO2 Emissions from Dry Inland Waters Share Common Drivers across Ecosystems. Nat. Commun. 2020, 11, 2126. [Google Scholar] [CrossRef] [Scilit] [PubMed]
  11. Crawford, J.T.; Loken, L.C.; Stanley, E.H.; Stets, E.G.; Dornblaser, M.M.; Striegl, R.G. Basin Scale Controls on CO2 and CH4 Emissions from the Upper Mississippi River. Geophys. Res. Lett. 2016, 43, 1973–1979. [Google Scholar] [CrossRef] [Scilit]
  12. Liu, B.; Wang, Z.; Tian, M.; Yang, X.; Chan, C.N.; Chen, S.; Yang, Q.; Ran, L. Basin-Scale CO2 Emissions from the East River in South China: Importance of Small Rivers, Human Impacts and Monsoons. JGR Biogeosciences 2023, 128, e2022JG007291. [Google Scholar] [CrossRef] [Scilit]
  13. Liu, J.; Han, G. Controlling Factors of Seasonal and Spatial Variation of Riverine CO2 Partial Pressure and Its Implication for Riverine Carbon Flux. Sci. Total Environ. 2021, 786, 147332. [Google Scholar] [CrossRef] [Scilit]
  14. Schindler, D.E.; Carpenter, S.R.; Cole, J.J.; Kitchell, J.F.; Pace, M.L. Influence of Food Web Structure on Carbon Exchange Between Lakes and the Atmosphere. Science 1997, 277, 248–251. [Google Scholar] [CrossRef] [Scilit]
  15. Gu, B.; Schelske, C.L.; Coveney, M.F. Low Carbon Dioxide Partial Pressure in a Productive Subtropical Lake. Aquat. Sci. 2011, 73, 317–330. [Google Scholar] [CrossRef] [Scilit]
  16. Xiao, Q.; Xu, X.; Qi, T.; Luo, J.; Lee, X.; Duan, H. Lakes Shifted from a Carbon Dioxide Source to a Sink over Past Two Decades in China. Sci. Bull. 2024, 69, 1857–1861. [Google Scholar] [CrossRef] [Scilit]
  17. Pacheco, F.; Roland, F.; Downing, J. Eutrophication Reverses Whole-Lake Carbon Budgets. Inland Waters 2014, 4, 41–48. [Google Scholar] [CrossRef] [Scilit]
  18. Xiao, Q.; Xu, X.; Duan, H.; Qi, T.; Qin, B.; Lee, X.; Hu, Z.; Wang, W.; Xiao, W.; Zhang, M. Eutrophic Lake Taihu as a Significant CO2 Source during 2000–2015. Water Res. 2020, 170, 115331. [Google Scholar] [CrossRef] [Scilit] [PubMed]
  19. Grasset, C.; Sobek, S.; Scharnweber, K.; Moras, S.; Villwock, H.; Andersson, S.; Hiller, C.; Nydahl, A.C.; Chaguaceda, F.; Colom, W.; et al. The CO2-equivalent Balance of Freshwater Ecosystems Is Non-linearly Related to Productivity. Glob. Change Biol. 2020, 26, 5705–5715. [Google Scholar] [CrossRef] [Scilit]
  20. Morana, C.; Borges, A.V.; Deirmendjian, L.; Okello, W.; Sarmento, H.; Descy, J.-P.; Kimirei, I.A.; Bouillon, S. Prevalence of Autotrophy in Non-Humic African Lakes. Ecosystems 2023, 26, 627–642. [Google Scholar] [CrossRef] [Scilit]
  21. Teodoru, C.R.; Del Giorgio, P.A.; Prairie, Y.T.; Camire, M. Patterns in pCO2 in Boreal Streams and Rivers of Northern Quebec, Canada. Glob. Biogeochem. Cycles 2009, 23, 2008GB003404. [Google Scholar] [CrossRef] [Scilit]
  22. Dubois, K.D.; Lee, D.; Veizer, J. Isotopic Constraints on Alkalinity, Dissolved Organic Carbon, and Atmospheric Carbon Dioxide Fluxes in the Mississippi River. J. Geophys. Res. 2010, 115, 2009JG001102. [Google Scholar] [CrossRef] [Scilit]
  23. Call, M.; Maher, D.T.; Santos, I.R.; Ruiz-Halpern, S.; Mangion, P.; Sanders, C.J.; Erler, D.V.; Oakes, J.M.; Rosentreter, J.; Murray, R.; et al. Spatial and Temporal Variability of Carbon Dioxide and Methane Fluxes over Semi-Diurnal and Spring–Neap–Spring Timescales in a Mangrove Creek. Geochim. Cosmochim. Acta 2015, 150, 211–225. [Google Scholar] [CrossRef] [Scilit]
  24. Wang, X.; He, Y.; Yuan, X.; Chen, H.; Peng, C.; Zhu, Q.; Yue, J.; Ren, H.; Deng, W.; Liu, H. PCO2 and CO2 Fluxes of the Metropolitan River Network in Relation to the Urbanization of Chongqing, China. JGR Biogeosciences 2017, 122, 470–486. [Google Scholar] [CrossRef] [Scilit]
  25. Deemer, B.R.; Harrison, J.A.; Li, S.; Beaulieu, J.J.; DelSontro, T.; Barros, N.; Bezerra-Neto, J.F.; Powers, S.M.; dos Santos, M.A.; Vonk, J.A. Greenhouse Gas Emissions from Reservoir Water Surfaces: A New Global Synthesis. BioScience 2016, 66, 949–964. [Google Scholar] [CrossRef] [Scilit]
  26. Horgby, Å.; Segatto, P.L.; Bertuzzo, E.; Lauerwald, R.; Lehner, B.; Ulseth, A.J.; Vennemann, T.W.; Battin, T.J. Unexpected Large Evasion Fluxes of Carbon Dioxide from Turbulent Streams Draining the World’s Mountains. Nat. Commun. 2019, 10, 4888. [Google Scholar] [CrossRef] [Scilit]
  27. Tan, Y.; Zhao, W.; Li, J.; Li, Y.; Yang, B.; Zhu, L.; Tuo, Y. Spatiotemporal Distribution of pCO2 and CO2 Flux and the Regulatory Factors: From the Perspective of a Subtropical Canyon-Shaped Reservoir, Southwest China. Water Res. 2024, 267, 122558. [Google Scholar] [CrossRef] [Scilit] [PubMed]
  28. Wu, Z.; Yu, D.; Yu, Q.; Liu, Q.; Zhang, M.; Dahlgren, R.A.; Middelburg, J.J.; Qu, L.; Li, Q.; Guo, W.; et al. Greenhouse Gas Emissions (CO2–CH4–N2O) along a Large Reservoir-downstream River Continuum: The Role of Seasonal Hypoxia. Limnol. Oceanogr. 2024, 69, 1015–1029. [Google Scholar] [CrossRef] [Scilit]
  29. Tremblay, A. (Ed.) Greenhouse Gas Emissions—Fluxes and Processes: Hydroelectric Reservoirs and Natural Environments; Environmental science; Springer: Berlin, Germany; New York, NY, USA, 2005; ISBN 978-3-540-23455-5. [Google Scholar]
  30. Horgby, Å.; Boix Canadell, M.; Ulseth, A.J.; Vennemann, T.W.; Battin, T.J. High-Resolution Spatial Sampling Identifies Groundwater as Driver of CO2 Dynamics in an Alpine Stream Network. JGR Biogeosciences 2019, 124, 1961–1976. [Google Scholar] [CrossRef] [Scilit]
  31. Gao, Y.; Li, J.; Wang, S.; Jia, J.; Wu, F.; Yu, G. Global Inland Water Greenhouse Gas (GHG) Geographical Patterns and Escape Mechanisms under Different Water Level. Water Res. 2025, 269, 122808. [Google Scholar] [CrossRef] [Scilit]
  32. Yang, Q.; Chen, S.; Li, Y.; Liu, B.; Ran, L. Carbon Emissions from Chinese Inland Waters: Current Progress and Future Challenges. JGR Biogeosciences 2024, 129, e2023JG007675. [Google Scholar] [CrossRef] [Scilit]
  33. Hotchkiss, E.R.; Hall, R.O., Jr.; Sponseller, R.A.; Butman, D.; Klaminder, J.; Laudon, H.; Rosvall, M.; Karlsson, J. Sources of and Processes Controlling CO2 Emissions Change with the Size of Streams and Rivers. Nat. Geosci. 2015, 8, 696–699. [Google Scholar] [CrossRef] [Scilit]
  34. Clow, D.W.; Striegl, R.G.; Dornblaser, M.M. Spatiotemporal Dynamics of CO2 Gas Exchange from Headwater Mountain Streams. JGR Biogeosciences 2021, 126, e2021JG006509. [Google Scholar] [CrossRef] [Scilit]
  35. Xiao, Q.; Duan, H.; Qin, B.; Hu, Z.; Zhang, M.; Qi, T.; Lee, X. Eutrophication and Temperature Drive Large Variability in Carbon Dioxide from China’s Lake Taihu. Limnol. Oceanogr. 2022, 67, 379–391. [Google Scholar] [CrossRef] [Scilit]
  36. Friedlingstein, P.; O’Sullivan, M.; Jones, M.W.; Andrew, R.M.; Bakker, D.C.E.; Hauck, J.; Landschützer, P.; Le Quéré, C.; Luijkx, I.T.; Peters, G.P.; et al. Global Carbon Budget 2023. Earth Syst. Sci. Data 2023, 15, 5301–5369. [Google Scholar] [CrossRef] [Scilit]
  37. Soued, C.; Harrison, J.A.; Mercier-Blais, S.; Prairie, Y.T. Reservoir CO2 and CH4 Emissions and Their Climate Impact over the Period 1900–2060. Nat. Geosci. 2022, 15, 700–705. [Google Scholar] [CrossRef] [Scilit]
  38. Yan, X.; Thieu, V.; Wu, S.; Garnier, J. Reservoirs Change pCO2 and Water Quality of Downstream Rivers: Evidence from Three Reservoirs in the Seine Basin. Water Res. 2022, 213, 118158. [Google Scholar] [CrossRef] [Scilit] [PubMed]
  39. Marx, A.; Dusek, J.; Jankovec, J.; Sanda, M.; Vogel, T.; Van Geldern, R.; Hartmann, J.; Barth, J.A.C. A Review of CO2 and Associated Carbon Dynamics in Headwater Streams: A Global Perspective. Rev. Geophys. 2017, 55, 560–585. [Google Scholar] [CrossRef] [Scilit]
  40. Campeau, A.; Bishop, K.; Nilsson, M.B.; Klemedtsson, L.; Laudon, H.; Leith, F.I.; Öquist, M.; Wallin, M.B. Stable Carbon Isotopes Reveal Soil-Stream DIC Linkages in Contrasting Headwater Catchments. JGR Biogeosciences 2018, 123, 149–167. [Google Scholar] [CrossRef] [Scilit]
  41. Rasilo, T.; Hutchins, R.H.S.; Ruiz-González, C.; Del Giorgio, P.A. Transport and Transformation of Soil-Derived CO2, CH4 and DOC Sustain CO2 Supersaturation in Small Boreal Streams. Sci. Total Environ. 2017, 579, 902–912. [Google Scholar] [CrossRef] [Scilit]
  42. Akhtar, S.; Equeenuddin, S.M.; Bastia, F. Distribution of pCO2 and Air-Sea CO2 Flux in Devi Estuary, Eastern India. Appl. Geochem 2021, 131, 105003. [Google Scholar] [CrossRef] [Scilit]
  43. Yang, R.; Chen, Y.; Du, J.; Pei, X.; Li, J.; Zou, Z.; Song, H. Daily Variations in pCO2 and fCO2 in a Subtropical Urbanizing Lake. Front. Earth Sci. 2022, 9, 805276. [Google Scholar] [CrossRef] [Scilit]
  44. Soued, C.; Prairie, Y.T. Patterns and Regulation of Hypolimnetic CO2 and CH4 in a Tropical Reservoir Using a Process-Based Modeling Approach. JGR Biogeosciences 2022, 127, e2022JG006897. [Google Scholar] [CrossRef] [Scilit]
  45. Pu, J.; Li, J.; Zhang, T.; Martin, J.B.; Yuan, D. Varying Thermal Structure Controls the Dynamics of CO2 Emissions from a Subtropical Reservoir, South China. Water Res. 2020, 178, 115831. [Google Scholar] [CrossRef] [Scilit]
  46. Demarty, M.; Bastien, J. GHG Emissions from Hydroelectric Reservoirs in Tropical and Equatorial Regions: Review of 20 Years of CH4 Emission Measurements. Energy Policy 2011, 39, 4197–4206. [Google Scholar] [CrossRef] [Scilit]
  47. Delmas, R.; Galy-Lacaux, C.; Richard, S. Emissions of Greenhouse Gases from the Tropical Hydroelectric Reservoir of Petit Saut (French Guiana) Compared with Emissions from Thermal Alternatives. Glob. Biogeochem. Cycles 2001, 15, 993–1003. [Google Scholar] [CrossRef] [Scilit]
  48. Keller, P.S.; Marcé, R.; Obrador, B.; Koschorreck, M. Global Carbon Budget of Reservoirs Is Overturned by the Quantification of Drawdown Areas. Nat. Geosci. 2021, 14, 402–408. [Google Scholar] [CrossRef] [Scilit]
  49. Cao, X.; Wu, Q.; Wang, W.; Wu, P. Carbon Dioxide Partial Pressure and Its Diffusion Flux in Karst Surface Aquatic Ecosystems: A Review. Acta Geochim. 2023, 42, 943–960. [Google Scholar] [CrossRef] [Scilit]
  50. Ducharme-Riel, V.; Vachon, D.; Del Giorgio, P.A.; Prairie, Y.T. The Relative Contribution of Winter Under-Ice and Summer Hypolimnetic CO2 Accumulation to the Annual CO2 Emissions from Northern Lakes. Ecosystems 2015, 18, 547–559. [Google Scholar] [CrossRef] [Scilit]
  51. Wang, Q.; Yang, F.; Liao, H.; Feng, W.; Ji, M.; Han, Z.; Pan, T.; Feng, D. Seasonal Variations of Ice-Covered Lake Ecosystems in the Context of Climate Warming: A Review. Water 2024, 16, 2727. [Google Scholar] [CrossRef] [Scilit]
  52. Carroll, J.J.; Slupsky, J.D.; Mather, A.E. The Solubility of Carbon Dioxide in Water at Low Pressure. J. Phys. Chem. Ref. Data 1991, 20, 1201–1209. [Google Scholar] [CrossRef] [Scilit]
  53. Sherman, E.; Moore, J.K.; Primeau, F.; Tanouye, D. Temperature Influence on Phytoplankton Community Growth Rates. Glob. Biogeochem. Cycles 2016, 30, 550–559. [Google Scholar] [CrossRef] [Scilit]
  54. Denfeld, B.A.; Baulch, H.M.; Del Giorgio, P.A.; Hampton, S.E.; Karlsson, J. A Synthesis of Carbon Dioxide and Methane Dynamics during the Ice-covered Period of Northern Lakes. Limnol. Ocean. Lett. 2018, 3, 117–131. [Google Scholar] [CrossRef] [Scilit]
  55. Leng, P.; Koschorreck, M. Metabolism and Carbonate Buffering Drive Seasonal Dynamics of CO2 Emissions from Two German Reservoirs. Water Res. 2023, 242, 120302. [Google Scholar] [CrossRef] [Scilit]
  56. Valdespino-Castillo, P.M.; Merino-Ibarra, M.; Jiménez-Contreras, J.; Castillo-Sandoval, F.S.; Ramírez-Zierold, J.A. Community Metabolism in a Deep (Stratified) Tropical Reservoir during a Period of High Water-Level Fluctuations. Environ. Monit. Assess. 2014, 186, 6505–6520. [Google Scholar] [CrossRef] [Scilit]
  57. Jensen, S.A.; Webb, J.R.; Simpson, G.L.; Baulch, H.M.; Leavitt, P.R.; Finlay, K. Seasonal Variability of CO2, CH4, and N2O Content and Fluxes in Small Agricultural Reservoirs of the Northern Great Plains. Front. Environ. Sci. 2022, 10, 895531. [Google Scholar] [CrossRef] [Scilit]
  58. Bouwman, A.F.; Bierkens, M.F.P.; Griffioen, J.; Hefting, M.M.; Middelburg, J.J.; Middelkoop, H.; Slomp, C.P. Nutrient Dynamics, Transfer and Retention along the Aquatic Continuum from Land to Ocean: Towards Integration of Ecological and Biogeochemical Models. Biogeosciences 2013, 10, 1–22. [Google Scholar] [CrossRef] [Scilit]
  59. Yan, X.; Thieu, V.; Garnier, J. Seasonal Variation in Greenhouse Gas Concentrations and Diffusive Fluxes in Three River–Reservoir Systems in the Seine Basin (France). Environ. Res. 2024, 257, 119399. [Google Scholar] [CrossRef] [Scilit]
  60. Chen, Y.; Zhang, L.; Xu, C.; Vaidyanathan, S. Dissolved Inorganic Carbon Speciation in Aquatic Environments and Its Application to Monitor Algal Carbon Uptake. Sci. Total Environ. 2016, 541, 1282–1295. [Google Scholar] [CrossRef] [Scilit]
  61. Liu, S.; Wen, Z.; Liu, G.; Shang, Y.; Hou, J.; Tao, H.; Fang, C.; Li, S.; Yu, X.; Han, J.; et al. Seasonal and Diurnal Variations of pCO2 from Reservoirs and Lakes in Northeast China. J. Hydrol. 2025, 662, 133917. [Google Scholar] [CrossRef] [Scilit]
Figure 1. Map of the upper reaches of the Minjiang River Basin and sampling point locations. The purple dots represent the monitoring sites within the study area, where G1–G15 are the monitoring sites along the mainstream of the upper Minjiang River, and K1 is the monitoring site in the Zipingpu Reservoir area.
Water 18 00012 g001
Figure 2. Seasonal evolution of inflow and outflow discharge and surface illuminance in the Zipingpu Reservoir from July to November 2023. The gray bars represent the daily mean surface illuminance (right axis, lux), used as a proxy for the light conditions potentially affecting photosynthesis; the purple and blue lines indicate daily mean inflow and outflow discharge, respectively (left axis, m3 s−1). Daily inflow and outflow discharge data for the Zipingpu Reservoir were obtained from the reservoir management authority for the period July–December 2023.
Water 18 00012 g002
Figure 3. Spatial distribution of the pCO2 in the water of the upper Minjiang River mainstream. The two sampling points, G5 and G6, within the red dashed ellipse in the figure correspond to the inlet mainstream and the central point of the barrier lake area in the upper reaches of the Min River, respectively.
Water 18 00012 g003
Figure 4. Temporal variation trend of pCO2 in the water of the Zipingpu Reservoir.
Water 18 00012 g004
Figure 5. Characteristics of the pCO2 in the mainstream and reservoir area during different water periods. Boxes show the distribution of pCO₂, and the red dots indicate the mean pCO₂ for each group. The letter M denotes the main river channel, and the letter R denotes the reservoir.
Water 18 00012 g005
Figure 6. Comparison of pCO2 between the barrier lake and its upstream main channel, and between the reservoir area and the inflowing main channel.
Water 18 00012 g006
Figure 7. Pearson correlation (r) between surface-water pCO2 and environmental variables in the Zipingpu Reservoir. L: reservoir water level, Tw: water temperature, DO: dissolved oxygen, Chl-a: chlorophyll-a, u: wind speed, CO2: pCO2.
Water 18 00012 g007
Figure 8. Pearson correlation (r) between surface-water pCO2 and environmental variables in the mainstream of the upper Minjiang River. p: atmospheric pressure, Tw: water temperature, DO: dissolved oxygen, Chl-a: chlorophyll-a, u: wind speed.
Water 18 00012 g008
Figure 9. Temporal variations in pCO2 and environmental factors in the water of the reservoir area.
Water 18 00012 g009
Figure 10. Temporal variations in CO2 and chlorophyll-a concentrations in the water of the reservoir area.
Water 18 00012 g010
Figure 11. Relationship between the pCO2 and chlorophyll a concentrations in the Zipingpu Reservoir. The dots represent individual observations, the solid lines show the fitted regression relationships, and the shaded areas indicate the 95% confidence intervals of the fitted lines.
Water 18 00012 g011
Figure 12. Relationships between pCO2 in reservoir water and key environmental factors. The four panels illustrate the correlations between the water pCO2 and its controlling factors, along with their data distributions, including the water temperature, reservoir water level, pH, and dissolved oxygen (DO) content. The dots represent individual observations, the solid lines show the fitted regression relationships, and the shaded areas indicate the 95% confidence intervals of the fitted lines.
Water 18 00012 g012
Table 1. Statistics of major environmental factors in the Minjiang River Basin.
ParametersUnitRiverReservoir
WetDryWetDry
Temperature°C12.34 ± 3.57
(5.86–18.31)
4.35 ± 2.10
(0.62–7.03)
21.6 ± 2.98
(15.6–28.35)
14.4 ± 1.45
(12.30–16.68)
pH-8.66 ± 0.09
(8.50–8.85)
8.50 ± 0.10
(8.31–8.67)
8.34 ± 0.23
(7.92–9.16)
8.07 ± 0.13
(7.77–8.37)
DOmg/L8.69 ± 0.72
(7.08–10.14)
10.30 ± 0.50
(9.10–11.16)
7.78 ± 0.62
(6.16–10.15)
9.21 ± 0.39
(7.79–10.48)
Chlμg/L0.81 ± 1.01
(0.05–3.54)
0.53 ± 0.09
(0.05–3.54)
22.27 ± 3.10
(16.25–31.88)
14.75 ± 1.45
(12.91–17.30)
pCO2ppm526 ± 158
(324–993)
403 ± 59
(332–504)
395 ± 106
(141–772)
563 ± 121
(350–859)
Table 2. Results of the multiple linear regression analysis of pCO2 and key environmental variables in the upper Minjiang River mainstream and the reservoir.
VariableStandardized Coefficients (Beta)SignificanceVIF
ReservoirConstant-0.473-
Chl-a−0.86907.586
Water level0.2570.0265.892
DO−0.38802.904
R2 = 0.684, adjusted R2 = 0.677, F = 102.4, p < 0.001
RiverConstant 0.003-
p−0.1530.4944.605
Temperature−0.1530.6048.014
pH−0.2170.0671.262
DO−0.4090.1828.578
Chl-a−0.0980.3951.207
a dependent variable: pCO2R2 = 0.258, adjusted R2 = 0.204, F = 4.789, p < 0.001
Disclaimer/Publisher’s Note: The statements, opinions and data contained in all publications are solely those of the individual author(s) and contributor(s) and not of MDPI and/or the editor(s). MDPI and/or the editor(s) disclaim responsibility for any injury to people or property resulting from any ideas, methods, instructions or products referred to in the content.