Article

Optimized Filtrations for Stormwater Quality Improvement by Porous Media–Biochar Applications: Column Experiments and Inverse Modeling

by
Sumiaya Amin Preota
1,*,
Chu-Lin Cheng
1,2,*,
Myung Hwangbo
1 and
Jongsun Kim
1
1
School of Earth, Environmental and Marine Sciences, University of Texas Rio Grande Valley, Edinburg, TX 78539, USA
2
Department of Civil Engineering, University of Texas Rio Grande Valley, Edinburg, TX 78539, USA
*
Authors to whom correspondence should be addressed.
Water 2025, 17(9), 1372; https://doi.org/10.3390/w17091372
Submission received: 1 March 2025 / Revised: 24 April 2025 / Accepted: 25 April 2025 / Published: 1 May 2025
(This article belongs to the Special Issue Soil-Groundwater Pollution Investigations)

Abstract

:
Stormwater reuse plays a critical role under changing climates and increasing water demands. This study investigates the removal efficacy of lead (Pb2+) and ammonia (NH3) using sand and rice husk (RH) biochar for potential stormwater quality improvements and treatments. Column experiments combined with HYDRUS inverse modeling were conducted to optimize adsorption isotherms from breakthrough curves. Among linear and non-linear models, the Langmuir and Freundlich models performed better for sand and biochar, respectively. RH biochar showed much higher adsorption capacity of both Pb2+ (4.813 mg/g) and NH3 (6.188 mg/g). In contrast, sand showed a relatively limited adsorption capacity for Pb2+ (0.118 mg/g) and NH3 (0.104 mg/g). This can be contributed to higher pore size distribution, surface area, and the presence of different functional groups of biochar. The optimized adsorption coefficients and adsorption capacity parameters of sand and RH biochar by inverse modeling provided useful input for improving field designs. These findings will enhance the development of the best management practices (BMPs) for managing heavy metal and solute pollution in groundwater or stormwater low-impact development (LID) infrastructure systems.

1. Introduction

Flood-managed aquifer recharge (Flood-MAR), aquifer storage recovery/aquifer recharge (ASR/AR), and constructed wetlands are some popular terms in integrated water resources management techniques that use excess water, such as stormwater, wastewater, and graywater, for aquifer replenishment in detention or recharge areas [1]. Such management practice can mitigate flood risk on the ground surface. However, it can also potentially introduce pollutants, such as agricultural pesticides, industrial chemicals, heavy metals, sewage, etc., and contaminate groundwater during infiltration [2,3]. The concentration and type of contaminants in stormwater can vary depending on location, land use, and pollution source. Urban stormwater runoff has higher levels of zinc (20–5000 µg/L) and lead (5–200 µg/L) [4,5,6,7,8]. Agricultural, wastewater discharge, and industrial areas typically have higher concentrations of ammonia, which can exceed up to 17.5 mg/L [9]. Several studies discussed available methods for the pretreatment of stormwater, for example, rouging filters, granular media filters, screen filters, membrane filtration, chemical treatment, and multiple-element pretreatment systems, which can add considerable costs and may not be economically feasible for many regions like developing countries [10].
Vadose zones and aquifers are natural filters that reduce contaminants by physical, chemical, and microbiological processes [11,12]. These processes can be further expedited with the adsorption process, which is one of the popular engineering methods for waste remediation. The process is relatively cost effective and can remove many contaminants without negative environmental impacts. Furthermore, in many regions, such sorption materials can be produced locally using raw biomass wastes in the form of activated carbon, also known as biochar [13]. Numerous studies have been conducted to measure the adsorption capacities of different types of biochar, which were successful in removing contaminants commonly found in stormwater, such as ammonium ( N H 4 + ) 59.6% [14], Copper (Cu) 58–95%, Zinc (Zn) 70% [15,16,17,18], Cadmium (Cd) 26–28%, Chromium (Cr) 18–22% [13], per- and polyfluoroalkyl substances (PFAS) > 96%, Antimony (Sb) 40%, and lead (Pb) 99% [19]. High specific surface area, porous structure, water retention capacity, and different functional groups of biochar collectively provide ample adsorption sites and enhance treatment efficiency for environmental remediation [20,21,22]. Pyrolysis temperature is another dominating factor that can modify the functional groups and porous structure, ash fraction, and carbon content of biochar. Increasing temperature during pyrolysis leads to higher SiO2 concentration (ash content) and decreases biochar yield and carbon content, as well as the presence of functional groups. A lower pyrolysis temperature retains the functional groups that can greatly enhance its adsorption capacity [23].
Adsorption isotherm models help to understand the interaction between adsorbates and adsorbents. Several adsorption isotherm models, such as linear, Langmuir, Freundlich, Redlich–Peterson, Sips, Toth, and Temkin, are commonly used [24]. Each model offers insights into the interaction behavior between adsorbent and adsorbate depending on various conditions. These models are usually fitted to breakthrough curve observation data, and the model fit best explains the material’s sorption behavior. The linear, Langmuir, and Freundlich models are the most widely used among the adsorption models. The linear model usually represents the partition mechanism (van der Waals and hydrophobic) of adsorbates in the solid–liquid phase [25,26]. The Langmuir model considers monolayer chemical adsorption, which has homogeneous adsorption sites with constant adsorption energy under the assumption that adsorbate molecules have negligible interactions among themselves [27,28]. On the other hand, the Freundlich model accounts for heterogeneous surfaces and multilayer adsorption [24,29,30,31]. By fitting these models with observed breakthrough data, the mechanism of the contaminants’ uptake by the adsorbent can be revealed.
To maximize biochar’s efficiency in infiltration basin engineering designs, a deeper understanding of the infiltration basin’s hydraulic and adsorption properties is essential. In addition, biochar’s characteristics of different raw biomass can also significantly increase the time and labor required for traditional laboratory experiments, such as soil water retention curve (SWRC) and batch adsorption column experiments. This intensive time and labor can be reduced by using a numerical modeling package, such as HYDRUS-1D (PC-Progress, Prague, Czech Republic). This enables rapid assessments for hydraulic and adsorption isotherms without extensive experiments. The HYDRUS-1D, version 4.17.0140 software package is a finite element one-dimensional model that can simulate the movement of water, heat, and solutes through porous media. It numerically solves Richards’ equation for water flow and Fickian-based advection–dispersion equations for heat and solute transport [32]. It can optimize unknown parameters by outflow flux concentration using experimental data [33], such as breakthrough curves from column experiments. Studies have demonstrated that the HYDRUS inverse model can successfully capture the complex interactions between water movement and solute adsorption in porous media, providing valuable insights into contaminant transport behavior in various soil materials [34,35,36,37]. Moreover, it also greatly reduces the manual labor and time needed to perform SWRC and batch adsorption experiments [36].
This study aims to investigate the adsorption isotherms (linear, Langmuir, and Freundlich) of sand and RH biochar to remediate lead (Pb2+) and ammonia (NH3) using adsorption breakthrough column experiments and the HYDRUS inverse model. The experiments were conducted in aqueous solutions where species, i.e., ammonia (NH3) and ammonium (NH4+), can be dynamically interrelated by chemical equilibrium [38,39]. Commercially produced RH biochar (SAYOYO on Amazon.com) was used for this study [40]. RH biochar is selected specifically because it is a biowaste of rice production, low cost, and can be readily available in many developing countries. This waste also needs more time to naturally decompose as it has a hard fiber structure that can be more suitably used for biochar production rather than compost [23]. Depending on the types of biomass and the temperatures of pyrolysis, the produced biochar can have a wide range of pore sizes and specific surface areas. The Amazon vendor of RH biochar used in this study did not provide information regarding the activation method nor the pyrolysis temperature. Biochar typically has a surface area between 200 and 700 m2/g. Rice husk can result in a surface area between 725–2852 m2/g [41] with different pyrolysis process, e.g., under 500 °C. Moreover, this study aims to evaluate the best-fitted isotherm model and sorption capacity of sand and RH biochar. Optimized adsorption data can be used for field-scale applications such as infiltration basins, constructed wetlands, or other low-impact development BMP designs, depending on actual field contaminant concentration levels. Implementing biochar remediation for infiltration basins can be a viable solution for replenishing aquifers in arid and semi-arid regions.

2. Materials and Methods

2.1. Column Experiment and Water Quality Assessment

The column experiments were conducted using cylindrical tubes of 40 cm in length and 2.2 cm in diameter. Two different configurations of columns were used: (i) S column: filled with sand for 30 cm (Figure 1a), and (ii) SBS column: filled with 12-3-15 cm of sand– RH biochar–sand (Figure 1b). The sand used was mainly composed of silicon dioxide (SiO2) with a bulk density of 1.55 g/cm3. Sand was sieved through a 500-micron mesh to ensure homogeneity before packing into tubes. The RH biochar used for this study is commercially available [41], which has a bulk density of 0.377 g/cm3. Both columns were wet-packed and inundated with 3 cm of deionized (DI) water on the top. The column material was mixed with DI water, and the mixture was poured into the column, carefully keeping the materials even without entrapping any air within the column.
The solutions of Pb2+ and NH3 were prepared using DI water with a pH of 7 as the basic condition. Complexity can be added as needed in future studies. Solutions of Pb2+ and NH3 with concentrations of 2 mg/L and 50 mg/L were injected, respectively, from the bottom to the top of the column (Figure 1). A HACH 3900 benchtop RFID spectrophotometer (Hach Company, Loveland, CO, USA) was used to analyze the collected solutions (permeates). This specific concentration of Pb2+ (0–2 mg/L) and NH3 (0–50 mg/L) was selected because of the limits of the spectrophotometer and the lower-cost workable water quality testing kits. The breakthrough curves could also be achieved within a reduced and manageable timeframe. The flow through the columns was controlled by peristatic pumps with a fixed rate of 1 mL/min (Figure 1). The concentration change in the solutions was recorded at the outlet of the columns until it reached the equilibrium concentration. The observed breakthrough concentration data were later used for the inverse model simulation under HYDRUS-1D to calculate the adsorption isotherms. The hydraulic and adsorption parameters of the S column were used in the SBS column (sand portion) to optimize the biochar hydraulic and adsorption parameters. Statistical evaluation was performed for each model to assess its reliability and uncertainty. Experimental replicates were not performed due to time limitations. However, a total of 166 data points from experiments detailed breakthrough curves, which could improve inverse model fitting.

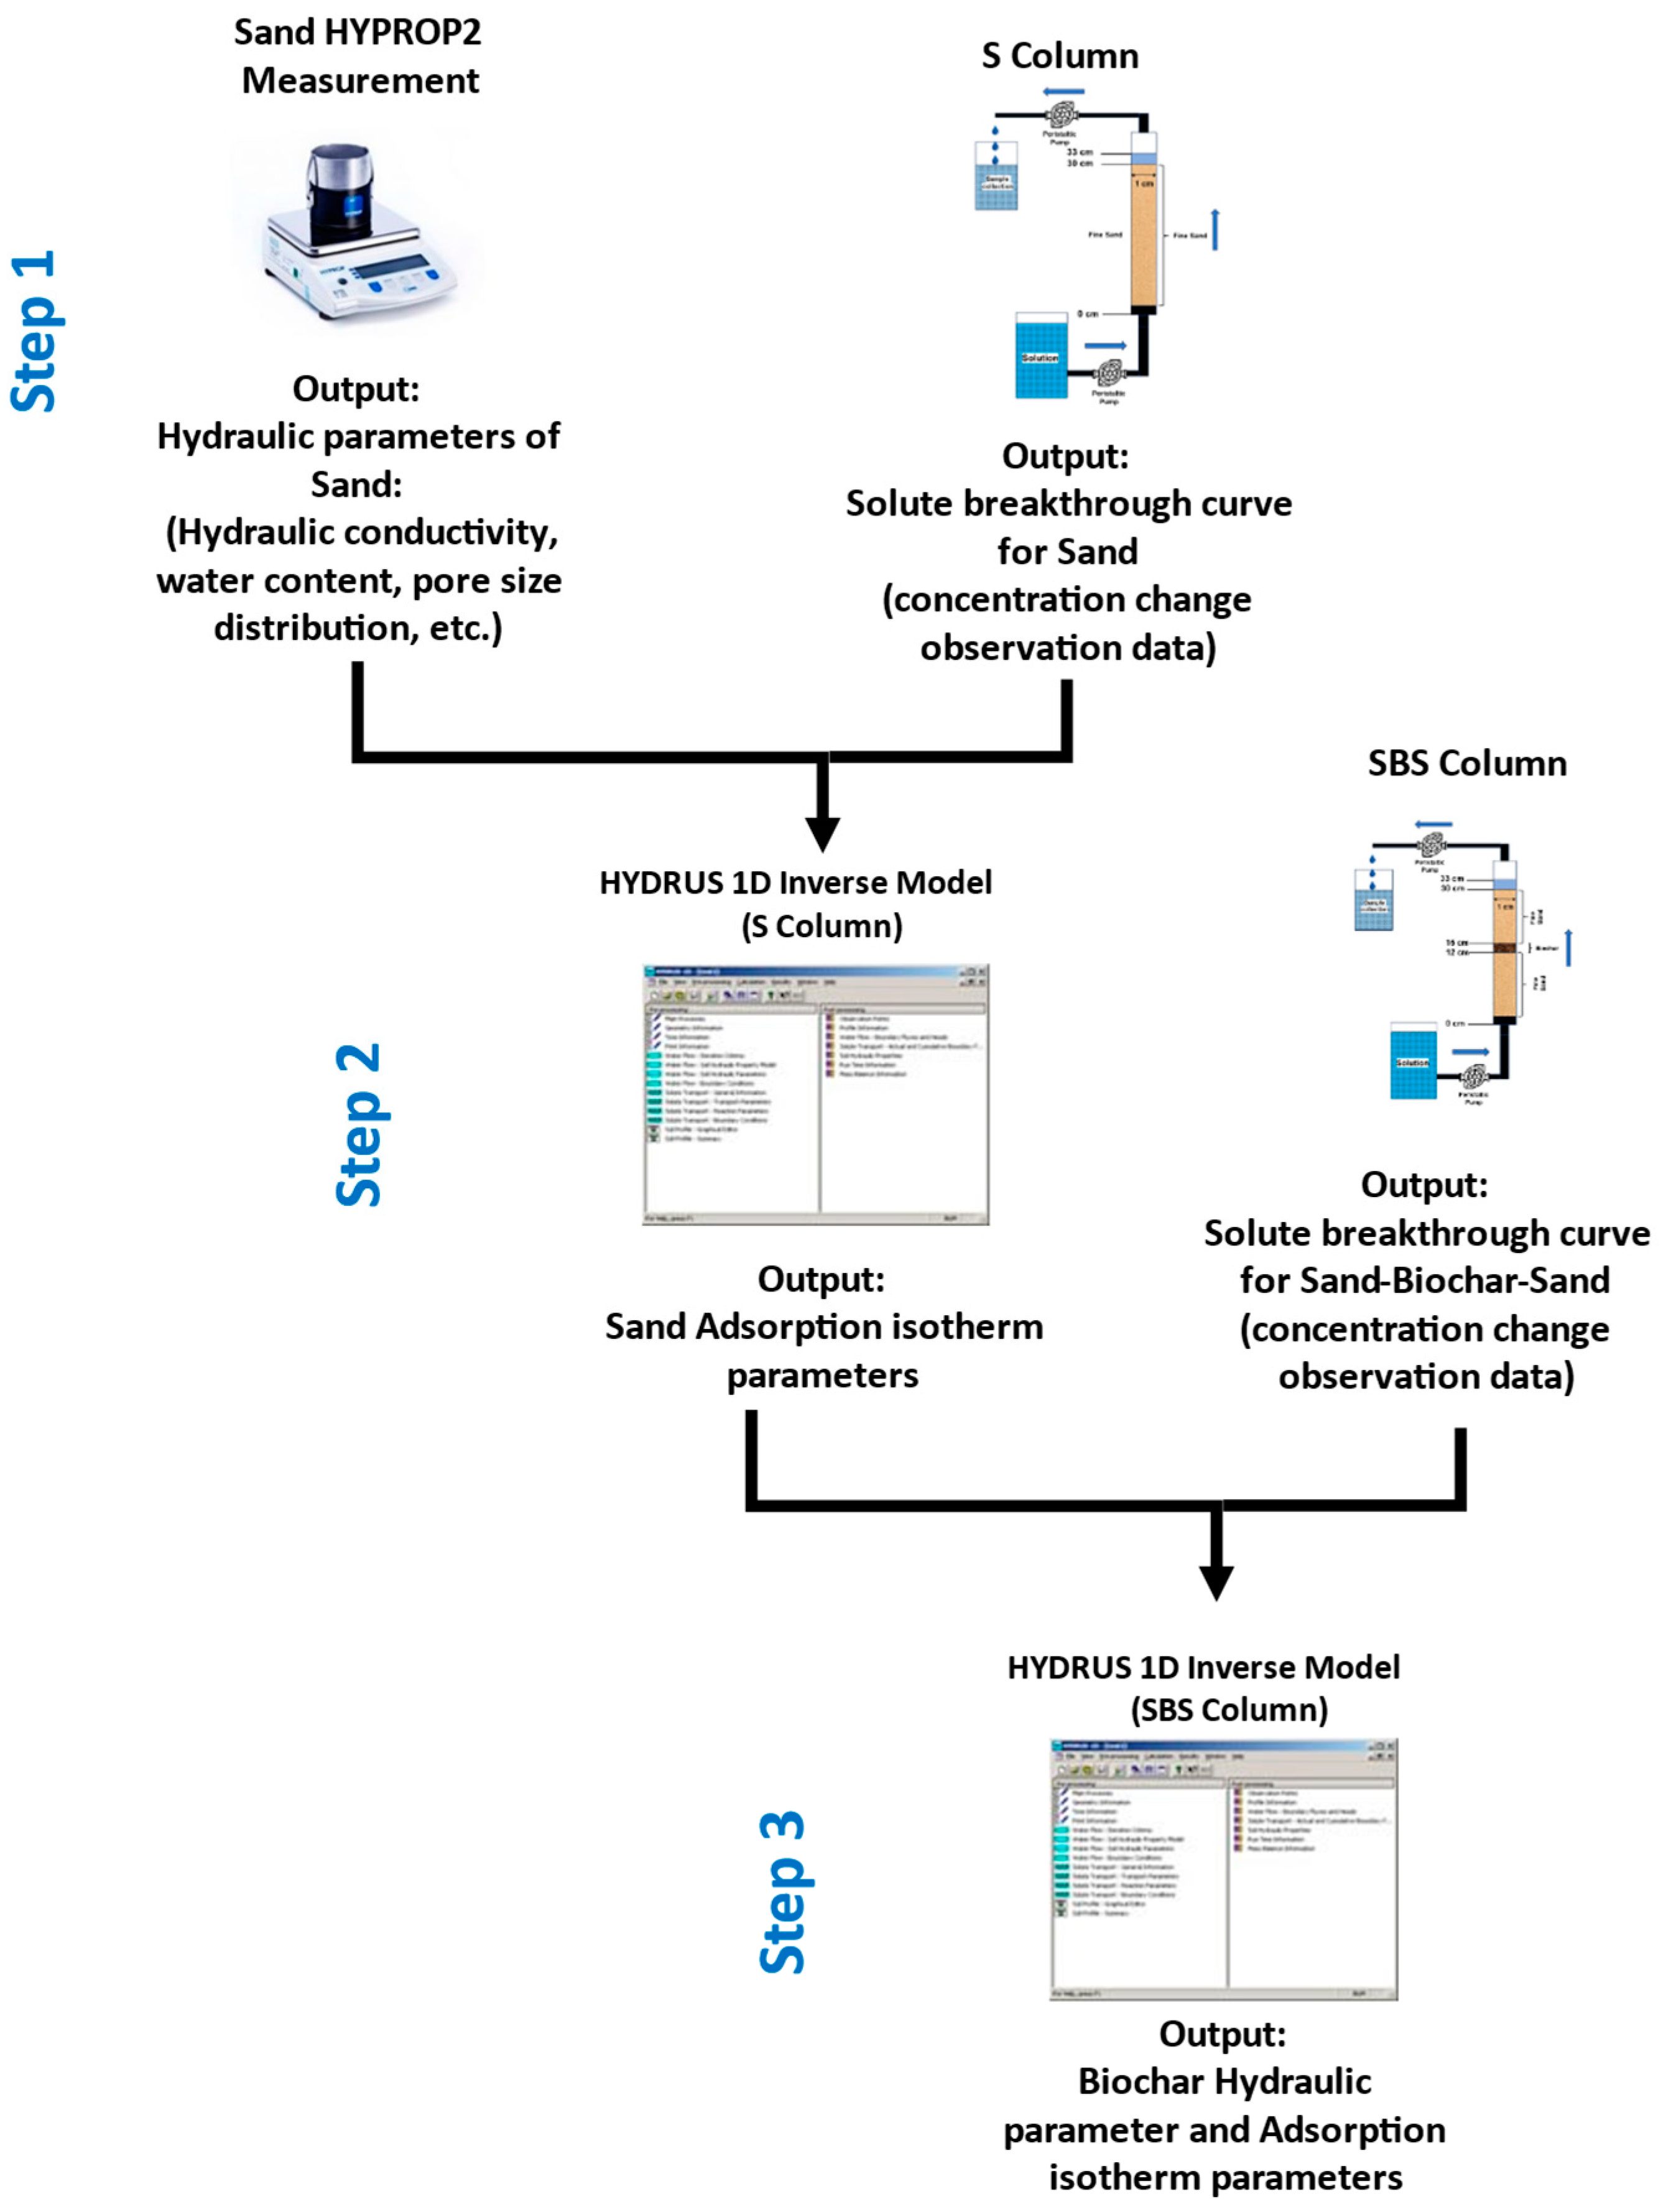
2.2. Model Simulation

The HYDRUS-1D inverse model was used to simulate laboratory column experiments. It employs a Marquardt–Levenberg method for the parameter estimation of the chosen hydraulic, solute transport, and reaction parameters based on observed transient or steady-state water flow and solute transport datasets. This model used the flux concentration at the outlet as the observation dataset. HYDRUS can optimize and inversely estimate up to 15 parameters simultaneously. In this study, optimizations were completed in 3 steps: (i) Step 1: Adsorption isotherms were optimized using the measured hydraulic parameters of sand (instrument: HYPROP2; see following section) and observed breakthrough concentration data in the S column, (ii) Step 2: The measured hydraulic parameters and adsorption isotherm of sand from step 1 were used for the sand layers of the SBS column as input data. (iii) Step 3: The hydraulic and adsorption isotherms of biochar were optimized using the data from step 2. The workflow for the model solution is illustrated in Figure 2.
HYRDUS 1D numerically solves the water flow and transport using Richards’ equation for one-dimensional water flow and advective–dispersion equations for solute transport using Galerkin-type linear finite element schemes. This model assumes that water flows through the partially saturated rigid porous medium with an insignificant influence of air. The modified form of Richard’s equation is as follows [42]:
θ t = δ δ x   K h x + cos α S
where t is time [T], θ is volumetric water content [L3L−3], K is the unsaturated hydraulic conductivity function [LT−1], h is water pressure [L], α is the angle between the flow direction and the vertical axis, and S is the sink term [L3L−3T−1].
The van Genuchten–Mualem model (1980) was applied to describe the SWRC and its retention function, which characterizes a water advection pattern in unsaturated porous media [43,44]. The van Genuchten–Mualem model provides a relationship between the soil moisture content and pressure head, which improves the water flow simulation in variable-saturated conditions. The governing equations are as follows:
θ h = θ r + θ s θ r 1 + α h n m ,     h < 0     θ s                         ,     h 0
K h = K s S e l 1 1 S e 1 m m 2 m = 1 1 n ,     n > 1 S e = θ θ r θ s θ r
where θs—saturated water content [-], θr—residual water content [-], α, m, and n—empirical parameters related to pore size distribution, h—air-entry value [L], Se—effective water content [-], and KS—saturated hydraulic conductivity [L/T].
In this study, the van Genuchten–Mualem hydraulic parameters were measured using HYPROP2 (METER Group, Pullman, WA, USA) for sand and were coupled with breakthrough curve data, which were implemented as known input values (θs, θr, α, n, KS, concentration change) to the inverse model. It helped to optimize adsorption isotherm parameters for the S column. HYPROP2 is mainly designed for fine to coarse soil material [45] for which it was not used to determine the hydraulic parameters for biochar. The hydraulic parameters for biochar were optimized using the SBS column experimental data.
The two-site sorption solute transport model was considered for nonequilibrium adsorption–desorption reactions. This concept assumes that the total sorption site S k can be divided into two types: one type is instantaneous S k e and another type is time-dependent S k k (Equation (4)).
S k = S k e + S k k
The adsorption isotherm indicates the amount of adsorbate that can be adsorbed onto an adsorbent. This adsorption mechanism is widely used for environmental remediation due to its low cost and high efficiency. While there are several adsorption isotherm models, linear, Langmuir, and Freundlich are the most common ones to be used for estimation/fitting under inverse models. The adsorption isotherm equation used in HYDRUS-1D is as follows:
s = K d c β 1 + η c β
where s is the adsorbed solute concentration [MM−1], Kd is a distribution coefficient [M−1L3], c is the solute concentration [ML−3], β is the Freundlich exponent [-], and η is the Langmuir coefficient [M−1L3]. The adsorption (Equation (5)) becomes the Langmuir equation when β = 1 (Equation (5a)):
s = K d c 1 + η c
Equation (5) becomes the Freundlich equation when η = 0 (Equation (5b)):
s = K d c β
and when both β = 1 and η = 0, it leads to a linear adsorption isotherm in HYDRUS (Equation (5c)):
s = K d c
These isotherms were optimized for both sand and biochar. The model performances and uncertainty were further evaluated using the coefficient of determination (R2), Root Mean Square Error (RMSE) and Akaike Information Criterion (AIC). It is common practice to compare the estimates between observed and predicted values, average errors, and relative quality among the models. The R2 value is calculated as follows:
R 2 = 1 i = 1 n ( O i P i ) 2 i = 1 n ( O i O ¯ ) 2
where O i ,   P i ,   a n d   O ¯ are the observed, predicted, and mean of observed values, respectively, for n numbers of data points. This value indicates the proportion of variance explained by the model. Values closer to 1 indicate higher precision, and there is a strong correlation between the predicted and observed data. The RMSE value is calculated using Equation (7), which provides the average magnitude of prediction error with N number of data points, where xi is the i -th measurement, and x ^ is the corresponding prediction. An RMSE closer to 0 indicates a lower average error in the predicted model.
R M S E = i = 1 N ( x i x ^ i ) 2 N
AIC is used to assess model fits and efficiency, to compare different model configurations. It was calculated using the residual sum of squares approach, where the n number of data points with the k number of estimated parameters with the σ 2 residual variance were calculated (Equation 8). By comparing the AIC values of different models, optimal HYDRUS simulation can be identified by ensuring a balance between overfitting and underfitting. A lower AIC value indicates a better model balance between accuracy and complexity.
A I C = n ln σ 2 + 2 k

3. Results and Discussion

3.1. Soil–Biochar Hydraulic Parameter Characteristics

The hydraulic parameters of sand and biochar were evaluated and are summarized in Table 1. The SBS column was composed of two layers of sand material and a biochar layer in the middle (Figure 1b). As the inverse modeling of the HYDRUS program can estimate unknown parameters, the hydraulic parameters of the biochar of the SBS column were easily estimated using the measured sand hydraulic parameters from HYPROP2 and the observed concentration breakthrough data from column experiments.
For sand, the residual soil water content (θr) was found to be 0.045, while the saturated soil water content (θs) was 0.439 from the HYPROP2 measurement. The inverse of the air-entry pressure (α) of 0.0725 cm−1, with a pore size distribution parameter (n) recorded at 1.1, suggests a relatively low pressure required for water to enter the soil matrix and has a moderate degree of pore connectivity and pore sizes. The hydraulic conductivity (K) of sand was determined to be 0.14 cm/min, which is aligned with the range for sand (0.006–60 cm/min) [46]. In contrast, the RH biochar exhibited significantly different hydraulic properties. The residual soil water content (θr) was substantially higher at 0.213, and the saturated soil water content (θs) for RH biochar was 0.728, indicating a greater capacity for retaining moisture compared to sand. Different studies also showed how the addition of small portions of biochar can increase the water content of soil material significantly [47,48,49]. The inverse of the air-entry pressure for RH biochar and pore size distribution was optimized at 0.0777 cm−1 and 2.913, respectively, suggesting that it requires slightly higher pressure for water infiltration with a more complex pore network structure and connectivity compared to sand. The hydraulic conductivity is also much lower, which hinders the water flow relative to sand.
While sand offers rapid drainage capabilities, RH biochar provides enhanced moisture retention and sorption capability. A combined/balanced optimized approach that incorporates both materials may enhance the performance of infiltration basins for both water quantity and water quality by allowing effective drainage with sufficient treatment. During infiltration through the soil column, the infiltration rate decreases asymptotically and approaches the saturated hydraulic conductivity value over time due to increasing water content [50]. So, as a minimum infiltration rate value, hydraulic conductivity can be used as proxy reference data for the column experiments in the lab. According to the U.S. Environmental Protection Agency (USEPA), infiltration rates should be between 0.021 and 0.127 cm/min (0.5–3 inches/hour) for infiltration basin bottom materials [51]. The SBS column is a series configuration with an equivalent hydraulic conductivity ( K e q ) or minimum infiltration rate of 0.056 cm/min (Equation (9)), which is within the USEPA recommended range for engineering design. This infiltration rate can be further modified depending on the required adsorption material’s thickness using Equation (9).
K e q = i = 1 n     b i i = 1 n     b i k i

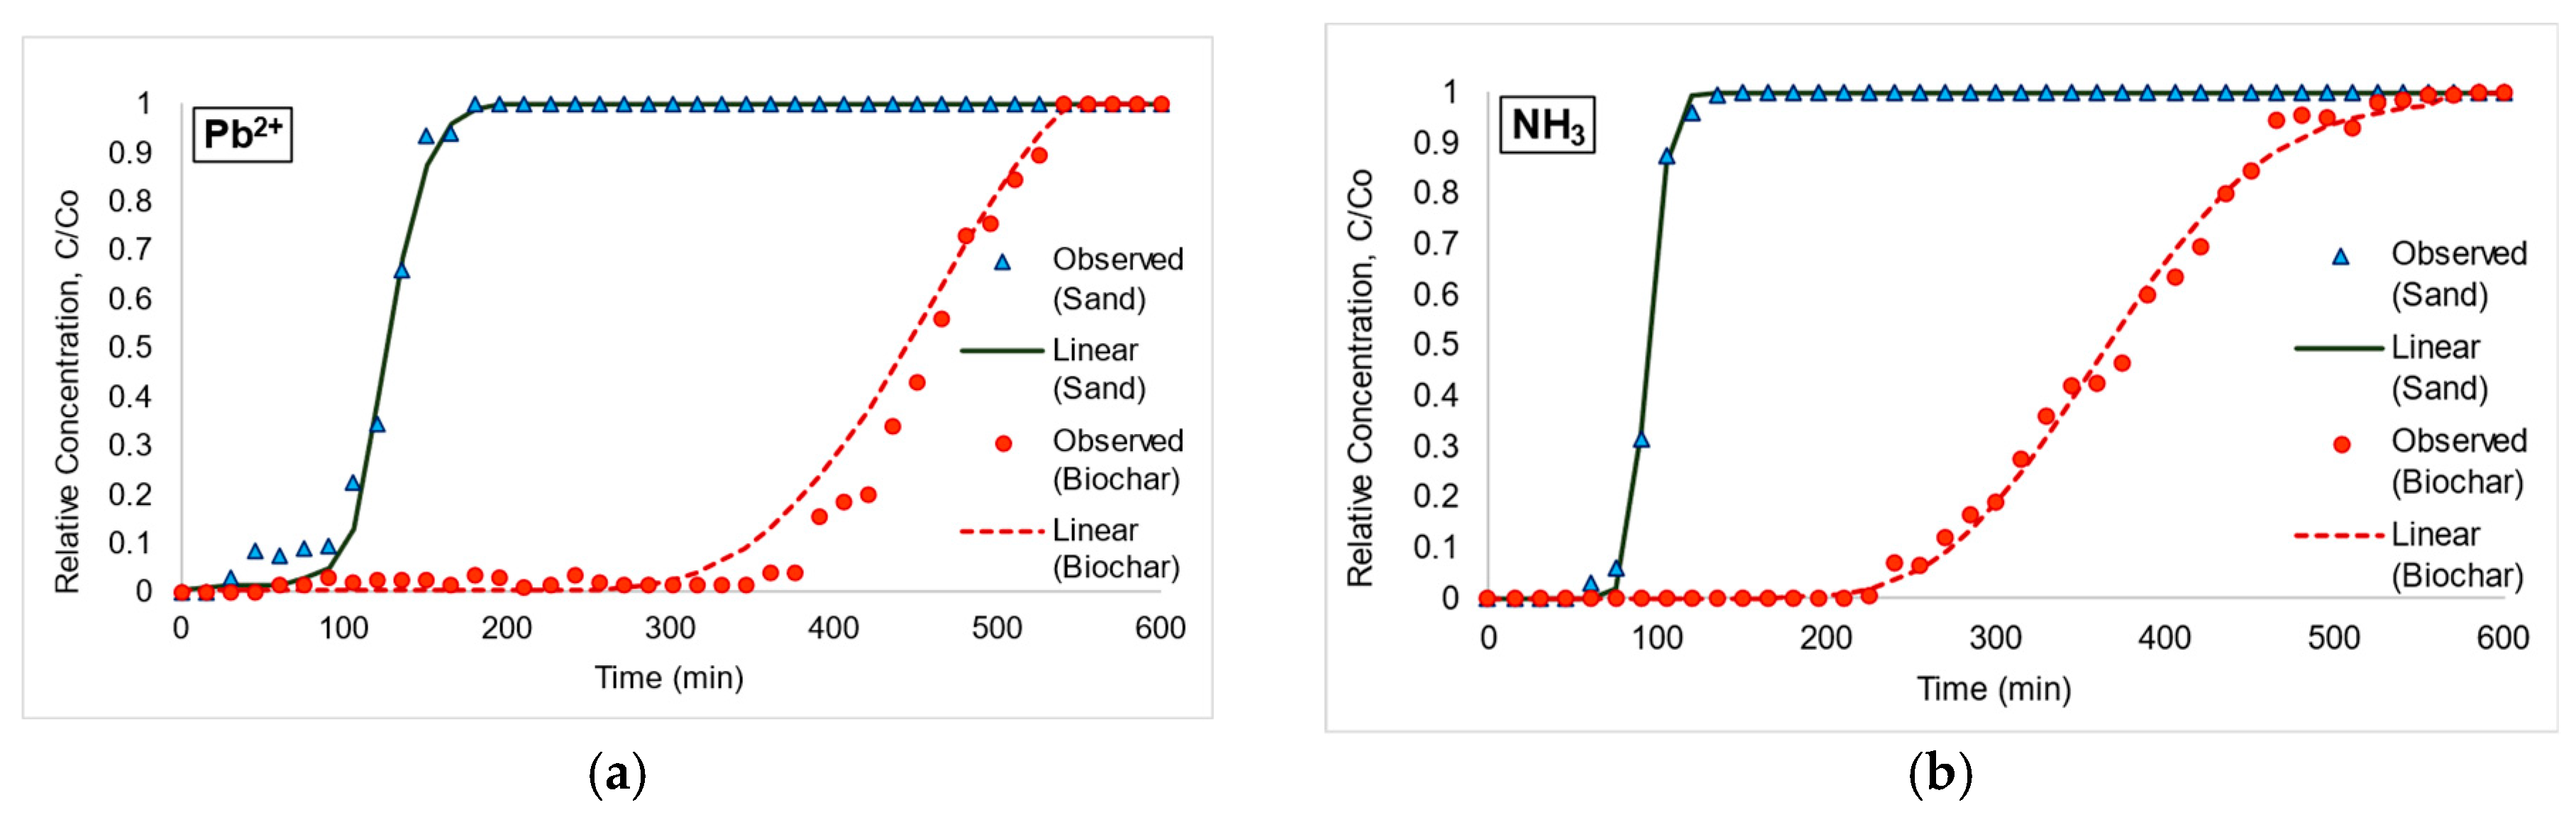
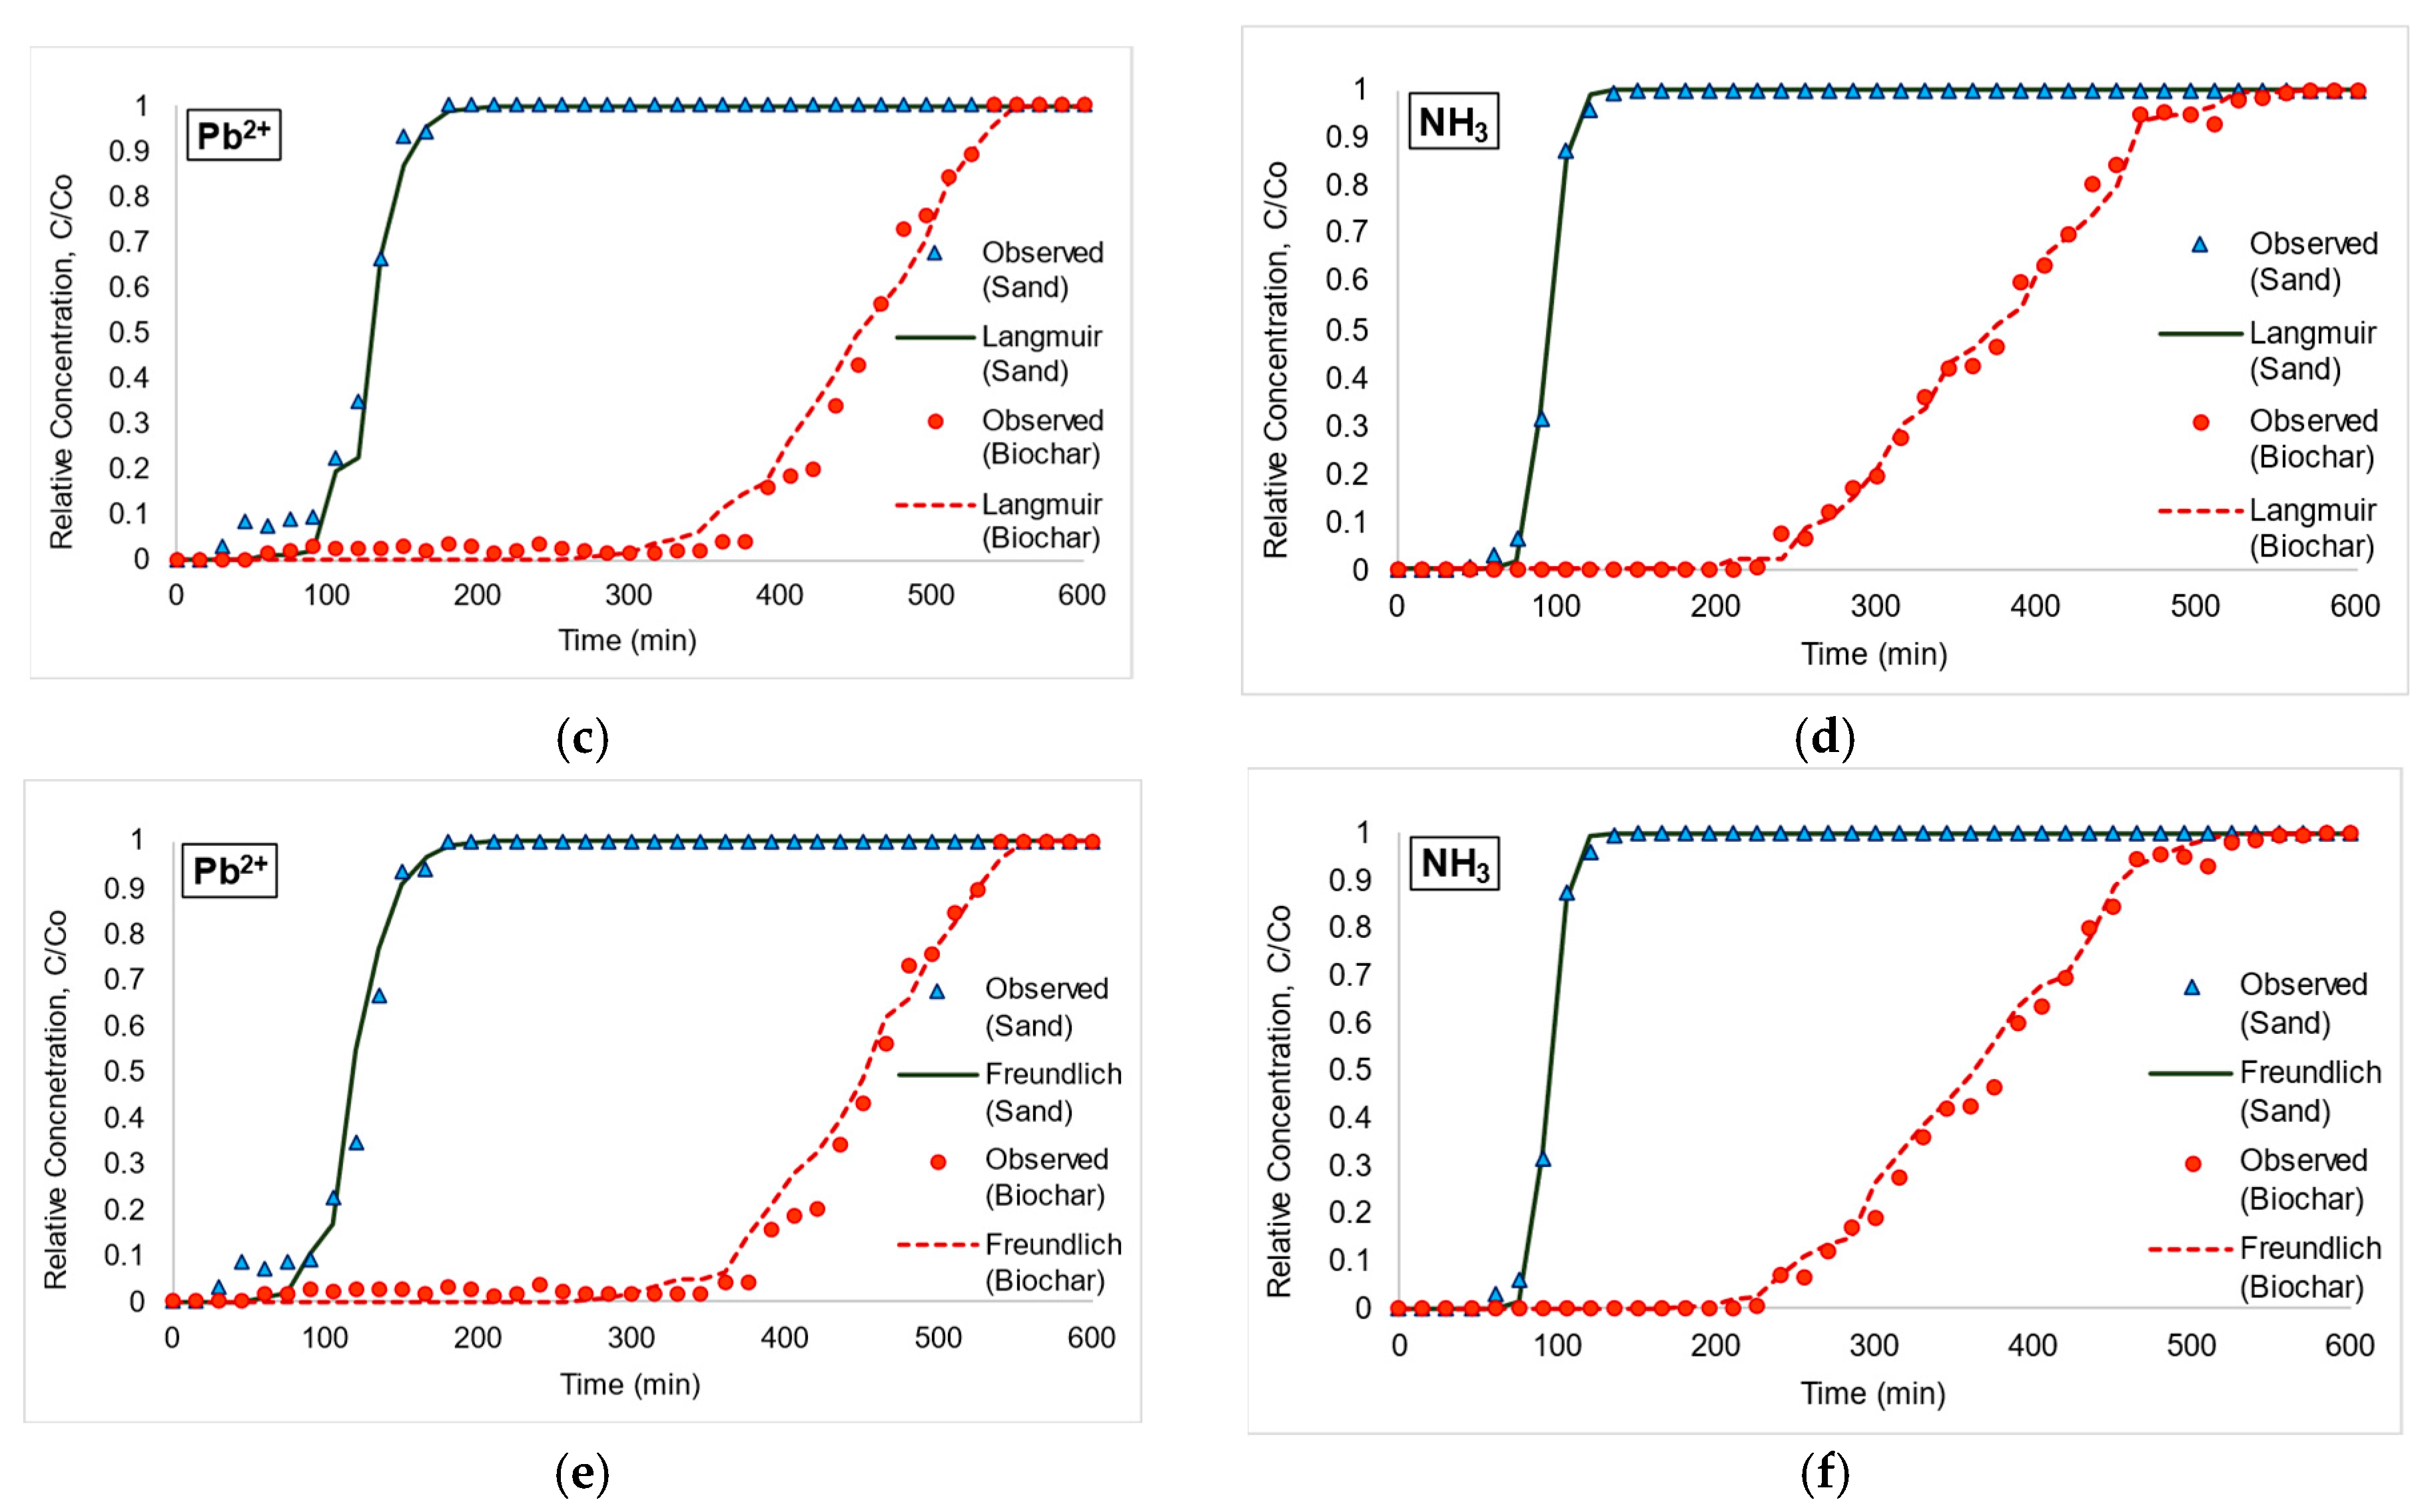
3.2. Adsorption Isotherms from Column Experiment and Inverse Model Simulation

The observed concentration changes from the top outlet of the column experiments for both the S and SBS columns for the Pb2+ and NH3 solutions were fitted under HYDRUS using linear, Langmuir, and Freundlich adsorption models. A comparison between the observed and model-fitted data is illustrated in Figure 3. As the solution was injected at a fixed flow rate (1 mL/min) from one end and was sampled at the other end of the column (Figure 1), the initial concentration at the outlet was lower until the breakthrough occurred. For the S columns, Pb2+ and NH3 breakthrough occurred after 60 min (Figure 3).
However, in SBS columns, the same S column configuration with only 3 cm thick biochar in the middle of the column shifted the breakthrough to occur relatively later (Figure 3). Pb2+ breakthrough occurred after 300 min (Figure 3a,c,e), and NH3 breakthrough occurred after 240 min (Figure 3b,d,f) for the SBS column. Such a small portion of biochar (3 cm thickness) offered a high capacity for contaminant sorption and shifted the breakthrough curve significantly, which was another reason not to prepare a full 30 cm biochar column for breakthrough experiments. The distribution coefficient (Kd), Freundlich exponent (β), and Langmuir coefficient (η) for Pb2+ and NH3 adsorptions on sand and biochar are presented in Table 2.
The adsorption coefficients indicate that biochar is a significantly more effective adsorbent for Pb2+ and NH3 compared to sand. The higher Kd values for biochar suggest that it has a greater capacity to retain targeted contaminants. This is mainly due to its much more complex surface chemistry and higher specific surface areas, which provide more active sites for adsorption. In contrast, low estimated Kd values on sand materials indicate that it is a less effective adsorbent for target contaminants, i.e., Pb2+ and NH3 in this study.
Three statistical criteria, R2, RMSE, and AIC, were used to assess the model performance and uncertainty presented in Table 2. A higher R2, lower RMSE, with lower AIC value indicate the best model performance, which has been indicated with (*) in the table. All the statistical criteria indicate that the non-linear (Langmuir and Freundlich) models perform better than the linear model. Either the Langmuir or Freundlich model showed performance reliability, though there are no significant differences in the R2, RMSE, and AIC values except for Pb2+ and NH3 adsorption by sand. The Freundlich model showed a relatively higher error margin (RMSE = 0.1312 mg/L) for Pb2+ on sand with a relatively higher AIC value (−49.85). For NH3 adsorption by sand, Freundlich showed a better fit, but depending on the lower AIC value (66.37) and the almost similar fit result with the same RMSE value, the Langmuir model showed better performance. For Pb2+ and NH3 adsorption on biochar, the Freundlich model performed better.
Both non-linear adsorption isotherm models are flexible and provide robust regression fits under different environmental conditions [52]. These adsorption isotherm models describe how substances are adsorbed on the adsorbents. The Langmuir model assumes single-layer, homogeneous surface coverage with the same degree of affinity and a finite number of sites for adsorption, whereas the Freundlich heterogeneous physical sorption model is relatively versatile with a non-uniform, multilayer adsorption process— different sites with varying affinities for adsorbent [53]. In this study, the Langmuir model fitted data better for the adsorption of Pb2+ and NH3 by sand, which suggests that sand particles provide a relatively uniform surface for adsorption, i.e., each site can only hold one molecule of the adsorbate. Though sand has some adsorption capacity, it is limited due to the finite number of adsorption sites and much simpler chemical functions compared to biochar. In contrast, biochar adsorption estimations from SBS columns support the Freundlich model behavior. This can be attributed by the heterogeneous adsorption nature of the biochar surface and functional groups. The presence of biochar provides a variety of adsorption sites with different affinities for target adsorbates, which aligns with multilayer Freundlich adsorption.
The sand is primarily made of quartz (SiO2), which is relatively inert for adsorption. The pore size distribution of sand (n = 1.1) is relatively less complex than biochar (n = 2.913), with higher hydraulic conductivity that facilitates rapid water movement but limits the surface area available for adsorption. The sorption results of the best-fitted model indicate that Pb2⁺ and NH3 sorption on the sand of 0.118 mg/g and 0.104 mg/g, respectively (Table 2), suggests a moderate adsorption capacity. This can effectively accommodate the smaller ionic radius of Pb2+ (0.118 nm) [54] more than N H 4 + (0.14–0.167 nm) [55]. While sand can absorb some degree of NH3, the sorption capacity is less than Pb2+ due to its larger radius.
Contrary to sand, RH biochar is derived from pyrolysis, which helps to modify the surface with a higher porous structure and complex surface chemistry, which enhances the reactivity and adsorption capacity. The pore size distribution in biochar is heterogeneous, featuring a wide range of different pore sizes that can accommodate both larger and smaller molecules. Biochar was able to absorb both target contaminants. However, the Pb2+ sorption (4.813 mg/g) is slightly lower than the NH3 adsorption (6.188 mg/g). The higher adsorption of biochar for NH3 may not only depend on the pore size distribution but may influence the molecular mobility and interaction between the functional groups of biochar and the hydrogen bond of NH3. The ion mobility of Pb2+ and N H 4 + in aqueous solution is 70 and 73.6 Ohm−1cm2 [56], suggesting that N H 4 + ions can diffuse more readily to the adsorbent surface and react with it. In addition, the RH biochar may contain hydroxyl (-OH), carboxylic acids (-COOH), the carbonyl group (C=O, C-OH), and other phenolic groups depending on the pyrolysis temperature and conditions [22,23,57]. These groups significantly impact the contaminants in the solution and interact with the biochar surface, which aligns with the heterogenous complex behavior of the Freundlich model of biochar, while sand’s simpler chemistry closely supports the Langmuir model. The N H 4 + ion interacts strongly with the negatively charged sites of the biochar. Moreover, the hydroxyl groups can form hydrogen bonds with the N H 4 + ion and retain it on the biochar surface. Pb2+ can also react with the carboxyl group of biochar and form a coordination complex, but adsorption can be limited by the hydration shell effect. N H 4 + and Pb2+ can both create hydration shells and reduce the adsorption onto biochar, but the N H 4 + ’s hydration shell is weaker than other multivalent metals like Pb2+ because N H 4 + has lower charge density. The strong hydration shell of Pb2+ (m = 6–9) may need to shed more water molecules before binding with biochar’s functional groups. This can be a possible reason for a higher N H 4 + (m = 4–6) adsorption relative to Pb2+ on RH biochar [58,59,60].
Overall, the RH biochar surface structure and chemical interaction with NH3 and Pb2+ highlight the adsorption process and satisfy the fitted adsorption model. The functional groups of biochar and its high surface area contribute to higher adsorption capacity. The adsorption isotherms data from this study can be upscaled and engineered according to the field conditions and infrastructure needs [61,62,63]. Quantified adsorption parameters can be used as input for forward simulations, i.e., reactive transport modeling.
This study has inherent limitations as experiments were conducted under the limited equipment, time, and budget available. It is recommended to further expand the experimental scope in subsequent studies. Further validation of findings through practical applications is also suggested. Future studies can include laboratory experiments that are related to the potential impacts of two main aspects: (i) different adsorbents/biochar materials and (ii) different column boundary conditions. Replications are also suggested using different types of biochar biomass. More detailed evaluations of biochar absorbents, such as examining surface functional groups using FTIR (Fourier Transform Infrared Spectroscopy), estimating specific surface areas using BET (Brunauer–Emmett–Teller) adsorption instruments, and evaluating biochar surface structures using SEM (scanning electron microscope), are also recommended. In addition, factors in experimental columns, such as the thickness of biochar absorbents, the residence time, and pore volume, can also be tested to provide further evaluation of findings from this study.

4. Conclusions

Infiltration basins and constructed wetlands are some popular BMPs for mitigating flooding, increasing recharge, and replenishing depleted aquifers. However, there are risks of introducing contaminants to aquifers. Different carbon materials for remediation, especially biochar, become popular materials recently due to their adsorption capacity as biochar can be cost effective and remove contaminants efficiently. Parameters for modeling adsorption patterns and reactive transport of lead and ammonia can be novelty pilots for proof-of-concept study and be of interest for many field applications.
This study aims to investigate the hydrologic performance of a soil–biochar column system for field or engineering applications by integrating laboratory experiments and inverse modeling. The findings from this study highlight parameterizations of (i) hydraulic parameters for water flow in porous media, (ii) reactive transport coefficients, and (iii) the adsorption capacity of sand–biochar for both Pb2+ and NH3 removal. This inverse modeling approach to quantify hydraulic parameters and adsorption coefficient offers a labor- and time-efficient solution for critical inputs, i.e., acquired van Genuchten–Mualem hydraulic parameters for sand and biochar, which are needed for forward modeling, engineering design, and field applications. The significantly higher sorption capacity of RH biochar makes it a promising material for remediation applications. The mechanism behind the solute sorption on RH biochar is seemly multifaceted like other biochars, which contributes from combination of physical and chemical interactions between biochars and contaminants.
Adsorption isotherm data from this study can be upscaled and custom-designed according to the field needs. The sorption coefficients and capacity can be used to calculate the amount of biochar required, the costs for an infiltration basin or wetland construction, depending on the size of the basin, targeted field contaminant concentrations, water volume, and water quality targets. More complexity, e.g., other contaminant species, water chemistry, and other water quality parameters in stormwater, can be expanded on in the future. Techno-economic analysis can be addressed in future studies, depending on the required biochar quantity for field-scale contamination. Future studies can also include laboratory experiments that are related to potential impacts with different adsorbent materials and different column boundary conditions. Different types of biochar biomass can be tested in replicates. Despite the useful information provided by this study, further evaluations of biochar absorbents, e.g., surface functional groups, specific surface areas, and biochar surface structures, are also recommended.

Author Contributions

Conceptualization, S.A.P. and C.-L.C.; experimental design, S.A.P. and C.-L.C.; experiments and data analysis, S.A.P. and C.-L.C.; writing—original draft preparation, S.A.P.; writing—review and editing, C.-L.C., M.H., and J.K.; funding acquisition, C.-L.C. All authors have read and agreed to the published version of the manuscript.

Funding

This research was funded by U.S. National Science Foundation.

Data Availability Statement

Data are available upon request.

Acknowledgments

Authors acknowledge graduate assistantship and partial APC support from the School of Earth, Environmental, and Marine Sciences at the University of Texas–Rio Grande Valley. This work is in part supported by NSF Award #2120031. Any opinions, findings, conclusions, or recommendations expressed in this publication are those of the authors and do not necessarily reflect the view of NSF.

Conflicts of Interest

The authors declare no conflicts of interest.

Abbreviations

The following abbreviations are used in this manuscript:
BMPBest Management Practice
Flood-MARFlood-Managed Aquifer Recharge
HYPROPHydraulic Property Analyzer
PFASPerfluoroalkyl and Polyfluoroalkyl Substances
RHRice Husk
SWRCSoil Water Retention Curve

References

  1. California Department of Water Resources Flood-Managed Aquifer Recharge (Flood-MAR). Available online: https://water.ca.gov/programs/all-programs/flood-mar (accessed on 20 January 2025).
  2. Mumberg, T.; Ahrens, L.; Wanner, P. Managed Aquifer Recharge as a Potential Pathway of Contaminants of Emerging Concern into Groundwater Systems—A Systematic Review. Chemosphere 2024, 364, 143030. [Google Scholar] [CrossRef]
  3. Imig, A.; Szabó, Z.; Halytsia, O.; Vrachioli, M.; Kleinert, V.; Rein, A. A Review on Risk Assessment in Managed Aquifer Recharge. Integr. Environ. Assess. Manag. 2022, 18, 1513–1529. [Google Scholar] [CrossRef] [PubMed]
  4. Wu, J.S.; Holman, R.E.; Dorney, J.R. Systematic Evaluation of Pollutant Removal by Urban Wet Detention Ponds. J. Environ. Eng. 1996, 122, 983–988. [Google Scholar] [CrossRef]
  5. Wu, J.S.; Allan, C.J.; Saunders, W.L.; Evett, J.B. Characterization and Pollutant Loading Estimation for Highway Runoff. J. Environ. Eng. 1998, 124, 584–592. [Google Scholar] [CrossRef]
  6. Davis, A.P.; Shokouhian, M.; Ni, S. Loading Estimates of Lead, Copper, Cadmium, and Zinc in Urban Runoff from Specific Sources. Chemosphere 2001, 44, 997–1009. [Google Scholar] [CrossRef]
  7. Barrett, M.E.; Irish, L.B.; Malina, J.F.; Charbeneau, R.J. Characterization of Highway Runoff in Austin, Texas, Area. J. Environ. Eng. 1998, 124, 131–137. [Google Scholar] [CrossRef]
  8. Sansalone, J.J.; Buchberger, S.G. Partitioning and First Flush of Metals in Urban Roadway Storm Water. J. Environ. Eng. 1997, 123, 134–143. [Google Scholar] [CrossRef]
  9. TCEQ. Surface Water Quality Web Reporting Tool. Available online: https://www80.tceq.texas.gov/SwqmisPublic/index.htm (accessed on 25 February 2025).
  10. Maliva, R.G. MAR Pretreatment. In Anthropogenic Aquifer Recharge; Springer: Cham, Switzerland, 2020; Volume 5, pp. 343–379. [Google Scholar]
  11. Idelovitch, E.; Icekson-Tal, N.; Avraham, O.; Michail, M. The Long-Term Performance of Soil Aquifer Treatment (SAT) for Effluent Reuse. Water Supply 2003, 3, 239–246. [Google Scholar] [CrossRef]
  12. Sharma, S.K.; Kennedy, M.D. Soil Aquifer Treatment for Wastewater Treatment and Reuse. Int. Biodeterior. Biodegrad. 2017, 119, 671–677. [Google Scholar] [CrossRef]
  13. Selintung, M.; Mangarengi, N.A.P.; Zubair, A. The Reduction of Heavy Metals Cd and Cr Levels in Wastewater Using Bagasse Charcoal as an Adsorbent. IOP Conf. Ser. Earth Environ. Sci. 2020, 419, 012171. [Google Scholar] [CrossRef]
  14. Vamvuka, D.; Loupasis, E.; Chamilaki, E.; Sdoukou, E. Adsorption of Ammonium from Wastewaters by an Almond Kernel Derived Biochar Modified by Potassium Hydroxide or Dolomite and Activated by Steam. Environ. Adv. 2024, 15, 100465. [Google Scholar] [CrossRef]
  15. Poo, K.-M.; Son, E.-B.; Chang, J.-S.; Ren, X.; Choi, Y.-J.; Chae, K.-J. Biochars Derived from Wasted Marine Macro-Algae (Saccharina Japonica and Sargassum Fusiforme) and Their Potential for Heavy Metal Removal in Aqueous Solution. J. Environ. Manag. 2018, 206, 364–372. [Google Scholar] [CrossRef]
  16. Batool, S.; Idrees, M.; Hussain, Q.; Kong, J. Adsorption of Copper (II) by Using Derived-Farmyard and Poultry Manure Biochars: Efficiency and Mechanism. Chem. Phys. Lett. 2017, 689, 190–198. [Google Scholar] [CrossRef]
  17. Chen, X.; Chen, G.; Chen, L.; Chen, Y.; Lehmann, J.; McBride, M.B.; Hay, A.G. Adsorption of Copper and Zinc by Biochars Produced from Pyrolysis of Hardwood and Corn Straw in Aqueous Solution. Bioresour. Technol. 2011, 102, 8877–8884. [Google Scholar] [CrossRef] [PubMed]
  18. Wijeyawardana, P.; Nanayakkara, N.; Gunasekara, C.; Karunarathna, A.; Law, D.; Pramanik, B.K. Removal of Cu, Pb and Zn from Stormwater Using an Industrially Manufactured Sawdust and Paddy Husk Derived Biochar. Environ. Technol. Innov. 2022, 28, 102640. [Google Scholar] [CrossRef]
  19. Silvani, L.; Cornelissen, G.; Botnen Smebye, A.; Zhang, Y.; Okkenhaug, G.; Zimmerman, A.R.; Thune, G.; Sævarsson, H.; Hale, S.E. Can Biochar and Designer Biochar Be Used to Remediate Per- and Polyfluorinated Alkyl Substances (PFAS) and Lead and Antimony Contaminated Soils? Sci. Total Environ. 2019, 694, 133693. [Google Scholar] [CrossRef]
  20. Hasan, M.S.; Vasquez, R.; Geza, M. Application of Biochar in Stormwater Treatment: Experimental and Modeling Investigation. Processes 2021, 9, 860. [Google Scholar] [CrossRef]
  21. Liang, B.; Lehmann, J.; Solomon, D.; Kinyangi, J.; Grossman, J.; O’Neill, B.; Skjemstad, J.O.; Thies, J.; Luizão, F.J.; Petersen, J.; et al. Black Carbon Increases Cation Exchange Capacity in Soils. Soil Sci. Soc. Am. J. 2006, 70, 1719–1730. [Google Scholar] [CrossRef]
  22. Ahmad, M.; Rajapaksha, A.U.; Lim, J.E.; Zhang, M.; Bolan, N.; Mohan, D.; Vithanage, M.; Lee, S.S.; Ok, Y.S. Biochar as a Sorbent for Contaminant Management in Soil and Water: A Review. Chemosphere 2014, 99, 19–33. [Google Scholar] [CrossRef]
  23. Rahmat, A.; Nissa, R.C.; Nuraini, L.; Nurtanto, M.; Ramadhani, W.S. Analysis of Rice Husk Biochar Characteristics under Different Pyrolysis Temperature. IOP Conf. Ser. Earth Environ. Sci. 2023, 1201, 012095. [Google Scholar] [CrossRef]
  24. Wang, J.; Guo, X. Adsorption Isotherm Models: Classification, Physical Meaning, Application and Solving Method. Chemosphere 2020, 258, 127279. [Google Scholar] [CrossRef]
  25. Guo, X.; Wang, J. The Phenomenological Mass Transfer Kinetics Model for Sr2+ Sorption onto Spheroids Primary Microplastics. Environ. Pollut. 2019, 250, 737–745. [Google Scholar] [CrossRef] [PubMed]
  26. Guo, X.; Wang, J. Comparison of Linearization Methods for Modeling the Langmuir Adsorption Isotherm. J. Mol. Liq. 2019, 296, 111850. [Google Scholar] [CrossRef]
  27. Langmuir, I. The Adsorption of Gases on Plane Surfaces of Glass, Mica and Platinum. J. Am. Chem. Soc. 1918, 40, 1361–1403. [Google Scholar] [CrossRef]
  28. Langmuir, I. The Constitution and Fundamental Properties of Solids and Liquids. Part I. Solids. J. Am. Chem. Soc. 1916, 38, 2221–2295. [Google Scholar] [CrossRef]
  29. Freundlich, H. Über Die Adsorption in Lösungen. Z. Phys. Chemie 1907, 57U, 385–470. [Google Scholar] [CrossRef]
  30. Zaheer, Z.; AL-Asfar, A.; Aazam, E.S. Adsorption of Methyl Red on Biogenic Ag@Fe Nanocomposite Adsorbent: Isotherms, Kinetics and Mechanisms. J. Mol. Liq. 2019, 283, 287–298. [Google Scholar] [CrossRef]
  31. Wang, F.; Shih, K. Adsorption of Perfluorooctanesulfonate (PFOS) and Perfluorooctanoate (PFOA) on Alumina: Influence of Solution PH and Cations. Water Res. 2011, 45, 2925–2930. [Google Scholar] [CrossRef]
  32. PC-PROGRESS Engineering Software Developer. The HYDRUS 1D Description. Available online: https://www.pc-progress.com/en/Default.aspx?h1d-description (accessed on 4 February 2025).
  33. PC-PROGRESS Engineering Software Developer. HYDRUS 3D Help Inverse Solution. Available online: https://www.pc-progress.com/en/OnlineHelp/HYDRUS3/Hydrus.html?InverseSolution.html (accessed on 28 January 2025).
  34. Vrugt, J.A.; Stauffer, P.H.; Wöhling, T.; Robinson, B.A.; Vesselinov, V.V. Inverse Modeling of Subsurface Flow and Transport Properties: A Review with New Developments. Vadose Zone J. 2008, 7, 843–864. [Google Scholar] [CrossRef]
  35. Pal, S.; Mukherjee, S.; Ghosh, S. Application of HYDRUS 1D Model for Assessment of Phenol–Soil Adsorption Dynamics. Environ. Sci. Pollut. Res. 2014, 21, 5249–5261. [Google Scholar] [CrossRef]
  36. do Nascimento, Í.V.; de Assis Júnior, R.N.; de Araújo, J.C.; de Alencar, T.L.; Freire, A.G.; Lobato, M.G.R.; da Silva, C.P.; Mota, J.C.A.; do Nascimento, C.D.V. Estimation of van Genuchten Equation Parameters in Laboratory and through Inverse Modeling with Hydrus-1D. J. Agric. Sci. 2018, 10, 102. [Google Scholar] [CrossRef]
  37. Šimůnek, J.; van Genuchten, M.T. Modeling Nonequilibrium Flow and Transport Processes Using HYDRUS. Vadose Zone J. 2008, 7, 782–797. [Google Scholar] [CrossRef]
  38. Emerson, K.; Russo, R.C.; Lund, R.E.; Thurston, R.V. Aqueous Ammonia Equilibrium Calculations: Effect of PH and Temperature. J. Fish. Res. Board Can. 1975, 32, 2379–2383. [Google Scholar] [CrossRef]
  39. Russo, R.C. Ammonia, Nitrite, and Nitrate. In Fundamentals of Aquatic Toxicology and Chemistry; Rand, G.M., Petrocelli, S.R., Eds.; Hemisphere Publishing Corp.: Washington, DC, USA, 1985; pp. 455–471. [Google Scholar]
  40. Amazon SAYOYO Horticultural Charcoal—Natural Biochar Soil Amendment, Rice Husk Charcoal for Plants, Activated Charcoal for Terrariums 0.6 Lbs. Available online: https://a.co/d/cm0Y1Hk (accessed on 2 February 2025).
  41. Leng, L.; Xiong, Q.; Yang, L.; Li, H.; Zhou, Y.; Zhang, W.; Jiang, S.; Li, H.; Huang, H. An Overview on Engineering the Surface Area and Porosity of Biochar. Sci. Total Environ. 2021, 763, 144204. [Google Scholar] [CrossRef] [PubMed]
  42. Richards, L.A. Capillary Conduction of Liquids Through Porous Mediums. Physics 1931, 1, 318–333. [Google Scholar] [CrossRef]
  43. van Genuchten, M.T. A Closed-form Equation for Predicting the Hydraulic Conductivity of Unsaturated Soils. Soil Sci. Soc. Am. J. 1980, 44, 892–898. [Google Scholar] [CrossRef]
  44. Simunek and Sejna HYDRUS Soil Hydraulic Models. Available online: https://www.pc-progress.com/en/OnlineHelp/HYDRUS3/Hydrus.html?SoilHydraulicModels.html (accessed on 29 January 2025).
  45. Shokrana, M.S.B.; Ghane, E. Measurement of Soil Water Characteristic Curve Using HYPROP2. MethodsX 2020, 7, 100840. [Google Scholar] [CrossRef]
  46. Freeze, R.A.; Cherry, J.A. Groundwater; Prentice-Hall: Englewood Cliffs, NJ, USA, 1979. [Google Scholar]
  47. Devereux, R.C.; Sturrock, C.J.; Mooney, S.J. The Effects of Biochar on Soil Physical Properties and Winter Wheat Growth. Earth Environ. Sci. Trans. R. Soc. Edinb. 2012, 103, 13–18. [Google Scholar] [CrossRef]
  48. Omondi, M.O.; Xia, X.; Nahayo, A.; Liu, X.; Korai, P.K.; Pan, G. Quantification of Biochar Effects on Soil Hydrological Properties Using Meta-Analysis of Literature Data. Geoderma 2016, 274, 28–34. [Google Scholar] [CrossRef]
  49. Huang, C.; Chen, Y.; Jin, L.; Yang, B. Properties of Biochars Derived from Different Straw at 500 °C Pyrolytic Temperature: Implications for Their Use to Improving Acidic Soil Water Retention. Agric. Water Manag. 2024, 301, 108953. [Google Scholar] [CrossRef]
  50. Minnesota Pollution Control Agency Determining Soil Infiltration Rates. Available online: http://stormwater.pca.state.mn.us/index.php/Determining_soil_infiltration_rates (accessed on 1 February 2025).
  51. USEPA. Stormwater Best Management Practice Infiltration Basin; USEPA: Washington, DC, USA, 2021. [Google Scholar]
  52. Nguyen, K.T.; Ahmed, M.B.; Mojiri, A.; Huang, Y.; Zhou, J.L.; Li, D. Advances in As Contamination and Adsorption in Soil for Effective Management. J. Environ. Manag. 2021, 296, 113274. [Google Scholar] [CrossRef] [PubMed]
  53. Ghosal, P.S.; Gupta, A.K. Development of a Generalized Adsorption Isotherm Model at Solid-Liquid Interface: A Novel Approach. J. Mol. Liq. 2017, 240, 21–24. [Google Scholar] [CrossRef]
  54. Mobasherpour, I.; Salahi, E.; Pazouki, M. Comparative of the Removal of Pb2+, Cd2+ and Ni2+ by Nano Crystallite Hydroxyapatite from Aqueous Solutions: Adsorption Isotherm Study. Arab. J. Chem. 2012, 5, 439–446. [Google Scholar] [CrossRef]
  55. Sidey, V. On the Effective Ionic Radii for Ammonium. Acta Crystallogr. B Struct. Sci. Cryst. Eng. Mater. 2016, 72, 626–633. [Google Scholar] [CrossRef]
  56. Jaffrezic-Renault, N.; Dzyadevych, S.V. Conductometric Microbiosensors for Environmental Monitoring. Sensors 2008, 8, 2569–2588. [Google Scholar] [CrossRef] [PubMed]
  57. Severo, F.F.; da Silva, L.S.; Moscôso, J.S.C.; Sarfaraz, Q.; Rodrigues Júnior, L.F.; Lopes, A.F.; Marzari, L.B.; Molin, G.D. Chemical and Physical Characterization of Rice Husk Biochar and Ashes and Their Iron Adsorption Capacity. SN Appl. Sci. 2020, 2, 1286. [Google Scholar] [CrossRef]
  58. Persson, I. Hydrated Metal Ions in Aqueous Solution: How Regular Are Their Structures? Pure Appl. Chem. 2010, 82, 1901–1917. [Google Scholar] [CrossRef]
  59. Pye, C.C.; Gunasekara, C.M. An Ab Initio Investigation of the Hydration of Lead(II). Liquids 2022, 2, 39–49. [Google Scholar] [CrossRef]
  60. Babiaczyk, W.I.; Bonella, S.; Guidoni, L.; Ciccotti, G. Hydration Structure of the Quaternary Ammonium Cations. J. Phys. Chem. B 2010, 114, 15018–15028. [Google Scholar] [CrossRef]
  61. Granados, P.; Mireles, S.; Pereira, E.; Cheng, C.-L.; Kang, J.J. Effects of Biochar Production Methods and Biomass Types on Lead Removal from Aqueous Solution. Appl. Sci. 2022, 12, 5040. [Google Scholar] [CrossRef]
  62. Cheng, C.-L.; Perfect, E.; Mills, R.T. Forward Prediction of Height-Averaged Capillary Pressure–Saturation Parameters Using the BC-vG Upscaler. Vadose Zone J. 2013, 12, vzj2012-0174. [Google Scholar] [CrossRef]
  63. Cropper, S.C.; Perfect, E.; Cheng, C.-L.; McKay, L.; Kang, M. Evaluation of TrueCell Program for Estimating Point Capillary Pressure—Saturation Parameters for Flint Sand. Geoderma 2017, 287, 90–97. [Google Scholar] [CrossRef]
Figure 1. (a) S column: 30 cm sand-filled column; (b) SBS column: 12-3-15 cm (30 cm total) sand–biochar–sand filled column. (S: sand; SBS: sand-biochar-sand).
Water 17 01372 g001
Figure 2. Detailed workflow for the optimization of the hydraulic parameters and adsorption isotherms with experimental data using the HYDRUS inverse model.
Water 17 01372 g002
Figure 3. Observed vs. fitted models (linear, Langmuir, Freundlich) for sand and biochar: (a) lead (Pb2+) linear adsorption isotherm, (b) ammonia (NH3) linear adsorption isotherm, (c) Pb2+ Langmuir adsorption isotherm, (d) NH3 Langmuir adsorption isotherm, (e) Pb2+ Freundlich adsorption isotherm, and (f) NH3 Freundlich adsorption isotherm (sand: color blue; biochar: color red; lead: left columns; ammonia: right columns).
Water 17 01372 g003aWater 17 01372 g003b
Table 1. The van Genuchten Mualem hydraulic parameters of sand and biochar.
MaterialResidual Soil Water Content
Θr
-
Saturated Soil
Water Content
Θs
-
Inverse of the Air-Entry Pressure
α
(1/cm)
Pore Size
Distribution
n
-
Hydraulic
Conductivity
K
(cm/min)
Sand (HYPROP2)0.0450.4390.07251.10.14
RH Biochar
(Optimized)
0.2130.7280.07772.9130.008753
Table 2. Optimized adsorption coefficients, statistical criteria, and sorption capacity of the sand–biochar for lead (Pb2+) and ammonia (NH3).
AdsorbentAdsorbateModelKd
(cm3/mg)
η
(cm3/mg)
β
(-)
R2
(-)
RMSE
(mg/L)
AIC
(-)
Sorption,
s
(mg/g)
SandPb2+Linear0.05845--0.993160.07824−62.290.117
Langmuir *0.059160.000048-0.993540.0801−65.370.118
Freundlich0.03728-1.1330.974680.1312−49.850.033
NH3Linear0.00169--0.744251.22981.260.084
Langmuir *0.0020820.005016-0.744371.22966.370.104
Freundlich0.002001-1.0370.745031.22983.260.090
BiocharPb2+Linear1.99--0.766310.1793−28.443.980
Langmuir1.95890.000321-0.767510.1765−26.673.918
Freundlich *2.4216-1.0010.76810.1768−28.654.813
NH3Linear0.1467--0.806461.063100.27.335
Langmuir0.15630.0001-0.806521.067102.47.812
Freundlich *0.167-1.10.806721.042100.26.188
Note(s): * indicates best model performance.
Disclaimer/Publisher’s Note: The statements, opinions and data contained in all publications are solely those of the individual author(s) and contributor(s) and not of MDPI and/or the editor(s). MDPI and/or the editor(s) disclaim responsibility for any injury to people or property resulting from any ideas, methods, instructions or products referred to in the content.

