Article

Using Salinity, Water Level, CFCs, and CCl4 to Assess Groundwater Flow Dynamics and Potential N2O Flux in the Intertidal Zone of Sanya, Hainan Province: Implications for Evaluating Freshwater Submarine Groundwater Discharge in Coastal Unconfined Aquifers

1
Academician Zhai Mingguo Workstation, Sanya University, Sanya 572000, China
2
State Key Laboratory of Lithospheric and Environmental Coevolution, Institute of Geology and Geophysics, Chinese Academy of Sciences, Beijing 100029, China
3
Environmental Big Data and Digital Governance Key Laboratory of Philosophy and Social Sciences, Sanya 572000, China
*
Author to whom correspondence should be addressed.
Water 2025, 17(9), 1371; https://doi.org/10.3390/w17091371
Submission received: 24 March 2025 / Revised: 28 April 2025 / Accepted: 28 April 2025 / Published: 1 May 2025
(This article belongs to the Special Issue Groundwater Flow and Transport Modeling in Aquifer Systems)

Abstract

:
This study combines field and laboratory analyses from seven shallow wells (ZK1 to ZK7) positioned perpendicular to the coastline to investigate groundwater discharge and dynamics in the coastal unconfined aquifer of the intertidal zone at Yazhou Bay, Sanya, Hainan Province. The research highlights spatial variations in N2O concentration, temperature, electrical conductivity (EC), pH, and the distribution of CFCs and CCl4 in shallow groundwater, utilizing samples from wells ZK1 to ZK7 and seawater collected near ZK1. Key findings indicate that groundwater temperature decreases toward the ocean, while EC exhibits a stepwise increase from land to sea, with a sharp transition near ZK3 marking the freshwater–saltwater mixing zone. pH values are lowest in ZK3 and ZK4, gradually rising both inland and seaward. N2O concentrations in the shallow wells (ZK1–ZK7) are divided into two distinct groups: higher concentrations (9.69–57.77 nmol/kg) in ZK5–ZK7 and lower concentrations (6.63–23.03 nmol/kg) in ZK1–ZK4. Wells ZK3 and ZK4 show minimal variation in CFC-11 and CFC-113 concentrations, suggesting they represent a transition zone that likely delineates groundwater flow paths. In contrast, significant concentration differences in wells ZK5–ZK7 (north) and ZK1–ZK2 (south) reflect the influence of aquifer structure variability, recharge sources, and local hydrogeochemical conditions. CFC-12 concentrations exhibit a clear freshwater–saltwater mixing gradient between ZK3 and ZK1, with higher concentrations in freshwater-dominated areas (ZK3–ZK7) and lower concentrations near seawater (ZK1). CCl4 concentrations at ZK7 and ZK3 differ markedly from other wells, indicating unique hydrogeochemical conditions or localized anthropogenic influences. A model for the formation of upper saline plumes (USP) under tidal forcing at the low tidal line was established previously. Here, we establish a new model that accounts for the absence of USP driven by hydrological processes influenced by artificial sandy beach topography, and a fresh groundwater wedge is identified, which can serve as a significant fast-flow pathway for terrestrial water and nutrients to the ocean.

1. Introduction

Coastal zones, particularly intertidal areas, serve as dynamic interfaces for land–sea interactions, characterized by complex and highly variable hydrogeological processes [1,2]. These regions are increasingly recognized as potential hotspots for nitrous oxide (N2O) production and emission, a potent greenhouse gas with significant implications for global climate change [3,4]. Submarine groundwater discharge (SGD), defined as the process by which groundwater flows into the ocean through the seabed or intertidal zone, encompasses both freshwater and recirculated seawater [5,6]. SGD plays a critical role in coastal nutrient cycling and greenhouse gas dynamics [7,8], as nitrogen compounds transported by SGD can undergo microbial transformations, such as nitrification (the oxidation of ammonium (NH4+) to nitrate (NO3)) and denitrification (the reduction of NO3 into N-containing gases) [9,10]. These processes can lead to the production and release of N2O, a greenhouse gas with a global warming potential 298 times greater than that of carbon dioxide [11]. However, accurately quantifying SGD remains a significant challenge due to its high temporal and spatial variability. Discrepancies often arise between simulated terrestrial freshwater fluxes and field-measured data, particularly when relying on seawater tracers for indirect interpretation [12].
Current methods for estimating SGD include: (1) Seepage Flux Observation: direct measurement of groundwater seepage [13]; (2) Environmental Isotope Tracers: use of radioactive isotopes (e.g., 222Rn and 226Ra) to indirectly estimate groundwater discharge [14]; (3) Porewater Chloride Profiles: analysis of chloride concentration profiles in porewater to infer groundwater discharge processes [15]; (4) Numerical Simulation: mathematical modeling of groundwater flow and discharge processes [16]; (5) Geophysical Measurements: detection of groundwater discharge characteristics using geophysical techniques [17].
Despite these methods, significant limitations persist. For instance, SGD flux calculations often require homogenizing hydrological parameters (e.g., hydraulic conductivity and hydraulic gradient) over large coastal seepage zones, which oversimplifies the complex hydrogeological conditions of coastal areas. This homogenization approach can lead to substantial deviations, sometimes comparable to the actual SGD flux [18], thereby reducing the accuracy of estimates. Additionally, the strong spatial variability of coastal aquifers, influenced by tidal effects, seawater intrusion, and sediment characteristics, further complicates the estimation process.
Submarine groundwater discharge (SGD) has been recognized as a globally significant process that may rival or even exceed riverine inputs in terms of both freshwater volume and chemical fluxes to coastal oceans [19,20]. While these studies suggest SGD’s potential dominance over riverine transport at regional scales, comprehensive assessments of groundwater-derived chemical loads remain limited to relatively few study sites worldwide [19].
Particularly scarce are studies that differentiate between fresh and saline components of SGD, despite their distinct hydrogeochemical characteristics and ecological impacts. This knowledge gap persists because SGD remains one of the least quantified and most poorly understood processes in coastal aquifer systems [21]. To separate quantification of fresh versus saline SGD contributions relative to riverine inputs [21], conducted a comprehensive study in Tampa Bay that employed three complementary approaches Darcy’s law-based calculations of fresh groundwater flux, watershed-scale water budget analysis and Radon-222 mass balance in nearshore waters.
We have measured Rn-222 for coastal seawater in the study area, finding that coastal seawater is low in Rn-222, even close to the lower limit of Rn detector. Hence, this work intentionally adopts Darcy’s law-based calculations of fresh groundwater flux along the entire coastal boundary of Sanya administrative district and assessment for the contribution of anthropogenic activities to groundwater and seawater. The quantitative assessment could enable direct comparison between terrestrial groundwater discharge and surface water fluxes in the study area.
This study focuses on a small-scale basin characterized by Triassic granite basement overlain by Cenozoic sedimentary deposits (ranging from tens to hundreds of meters in thickness). The results indicates that groundwater discharge rates were found to be substantially lower than concurrent riverine flux. This contrasts with numerous studies reporting dominant submarine groundwater discharge (SGD) contributions in coastal systems, and it demonstrates significant spatial variability in coastal water budgets and highlights that SGD-dominated systems may not represent universal conditions, suggesting the case-specific hydrogeological controls on discharge patterns. Studies have been conducted on infiltration zones; however, there is a notable lack of research on the impact of high coastal erosion beaches, particularly artificial reclaimed beaches. The continuous seaward expansion of artificial beaches has significantly altered the original natural coastline. The effects of such anthropogenic modifications on the groundwater circulation system in coastal areas remain poorly understood and require further investigation.
Carbon tetrachloride (CCl4) and chlorofluorocarbons (CFCs), once widely used as solvents and refrigerants, are man-made ozone-depleting substances (ODSs) that contribute to stratospheric ozone depletion. Following the Montreal Protocol, global production and consumption of ODSs have been phased out, leading to a decline in emissions. However, localized anomalous emissions persist, indicating ongoing production and consumption in certain regions. CCl4, a first-generation ODS with an ozone depletion potential of 0.87 and a global warming potential of 2150 [22], has recently shown increasing emissions in eastern China, likely originating from industrial sources such as machinery manufacturing and chemical production [23]. This trend may also contribute to increased emissions of trichlorofluoromethane (CFC-11) [24] and dichlorodifluoromethane (CFC-12), which are often coproduced with CCl4 [25]. In contrast, new production of trichlorotrifluoroethane (CFC-113) has not been reported in recent years.
Gaseous components, including CFCs (e.g., CCl3F (CFC-11), CCl2F2 (CFC-12), and C2Cl3F3 (CFC-113)), dissolve into precipitation through gas–water interactions and subsequently infiltrate groundwater as part of precipitation recharge. CFCs are widely utilized in hydrogeological studies for various purposes, including determining groundwater age [26,27] and identifying pollutant sources [28]. Their unique properties make them valuable tracers for characterizing flow dynamics in intertidal groundwater systems.
Artificial beaches, constructed for tourism and coastal protection in Sanya, have altered natural sediment composition and hydrological processes, disrupting the natural interface between seawater and freshwater. The introduction of non-native sand can affect permeability, potentially reducing groundwater recharge rates and altering groundwater flow and quality. The intertidal zone of Sanya, Hainan Province, is characterized by complex hydrogeological conditions, including porous and fissure aquifers, seasonal river systems, and significant tidal influences. These factors create dynamic environments where groundwater–surface water interactions play a crucial role in nutrient cycling and greenhouse gas fluxes. Shallow groundwater in this region, particularly in the Quaternary aquifer, is often enriched with nitrogen compounds due to anthropogenic activities (e.g., agriculture and urbanization) and natural processes. Under specific redox conditions, these nitrogen compounds can be transformed into N2O through microbial processes such as nitrification and denitrification.
This study conducted observations through shallow wells during construction, focusing on three key aspects: (1) Groundwater Distribution in Proximity to Estuaries: analysis of groundwater flow patterns and their spatial variability near river mouths; (2) Nutrient Distribution: examination of the spatial and temporal distribution of nutrients within the groundwater system; and (3) Groundwater Flux Estimation: quantification of groundwater discharge rates and their potential environmental impacts.
CFCs and CCl4 groundwater tracing methods were employed to determine groundwater flow conditions and constrain hydrogeological factors and hydrochemical processes. These observations aim to provide insights into the interactions between artificial beach construction, groundwater dynamics, and coastal ecosystems, contributing to a better understanding of the environmental implications of human interventions in coastal zones.

2. Materials and Methods

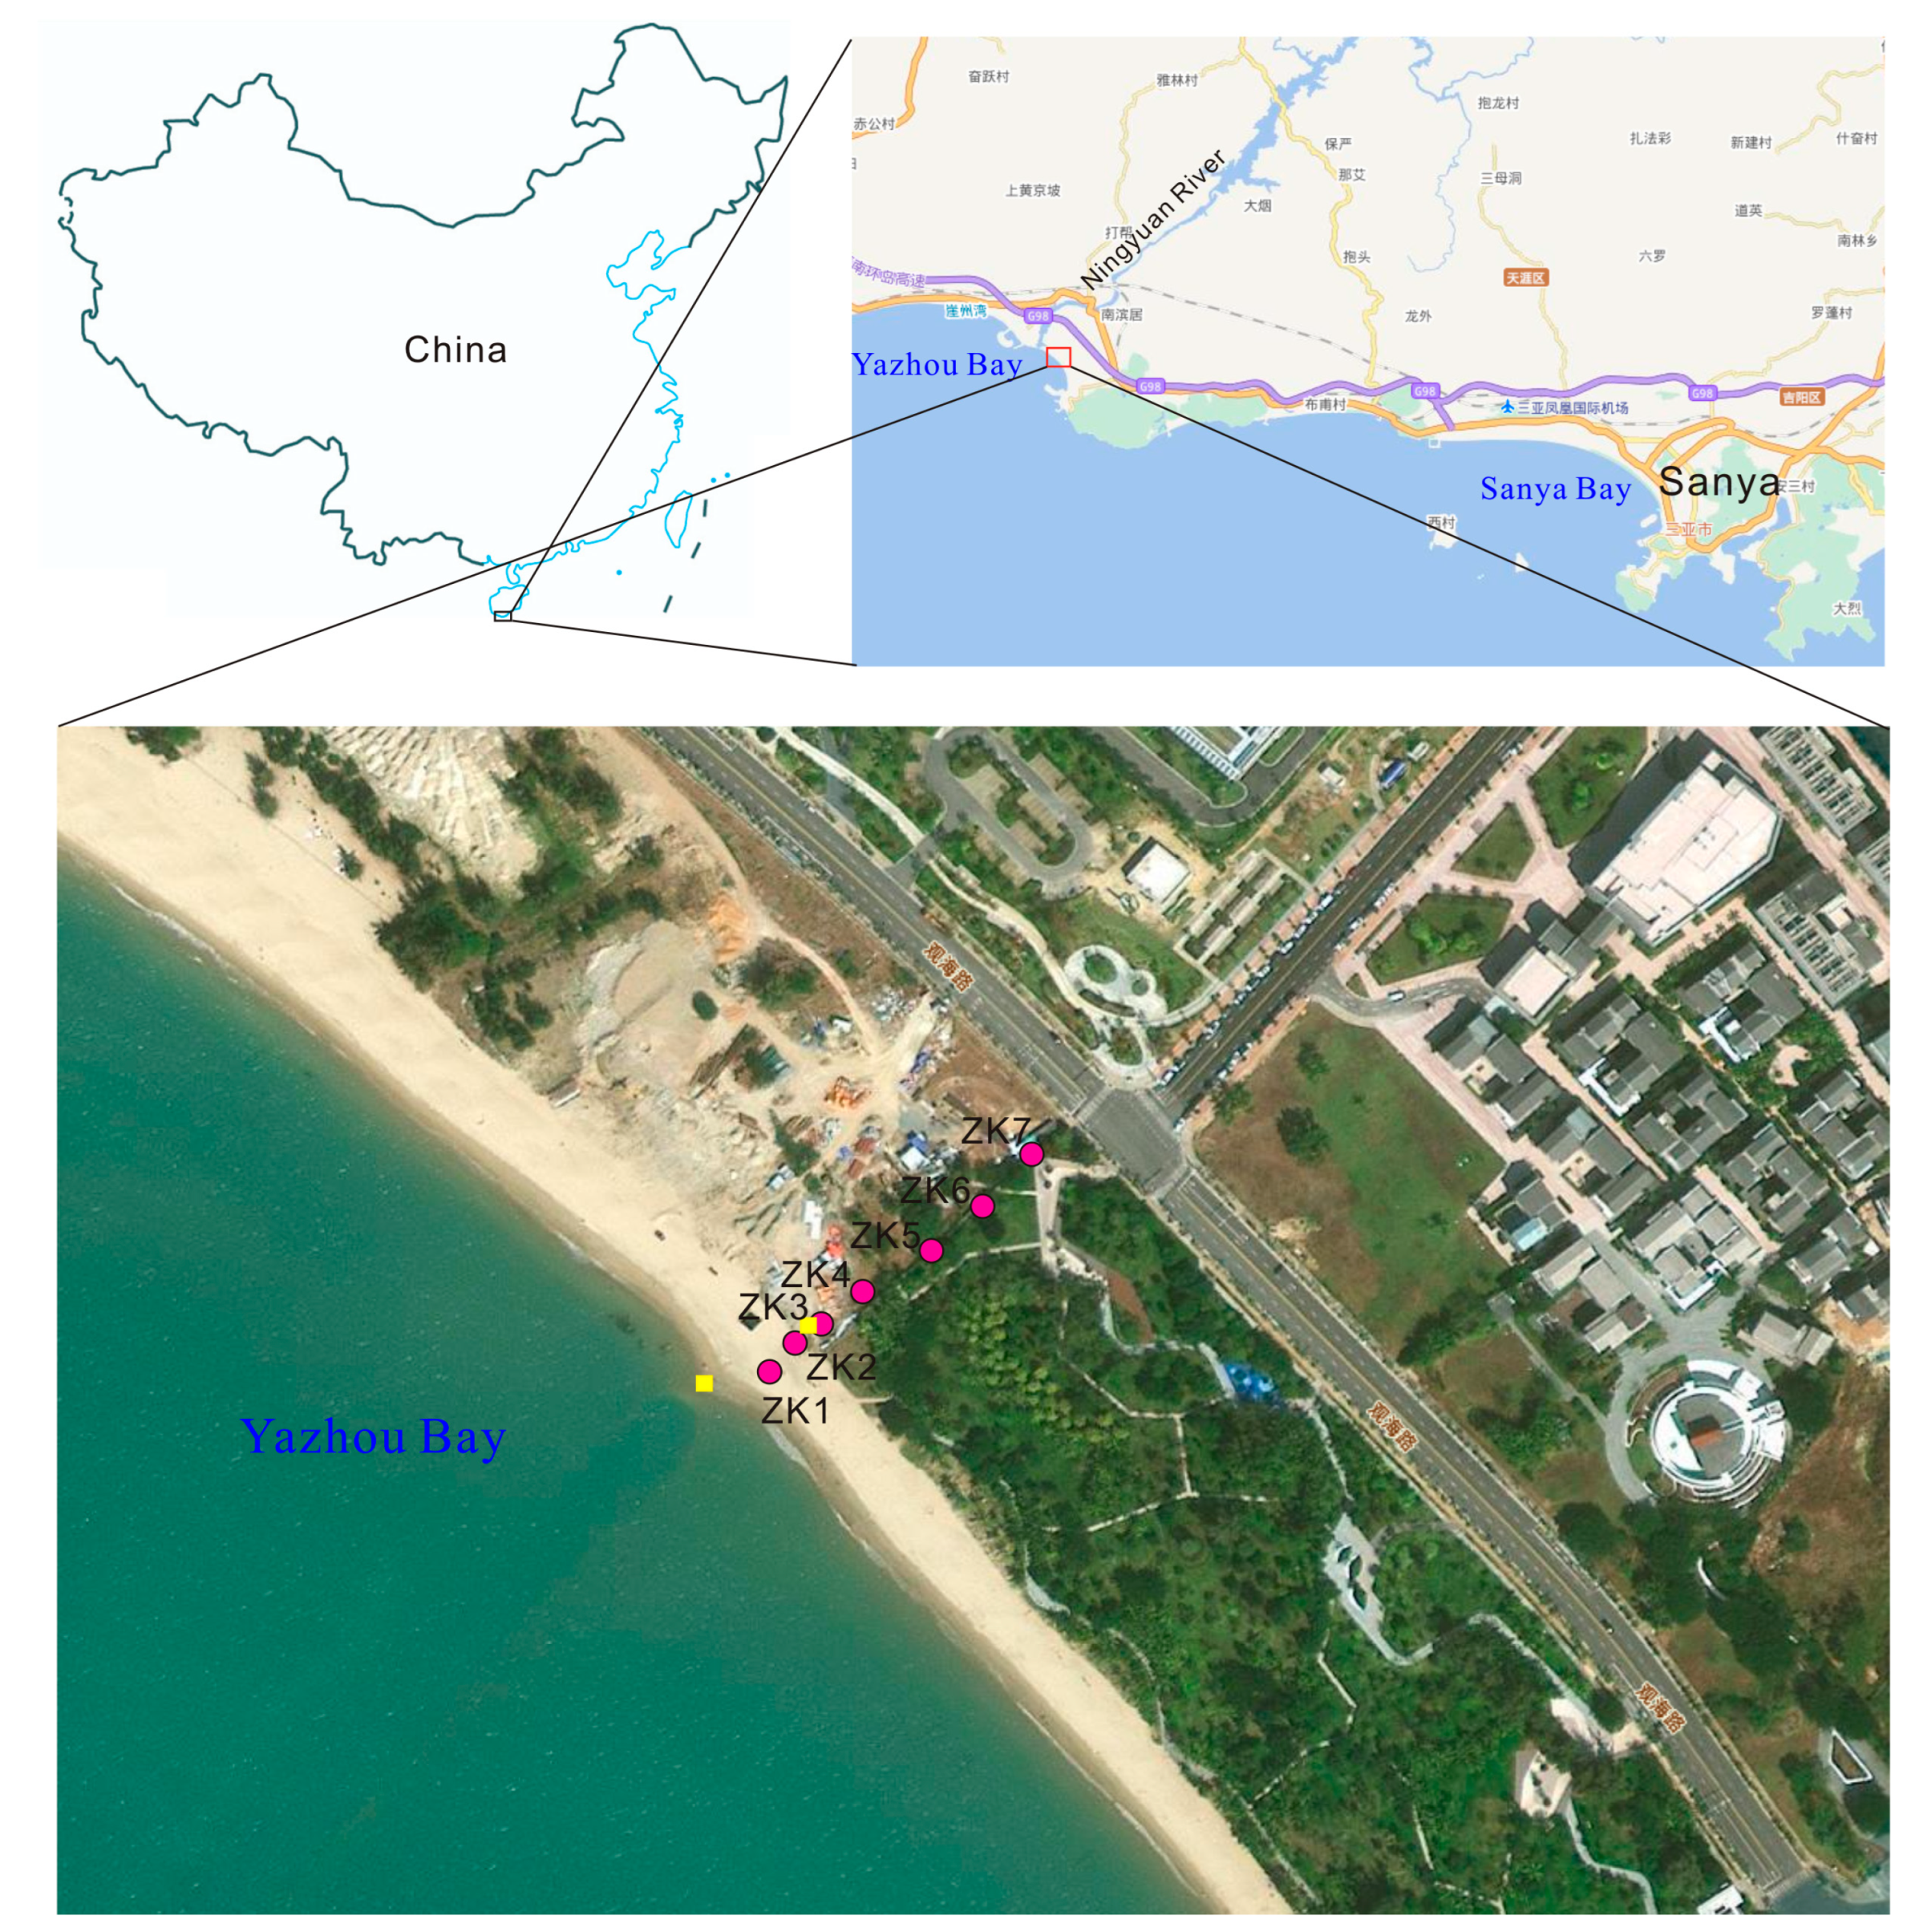
2.1. Site Description

  • Geological Background of Yazhou District, Sanya
Yazhou District is situated on the northern passive continental margin of the South China Sea, forming part of the southern Hainan rift system. The region’s geological framework is primarily controlled by NE-trending Yazhou Fault (right-lateral strike-slip) and the regional Jiuluo-Lingshui deep fault systems. These fault systems collectively form a characteristic fault-bounded basin structure. Basement Rocks are a Precambrian Baoban Group exposed in northern hilly areas, consisting of gneiss and granulite (~1.4 billion years old). Paleozoic Sedimentary Rocks are limited limestone and clastic rocks, heavily deformed by later tectonics. Figure 1 shows that Mesozoic Igneous Rocks are Yanshanian (Jurassic-Cretaceous) granites (e.g., biotite granite) that dominate the northern hills. Cenozoic Sediments are Paleogene-Neogene sandstone, mudstone, and lignite layers (Yazhou Formation) deposited in a lacustrine–swamp environment. Quaternary alluvial deposits (sand, gravel, clay) along the Ningyuan River. Marine deposits (coral reefs, shell sands) along the coast (e.g., Meilian Village). Lithology and Geomorphology: the Northern Hilly Area consists of Weathered granite landforms (e.g., spherical boulders near Nanshan Temple). The Central Basin consists of gentle slopes with Cenozoic sediments, supporting agriculture. The Southern Coastal Zone consists of coral reef platforms (e.g., Jiaotou Bay) and sandy beaches (quartz sand mixed with bioclasts).
2.
Hydrogeological Background of Yazhou District
In the Sanya area of Hainan Island, the groundwater system is primarily divided into three types: (1) shallow unconfined porous water in the upper Quaternary loose sediments; (2) confined porous water in the middle loose to semi-consolidated sediments; and (3) fractured water in the lower massive bedrock. These groundwater types exhibit significant differences in spatial distribution, water abundance, and development potential.
The shallow unconfined porous aquifer in the upper Quaternary sediments is mainly distributed in the shallow subsurface, with aquifer thickness ranging from 0.6 to 4.6 m, showing a gradual thickening trend from north to south. The water table depth ranges from 2.65 to 4.28 m, and the aquifer is primarily composed of loose fine sand and medium sand. This unconfined aquifer is mainly recharged by precipitation and surface runoff. The well yield ranges from 20 to 56 m3/d, indicating generally poor water abundance. The aquitard between the unconfined and confined aquifers is composed of silty clay, gravelly silty clay, and clayey sand.
The confined aquifer is mainly composed of loose to semi-consolidated rocks, with lithologies including clayey gravelly sand, gravelly clayey sand, medium-coarse sand, and gravelly soil. The top of the confined aquifer is buried at a depth of 19.8 to 60.2 m, with a thickness ranging from 2.1 to 44.8 m. The hydraulic conductivity (k) ranges from 0.42 to 5.30 m/day. To the north of the coastal zone lies a plain area with flat terrain, where the hydraulic gradient of shallow groundwater is small, 0.0078, resulting in relatively slow groundwater flow.
The water table of the unconfined aquifer is relatively higher than that of the confined aquifer, allowing downward leakage recharge to the confined aquifer. This may be one reason of the unconfined aquifer is poor of water storage.
The shallow Quaternary aquifer has undergone anthropogenic modifications due to the ongoing urbanization. The surface layer of the beach is artificially piled sand that consists of fine to coarse grained sand. The original seepage zone has shifted the location or coved by overlain artificial piled sand due to the alteration of the original beach topography. Over time, through a process of equilibration, the artificially piled sand could transform into a proxy of natural beach.
On the eastern side of the profile, a new coastal park has been constructed and covered with lawn. The lawn is regularly irrigated and treated with granular chemical fertilizers. As a result, the shallow groundwater in this area is likely recharged by irrigation water, with nitrogen components entering the aquifer.
The Ningyuan river is the largest in Sanya and the fourth largest in the Hainan Island. It originates from the southern foothills of the Xian’an Stone Forest in Maogan Township, located in the western part of Baoting Li and Miao Autonomous County, and it eventually flows into the South China Sea at Gangmen Village, Yazhou District, Sanya City. The total length of the Ningyuan River’s mainstream is 83.5 km. From its source to its estuary, the Ningyuan River has an elevation drop of 1101 m. The average annual runoff of the Ningyuan River is 649 million cubic meters per year, equivalent to a water flow rate of 20.6 cubic meters per second. After deducting the upstream reservoir storage of 306 million cubic meters, the downstream runoff into the sea amounts to 343 million cubic meters.

2.2. Drilling Shallow Wells and On-Site Testing

In terms of drilling technology, the air-lift reverse circulation rotary drill method was employed. While this technique provides high construction efficiency, the use of high-pressure air has the potential to disturb the formation structure. To mitigate this, a sufficient resting period (no less than 72 h) was allowed after drilling to enable the groundwater system to stabilize and return to its natural state, thereby ensuring the representativeness of the collected samples.
On 14 December 2023, a north–south oriented monitoring transect was established perpendicular to the coastline on the eastern side of the Ningyuan River estuary in Yazhou Bay (Figure 2). Along a 145 m profile, seven shallow monitoring wells were installed. Each well was constructed using 100 mm diameter PVC casing, drilled to a depth of 6 m. The PVC tubing was screened at 1 m intervals.
The well distribution reflects distinct hydrogeological zones: ZK1 is located in the lower intertidal zone, while ZK2 occupies the upper intertidal zone, both subject to seawater intrusion. Wells ZK3–ZK7 are positioned landward of the upper intertidal boundary, maintaining freshwater conditions. Sediment infiltration through the unsealed well bottoms has reduced the effective monitoring depth to approximately 4 m in wells ZK1–ZK4, as evidenced by 1–2 m of sediment accumulation indicated by the blue-filled sections in Figure 3.
Preliminary pumping tests conducted using an 8 L/min submersible pump revealed rapid hydraulic responses: water levels declined within 1–2 min of pumping initiation and recovered completely within 1–2 min after cessation. This behavior suggests limited aquifer storage capacity and the absence of a regional flow system. The observed hydrogeological characteristics indicate that groundwater primarily exists as localized perched water bodies. The minimal well yield further suggests that the unconfined aquifer is either weakly connected to the river system or located at the distal margin of the groundwater discharge zone near the estuary.

2.3. Sampling and Measurement

Samples were collected twice a day, with temperature, electrical conductivity (salinity), and pH measured on-site, while other parameters were analyzed in the laboratory. The sampling process strictly adheres to hydrogeological sampling protocols. A miniature submersible pump is used to draw water into a metal bucket. The WTW Multi 3430 multiparameter water quality analyzer was used to monitor real-time parameters such as pH, dissolved oxygen (DO), electrical conductivity (EC), and temperature (T) of river water.
The sample bottles (100 mL) were then placed in the bucket and repeatedly rinsed to ensure cleanliness. Once the water flow stabilized and no bubbles remained in the bottles, the sample bottles were sealed underwater, and the bottles were inverted to check for no bubbles. The bottle mouths were reinforced with waterproof tape, labeled with sample information, and stored in a cool place at 4 °C. This standardized sampling method maximizes the preservation of the sample’s originality and representativeness, providing a reliable foundation for subsequent hydrochemical analysis.
All samples were sent to the laboratory for further analysis. For N2O and CFCs samples, 100 mL glass bottles were used, while plastic bottles were used for hydrochemical samples. In the laboratory, the major ion components of freshwater hydrochemistry were measured using a Dionex 120 ion chromatograph, while nitrate (NO3), ammonium (NH4+), and nitrite (NO2) in seawater were analyzed using a Hach 2700 spectrophotometer. The detection of N2O, CFC-11, CFC-12, and CFC-113 was performed using gas chromatography equipped with an electron capture detector (ECD). The detection limit for N2O was 0.02 nmol/L, and for CFCs, it was 0.01 pmol/kg.

2.4. Calculation of the Flux of Groundwater in the Shallow Aquifer

The calculation of groundwater discharge flux is based on terrestrial groundwater seepage mechanisms, using a hydrogeological model constructed with Darcy’s law [21]. The formulas for submarine groundwater discharge (Qw) and solute flux (Qc) are as follows:
Qw = K·L·H·J
Qc = Qw·C
Here, (K) is the hydraulic conductivity, (L) is the width of the seepage face, (H) is the aquifer thickness, (J) is the hydraulic gradient, and (C) is the solute concentration. The parameters for estimating SGD are set to satisfy Equations (1) and (2).
The concentration (C) in Equation (2) is serving to quantify an overall solute flux along the coastal boundary of Sanya administrative district. In natural systems, C would indeed vary spatially and temporally due to hydrogeological heterogeneity. C is either (a) a characteristic mean value representing the integrated system behavior, or (b) an upper-bound estimate to capture maximum potential flux conditions in the context.

3. Results

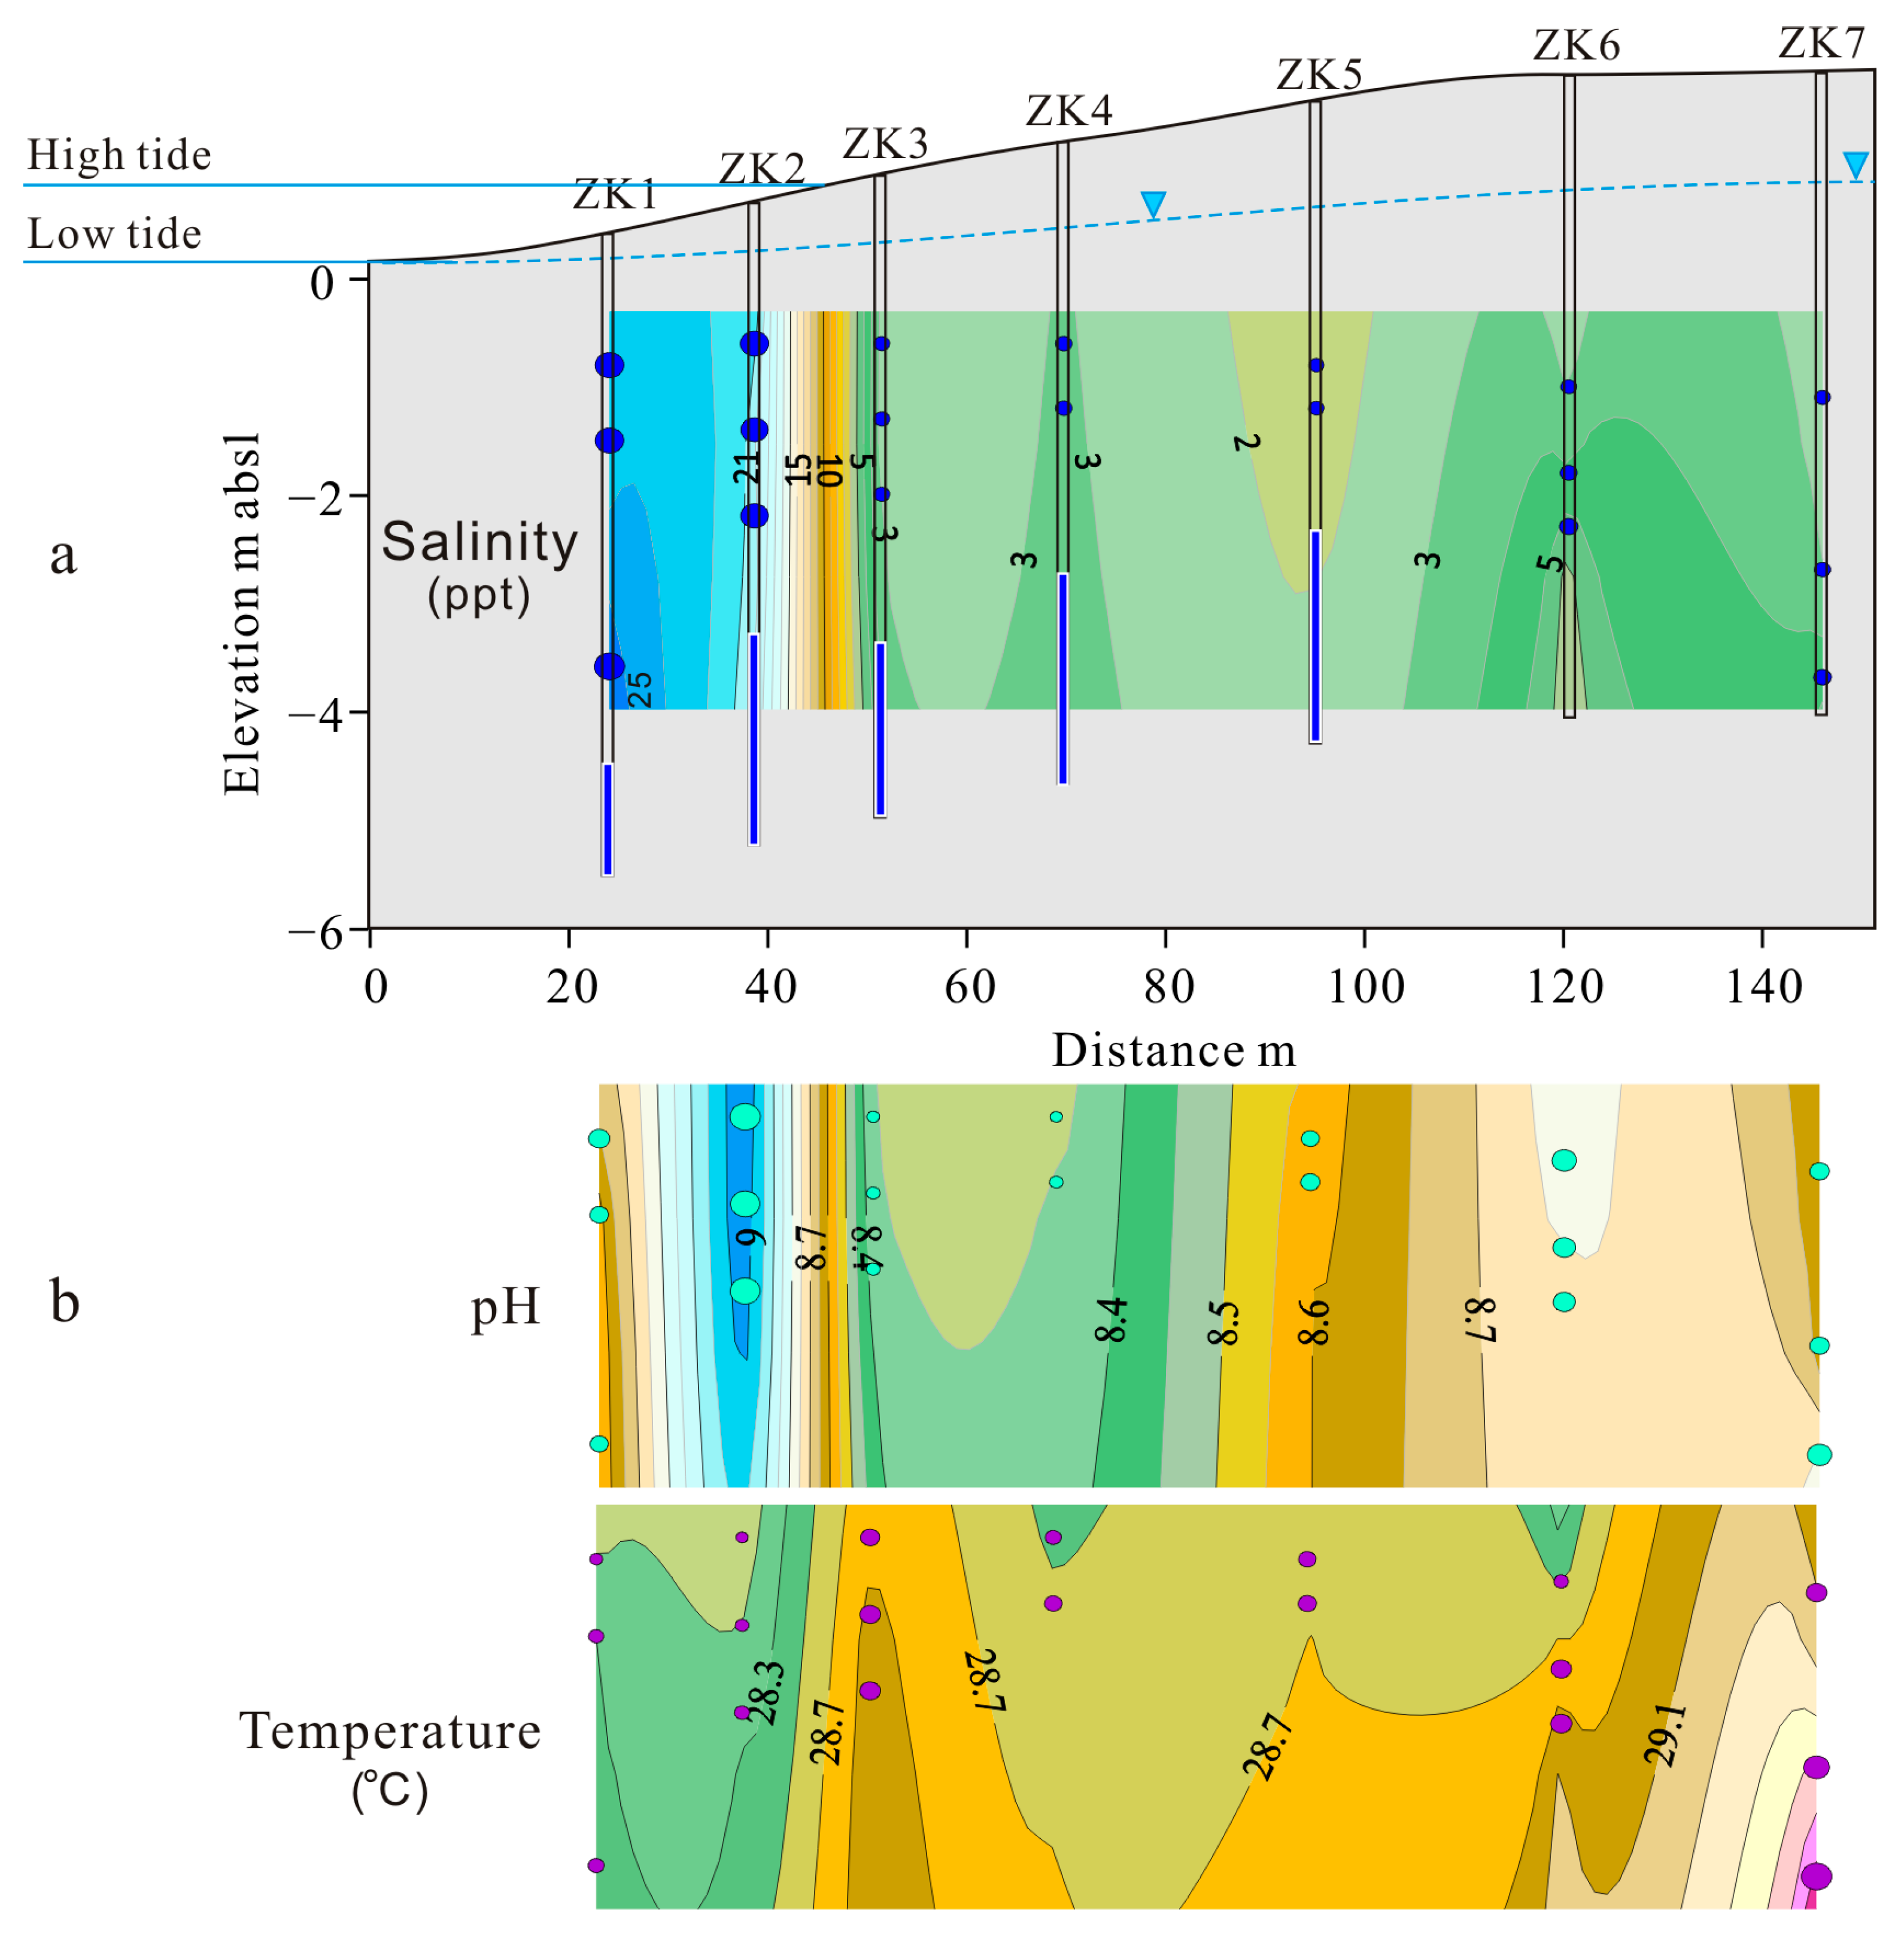
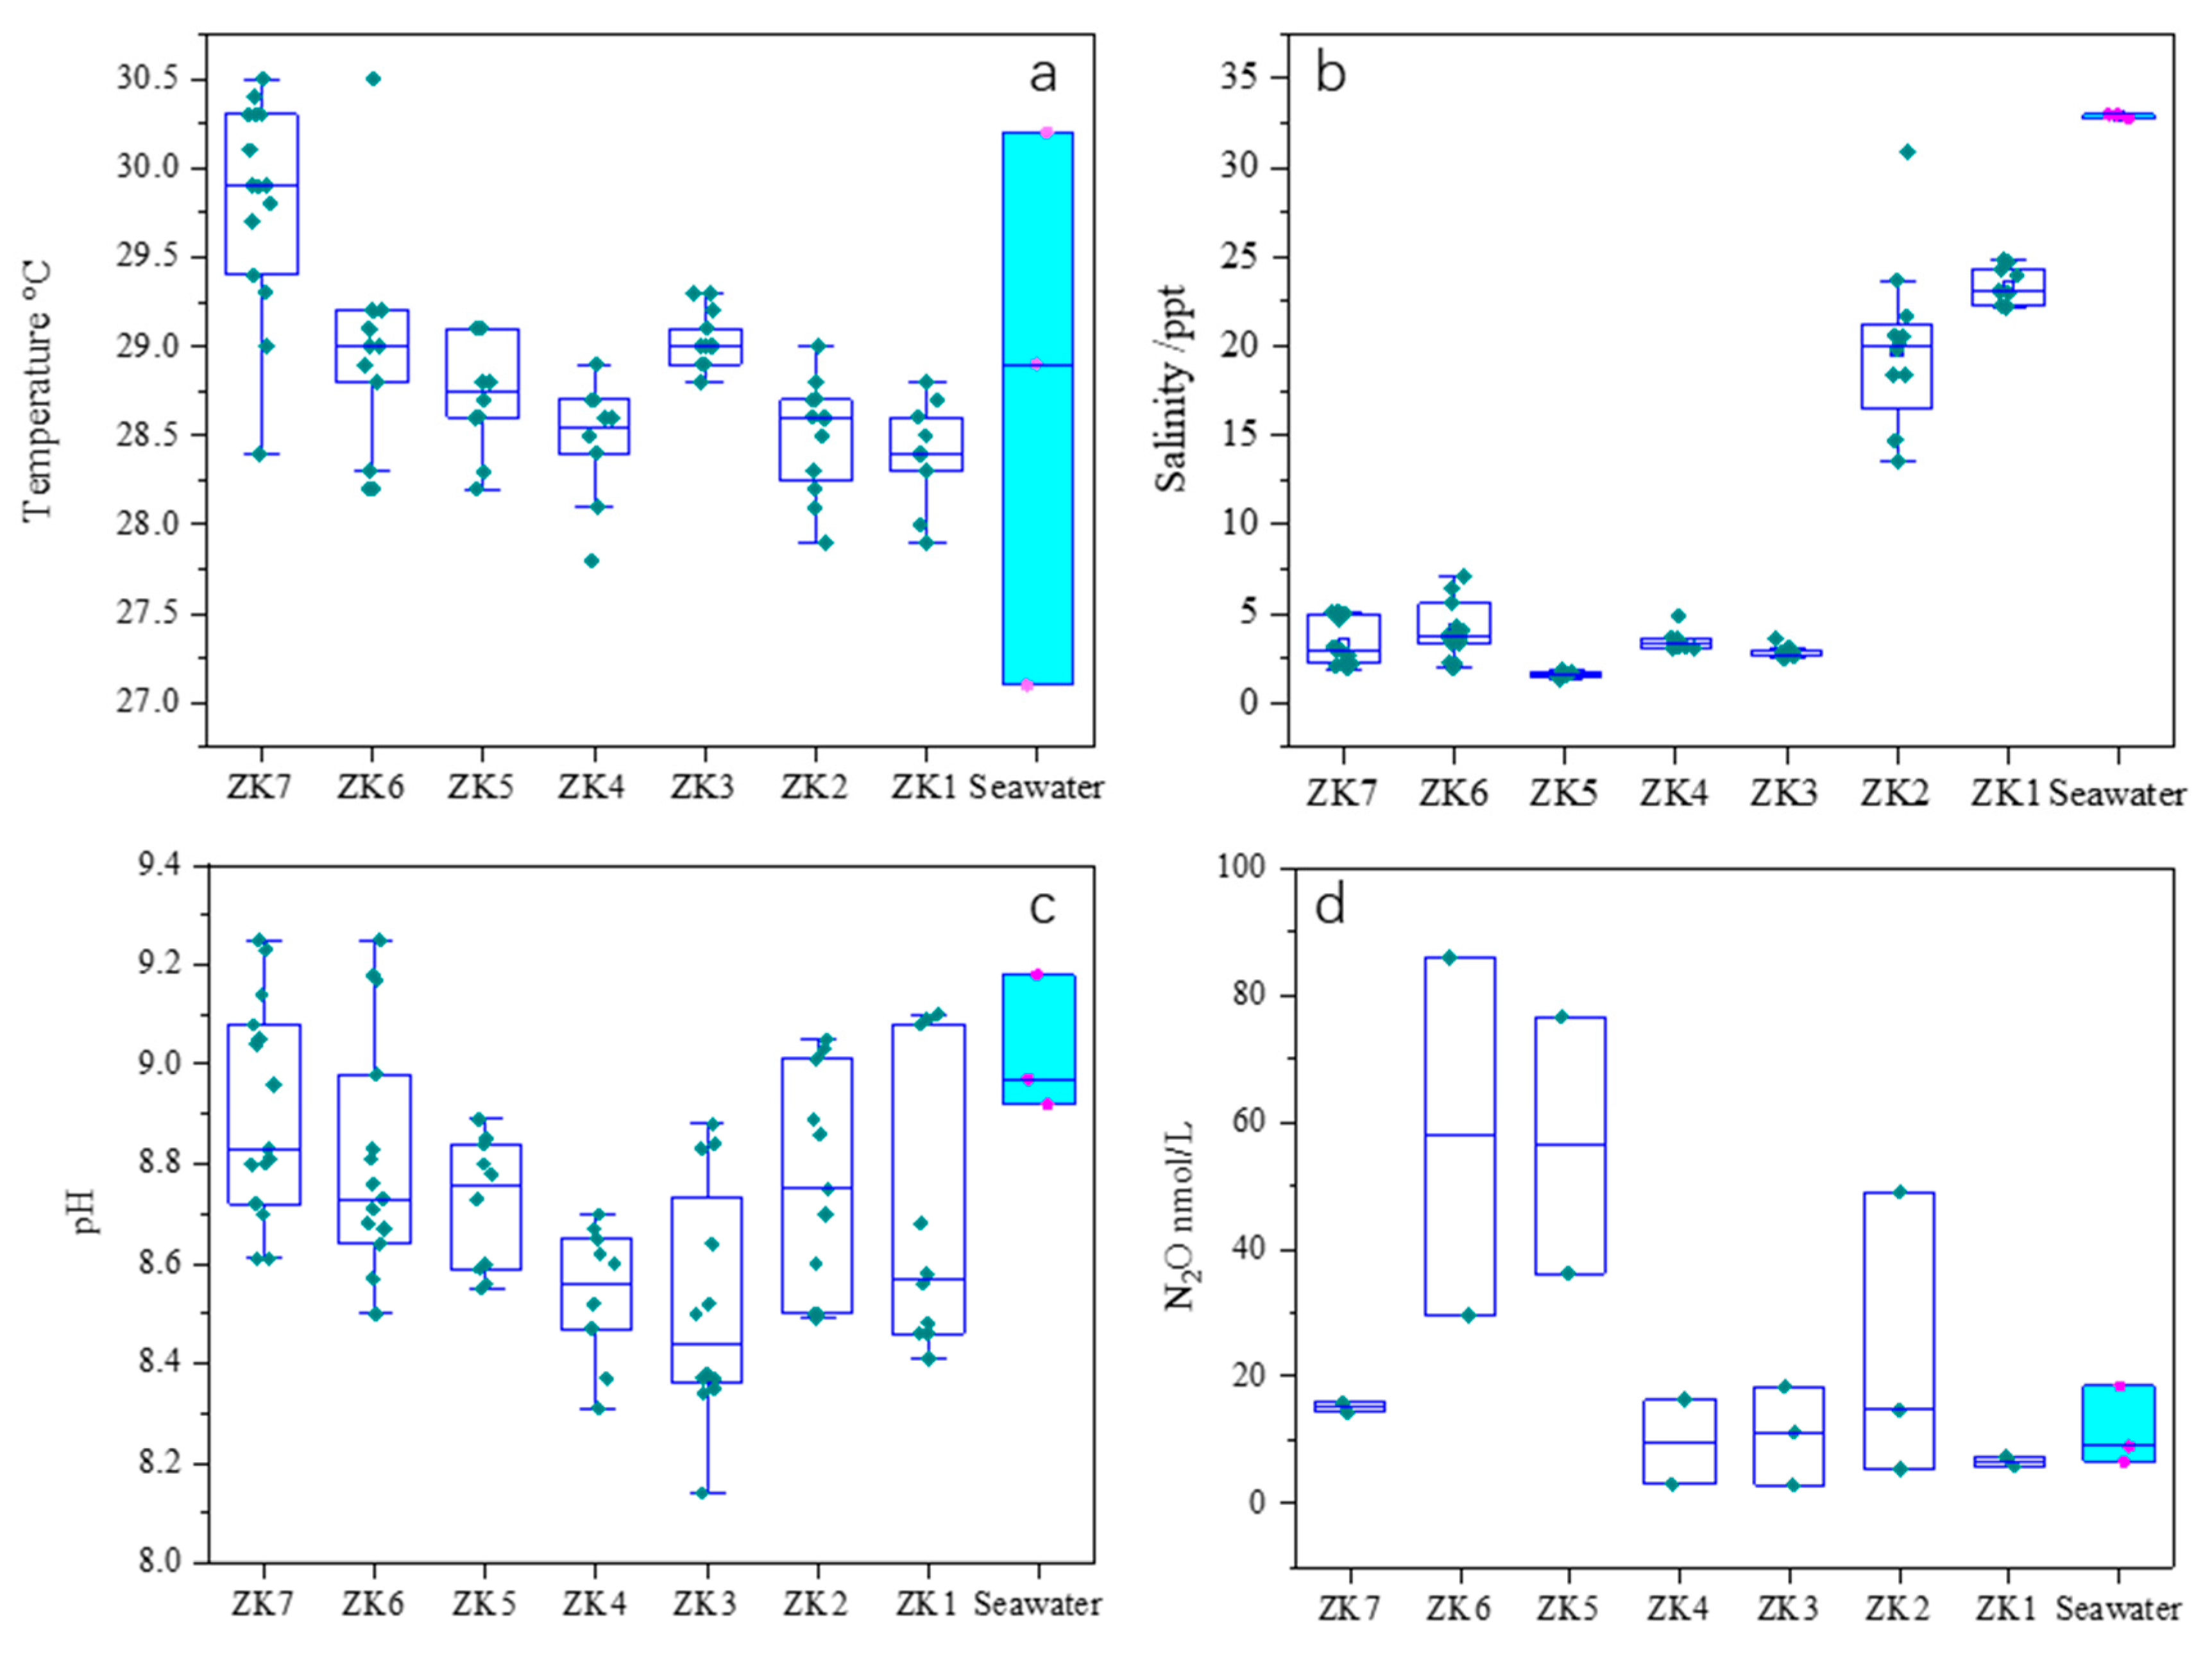
3.1. Variation in Salinity, pH and Temperature of Groundwater

This study uncovers the distinctive characteristics of groundwater systems within the intertidal zone of unconfined aquifers and elucidates their interaction mechanisms with seawater. Through detailed measurements of salinity, pH, and temperature in groundwater, a well-defined intertidal subterranean estuary was identified, showcasing significant mixing between recirculating seawater and discharging fresh groundwater (Figure 3). As illustrated in Figure 3a, in the ZK1-ZK3 well section, located within the intertidal zone, the highest salinity (>25 ppt) is observed at a depth of 4 m, while relatively lower salinity (21 ppt) is recorded near the ground surface at a depth of 0.5 m. This vertical salinity gradient is accompanied by higher pH values (8.7–9) (Figure 3b) and elevated temperatures (>28.3 °C) near the surface (Figure 3c), indicating the presence of a shallow freshwater wedge overlying a deeper saltwater wedge. Figure 3c further reveals that the temperature of fresh groundwater is >0.5 °C higher than that of seawater. Based on the data presented in Figure 3, it can be inferred that seawater exhibits lower temperatures and higher pH compared to fresh groundwater.
In contrast, the ZK3-ZK6 well section exhibits relatively low salinity (3–5 ppt), lower temperatures (<28.7 °C), and lower pH values (8.4–8.7), which are likely indicative of an area influenced by infiltration from gardening activities. This horizontal zoning pattern underscores the dominance of vertical recharge processes, primarily driven by local irrigation and water usage activities, in addition to rainfall.
Figure 3 illustrates the distribution of seven observation wells on the beach of Yazhou Bay, Sanya. Panel (a) displays the locations of the wells, and sampling points are denoted by solid blue circles, which represent the sampling points for salinity along with the corresponding salinity contours. Panel (b) uses solid purple circles to indicate the sampling points for groundwater pH, along with pH contours. The horizontal axis represents the distance from the lower intertidal cliff line, measured perpendicularly northward. In panel (c), light-green circles mark the sampling points for groundwater temperature, accompanied by temperature contours. Subplots (b) and (c) are presented at the same scale and dimensions as subplot (a).

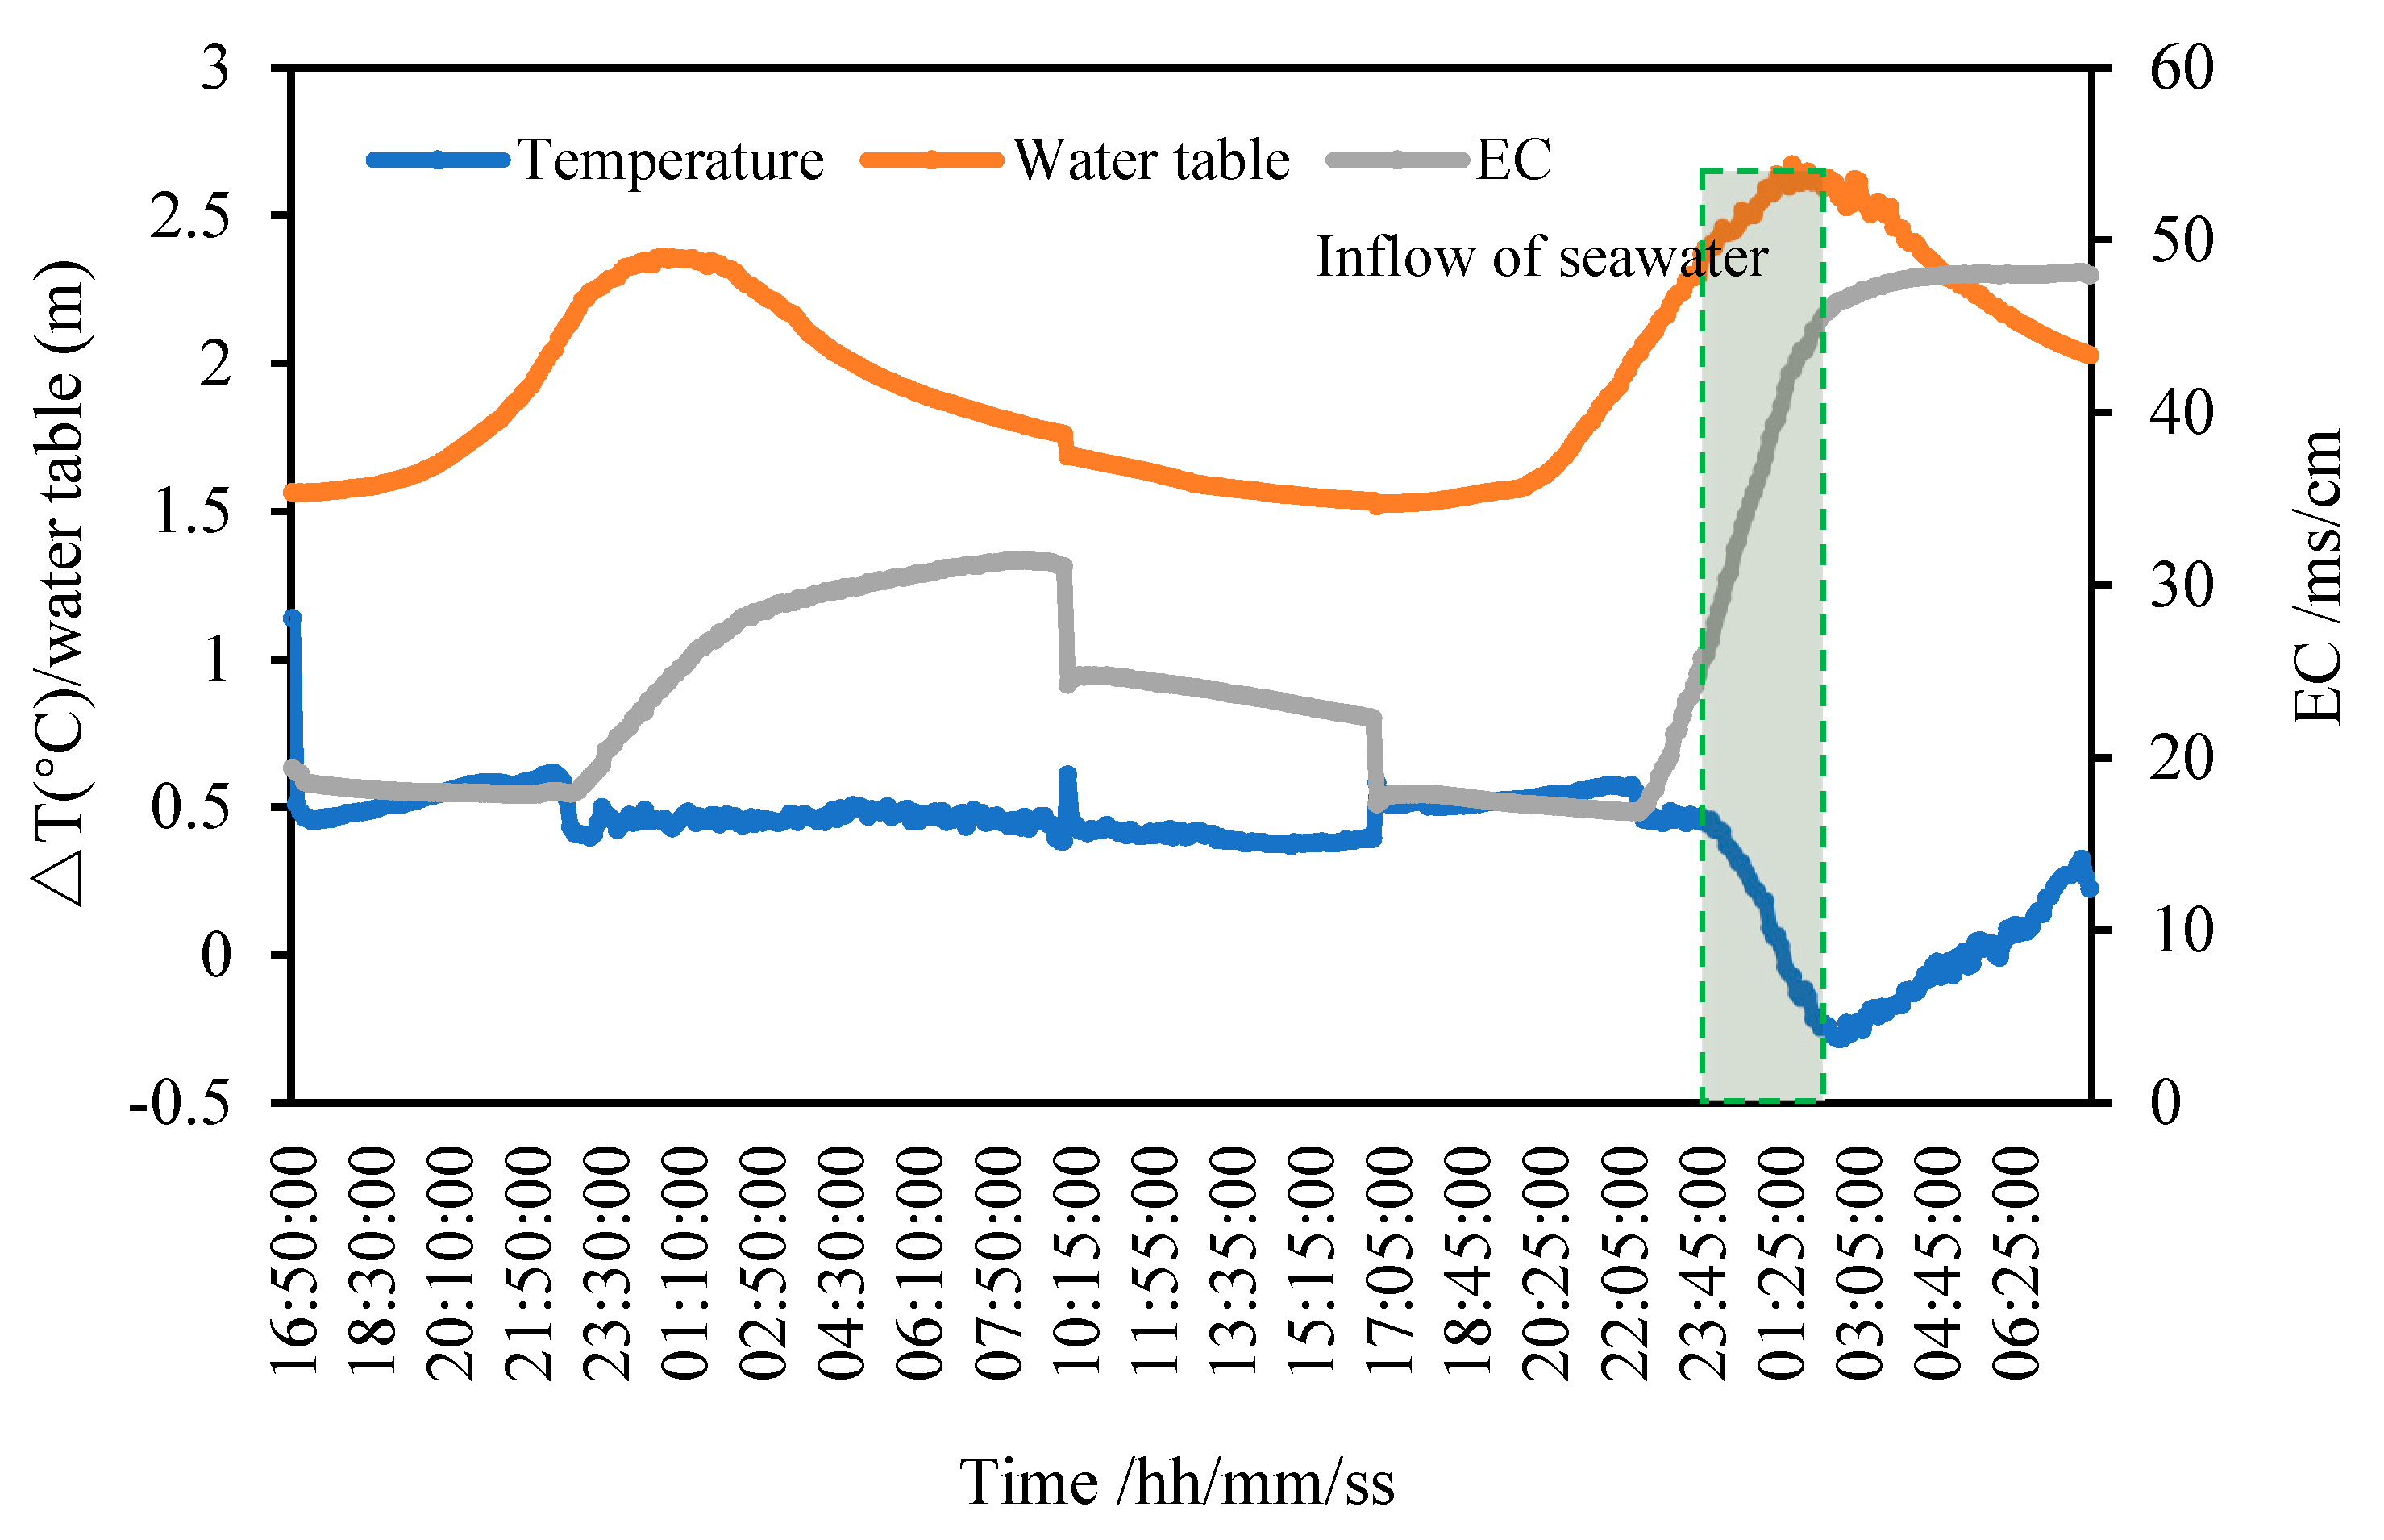
3.2. Groundwater Logging Data

A groundwater level logger was installed in well ZK2 to monitor variations in groundwater temperature, water level, and conductivity from 15–17 December 2023. Figure 4 shows the variations in water temperature, water level, and conductivity over time in well ZK2. The water temperature exhibited relatively stable characteristics with minor fluctuations throughout the observation period. However, at the 1:25 mark on the right side of the graph, seawater intrusion during high tide caused a noticeable temperature trough. This is because seawater temperature is lower than groundwater temperature, and the mixing of seawater with groundwater led to a temporary drop in well water temperature. The seawater intrusion also caused a significant rise in the water level, reaching the highest level observed during the monitoring period, and the conductivity rapidly increased to levels comparable to seawater.
In contrast, at the 23:30 mark on the left side of the graph, although the groundwater level also peaked, the conductivity was significantly lower than during seawater intrusion, and the water temperature remained constant. This phenomenon indicates that the rise in water level at this time was not caused by direct seawater intrusion into the well but rather by pressure transmission from the seawater to the groundwater system during high tide. The high tide altered the pressure conditions of the groundwater system, pushing the groundwater level higher. Due to the barrier effect of the aquifer, seawater did not directly enter the well, resulting in no significant increase in conductivity and stable water temperature.
The rise in groundwater level is the result of combined effects, including hindered groundwater discharge due to the reverse resistance of seawater during high tide and localized reverse flow from downstream to upstream. During high tide, the rising seawater level creates a pressure gradient in the aquifer, obstructing groundwater discharge and even causing reverse flow. This reverse flow not only alters the direction of groundwater movement but also significantly impacts the water level dynamics of the upper aquifer through a “pumping effect”. Specifically, the increased seawater pressure during high tide forces groundwater to flow back toward the land, while the decreased seawater pressure during low tide promotes groundwater discharge toward the ocean. This cyclical variation generates a “pumping” effect at the discharge end of the aquifer.
The response of groundwater levels to high tide is noticeably faster than their response to low tide. The internal hydraulic resistance of the Quaternary porous aquifer significantly limits the extent and intensity of the tidal pumping effect. Due to the limited permeability and hydraulic conductivity of the aquifer, the pumping effect induced by tidal action can only influence localized areas. This limitation indicates that the hydrogeological conditions of the aquifer, such as hydraulic conductivity and porosity, play a critical role in regulating the impact of tides on the groundwater flow field.

3.3. Variation in Groundwater N2O

Samples from shallow wells ZK1 to ZK7 are included, with ZK1 located at the seaside and ZK7 being the farthest from the seaside, approximately 145 m away. Seawater samples were collected from the seawater near ZK1. From well ZK3 northward to ZK7, the electrical conductivity of groundwater gradually decreases.
Table 1 presents the statistical results of N2O concentration in shallow well water samples from the Sanya area. The N2O concentrations from seven shallow wells (ZK1-ZK7) can be divided into two groups: the first group, ZK5-ZK7, has high N2O concentrations ranging from 14.36 to 85.93 nmol/kg; the second group, ZK1-ZK3, has low N2O concentrations ranging from 2.96 to 48.96 nmol/kg.
Figure 5 shows box plots of temperature, salinity, pH, and N2O concentration in shallow groundwater, illustrating the spatial variation in these parameters. The figure reveals that the temperature of shallow groundwater generally decreases from the land toward the ocean. The groundwater temperature in well ZK7 significantly differs from that of deep confined water and nearshore seawater. The temperature variation in wells ZK1 to ZK6 is relatively small, with a slight increase observed in well ZK3, while the temperatures in the other wells (ZK1, ZK2, ZK4–ZK6) remain relatively stable (Figure 5a).
The spatial distribution characteristics of groundwater salinity show a clear stepped increasing trend from the land toward the ocean (Figure 5b). This variation pattern is closely related to the spatial changes in the freshwater–saltwater interface. Particularly near the ZK3 well, a sudden change in salinity occurs, indicating a transition zone where freshwater and saltwater mix, associated with seawater intrusion or the advancement of a saline wedge caused by tidal action.
The spatial distribution of pH in shallow groundwater reveals that the pH values in wells ZK3 and ZK4 reach their lowest points, with a gradual increase observed both toward the ocean and inland (Figure 5c).
The N2O concentration in shallow groundwater is generally higher than that in seawater and shows a stepwise decrease from inland toward the ocean (Figure 5d). At the locations of wells ZK3 and ZK4, the N2O concentration reaches a range of lower values. On the landward side (ZK3–ZK7), pH shows a decreasing trend, while N2O concentrations remain relatively high. In this section, changes in pH do not appear to have a significant impact on N2O concentrations. In contrast, on the seaward side (ZK1–ZK3), pH exhibits an increasing trend, or the magnitude of pH variation remains similar, yet N2O concentrations are notably lower. This suggests that, in addition to pH, the location of groundwater plays a critical role in influencing N2O concentrations. Specifically, within the intertidal zone, N2O levels show a significant decline.

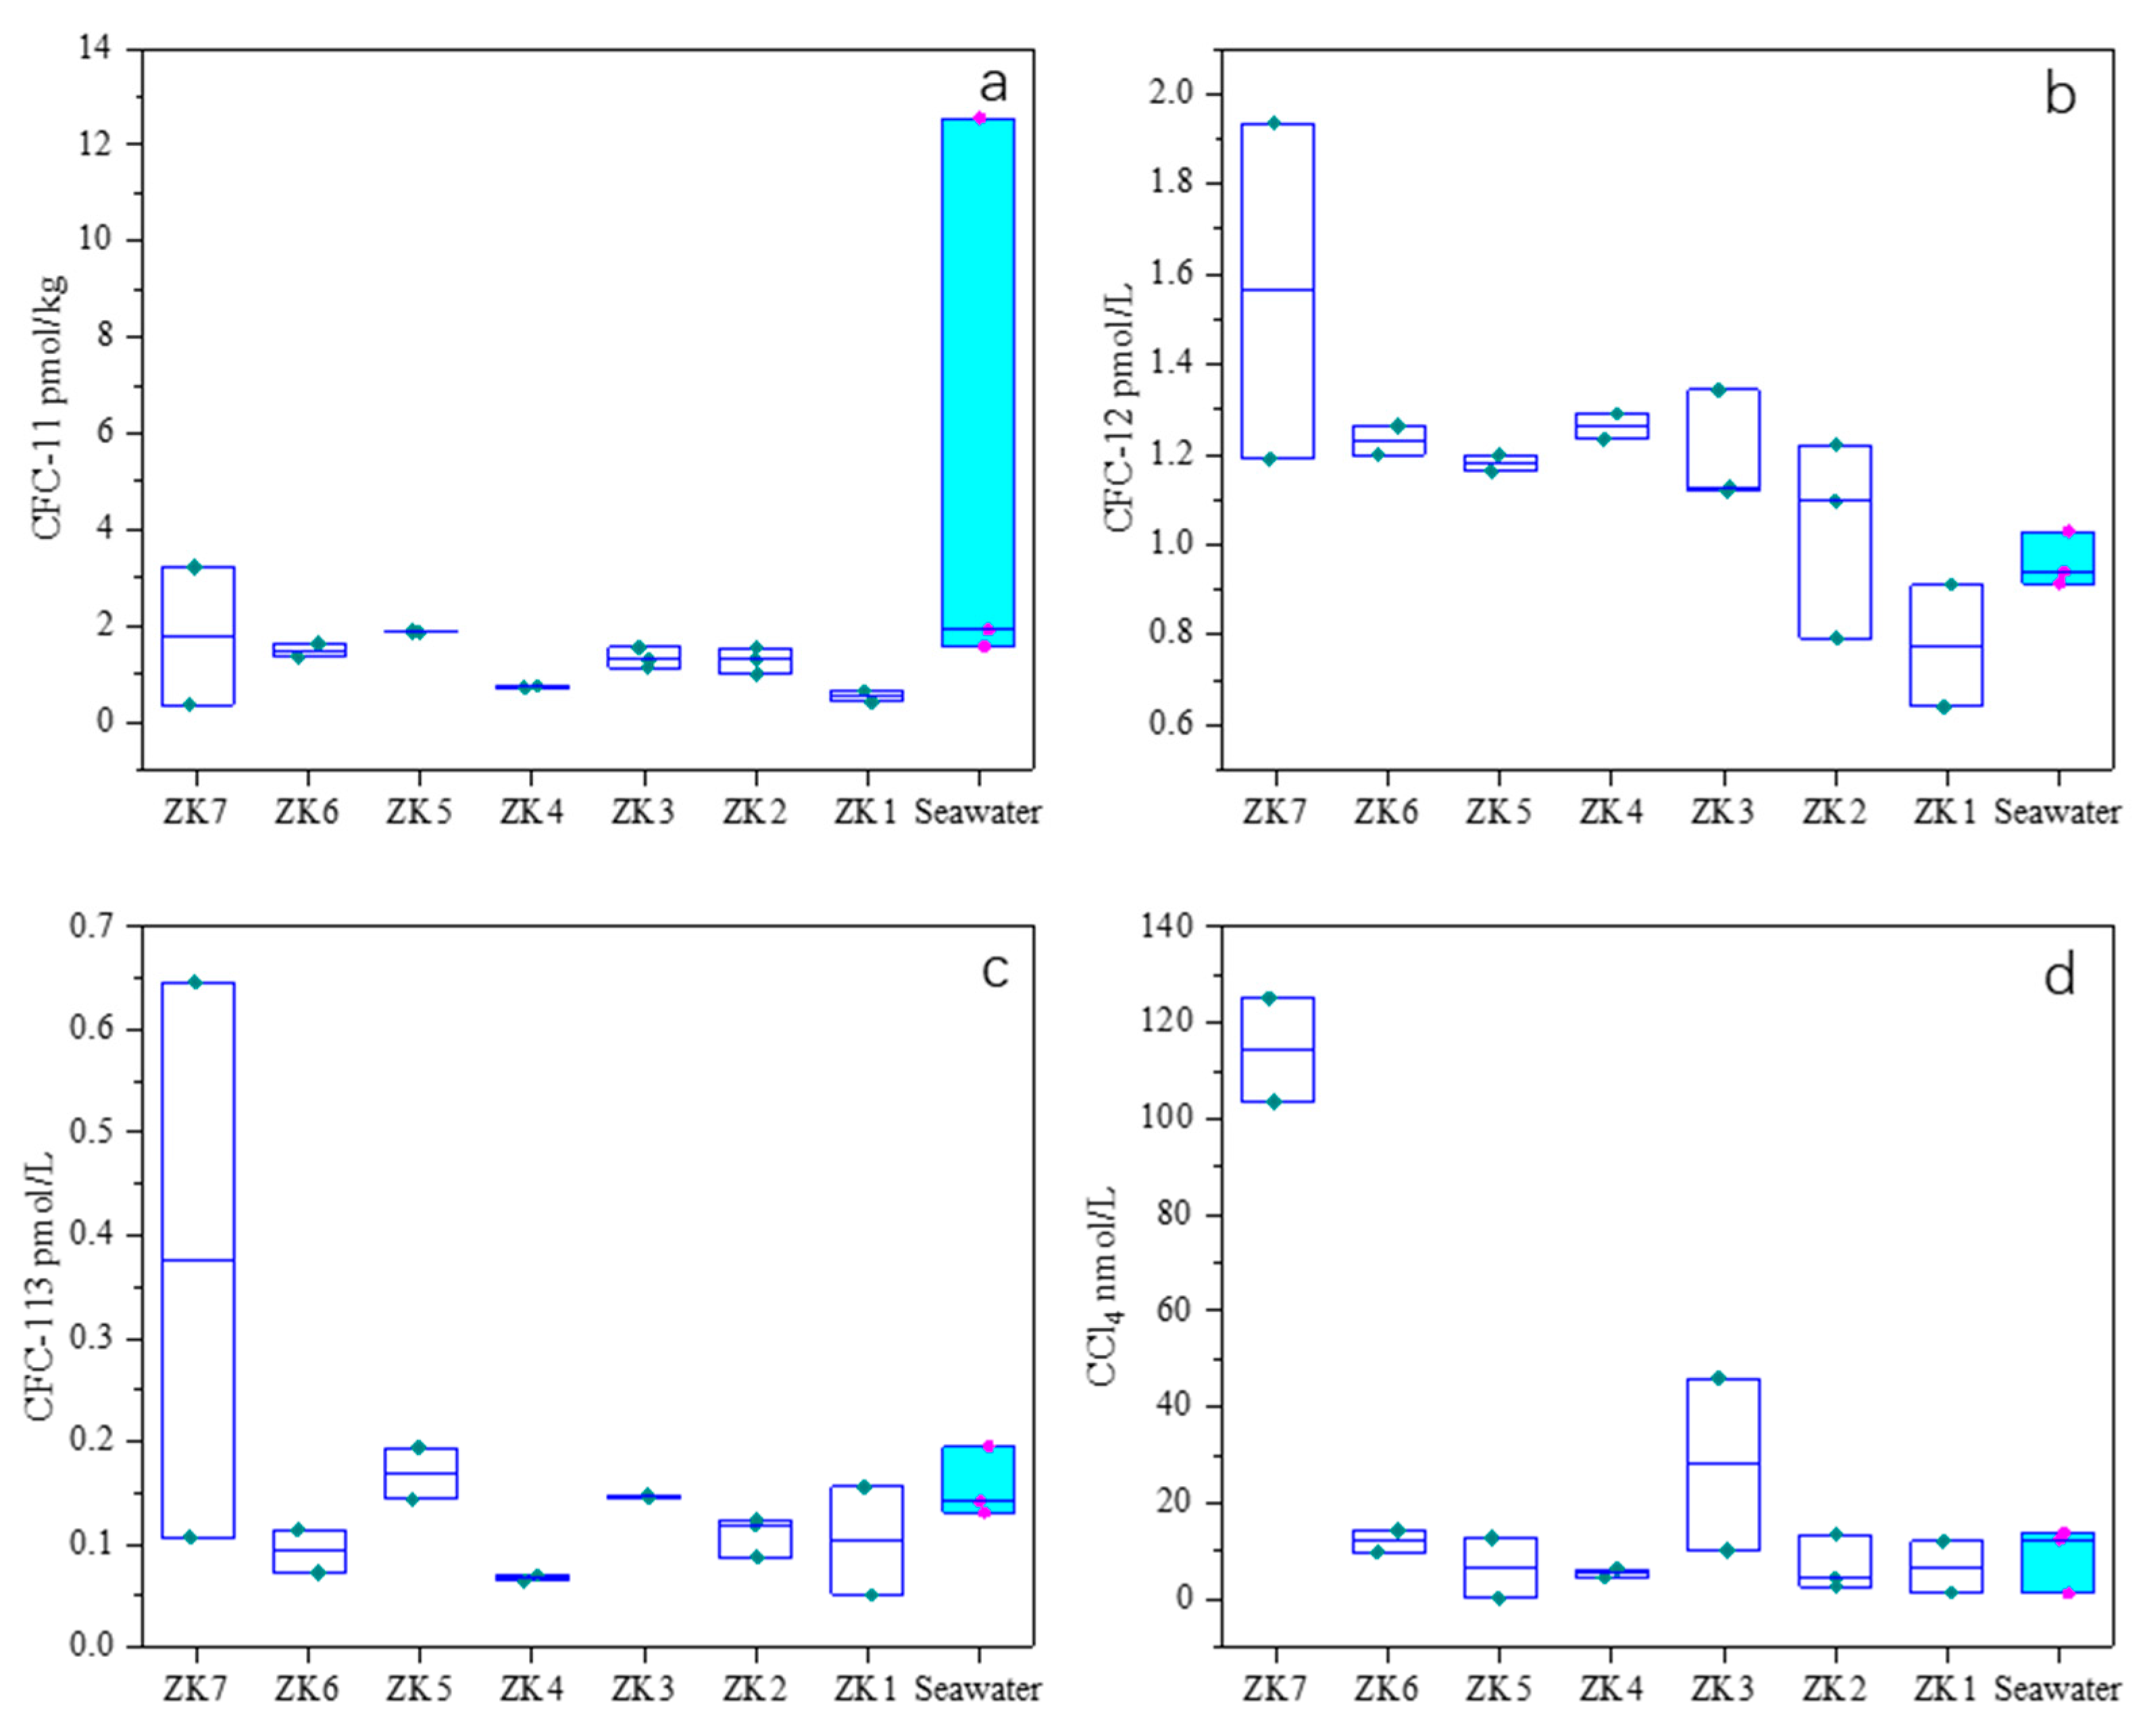
3.4. Concentrations of CFC-11, CFC-12, CFC-113, and CCl4 in Groundwater

The concentrations of CFC-11, CFC-12, CFC-113, and CCl4 in groundwater were analyzed to determine the distribution characteristics of the freshwater–saltwater interface in the intertidal groundwater. These components primarily originate from human activities, such as industrial emissions and refrigerant use. Their distribution patterns in groundwater are closely related to hydrogeological conditions, including groundwater flow paths, residence times, and mixing processes. As such, they serve as effective tracers for revealing the dynamic processes within groundwater systems.

3.4.1. CFC-11 Distribution (Figure 6a)

The concentration distributions of CFC-11 vary significantly among the seven wells and show a large deviation from seawater concentrations, reflecting different hydrodynamic conditions. Among the wells, ZK2, ZK3, and ZK7 exhibit wider variations in CFC-11 concentrations compared to ZK1, ZK4, ZK5, and ZK6. This variability suggests either different sources of CFC-11 or heterogeneity in the flow system of the shallow unconfined aquifer.

3.4.2. CFC-12 Distribution (Figure 6b)

A notable trend is the decrease in CFC-12 concentrations from ZK3 to ZK1, indicating that groundwater becomes older along this flow path, suggesting longer residence times in the mixing zone of freshwater and saltwater. In contrast, CFC-12 concentrations remain stable in the ZK3–ZK6 section, and the age of groundwater is relatively young.

3.4.3. CFC-113 and CCl4 Distribution (Figure 6c,d)

The inconsistent variations in CFC-113 and CCl4 among the wells further highlight the heterogeneity of the aquifer system.
Wells ZK3 and ZK4, which show the least variation in CFC-113, appear to separate the section into two distinct subsections: ZK1–ZK2 and ZK4–ZK7. This may mark a boundary region of groundwater flow paths. Similarly, ZK3, which exhibits the largest variation in CCl4, separates the section into ZK1–ZK2 and ZK4–ZK6 subsections. The elevated CCl4 levels in ZK7 suggest potential contamination from external sources.

3.4.4. Boundary Identification

  • Hydraulic Connectivity
Groundwater and surface seawater in the intertidal zone are not directly hydraulically connected. Instead, groundwater interacts with saltwater that originates from seawater and has undergone deep circulation.
2.
Boundary Between Flow Systems
The area around ZK3 represents a boundary between two distinct flow systems, the inland groundwater flow system, and the saltwater flow system driven by deep seawater circulation. CFCs and CCl4 data indicate that the intertidal mixing zone is located within the ZK1–ZK3 section. This section is characterized by longer groundwater residence times (with lower CFC-12 concentration).
CFC data suggest that the ZK3–ZK7 section acts as a recharge area, where water is vertically recharged into the unconfined aquifer.
Figure 6. Boxplot of CFC-11, CFC-12, CFC-113 and CCl4 for groundwater from seven wells and seawaters next to ZK1 in Yazhou Bay, Sanya. Solid circles in each subplot indicate multiple observation values, in box plots of CFC-11 (a), CFC-12 (b), CFC-113 (c), and CCl4 (d),alongside comparative data from seawater close to ZK1.
Water 17 01371 g006

4. Discussion

4.1. Groundwater Flux in the Intertidal Zone

In the coastal zone of the Sanya area, groundwater is predominantly distributed within the porous aquifers of small piedmont basins. These basins are delineated by SN-oriented mountain ridges, forming multiple independent small watersheds. The availability of groundwater is closely tied to the development of surface water systems: watersheds with perennial rivers typically exhibit relatively abundant groundwater resources, whereas those dominated by seasonal rivers tend to be water-poor. Influenced by the topography, which is higher in the north and lower in the south, groundwater generally flows in a north-to-south direction.
From the piedmont region to the coastal zone, the terrain gradually transitions to a flatter landscape, leading to a reduction in the hydraulic gradient of the aquifer and an increase in groundwater residence time. These hydrogeological conditions significantly constrain groundwater recharge and flow dynamics, thereby limiting the overall recharge volume and the sustainable utilization potential of groundwater resources in the Sanya area.
The subterranean estuary system in the coastal intertidal zone can be categorized into two distinct types: (1) groundwater discharge in surface estuarine areas, which acts as a critical pathway for transporting terrestrial nutrients (such as nitrogen and phosphorus) to the ocean. This is facilitated by the convergence of surface water and groundwater within the watershed, enhancing nutrient delivery to coastal waters. (2) Areas located far from surface estuaries, where subterranean estuaries exist but lack concentrated surface runoff and groundwater convergence conditions.
It is assumed that in the coastal area near the sea cliff line of Sanya, shallow groundwater in the intertidal zone can seep and discharge into the sea. The groundwater seepage flux formed by this process is calculated using the following relationship and parameters.
The seepage length of the Sanya coastal area is the length of the coastline within the Sanya administrative region, which is 200 km (some data suggest 260 km). The hydraulic conductivity (k) is determined based on pumping test calculations for the confined aquifer in this area, ranging from 0.42 to 5.30 m/day. This value is close to the hydraulic conductivity of the confined porous aquifer calculated using groundwater age data, which ranges from 4.74 to 5.77 m/day (with an effective porosity of 0.1).
The Quaternary porous aquifer in this area is thin and water-poor, while the underlying confined porous aquifer has moderate water abundance. The aquifer exhibits significant heterogeneity, with water-rich zones in the confined aquifer appearing as lens-shaped bodies, resulting in overall weak hydraulic conductivity. Here, the average and empirical methods are used to determine the hydraulic conductivity for calculations. The hydraulic conductivity (k) for the shallow Quaternary aquifer is taken as 2. The maximum hydraulic conductivity is not used in the calculations, primarily because the proportion of water-rich layers in the coastal zone within the Sanya region is not high.
Except for the Yanglan area in Sanya Bay, the fractured aquifer in Jiyang District, and the Ningyuan River Basin, areas such as Haitang Bay are relatively water-poor. Using a moderately low hydraulic conductivity for calculations aligns better with the actual conditions. Additionally, the spatial variability of effective porosity leads to spatial changes in hydraulic conductivity, further reducing the aquifer’s hydraulic conductivity.
The parameters and method for calculating the seepage flux of the shallow Quaternary aquifer are as follows:
Qw = K(2)·L(200 × 103H(4)·J(0.0078) = 12480 m3/d
This is equivalent to 4.555 million m3/year.

4.2. Potential N2O Flux During Groundwater Discharge in the Intertidal Zone

The conditions and regional distribution of groundwater discharge in the intertidal zone of the Sanya area are jointly controlled by the characteristics of the coastline and the aquifer structure. The coastline of Sanya stretches 200~260 km, and the coastal aquifer primarily includes shallow Quaternary porous water, deep confined porous water, and fractured water. Below, the groundwater discharge characteristics and fluxes of each type of aquifer are elaborated.
The shallow Quaternary aquifer is thin and has poor water abundance. Combined with the flat terrain of the coastal area, the groundwater seepage conditions are unfavorable, making it difficult to form a large-scale seepage zone. There are no obvious seepage zones or low-lying wetlands. Localized traces and pathways of surface runoff formed by precipitation entering the sea are visible. Additionally, due to the construction of tourism facilities, extensive land reclamation and beach creation have extended the coastline seaward by tens of meters, resulting in the original seepage zones being covered by sand and disappearing. Based on these characteristics, the estimated groundwater discharge flux from the shallow Quaternary porous aquifer is 4.555 million m3/year, which is considered as the submarine discharge volume. The N2O concentration of 13.5 nmol/L in the intertidal zone (average of N2O among ZK1, ZK2 and ZK3) is taken as a load of N2O in groundwater discharge. Transport or release of N2O in the intertidal zone could be 13.5 nmol/L multiplied by 4.555 million m3/year, about 2.7 × 10³ g/a. The intertidal zone groundwater discharge was not a hotspot for N2O transport to the sea and emission to the atmosphere.

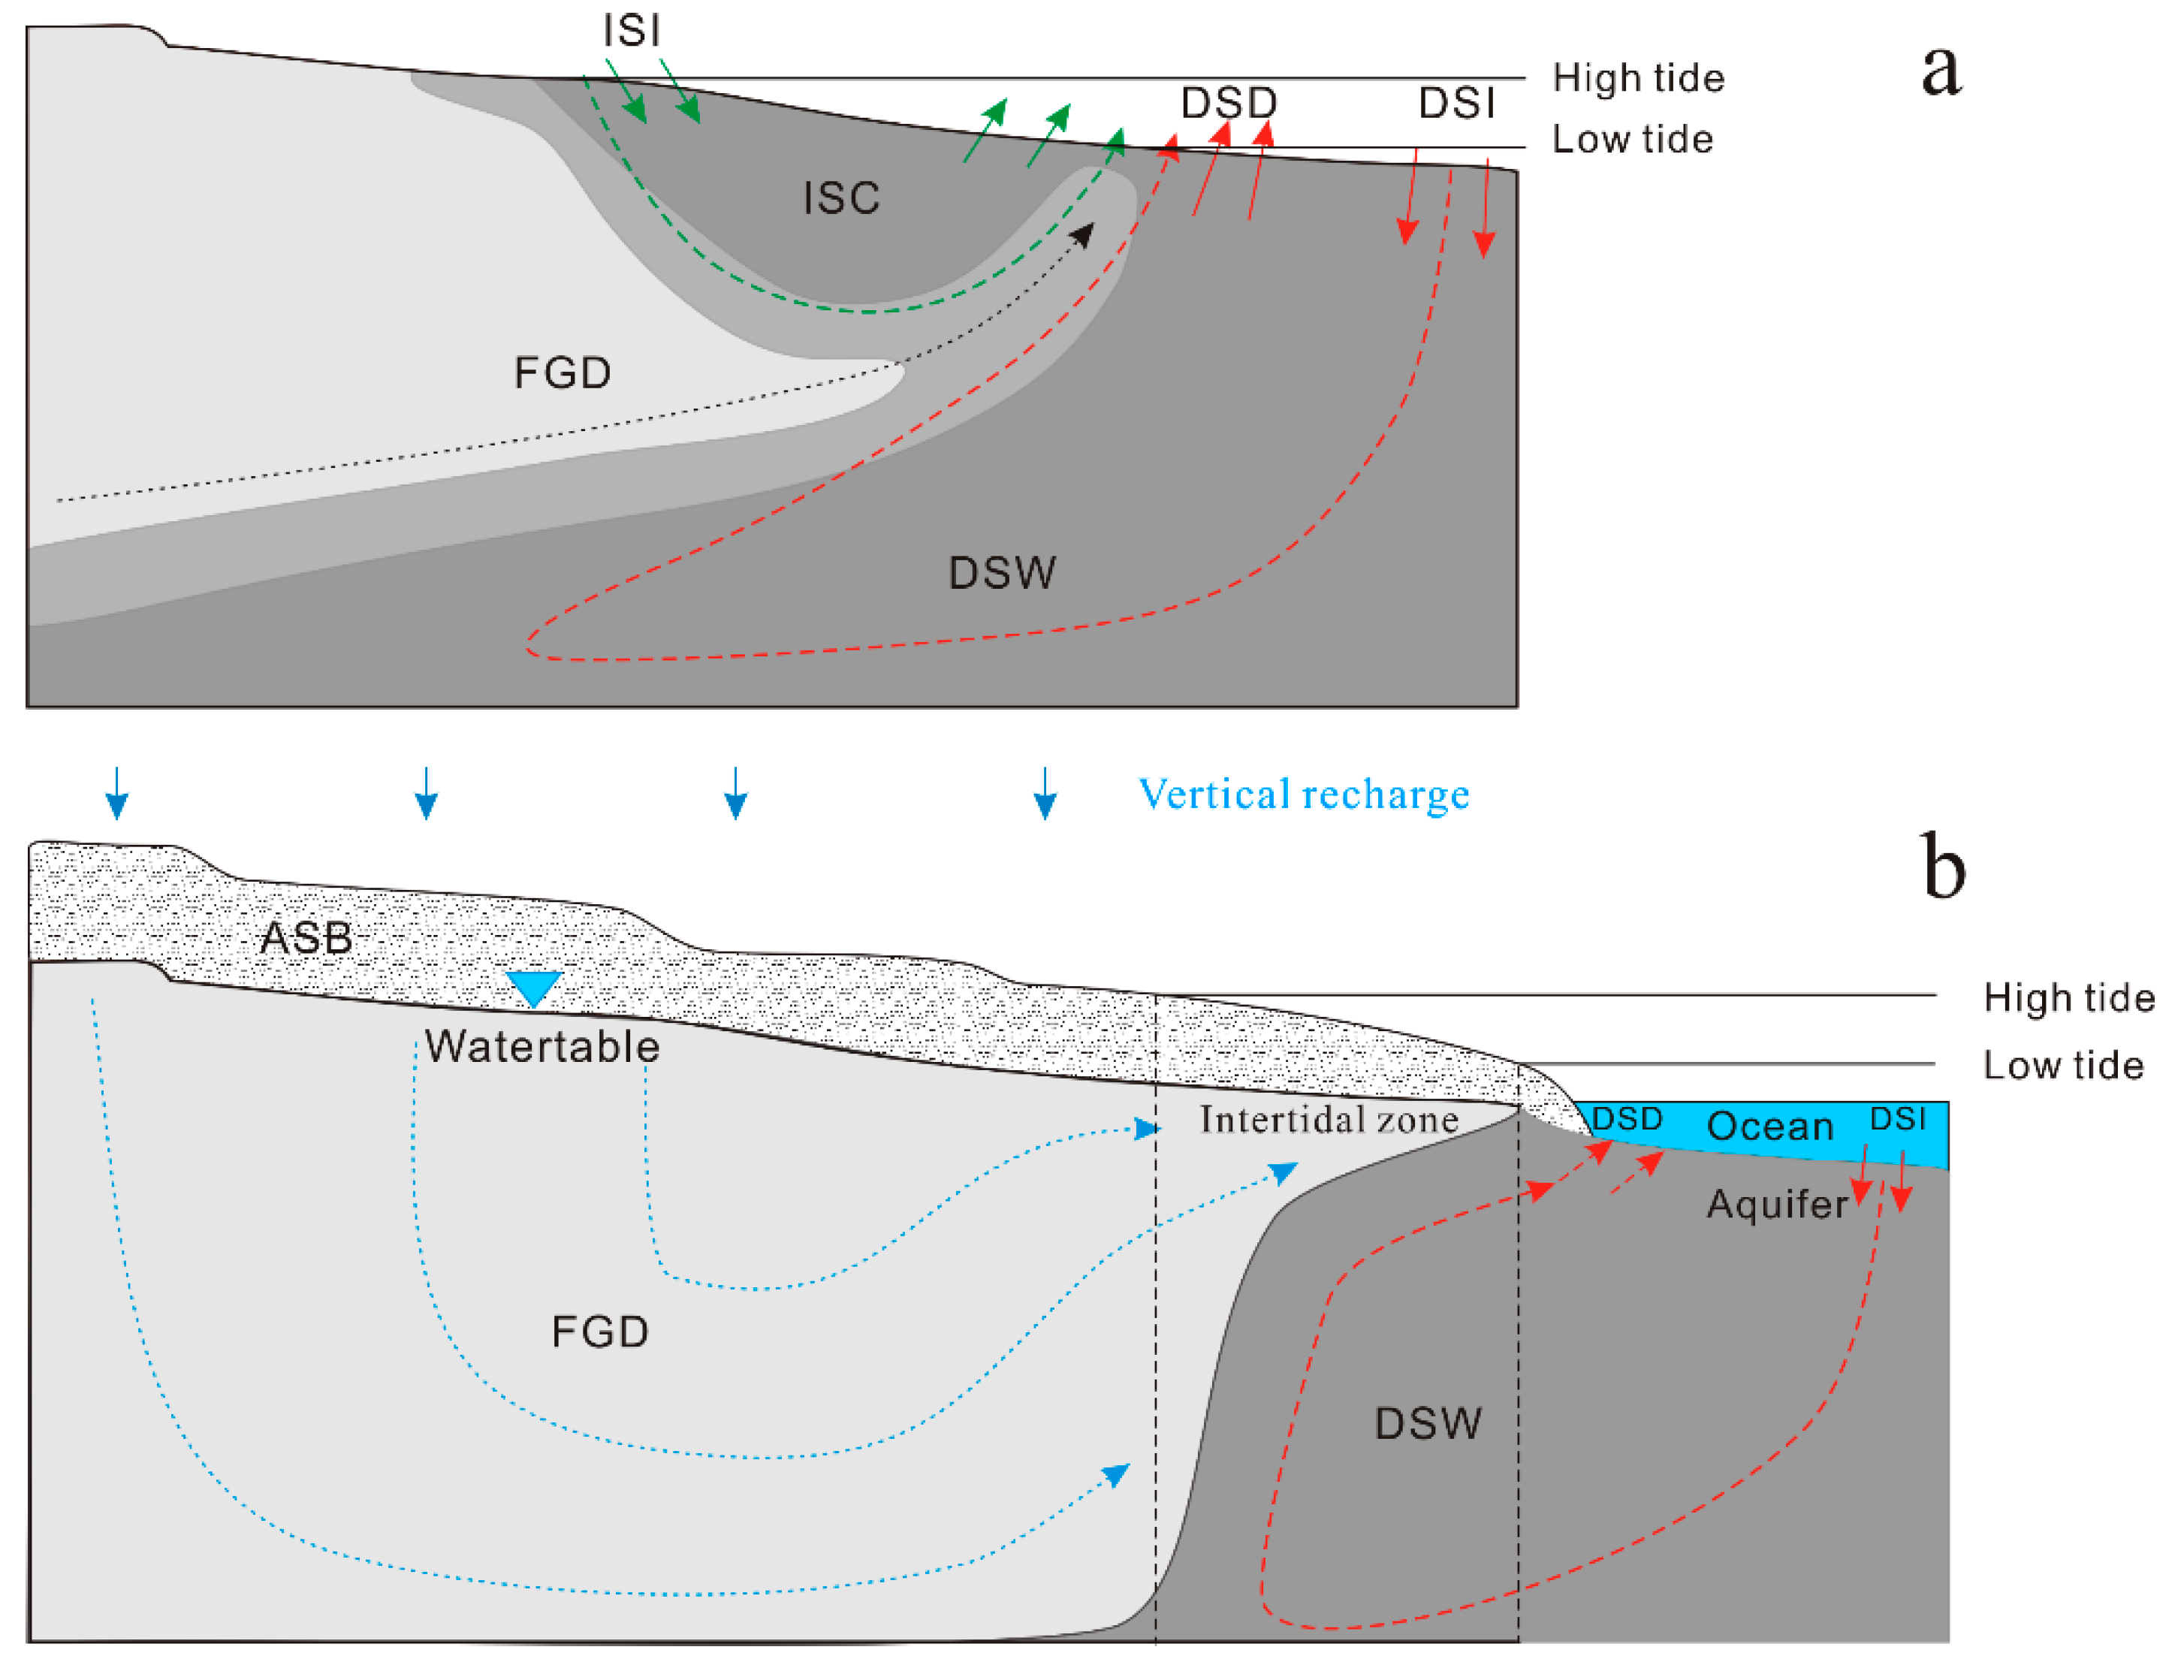
4.3. Model of Submarine Groundwater Discharge of Coastal Unconfined Aquifer

4.3.1. Dynamics of Coastal Groundwater Discharge and Controlling Factors

Numerous studies have demonstrated that coastal groundwater discharge predominantly occurs in the shallow, submerged portions of sandy beaches and diminishes with increasing distance from the coastline [20,21,30]. This phenomenon highlights the critical role of the shallow subsurface zone in facilitating the exchange of groundwater between terrestrial and marine environments. Understanding these exchange processes is essential, as they not only influence the dynamics of shallow aquifers but also have significant implications for deeper aquifer systems [31].
Coastal unconfined aquifers contribute to the ocean through various fluxes of fresh groundwater discharge (FGD). The mixing of saltwater and freshwater in beach aquifers can occur between FGD and deep saline discharge (DSD), as well as between FGD and intertidal saltwater cells (ISC). Previously, this mixing was believed to occur predominantly in the salt wedge dispersion zone [32,33]. However, recent studies emphasize that this mixing process enhances the chemical flux from aquifers to the ocean [21,34,35].
As illustrated in Figure 7a, FGD is a major component of submarine groundwater discharge (SGD), which also includes DSD and ISC. FGD is typically located below the ISC but above the DSD. The intertidal saltwater cell (ISC) has traditionally been considered a permanent feature of coastal aquifers [32], exhibiting significant variability in response to tidal fluctuations and wave set-up [36,37]. However, recent observations indicate that the ISC can also exhibit transient characteristics, periodically appearing and disappearing with the lunar cycle [38].
In addition to the ISC, another widely recognized term, the upper saline plume (USP), has been extensively applied in studies based on integrated field salinity measurements [39,40,41,42,43,44,45]. The formation of an ISC or USP beneath a beach requires specific conditions, including the following:
Sufficiently strong oceanic oscillations;
An optimal terrestrial freshwater flux (neither too slow nor too rapid);
Appropriately sloping intertidal topography;
Moderate heterogeneity;
Slope of the beach.
The slope of the beach plays a critical role, as flatter or steeper slopes can either intensify or weaken saltwater infiltration [31,44]. Additionally, high heterogeneity in the sloping beach reduces the degree of mixing and limits the extent of the USP [45]. These factors collectively influence the dynamics and spatial distribution of ISC and USP in coastal aquifers.

4.3.2. Construction of New Conceptual Model in the Intertidal Zone

Based on the observation in this study, data support formulation of a new conceptual model in the intertidal zone (Figure 7b) to facilitate understanding of flow dynamics of the shallow groundwater system and of the controlling conditions when interacted with saltwater or the deep saltwater circulation system.
  • Kinetic Boundary Conditions in Intertidal Coastal Aquifers
Intertidal coastal aquifers are subject to strong hydrodynamic forces, including tides, waves, and storm floods, which cause dynamic changes in the boundary conditions of the aquifer. Key advancements include the development of a ternary flow model driven by tides and wave set-up, which describes the upper saline circulation, the intermediate freshwater–saltwater mixing zone, and the lower saline circulation. This structure is not static; variations in tidal intensity, coastal topography, and other factors can alter the controlling conditions of the ternary flow model. For example, groundwater flow in STEs can be changed by the beach morphology and storm floods [46], hydraulic conductivity, beach slope, or wave set-up [8].
2.
The development of the upper saline plume (USP)
The development of the upper saline plume (USP) in intertidal groundwater flow systems is influenced by the following:
The volume of seawater infiltration during high tide;
The extent of seawater intrusion;
Residence time;
The balance between seawater inflow during high tide and outflow during low tide.
When the volume of seawater infiltration during high tide exceeds the outflow during low tide, seawater accumulates in the intertidal sediment layer, promoting USP development. Conversely, if infiltration is less than outflow, the USP may shrink or disappear. In addition to tidal forces and seawater infiltration, other factors, such as beach slope and sediment permeability, also play significant roles.
3.
Impact of Beach Elevation and Slope on Flow Dynamics
According to our observation, as beach elevation increases, and the intertidal slope steepens, freshwater circulation strengthens, potentially forming a freshwater wedge that extends seaward, and at last counteracting the saltwater wedge. The formation of a freshwater wedge is controlled by factors such as aquifer scarcity and the aging of groundwater in the intertidal zone.
Artificial beach elevation increases the slope of the intertidal zone, leading to the following:
Shorter tidal intrusion distances;
Reduced seawater infiltration;
Faster outflow velocities during low tide;
Decreased residence times;
Increased discharge rates.
These conditions can lead to the disappearance of the intertidal saltwater cell (ISC) or USP. The formation of a freshwater wedge, which grows in opposition to the saltwater wedge, is facilitated by increased beach elevation. This wedge can extend seaward, potentially creating a rapid pathway for groundwater discharge into the ocean.
4.
Freshwater Wedge as a Direct Fast Pathway for Nutrient Transport
The steepening of the intertidal slope due to beach elevation increases the hydraulic gradient of groundwater, accelerating discharge through the freshwater wedge. This reduces groundwater residence times, allowing terrestrial water and nutrients to bypass the freshwater–saltwater mixing zone and discharge directly into the ocean. During rainy seasons, storms, or floods, increased infiltration and groundwater recharge further enhance this pathway, making it a significant route for terrestrial nutrient transport. This study is the first to propose this mechanism.
5.
The Saltwater Wedge Mixing Zone
The freshwater–saltwater mixing zone within the saltwater wedge acts as a geochemical reactor and a transformation zone for terrestrial nutrients. Key characteristics of this zone include the following:
Long groundwater residence times;
Slow flow velocities;
Conditions favorable for nitrate denitrification and the conversion of N2O to N2.
The intertidal subterranean estuary is often referred to as a “geochemical reactor” and serves as a critical zone for the transformation and transport of terrestrial nutrients. These processes are influenced by hydrodynamic forces, residence times, and other factors. This zone can serve as a critical sink for terrestrial nitrogen, playing a vital role in nutrient cycling and transformation.
6.
Implication for understanding seawater intrusion
Salinization patterns exhibit significant spatial and temporal variability influenced by complex interactions among geological, hydrogeological, and climatic factors. In coastal porous aquifers, salinization typically manifests as a diffuse saline front advancing landward due to over-pumping or sea-level rise. However, irregular salinization patterns may emerge in carbonate and alluvial systems where preferential flow paths create localized zones of higher vulnerability [47]. Closed hydrological systems in endorheic basins promote extreme salinization through evaporative concentration of salts. Clay-rich sediments exacerbate salt accumulation due to high capillarity, while evaporite deposits (e.g., gypsum, halite) contribute to the formation of hypersaline environments such as salt flats (sabkhas). In arid and semi-arid regions, the interplay of high evaporation rates and limited precipitation drives shallow groundwater salinization. Capillary action transports salts to the surface, forming characteristic salt crusts in alluvial plains. Poor drainage conditions in loess/aeolian deposits further intensify salinization processes. Secondary salinization arises from unsustainable irrigation practices coupled with inadequate drainage systems. Low-permeability clay layers inhibit salt leaching, while heterogeneous permeability in alluvial fans results in spatially uneven salt distribution.
Seawater intrusion represents a critical hydrogeological process characterized by the disruption of the natural freshwater–saltwater equilibrium in coastal aquifer systems. This phenomenon results in the landward migration of saline water into freshwater-bearing formations. As a globally prevalent environmental challenge affecting coastal regions, seawater intrusion poses significant threats to groundwater resource sustainability and can induce cascading environmental impacts, including agricultural soil salinization, degradation of terrestrial and aquatic ecosystems, and alteration of subsurface geochemical conditions.
The causes of seawater intrusion involve the coupling of multiple factors, primarily including the following: (1) excessive groundwater extraction, which lowers aquifer hydraulic heads, disrupting the freshwater–saltwater equilibrium, and accelerating the inland migration of saline water; (2) rising sea levels, which intensify the landward hydraulic advance of seawater; (3) aquifer structures (e.g., conductive faults, highly permeable sand layers), which provide preferential pathways for seawater intrusion [48]. Hydrogeological model reveals significant differences in how sea-level rise affects unconfined and confined aquifers.
Sea-level rise promotes the landward expansion of intertidal saline cell (ISC) or upper saline plumes (USPs), extending the tidally and wave-influenced infiltration zone and increasing seawater residence time within the aquifer. This process elevates porewater salinity in the intertidal zone, serving as a primary driver of groundwater quality degradation. Due to the barrier effect of overlying aquitards, ISC/USP encroachment has a minimal direct impact. Instead, seawater intrusion is primarily controlled by the migration of a deep saline wedge, manifesting as dynamic adjustments in the freshwater–saltwater interface. The extent of this interface’s movement is governed by aquifer transmissivity, heterogeneity, and extraction intensity. Highly permeable faults or gravel layers may form preferential flow channels, accelerating the destabilization of the freshwater–saltwater equilibrium.
The seawater wedge penetration refers to the inland intrusion of saline water into coastal aquifers, driven by the density contrast between freshwater and seawater. The seawater wedge has a smooth, diffuse interface (Ghyben–Herzberg relation) in porous media (sand, gravel). Irregular intrusion due to preferential flow paths in fractured/karst aquifers. Higher Hydraulic Conductivity (K) allows faster seawater movement. Steeper freshwater gradients push the wedge seaward; over-pumping flattens gradients, enhancing intrusion. Seawater (~1.025 g/cm3) intrudes beneath freshwater (~1.000 g/cm3). Tidal Fluctuations enhance mixing (e.g., “saltwater fingering” in sandy aquifers). Submarine groundwater discharge (SGD) can limit intrusion by maintaining outward flow. Droughts, urbanization, and over-extraction decrease recharge and freshwater pressure, driving the advancement of the seawater wedge. It is vital to identify the deterministic vs. stochastic trends in coastal aquifer systems [47,49], to account for parameter uncertainty, variable boundary conditions, and heterogeneous system responses. While gradual salinization (diffuse frontal advance) is often simulated via density-dependent flow models. Preferential pathways in carbonate/alluvial systems necessitate probabilistic or ensemble modeling to capture irregular salinity distributions. Developing groundwater–seawater interaction models for intertidal zones can elucidate dynamic exchange mechanisms, providing a theoretical foundation for analyzing intrusion mechanisms, predicting risks, and formulating mitigation strategies. For instance, numerical simulations can quantify tidal influences on salt transport in aquifers or assess the efficacy of artificial sand replenishment in curbing seawater intrusion.
In the study area, minimal groundwater extraction and recent coastal restoration measures (e.g., artificial sand replenishment) have prevented observable seawater intrusion. However, in the adjacent Hongtang Bay to the east, intensive groundwater pumping has led to localized aquifer salinization and signs of seawater intrusion (detailed in a separate study). This contrast underscores the critical role of human activities in driving seawater intrusion.

5. Conclusions

This study focuses on a small-scale basin characterized by Triassic granite basement overlain by Cenozoic sedimentary deposits (ranging from tens to hundreds of meters in thickness). The results indicates that groundwater discharge rates were found to be substantially lower than concurrent riverine flux. This contrasts with numerous studies reporting dominant submarine groundwater discharge (SGD) contributions in coastal systems, demonstrates significant spatial variability in coastal water budgets, and highlights that SGD-dominated systems may not represent universal conditions, suggesting that case-specific hydrogeological controls on discharge patterns.
The aquifer exhibits weak hydrodynamic conditions, characterized by the presence of perched water and significant fluctuations in chemical composition. These features indicate a non-continuous and dynamic aquifer system. Furthermore, the significant variability of the shallow groundwater system over small spatial scales highlights its internal heterogeneity. This heterogeneity likely arises from variations in groundwater recharge sources, the complexity of aquifer structures, and differences in regional hydrogeochemical conditions.
Despite the drilling site’s proximity to the Ningyuan estuary, the Quaternary shallow aquifer demonstrates substantial water scarcity, with limited seepage capacity toward the ocean and a diminished ability to transport terrestrial nutrient components. Annual precipitation predominantly flows into the sea via surface runoff, with groundwater seepage contributing minimally. Based on the estimated permeability coefficient of the Quaternary aquifer, the annual seepage flux of shallow Quaternary water in the Sanya area is calculated to be 455.5 m3/a, corresponding to a potential N2O flux of 2.7 × 10³ g/a.
This study revealed a novel conceptual flow model for the subterranean estuary, characterized by an approximately vertical mixing zone between freshwater discharge and the deep saltwater wedge, with a freshwater discharge wedge overlying the deeper saltwater wedge. This model deviates from the typically observed intertidal saltwater cell (ISC) or upper saline plume (USP), which is a high-salinity zone driven by tidal fluctuations. The observed reduction in the saltwater intrusion critical shift (ISC/USP) in this study can be attributed to modifications of the unconfined aquifer system caused by the construction of the artificial sand beach. These findings suggest that the slope and receding intertidal zone exert a controlling influence on groundwater discharge processes.
The study highlights the substantial influence of anthropogenic activities on groundwater dynamics in coastal aquifers. Human interventions, including gardening, irrigation, and artificial beach reclamation, can significantly disrupt natural hydrological processes. These findings underscore the intricate interplay between natural systems and human-induced modifications in coastal groundwater environments.

Author Contributions

In the study, D.Q. designed the study, carried out the study, analyzed the data, and wrote the paper. J.G., B.R. and B.Y. participated in planning and management while performing the research. All authors have read and agreed to the published version of the manuscript.

Funding

This work was financially supported by the specific research fund of the Innovation Platform for Academicians of Hainan Province (Grant No. YSPTZX202025).

Data Availability Statement

Data are contained within the article.

Acknowledgments

We would like to express our gratitude to Hao Wu, Jiang Chen, Luo Juan, and Yuanhang Jiang for their assistance in fieldwork.

Conflicts of Interest

The authors declare no conflicts of interest.

References

  1. Michael, H.A.; Post, V.E.A.; Wilson, A.M.; Werner, A.D. Science, society, and the coastal groundwater squeeze. Water Resour. Res. 2017, 53, 2610–2617. [Google Scholar] [CrossRef]
  2. Werner, A.D.; Bakker, M.; Post, V.E.A.; Vandenbohede, A.; Lu, C.; Ataie-Ashtiani, B.; Simmons, C.T.; Barry, D.A. Seawater intrusion processes, investigation and management: Recent advances and future challenges. Adv. Water Resour. 2013, 51, 3–26. [Google Scholar] [CrossRef]
  3. Murray, R.H.; Erler, D.V.; Eyre, B.D. Nitrous oxide fluxes in estuarine environments: Response to global change. Glob. Change Biol. 2015, 21, 3219–3245. [Google Scholar] [CrossRef] [PubMed]
  4. Jurado, A.; Borges, A.V.; Brouyère, S. Dynamics and emissions of N2O in groundwater: A review. Sci. Total Environ. 2017, 584–585, 207–218. [Google Scholar] [CrossRef]
  5. Burnett, W.C.; Bokuniewicz, H.; Huettel, M.; Moore, W.S.; Taniguchi, M. Groundwater and pore water inputs to the coastal zone. Biogeochemistry 2003, 66, 3–33. [Google Scholar] [CrossRef]
  6. Moore, W.S.; Sarmiento, J.L.; Key, R.M. Submarine groundwater discharge revealed by 228Ra distribution in the upper Atlantic Ocean. Nat. Geosci. 2008, 1, 309–311. [Google Scholar] [CrossRef]
  7. Mcallister, S.M.; Barnett, J.M.; Heiss, J.W.; Findlay, A.J.; Macdonald, D.J.; Dow, C.L.; Luther, G.W.; Michael, H.A.; Chan, C.S. Dynamic hydrologic and biogeochemical processes drive microbially enhanced iron and sulfur cycling within the intertidal mixing zone of a beach aquifer: Fe and S cycling in a beach aquifer. Limnol. Oceanogr. 2015, 60, 329–345. [Google Scholar] [CrossRef]
  8. Robinson, C.E.; Xin, P.; Santos, I.R.; Charette, M.A.; Li, L.; Barry, D.A. Groundwater dynamics in subterranean estuaries of coastal unconfined aquifers: Controls on submarine groundwater discharge and chemical inputs to the ocean. Adv. Water Resour. 2018, 115, 315–331. [Google Scholar] [CrossRef]
  9. Ward, B.B. Nitrification and denitrification: Probing the nitrogen cycle in aquatic environments. Microb. Ecol. 1996, 32, 247–261. [Google Scholar] [CrossRef]
  10. Codispoti, L.A.; Brandes, J.; Christensen, J.P.; Devol, A.; Naqvi, S.W.A.; Paerl, H.; Yoshinari, T. The Oceanic Fixed Nitrogen and Nitrous Oxide Budgets: Moving Targets as We Enter the Anthropocene? Sci. Mar. 2001, 65, 85–105. [Google Scholar] [CrossRef]
  11. Myrhe, G.; Shindell, D.; Breon, F.M.; Collins, W.; Al, E. Anthropogenic and natural radiative forcing. In Climate Change 2013 the Physical Science Basis: Working Group I Contribution to the Fifth Assessment Report of the Intergovernmental Panel on Climate Change; Chapter 8: Anthropogenic and Natural Radiative Forcing; Cambridge University Press: Cambridge, UK, 2013; pp. 659–740. [Google Scholar]
  12. Prieto, C.; Destouni, G. Is submarine groundwater discharge predictable? Geophys. Res. Lett. 2011, 38, L01402. [Google Scholar] [CrossRef]
  13. Lee, D.R. A device for measuring seepage flux in lakes and estuaries. Limnol. Oceanogr. 1977, 22, 140–147. [Google Scholar] [CrossRef]
  14. Moore, W.S. The subterranean estuary: A reaction zone of ground water and sea water. Mar. Chem. 1999, 65, 111–125. [Google Scholar] [CrossRef]
  15. Schlüter, M.; Sauter, E.J.; Andersen, C.E.; Dahlgaard, H.; Dando, P.R. Spatial Distribution and Budget for Submarine Groundwater Discharge in Eckernförde Bay (Western Baltic Sea). Limnol. Oceanogr. 2004, 49, 157–167. [Google Scholar] [CrossRef]
  16. Bianchi Janetti, E.; Dror, I.; Riva, M.; Guadagnini, A.; Sanchez-Vila, X.; Berkowitz, B. Mobility and Interaction of Heavy Metals in a Natural Soil. Transp. Porous Media 2013, 97, 295–315. [Google Scholar] [CrossRef]
  17. Karabulut, S.; Cengiz, M.; Balkaya, Ç.; Aysal, N. Spatio-Temporal Variation of Seawater Intrusion (SWI) inferred from geophysical methods as an ecological indicator; A case study from Dikili, NW İzmir, Turkey. J. Appl. Geophys. 2021, 189, 104318. [Google Scholar] [CrossRef]
  18. Burnett, W.C.; Dulaiova, H. Estimating the dynamics of groundwater input into the coastal zone via continuous radon-222 measurements. J. Environ. Radioact. 2003, 69, 21–35. [Google Scholar] [CrossRef]
  19. Taniguchi, M. Tidal effects on submarine groundwater discharge into the ocean. Geophys. Res. Lett. 2002, 29, 2-1–2-3. [Google Scholar] [CrossRef]
  20. Slomp, C.P.; Van Cappellen, P. Nutrient inputs to the coastal ocean through submarine groundwater discharge: Controls and potential impact. J. Hydrol. 2004, 295, 64–86. [Google Scholar] [CrossRef]
  21. Kroeger, K.D.; Swarzenski, P.W.; Greenwood, W.J.; Reich, C. Submarine groundwater discharge to Tampa Bay: Nutrient fluxes and biogeochemistry of the coastal aquifer. Mar. Chem. 2007, 104, 85–97. [Google Scholar] [CrossRef]
  22. World Meteorological Organization (WMO). Scientific Assessment of Ozone Depletion: 2022, GAW Report No. 278. 509; World Meteorological Organization (WMO): Geneva, Switzerland, 2022. [Google Scholar]
  23. Li, B.; Huang, J.; Hu, X.; Zhang, L.; Ma, M.; Hu, L.; Chen, D.; Du, Q.; Sun, Y.; Cai, Z.; et al. CCl4 emissions in eastern China during 2021–2022 and exploration of potential new sources. Nat. Commun. 2024, 15, 1725. [Google Scholar] [CrossRef] [PubMed]
  24. Rigby, M.; Park, S.; Saito, T.; Western, L.M.; Redington, A.L.; Fang, X.; Henne, S.; Manning, A.J.; Prinn, R.G.; Dutton, G.S.; et al. Increase in CFC-11 emissions from eastern China based on atmospheric observations. Nature 2019, 569, 546–550. [Google Scholar] [CrossRef]
  25. Benish, S.E.; Salawitch, R.J.; Ren, X.; He, H.; Dickerson, R.R. Airborne Observations of CFCs Over Hebei Province, China in Spring 2016. J. Geophys. Res. Atmos. 2021, 126, e2021JD035152. [Google Scholar] [CrossRef]
  26. Darling, W.G.; Gooddy, D.C.; MacDonald, A.M.; Morris, B.L. The practicalities of using CFCs and SF6 for groundwater dating and tracing. Appl. Geochem. 2012, 27, 1688–1697. [Google Scholar] [CrossRef]
  27. Chambers, L.A.; Gooddy, D.C.; Binley, A.M. Use and application of CFC-11, CFC-12, CFC-113 and SF6 as environmental tracers of groundwater residence time: A review. Geosci. Front. 2018, 10, 1643–1652. [Google Scholar] [CrossRef]
  28. Darling, W.G.; Gooddy, D.C.; Riches, J.; Wallis, I. Using environmental tracers to assess the extent of river–groundwater interaction in a quarried area of the English Chalk. Appl. Geochem. 2010, 25, 923–932. [Google Scholar] [CrossRef]
  29. Zhang, H.F.; Yu, S.W.; Fu, Y.L.; Wang, X.L.; Wu, D.Y.; Fu, G.J. Demonstration on Emergency Groundwater Field in Hongtang Bay, Sanya City of Hainan Province. S. China Geol. 2021, 37, 330–338. [Google Scholar]
  30. Taniguchi, M.; Ishitobi, T.; Shimada, J. Dynamics of submarine groundwater discharge and freshwater-seawater interface. J. Geophys. Res. Oceans 2006, 111, C01008. [Google Scholar] [CrossRef]
  31. Li, H.; Boufadel, M.C.; Weaver, J.W. Tide-induced seawater–groundwater circulation in shallow beach aquifers. J. Hydrol. 2008, 352, 211–224. [Google Scholar] [CrossRef]
  32. Robinson, C.; Gibbes, B.; Carey, H.; Li, L. Salt-freshwater dynamics in a subterranean estuary over a spring-neap tidal cycle. J. Geophys. Res. Oceans 2007, 112, C09007. [Google Scholar] [CrossRef]
  33. Pool, M.; Post, V.E.A.; Simmons, C.T. Effects of tidal fluctuations on mixing and spreading in coastal aquifers: Homogeneous case. Water Resour. Res. 2014, 50, 6910–6926. [Google Scholar] [CrossRef]
  34. Charette, M.A.; Sholkovitz, E.R. Oxidative precipitation of groundwater-derived ferrous iron in the subterranean estuary of a coastal bay. Geophys. Res. Lett. 2002, 29, 85-81–85-84. [Google Scholar] [CrossRef]
  35. Charbonnier, C.; Anschutz, P.; Poirier, D.; Bujan, S.; Lecroart, P. Aerobic respiration in a high-energy sandy beach. Mar. Chem. 2013, 155, 10–21. [Google Scholar] [CrossRef]
  36. Santos, I.R.; Eyre, B.D.; Huettel, M. The driving forces of porewater and groundwater flow in permeable coastal sediments: A review. Estuar. Coast. Shelf Sci. 2012, 98, 1–15. [Google Scholar] [CrossRef]
  37. Itugha, O.D.; Chen, D.; Guo, Y. Pollutant advective spreading in beach sand exposed to high-energy tides. Estuar. Coast. Shelf Sci. 2016, 181, 70–82. [Google Scholar] [CrossRef]
  38. Abarca, E.; Karam, H.; Hemond, H.F.; Harvey, C.F. Transient groundwater dynamics in a coastal aquifer: The effects of tides, the lunar cycle, and the beach profile. Water Resour. Res. 2013, 49, 2473–2488. [Google Scholar] [CrossRef]
  39. Urish, D.W.; McKenna, T.E. Tidal Effects on Ground Water Discharge Through a Sandy Marine Beach. Groundwater 2004, 42, 971–982. [Google Scholar] [CrossRef]
  40. Michael, H.A.; Mulligan, A.E.; Harvey, C.F. Seasonal oscillations in water exchange between aquifers and the coastal ocean. Nature 2005, 436, 1145–1148. [Google Scholar] [CrossRef]
  41. Heiss, J.W.; Michael, H.A. Saltwater-freshwater mixing dynamics in a sandy beach aquifer over tidal, spring-neap, and seasonal cycles. Water Resour. Res. 2014, 50, 6747–6766. [Google Scholar] [CrossRef]
  42. Han, Q.; Chen, D.; Guo, Y.; Hu, W. Saltwater-freshwater mixing fluctuation in shallow beach aquifers. Estuar. Coast. Shelf Sci. 2018, 207, 93–103. [Google Scholar] [CrossRef]
  43. Grünenbaum, N.; Günther, T.; Greskowiak, J.; Vienken, T.; Müller-Petke, M.; Massmann, G. Salinity distribution in the subterranean estuary of a meso-tidal high-energy beach characterized by Electrical Resistivity Tomography and direct push technology. J. Hydrol. 2023, 617, 129074. [Google Scholar] [CrossRef]
  44. Ataie-Ashtiani, B.; Volker, R.E.; Lockington, D.A. Tidal effects on sea water intrusion in unconfined aquifers. J. Hydrol. 1999, 216, 17–31. [Google Scholar] [CrossRef]
  45. Fiori, A.; Jankovic, I. On Preferential Flow, Channeling and Connectivity in Heterogeneous Porous Formations. Math. Geosci. 2012, 44, 133–145. [Google Scholar] [CrossRef]
  46. Greskowiak, J.; Massmann, G. The impact of morphodynamics and storm floods on pore water flow and transport in the subterranean estuary. Hydrol. Process. 2021, 35, e14050. [Google Scholar] [CrossRef]
  47. Schiavo, M.; Colombani, N.; Mastrocicco, M. Modeling stochastic saline groundwater occurrence in coastal aquifers. Water Res. 2023, 235, 119885. [Google Scholar] [CrossRef]
  48. Schiavo, M.; Riva, M.; Guadagnini, L.; Zehe, E.; Guadagnini, A. Probabilistic identification of Preferential Groundwater Networks. J. Hydrol. 2022, 610, 127906. [Google Scholar] [CrossRef]
  49. Riva, M.; Guadagnini, A.; Dell’Oca, A. Probabilistic assessment of seawater intrusion under multiple sources of uncertainty. Adv. Water Resour. 2015, 75, 93–104. [Google Scholar] [CrossRef]
Figure 1. Generalized geological map of the Yazhou Bay, Sanya, Hainan province. (a) Geologic map; (b) cross section (modified from Zhang et al., 2021 [29]).
Water 17 01371 g001
Figure 2. Locations of shallow Wells on the Coastal Beach of Yazhou Bay, Sanya, Hainan. The red solid circles indicate the well locations, sequentially labeled from ZK1 to ZK7. The yellow square markers delineate the positions of both the lower and upper tidal boundaries. Along the 145 m profile span wells ZK1 to ZK7; wells ZK1 and ZK2 are situated within the lower intertidal zone, with ZK1 being completely seawater filled and ZK2 showing predominant seawater characteristics. The beach was artificially replenished with sand and extended seaward through coastal engineering. A creative park had been established east of the well profile, with another park development in progress on the western side.
Water 17 01371 g002
Figure 3. Distribution of seven observation wells on the beach of Yazhou Bay, Sanya. Panel (a) displays the locations of the wells, and sampling points denoted by solid blue circles, which represent the sampling points for salinity along with the corresponding salinity contours. Panel (b) uses solid purple circles to indicate the sampling points for groundwater pH, along with pH contours. The horizontal axis represents the distance from the lower intertidal cliff line, measured perpendicularly northward. In panel (a), blue circles mark the sampling points for groundwater salinity, accompanied by the salinity contours. Subplot (b) is presented at the same scale and dimensions as subplot (a). The dot size scales proportionally with the corresponding values.
Water 17 01371 g003
Figure 4. Time Series of Temperature, Water Level, and Conductivity in Well ZK2. ∆T = Tm − 28 °C, Tm is the measured temperature. The light-gray shaded area indicates the occurrence of seawater intrusion into ZK2 during the high tide at midnight.
Water 17 01371 g004
Figure 5. Boxplot of temperature, salinity(converted from EC values), pH and N2O for groundwater from seven wells and seawaters next to ZK1 in Yazhou Bay, Sanya. Solid circles in each subplot indicate multiple observation values, in box plots of temperature (a), salinity (converted from EC values) (b), pH (c), and N2O concentration (d).
Water 17 01371 g005
Figure 7. Conceptual models of submarine groundwater discharge (SGD) and flow dynamics in coastal unconfined aquifers (a) Groundwater flow components of SGD [38]; (b) newly conceptualized groundwater flow components in a coastal unconfined aquifer modified by an artificial sand beach (ASB), as proposed in this study. The red dotted arrow line denotes density driven deep saltwater circulation. The light blue dotted arrow line denotes fresh groundwater discharge. Abbreviations: ISI, intertidal saltwater infiltration; ISC, intertidal saltwater cell; DSI, deep seawater infiltration; DSD, deep seawater discharge; DSW, deep seawater wedge; FGD, fresh groundwater discharge; ASB, artificial sandy beach. The shading in the figure (light gray for freshwater and dark gray for saltwater) illustrates the typical salinity distribution, featuring the classical saltwater wedge and freshwater discharge.
Water 17 01371 g007
Table 1. Statistical Analysis of N2O in Groundwater and Seawater in the Sanya Area. Unit of N2O: nmol/L.
Number of WellsNumber of SamplesMeanSTDMedianSumMinimumMaximum
ZK7215.151.1115.1530.314.3615.94
ZK6257.7739.8357.77115.5429.685.93
ZK5256.3428.556.34112.6836.1976.5
ZK429.699.419.6919.393.0416.35
ZK3310.857.711.2332.542.9618.35
ZK2323.0322.9314.7469.15.448.96
ZK126.631.036.6313.255.97.35
Seawater311.46.259.0934.216.6418.48
Note: Seawater: seawater sample was taken next to ZK1.
Disclaimer/Publisher’s Note: The statements, opinions and data contained in all publications are solely those of the individual author(s) and contributor(s) and not of MDPI and/or the editor(s). MDPI and/or the editor(s) disclaim responsibility for any injury to people or property resulting from any ideas, methods, instructions or products referred to in the content.

