Article

Hydrochemical Characteristics and Controlling Factors of Hengshui Lake Wetland During the Dry Season, North China

1
Langfang Integrated Natural Resources Survey Center, China Geological Survey, Langfang 065000, China
2
Innovation Base for Natural Resource Monitoring Technology in the Lower Reaches of Yongding River, Geological Society of China, Langfang 065000, China
3
Hebei Center for Ecological and Environmental Geology Research, Hebei GEO University, Shijiazhuang 050031, China
4
Shandong Provincial Lunan Geology and Exploration Institute (Shandong Provincial Bureau of Geology and Mineral Resources No. 2 Geological Brigade), Jining 250014, China
*
Authors to whom correspondence should be addressed.
Water 2025, 17(10), 1468; https://doi.org/10.3390/w17101468
Submission received: 18 April 2025 / Revised: 6 May 2025 / Accepted: 12 May 2025 / Published: 13 May 2025
(This article belongs to the Special Issue Groundwater Flow and Transport Modeling in Aquifer Systems)

Abstract

:
Wetland lakes are crucial ecosystems that serve as vital ecosystems that harbor rich biodiversity and provide essential ecological services, particularly in regulating regional water resources, purifying water quality, and maintaining ecological equilibrium. This study aims to conduct an in-depth investigation into the hydrochemical characteristics and their controlling factors during the dry season of the Hengshui Lake wetland system. By collecting water samples from the lake and shallow groundwater, and using water chemistry diagrams, ion ratios, mineral saturation indices, and multivariate statistical methods, the study systematically analyzes the hydrochemical characteristics of Hengshui Lake Wetland and its controlling factors. The results show: there is significant stratified differentiation in the water chemical composition: the lake water is weakly alkaline and fresh, while the shallow groundwater is highly mineralized and saline. Both are dominated by Na+, Mg2+, SO42−, and Cl. Significant differences exist in water chemistry types between the lake and shallow groundwater. The lake water exhibits homogenized characteristics with a dominant SO4·Cl·HCO3-Na·Mg type, whereas shallow groundwater displays five distinct hydrochemical facies indicative of multi-source recharge processes. Evaporation–rock interaction mechanisms dominate the system, as evidenced by a Gibbs diagram analysis showing evaporation crystallization as the primary control. Ion ratio calculations demonstrate synergistic effects between silicate weathering and evaporite dissolution, while mineral saturation indices confirm cooperative processes involving calcite/dolomite oversaturation and ongoing gypsum dissolution. Cation exchange indexes combined with chloro-alkaline indices reveal unidirectional recharge from lake water to shallow groundwater accompanied by active cationic exchange adsorption. Although the wetland predominantly maintains natural hydrological conditions, elevated γ(NO3)/γ(Na+) ratios in nearshore zones suggest initial agricultural contamination infiltration. This study shows that, as a typical example of a closed wetland, the hydrochemistry evolution of Hengshui Lake during the dry season is primarily dominated by the coupled effects of evaporation and rock–water interaction, with silicate weathering and evaporation rock dissolution as secondary factors, and human activity having a weak influence. The findings provide new insights into the understanding of the hydrochemical evolution process and its controlling factors in closed lakes, offering valuable data support and theoretical basis for the ecological restoration and sustainable management of closed lakes.

1. Introduction

The chemical characteristics of water reflect the interaction between water and the geological environment, which can reveal the extent of water–rock interactions and the influence of human activities [1,2]. The major ion composition of water is key to understanding its chemical characteristics and helps identify various factors influencing water chemistry [3]. Wetland lakes refer to lacustrine systems situated within wetland ecosystems, typically characterized by shallow water depths and abundant aquatic vegetation or organic-rich sediments [4]. Wetland lakes are the core of terrestrial ecosystems, playing crucial roles in maintaining biodiversity, purifying water, regulating water resources, and climate [5,6]. Wetland lakes in North China Plain are widely distributed along rivers, lakes, and depressions, especially within the Yellow River and Haihe River basins and surrounding areas. Regional climate, hydrological conditions, and human activities influence the chemical composition of wetland lake waters through different mechanisms. Climate factors, such as precipitation and temperature, directly affect the lake’s water volume and evaporation rate, thereby influencing the salinity and other chemical components of the water. Hydrological conditions, particularly groundwater recharge and discharge, alter the water quality of the lake. Human activities, such as agricultural irrigation and industrial pollution, also significantly impact the chemical characteristics of the water by introducing external substances [7,8,9]. Although there have been some studies on the water chemical characteristics and their evolution of wetland lakes globally, research on the water chemical characteristics and evolutionary processes of closed wetland lakes during the dry season remains relatively scarce. Due to the lack of exchange with external water bodies, the changes in water quality and chemical characteristics of closed wetland lakes during the dry season are particularly complex, and this phenomenon varies significantly across different regions and ecosystems. Therefore, systematically studying the water chemical characteristics and evolutionary mechanisms of closed wetland lakes during the dry season is crucial for revealing the dynamic changes in these lakes’ water bodies in specific seasons. Further research will help us better understand the water quality evolution patterns of such lakes and their impact on regional ecological environments, especially in the context of climate change and increasing human activities. This research area still has considerable gaps [10,11,12,13]. Investigating the hydrochemical processes driving ecological restoration mechanisms in lake wetlands constitutes an intricate and dynamic system involving hydrological, geochemical, and ecological dimensions [14]. Elucidating the synergistic interactions among these processes establishes theoretical foundations and technological frameworks for wetland conservation and rehabilitation, thereby advancing sustainable ecosystem management and restoration strategies [15,16].
Hengshui Lake Wetland, recognized as the largest inland freshwater lake by single waterbody surface area in North China Plain, represents the sole inland wetland preserving a complete ecosystem encompassing open water, marshes, mudflats, meadows, and riparian forests. This unique ecosystem plays a critical role in regional climatic regulation, flood mitigation, water storage capacity, and maintenance of ecological equilibrium [17]. However, due to the area’s arid climate and scarce water resources, Hengshui Lake mainly relies on external water supplementation to maintain the stability of its ecosystem [18,19]. Hengshui Lake Wetland is a closed water body, and the sediment at the bottom of the lake, along with the decomposition products of aquatic plants, has led to increasingly severe internal pollution, posing a significant challenge to the lake’s ecological protection [20,21]. Recent studies have extensively investigated groundwater dynamics [22], water quality assessment [23], heavy metal contamination [24,25], aquatic environmental quality [26,27], and spatial distribution of aquatic vegetation [28] in the Hengshui Lake Wetland. Despite these advancements, critical knowledge gaps persist regarding the hydrochemical evolution processes and their dominant controlling factors within this wetland ecosystem.
The present study aims to resolve the core scientific question: What are the hydrochemical characteristics and their dominant controlling factors in the water bodies of Hengshui Lake Wetland during the dry season? Through systematic sampling of surface water and shallow groundwater specimens within the wetland, this investigation conducts in-depth analyses of hydrochemical evolutionary patterns and their genetic mechanisms, while elucidating the influence mechanisms of regional geological settings and anthropogenic activities on aquatic chemical signatures. The research outcomes will not only contribute to delineating the evolutionary trajectory of chemical characteristics in lacustrine wetland waters but also provide scientific underpinnings for ecological conservation and restoration initiatives in wetland–lake ecosystems.

2. Materials and Methods

2.1. Study Area

Hengshui Lake Wetland is located in the heart of the North China Plain, situated at the triangular center formed by Jizhou District, Taocheng District of Hengshui City, and Zaoxiang County (Figure 1). This medium-sized shallow freshwater lake wetland maintains a perennial water surface area of 42 km2 and a water depth of 2–3 m. Hengshui Lake Wetland belongs to a continental semi-humid and semi-arid monsoon climate zone characterized by synchronized rainfall and heat patterns, distinct seasonal variations, and an average annual temperature of 12.6 °C [29]. The multi-year average precipitation recharge amounts to 14.114 million m3, while the average annual evaporation reaches 28.95 million m3 and seepage loss averages 11.098 million m3. Due to insufficient natural water inflow, artificial water replenishment is required to maintain the ecological health of Hengshui Lake [30].
The wetland’s surrounding water system belongs to the Ziya River Basin, a sub-basin of the Haihe River Basin. The Fuyang River, Fuyang Drainage River, and New Fuyang River are located to the north of the wetland, connecting with Hengshui Lake through sluice gates. There are two main water diversion routes for the wetland, with the eastern route being the primary water replenishment channel. The eastern route diverts water from the Yellow River through the Weiqian Canal, which then converges into Hengshui Lake via the Zhonggan Canal. The western route draws water from Gangnan Reservoir and Huangbizhuang Reservoir through the Jima Canal.
The Quaternary system around the wetland has a thickness of 450–470 m, with groundwater types consisting of Quaternary unconsolidated rock pore phreatic water and unconsolidated rock pore confined water. The phreatic water around the wetland is closely connected with the lake water. The phreatic aquifer belongs to the Holocene series, with the soil layer primarily composed of yellowish-brown and brownish-yellow silty clay. The sand layer mainly consists of yellowish-gray fine silt and silt, with a water table depth of 4–6 m [31].

2.2. Sampling and Measurement

Field investigations revealed that the northwestern and southeastern sectors of Hengshui Lake Wetland are densely vegetated with reeds and other emergent aquatic vegetation, rendering boat-based water sampling impractical. The wetland receives managed ecological water replenishment during spring (March–April) and autumn–winter periods (November–December), interventions known to induce short-term drastic fluctuations in hydrochemical composition. Concurrently, the monsoon season (late July to late August) introduces precipitation-induced interference to water chemistry. Considering these operational constraints and hydrological patterns, we strategically conducted sampling campaigns in early July 2023. This timing effectively captured baseline hydrochemical conditions prior to both monsoon impacts and artificial water supplementation, ensuring representative characterization of the wetland’s natural aquatic environment. A total of 10 lake water samples (Figure 1, HS01–HS10) and 5 shallow groundwater samples from wells with depths of 40–60 m (Figure 1, HD01–HD05) were systematically collected. The latitude and longitude of sampling points were determined using iRTK-5 (Hi-Target, Guangzhou China). Water samples were sealed in polyethylene bottles, collected within one day, and sent to the Laboratory of Hydrogeology and Environmental Geology Survey Center, China Geological Survey for analysis.
The pH values of water samples were determined using the glass electrode method (PHS-3C). Total dissolved solids (TDS) were measured through 105 °C drying-gravimetric analysis. Cations (Na+, Mg2+, Ca2+, K+) were quantified with an inductively coupled plasma optical emission spectrometer (TU-1810, Beijing Puxi General Instrument, Beijing, China ), while anions (SO42−, Cl, HCO3, NO3-N, F) were analyzed using ion chromatography (ICS-600, Thermo Fisher Scientific, Shanghai, China).
Quality assurance protocols included:
  • Accuracy control through standard solution spiking and spike recovery tests;
  • Precision control via replicate analyses (relative deviations within acceptable thresholds);
  • Blank monitoring with dual procedural blanks per batch (blank values ≤ 2/3 method detection limits);
  • Charge balance verification for all samples, demonstrating 100% compliance with the 4% allowable ion balance error threshold.

2.3. Data Analysis Method

The groundwater contour map was generated using the Geostatistical Analyst module in ArcGIS 10.7. Mathematical statistical analysis was performed using IBM SPSS Statistics 26, where Pearson correlation coefficient was employed to investigate the relationships between various indicators of different water bodies. Piper diagram, Gibbs diagram, and ion ratio plots were created using Origin 2022 to analyze hydrochemical types, ion sources, and controlling factors. The mineral saturation indices were calculated using PHREEQC Interactive (Version 3.7.3.15968).

3. Results and Analysis

3.1. Descriptive Statistics

All samples exhibit weakly alkaline properties (Table 1). The pH values of groundwater range from 7.30 to 7.69, with an average of 7.51, while the pH values of lake water range from 8.02 to 8.45, with an average of 8.31. The pH values of lake water are consistently higher than those of surrounding groundwater. The average TDS (Total Dissolved Solids) shows a significant contrast, with groundwater (3103.80 mg/L) being substantially higher than lake water (840.10 mg/L). All groundwater samples are classified as saline water, whereas all lake water samples are freshwater. The spatial distribution of TDS in lake water is relatively uniform. The average TA (Total Alkalinity) of groundwater is markedly higher than that of lake water.
The ranking of cation concentration proportions in groundwater is Na+ > Mg2+ > Ca2+ > K+, with Na+ and Mg2+ being the dominant cations. Their average concentrations are 22.42 mmol/L and 16.38 mmol/L, accounting for 48.72% and 29.70% of the total cation content, respectively. The ranking of anion concentration proportions in groundwater is SO42− > Cl > HCO3 > NO3-N > F, with SO42−, Cl, and HCO3 as the primary anions. Their average concentrations are 20.57 mmol/L, 17.47 mmol/L, and 10.40 mmol/L, representing 36.31%, 35.46%, and 25.14% of the total anion content, respectively.
The lake water exhibits the same order of cation and anion concentration proportions as groundwater. The main cations are Na+ and Mg2+, with mean concentrations of 7.15 mmol/L and 3.95 mmol/L, accounting for 50.47% and 27.91% of the total cation content, respectively. The primary anions are SO42−, Cl, and HCO3, with average concentrations of 5.21 mmol/L, 4.85 mmol/L, and 3.74 mmol/L, representing 37.42%, 34.87%, and 26.90% of the total anion content, respectively. In terms of coefficient of variation, groundwater shows generally higher coefficients for various indicators, while lake water displays lower ion concentration variability, indicating a relatively stable chemical composition in the lake water.

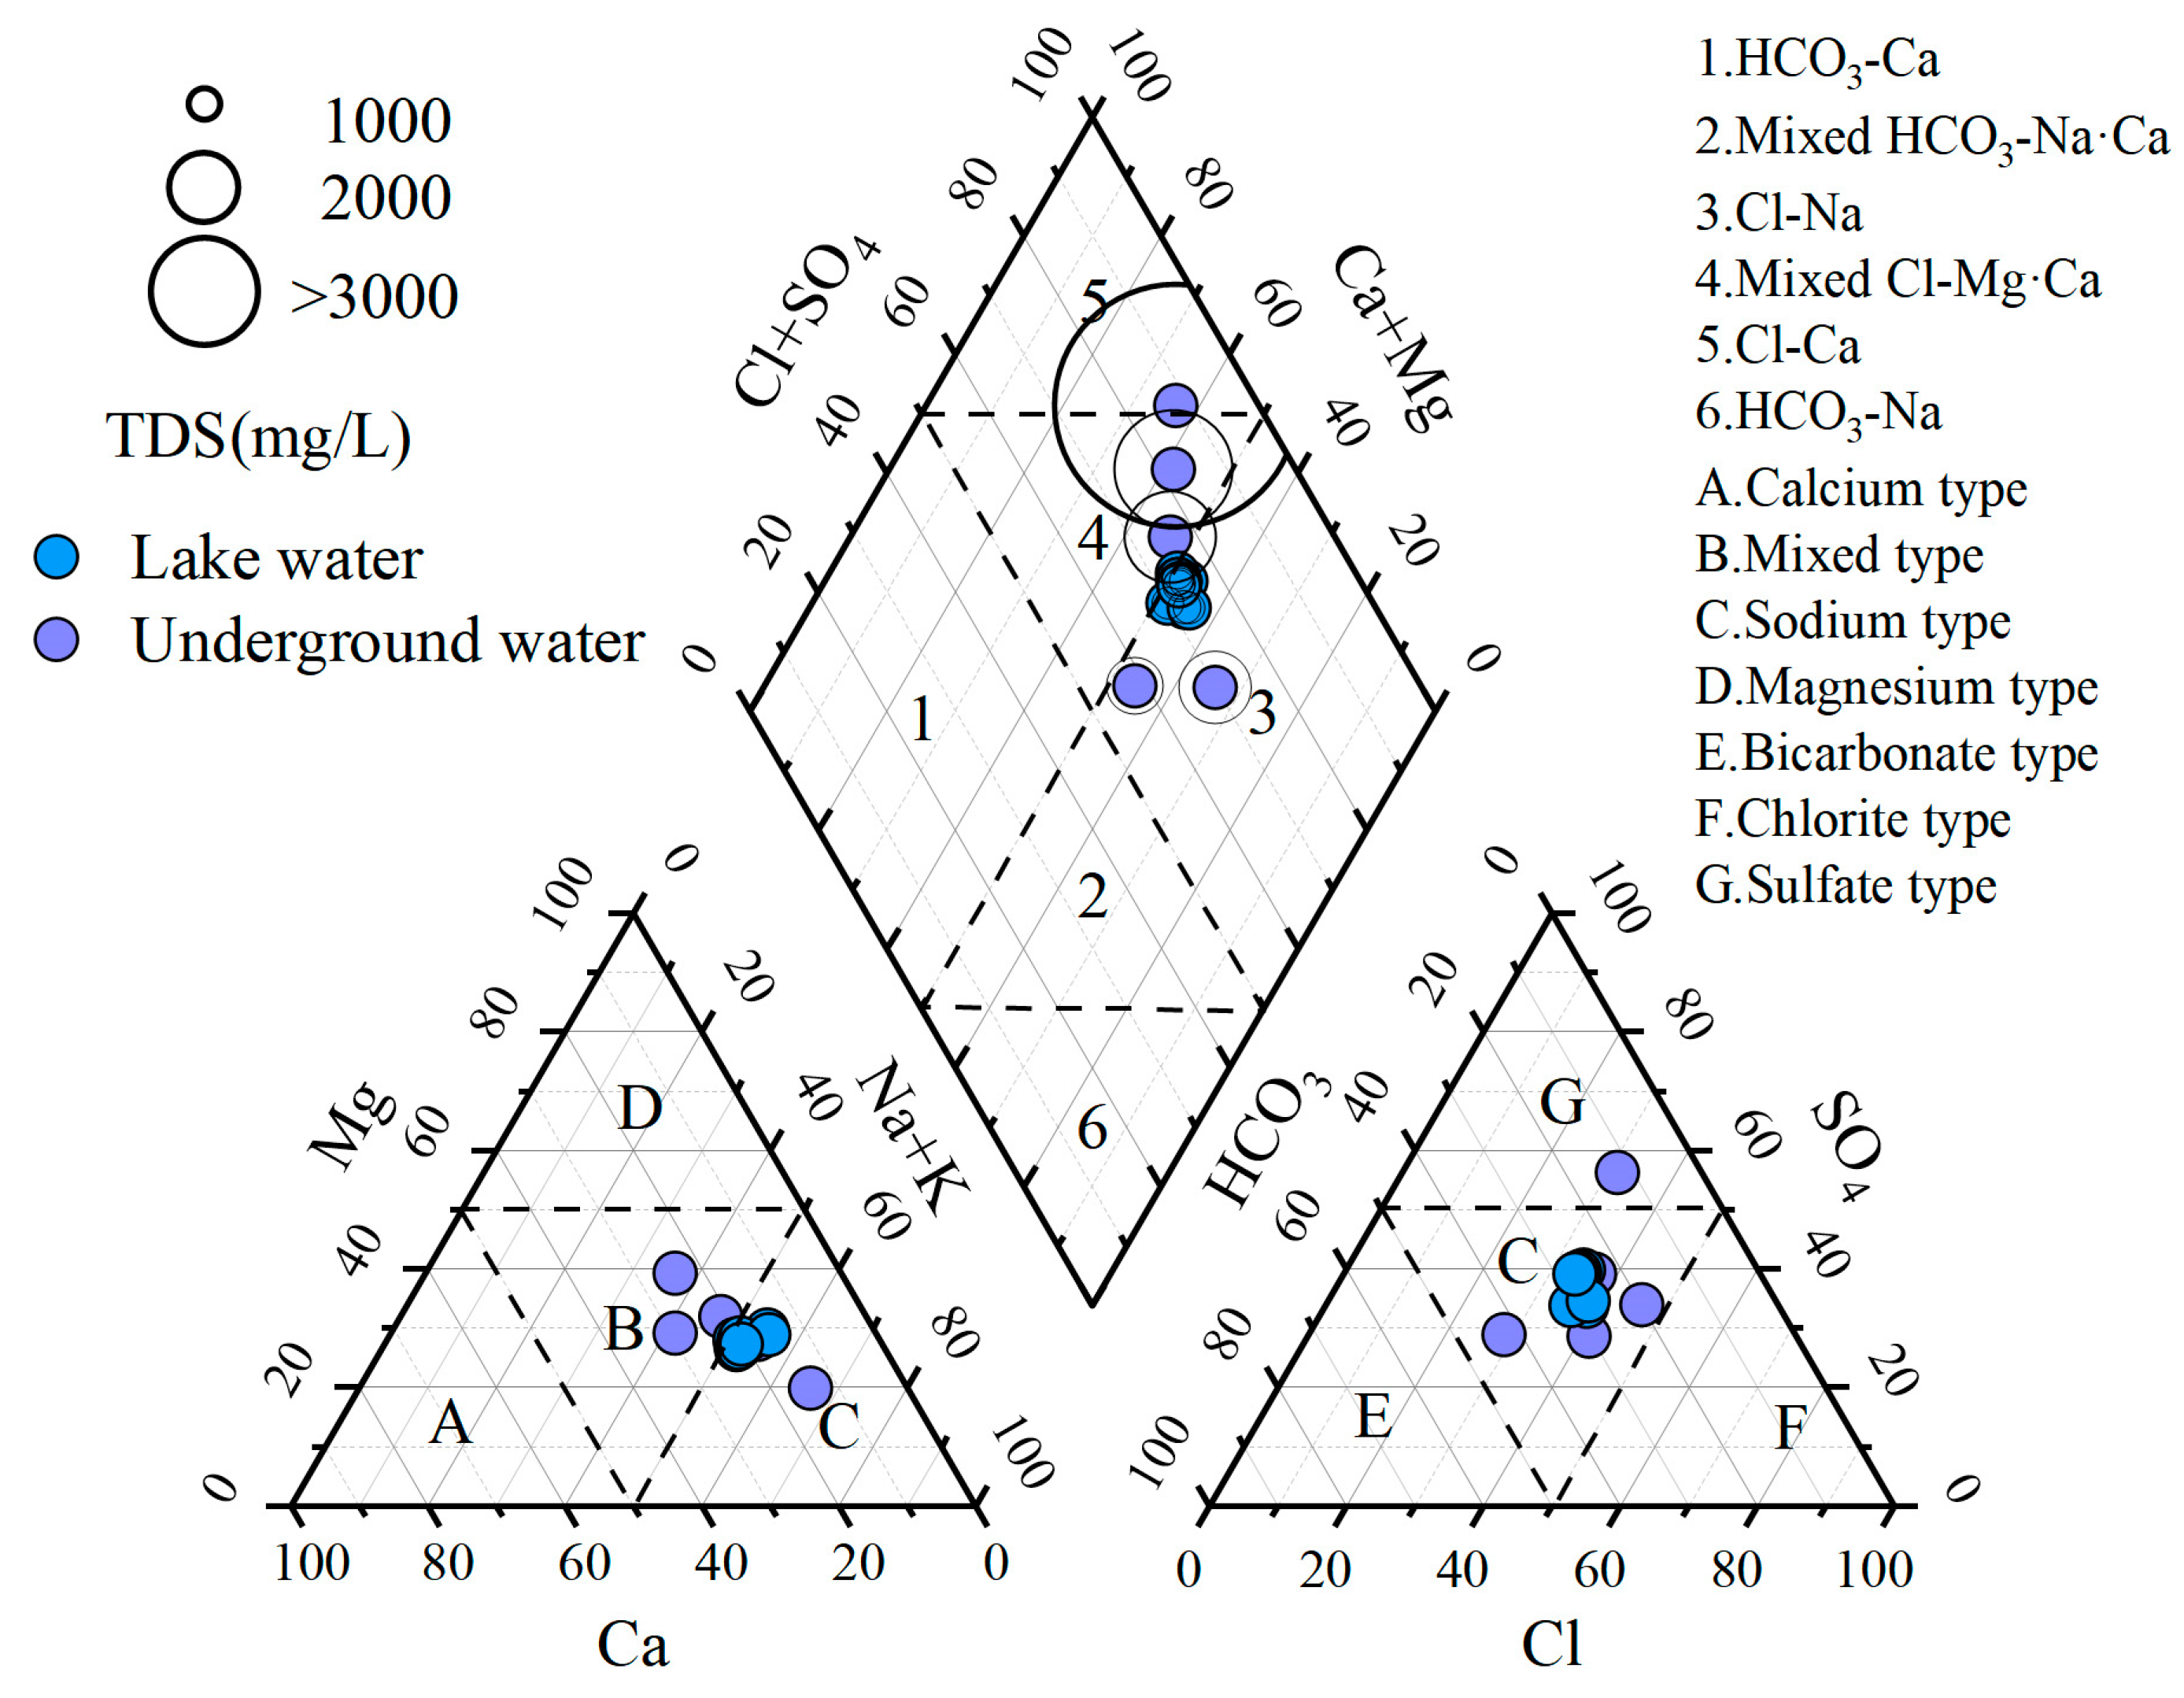
3.2. The Piper Diagram

The Piper Diagram provides a visual representation of the hydrochemical composition and evolutionary characteristics of different water bodies [32]. In the study area, most groundwater cations and anions fall within the non-dominant type region (Figure 2). Lake water cations are all located in the Na-type region, while anions are situated in the non-dominant type region. The diamond-shaped diagram reveals that both water bodies exhibit stronger acid radicals than weak acid radicals. Lake water shows non-carbonate alkalinity exceeding 50%. Groundwater samples are distributed across Ca-SO4 type, mixed type, and Na-Cl type regions, whereas all lake water samples fall within the Na-Cl type region. According to the Shukarev classification, groundwater exhibits more complex hydrochemical types, with five distinct types: HCO3·SO4·Cl-Na·Mg, Cl·SO4-Na·Mg·Ca, Cl·HCO3·SO4-Na, SO4·Cl-Mg·Na, and SO4·Cl-Na·Mg. Lake water demonstrates two hydrochemical types: SO4·Cl·HCO3-Na·Mg and Cl·SO4·HCO3-Na·Mg. The hydrochemical types in the study area indicate that groundwater has undergone complex hydrochemical processes, resulting in diversified chemical compositions. The differences between lake water and groundwater reflect distinct recharge sources and hydrological pathways. Wang Lijuan et al. [31] collected lake water, surrounding shallow groundwater, and surface water samples from the Hengshui Lake Wetland in May–June, 2017. The results of this study are consistent with the distribution shown in her Piper diagram.

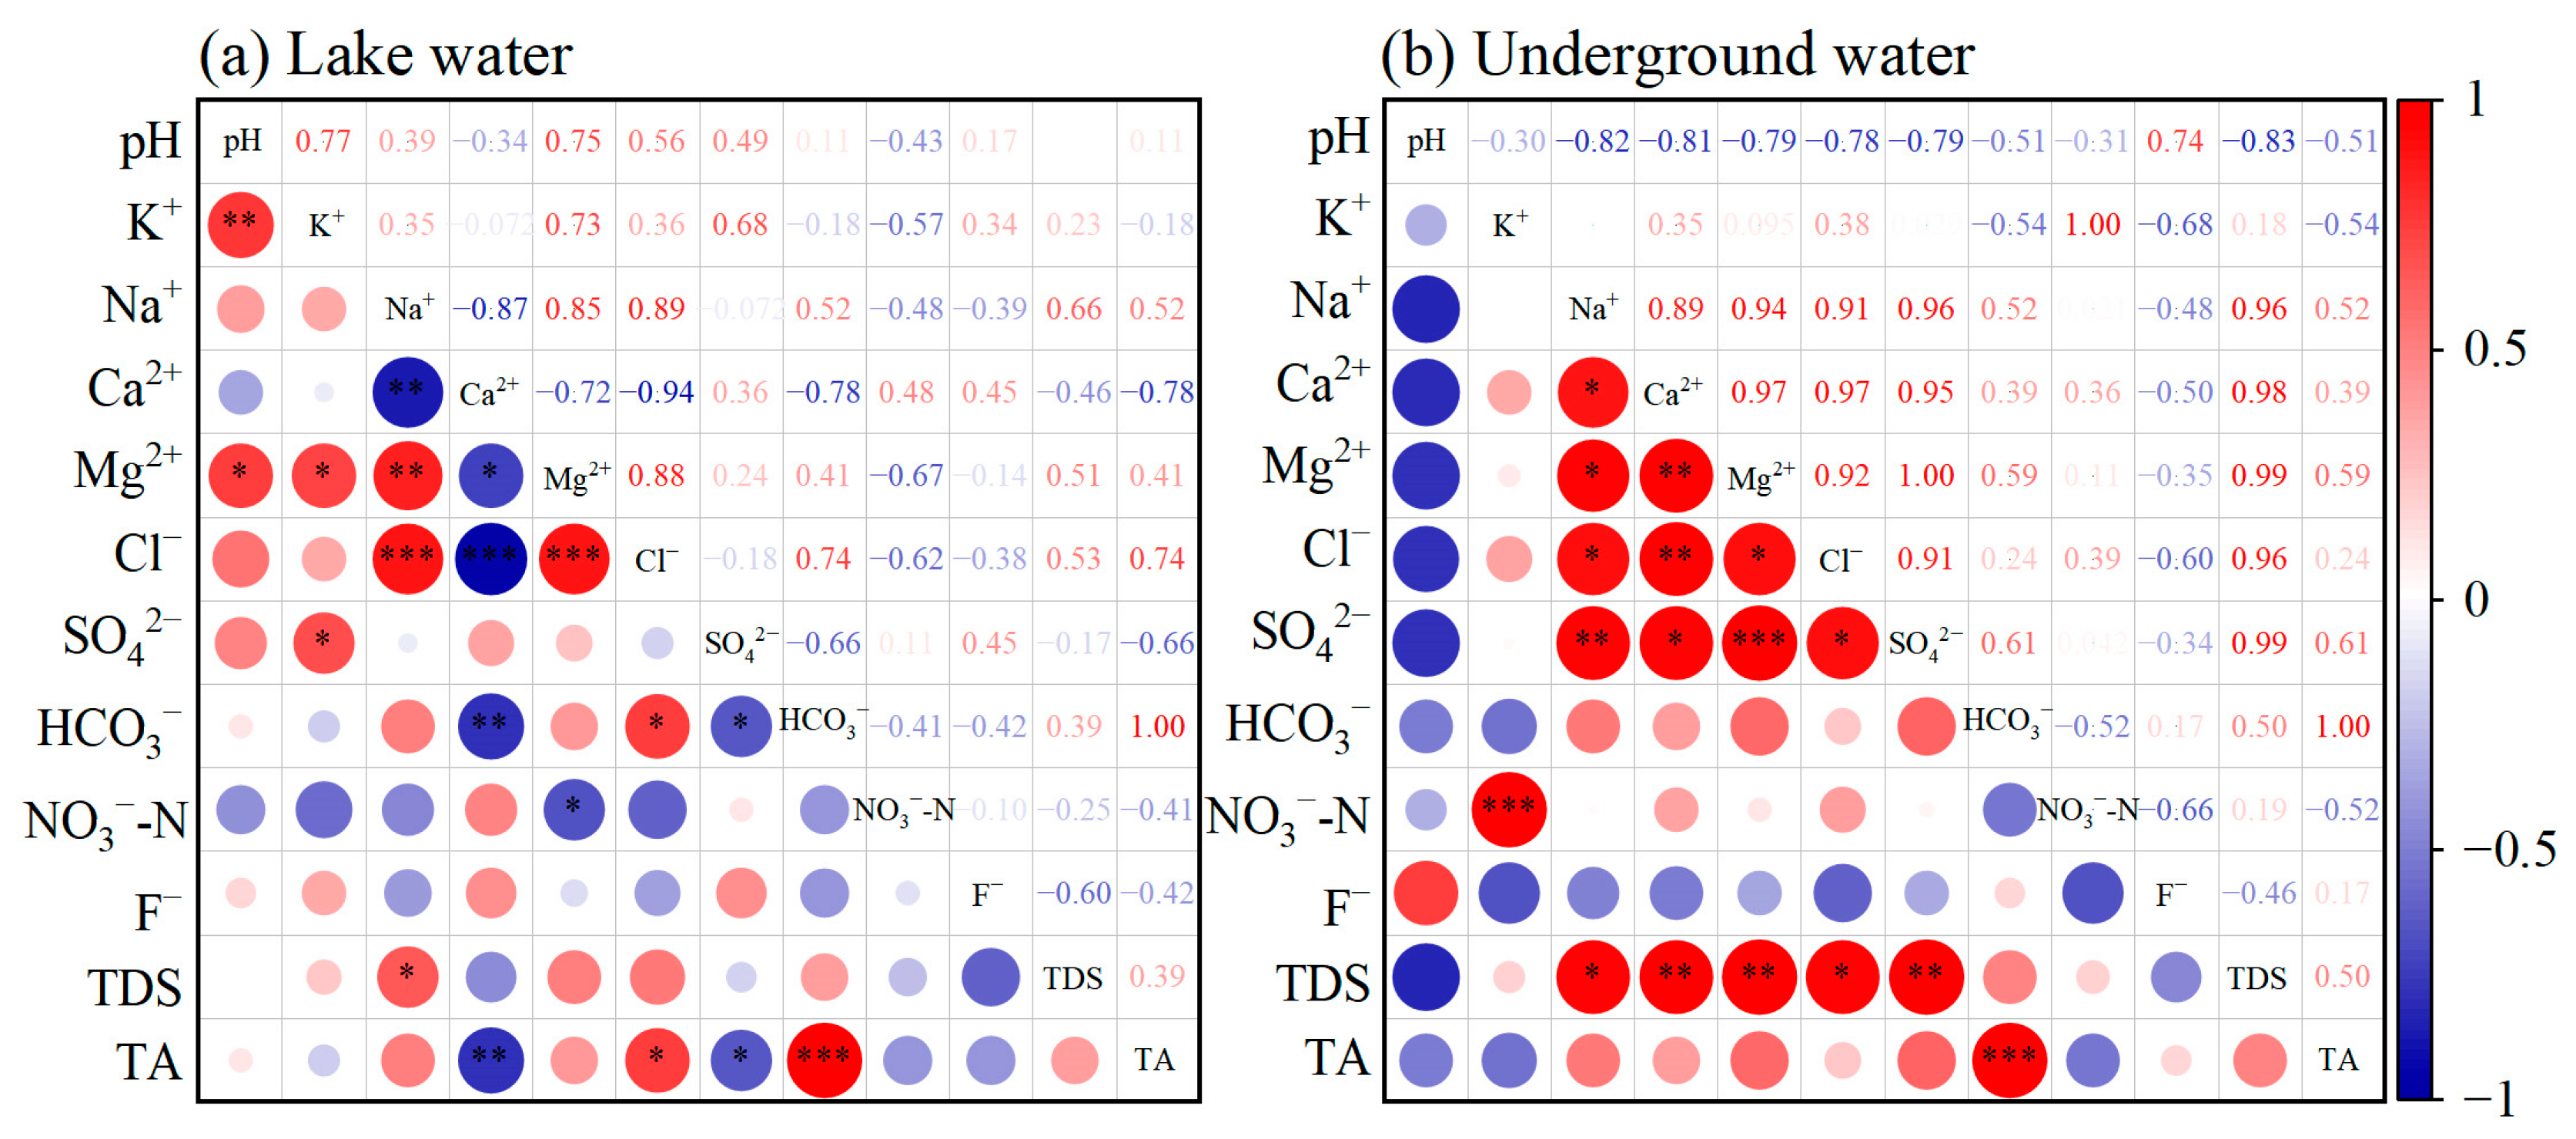
3.3. Correlation Analysis of Hydrochemical Indexes

Correlation analysis can determine whether the ions in the water chemical composition originate from the same source. Ions from the same source show a strong correlation, while those from different sources exhibit a weaker correlation [33]. The correlation between ion indicators in lake water (Figure 3a) shows that TDS is strongly correlated with Na+ (p < 0.05), indicating that Na+ makes the greatest contribution to TDS. pH shows a significant correlation with K+ (p < 0.01), suggesting that both may originate from similar dissolution processes under alkaline conditions. Na+, Mg2+, and Cl exhibit good correlation, indicating that they may have a common source or similar geochemical behavior. TA is significantly negatively correlated with HCO3, indicating that HCO3 directly affects the value of total alkalinity.
The correlation analysis of ion indicators in groundwater (Figure 3b) shows that TDS is significantly correlated with Na+, Ca2+, Mg2+, Cl, and SO42−, indicating that these are the main contributing ions to TDS. Na+, Mg2+, Cl, and SO42− exhibit a good correlation, suggesting that these ions have a common source or similar geochemical behavior in the groundwater system, and are the primary ions controlling the chemical composition of groundwater. K+ shows a significant correlation only with NO3-N (p < 0.001), possibly indicating a similar source.

4. Discussion

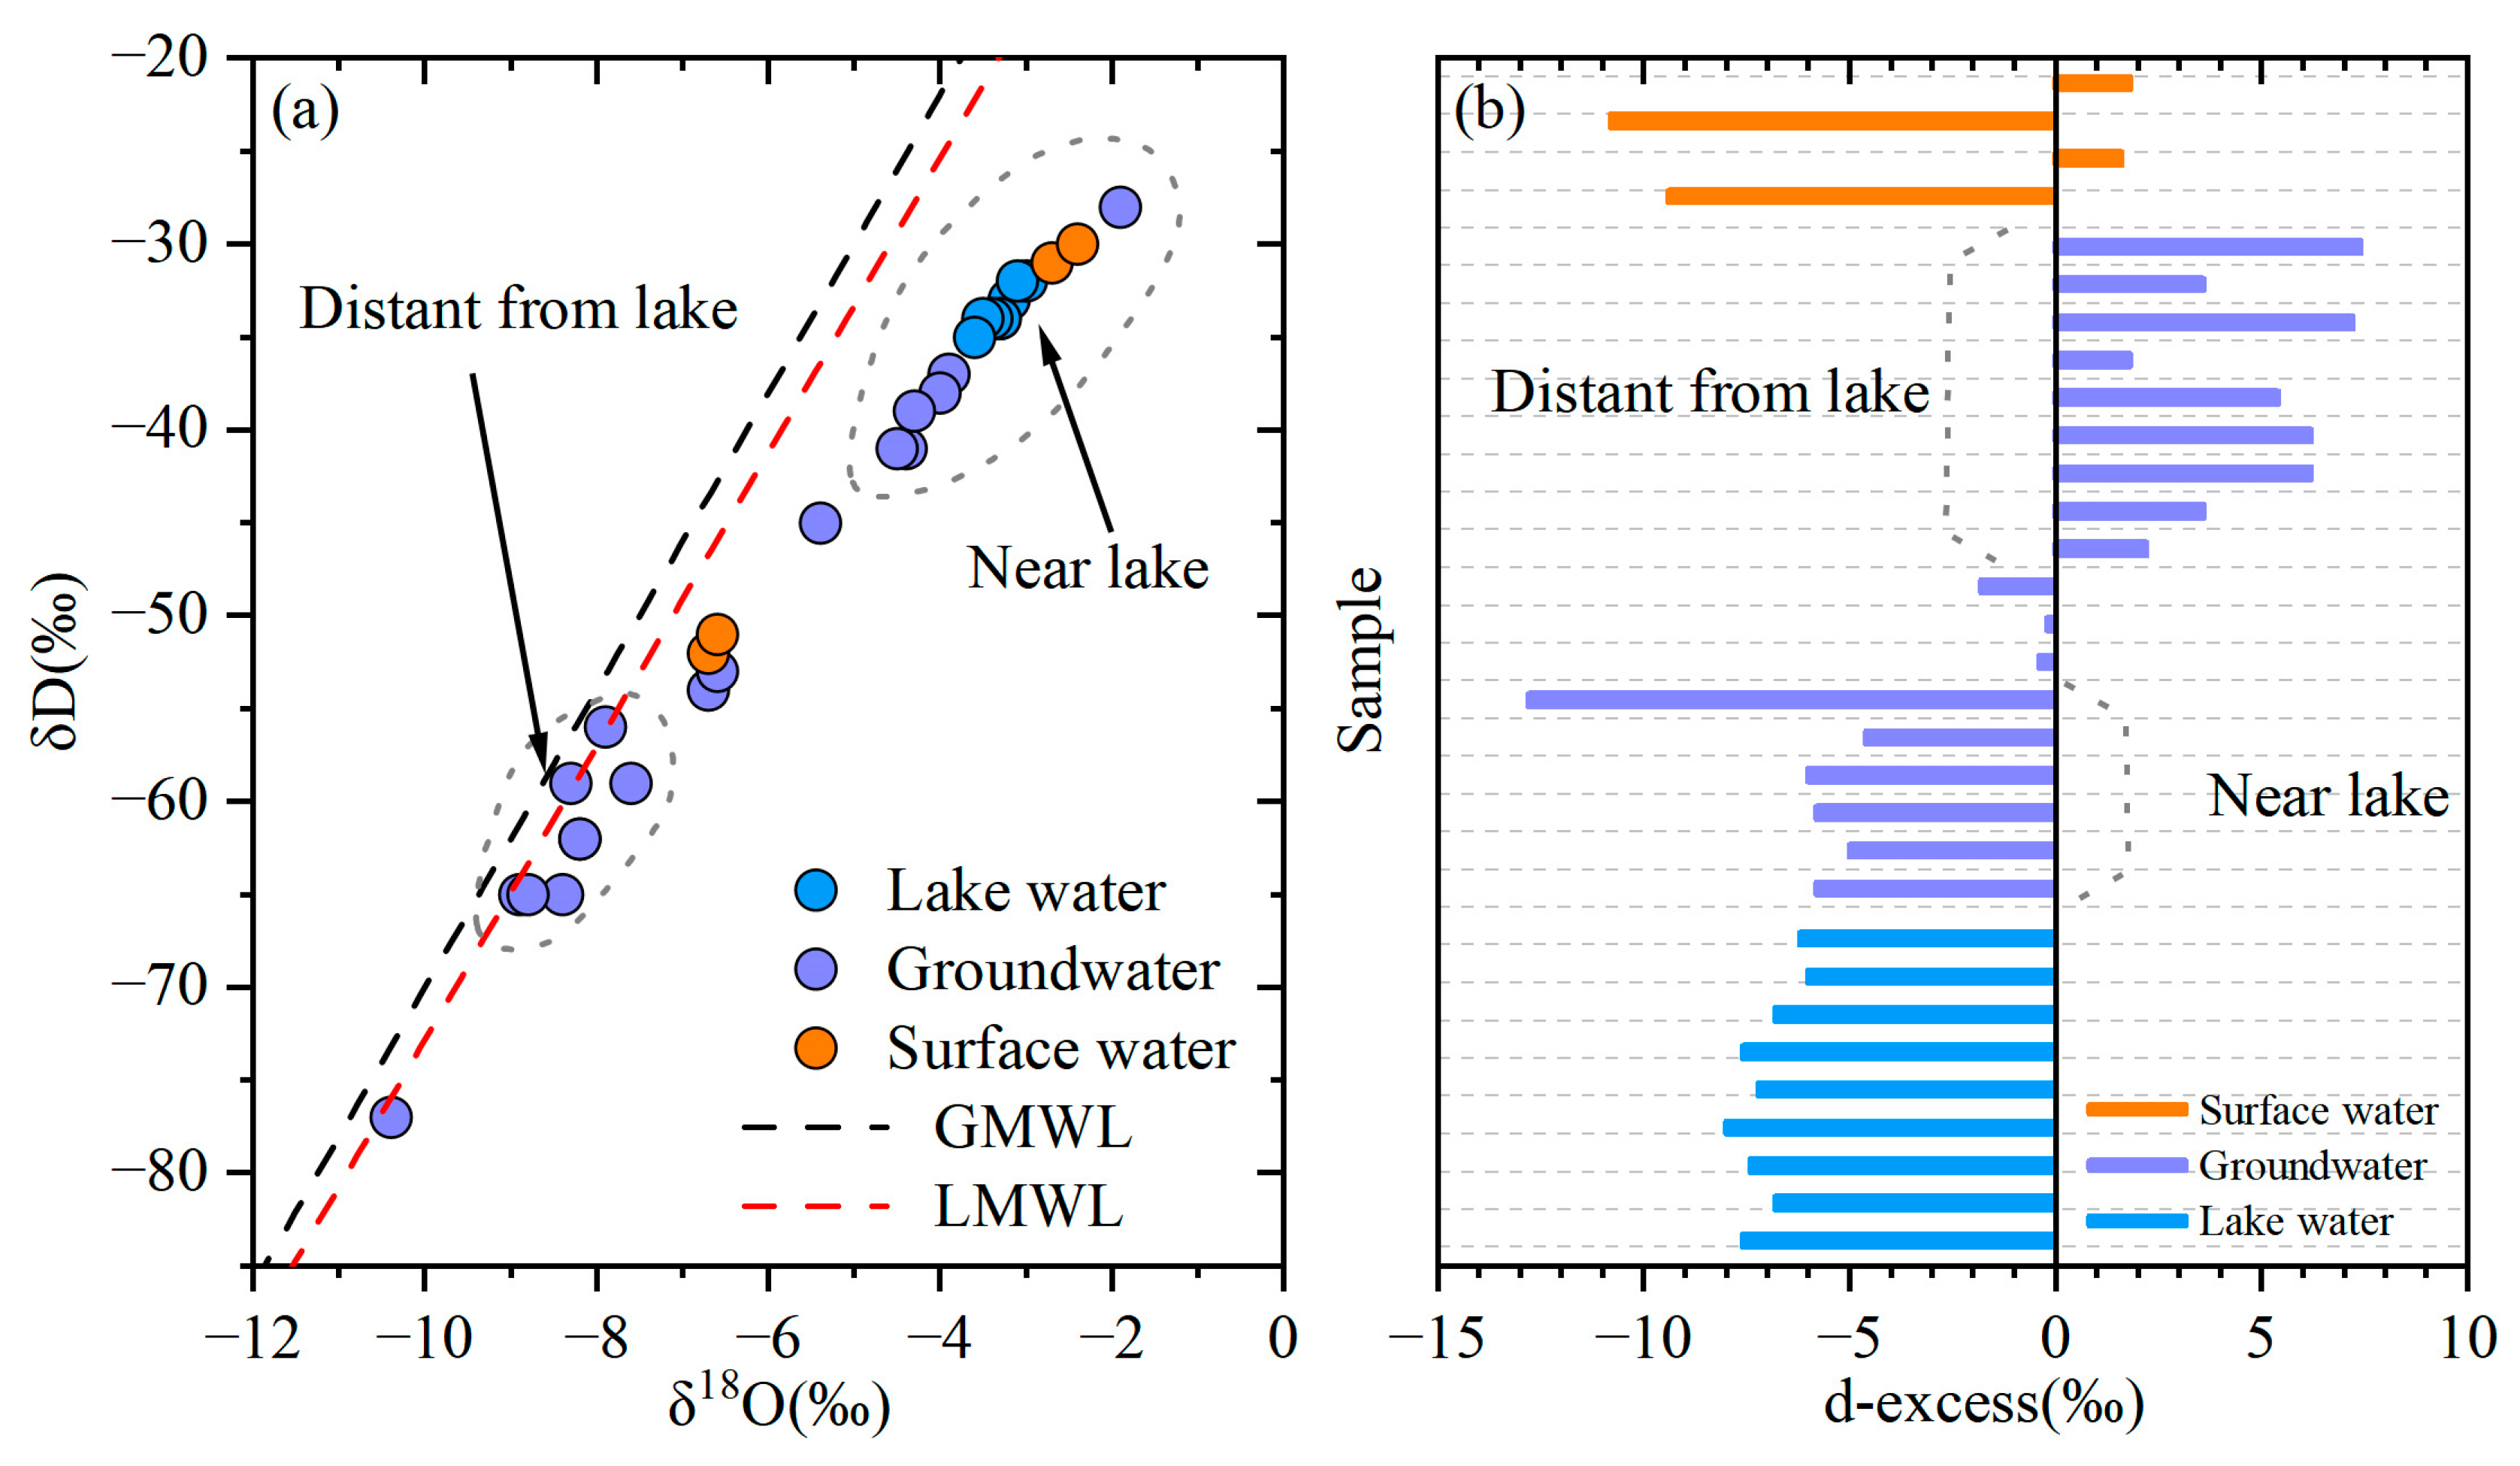
4.1. Interaction Between Lake Water and Groundwater

Based on synchronized water level survey data during sampling, the shallow groundwater flow around Hengshui Lake wetland generally demonstrates a southwest-to-northeast directional movement. The lake has maintained a stable multi-year average water level at the 20 m elevation benchmark, which remains significantly higher than the dynamic fluctuation range of surrounding shallow groundwater levels (Figure 1). According to the hydraulic gradient direction and potential energy difference, a stable hydraulic gradient has formed between the lake water and the aquifer system, directed from the lake towards the groundwater system. Combined with regional aquifer lithological characteristics analysis, this hydraulic potential difference primarily drives a vertical leakage-dominated hydraulic exchange mechanism, supplemented by lateral runoff, which constitutes the dominant recharge pattern. This confirms that the lake water has a continuous recharge effect on the shallow groundwater system.
To further analyze the interactions within wetland water bodies, this study referenced isotope data from the Hengshui Lake wetland documented in Wang Lijuan et al.’s paper to construct an isotopic characteristic relationship diagram [31] (Figure 4). Figure 4a shows that most water sample points in the study area are distributed below the Local Meteoric Water Line (LMWL), indicating that regional water bodies generally undergo evaporation and fractionation processes following precipitation recharge. Notably, the lake water and groundwater sample points near the lake significantly deviate to the lower right of the LMWL, demonstrating a strong interaction between them and also revealing intense evaporation effects within the wetland.
Figure 4b presents a histogram of hydrogen excess (d-excess) sample points. Hydrogen excess (d-excess) is a parameter used to describe the deviation of hydrogen isotopes relative to oxygen isotopes in water, which aids in understanding the changes water undergoes during processes such as evaporation and condensation. It can also be utilized to trace water sources and pathways [34]. The calculation formula for hydrogen excess is as follows:
d-excess = δ D 8 × δ 18 O
The magnitude of d-excess can directly reflect the intensity of evaporation in a regional water body. When water undergoes strong evaporation, isotopic fractionation occurs, resulting in decreased d-excess values; conversely, weaker evaporation leads to higher d-excess values. Groundwater samples near the lake area exhibit similarly low d-excess values (average −6.67‰) as the lake water, while those farther from the lake show significantly higher d-excess values (average 4.84‰), with intermediate samples displaying transitional characteristics. This spatial differentiation not only confirms the gradient variation in evaporation intensity across the wetland water bodies but also provides isotopic geochemical evidence for the dominant recharge process of lake water into the nearshore groundwater system.

4.2. Ion Source Analysis

Based on the molar concentration ratios of major ions in the water, the water–rock interaction processes in the hydrochemical system can be further identified [1]. Na+, K+, and Cl in the water typically originate from the dissolution of evaporites and silicate minerals, as described by Equations (2) and (3). By examining the ratio of γ(Na+ + K+) to γ(Cl), the source of Na+ and K+ in the water can be determined. A ratio of 1 indicates the primary dissolution of evaporites; a ratio greater than 1 suggests an additional source of Na+, possibly from the dissolution of silicate minerals; and a ratio less than 1 indicates an additional source of Cl, typically associated with human activities [35]. As shown in Figure 5a, most of the sampling points in the study area are located above or near the 1:1 ratio line, indicating that the two types of water in Hengshui Lake Wetland have an additional source of Na+, possibly from silicate dissolution.
N a K C l N a + K + + C l
2 N a A l S i 3 O 8 + 2 C O 2 + 11 H 2 O A l 2 S i 2 O 5 ( O H ) 4 + 4 H 4 S i O 4 + 2 N a + + 2 H C O 3
The ratio of γ(Ca2+) to γ(SO42−) can be used to determine whether gypsum dissolution has occurred [36]. As shown in Figure 5b, all the sample points in the study area fall below the 1:1 ratio line, indicating an additional source of SO42−. In addition to gypsum dissolution, this may also be attributed to the preferential dissolution of soluble sulfate minerals such as mirabilite (Na2SO4) from the evaporite sequence. Meanwhile, the depletion of Ca2+ suggests the ion exchange effect leading to the consumption of Ca2+.
Ions such as SO42−, HCO3, Mg2+, and Ca2+ in water bodies typically originate from the weathering and dissolution processes of evaporite, silicate, and carbonate minerals. The sources of Ca2+ and Mg2+ can be interpreted using the ratio of γ(Ca2+ + Mg2+) to γ(HCO3 + SO42−). When this ratio exceeds 1, it indicates that Ca2+ and Mg2+ in the water body mainly derive from carbonate dissolution; if the ratio is less than 1, it reflects the dominance of silicate weathering [37]. As shown in Figure 5c, the majority of sample points in the study area are distributed below the 1:1 ratio line, demonstrating that Ca2+ and Mg2+ in the wetland water primarily originate from the dissolution of silicate minerals.
The sources of Cl, SO42−, and HCO3 in water bodies can be determined by the ratio of γ(Cl + SO42−) to γ(HCO3): when the ratio is less than 1, it indicates that Cl, SO42−, and HCO3 primarily originate from carbonate dissolution; when the ratio exceeds 1, it signifies a significant contribution of silicate weathering to the anion composition [38]. Figure 5d shows that all sampling points in the study area are located above the 1:1 ratio line, demonstrating that the ionic sources of Cl, SO42−, and HCO3 in the water bodies are predominantly controlled by silicate dissolution processes.
The water in Hengshui Lake primarily originates from the Yellow River through the Yellow River Diversion Project to Hebei Province and is influenced by various geological processes within the watershed. Based on the results of multiple hydrogeochemical genetic discrimination theories, it is inferred that the weathering and dissolution of silicate rocks are significant controlling factors for the hydrogeochemical characteristics of the Hengshui Lake wetland. Niu Hong et al. [39], through their study of sediment particles and pore water isotopes in the saline aquifer of the Hengshui area, found that the region has been in a relatively stable subsidence environment since the Middle Pleistocene. The shallow strata mainly consist of fluvial-lacustrine and swamp deposits formed under arid climatic conditions, rich in evaporite minerals such as gypsum and mirabilite, resulting in high soluble salt content in the aquifer media. Comprehensive analysis indicates that the main ion sources in the study area’s water bodies primarily derive from the dissolution of silicate rocks and evaporites such as gypsum.

4.3. Analysis of the Formation Mechanism of Hydrochemistry

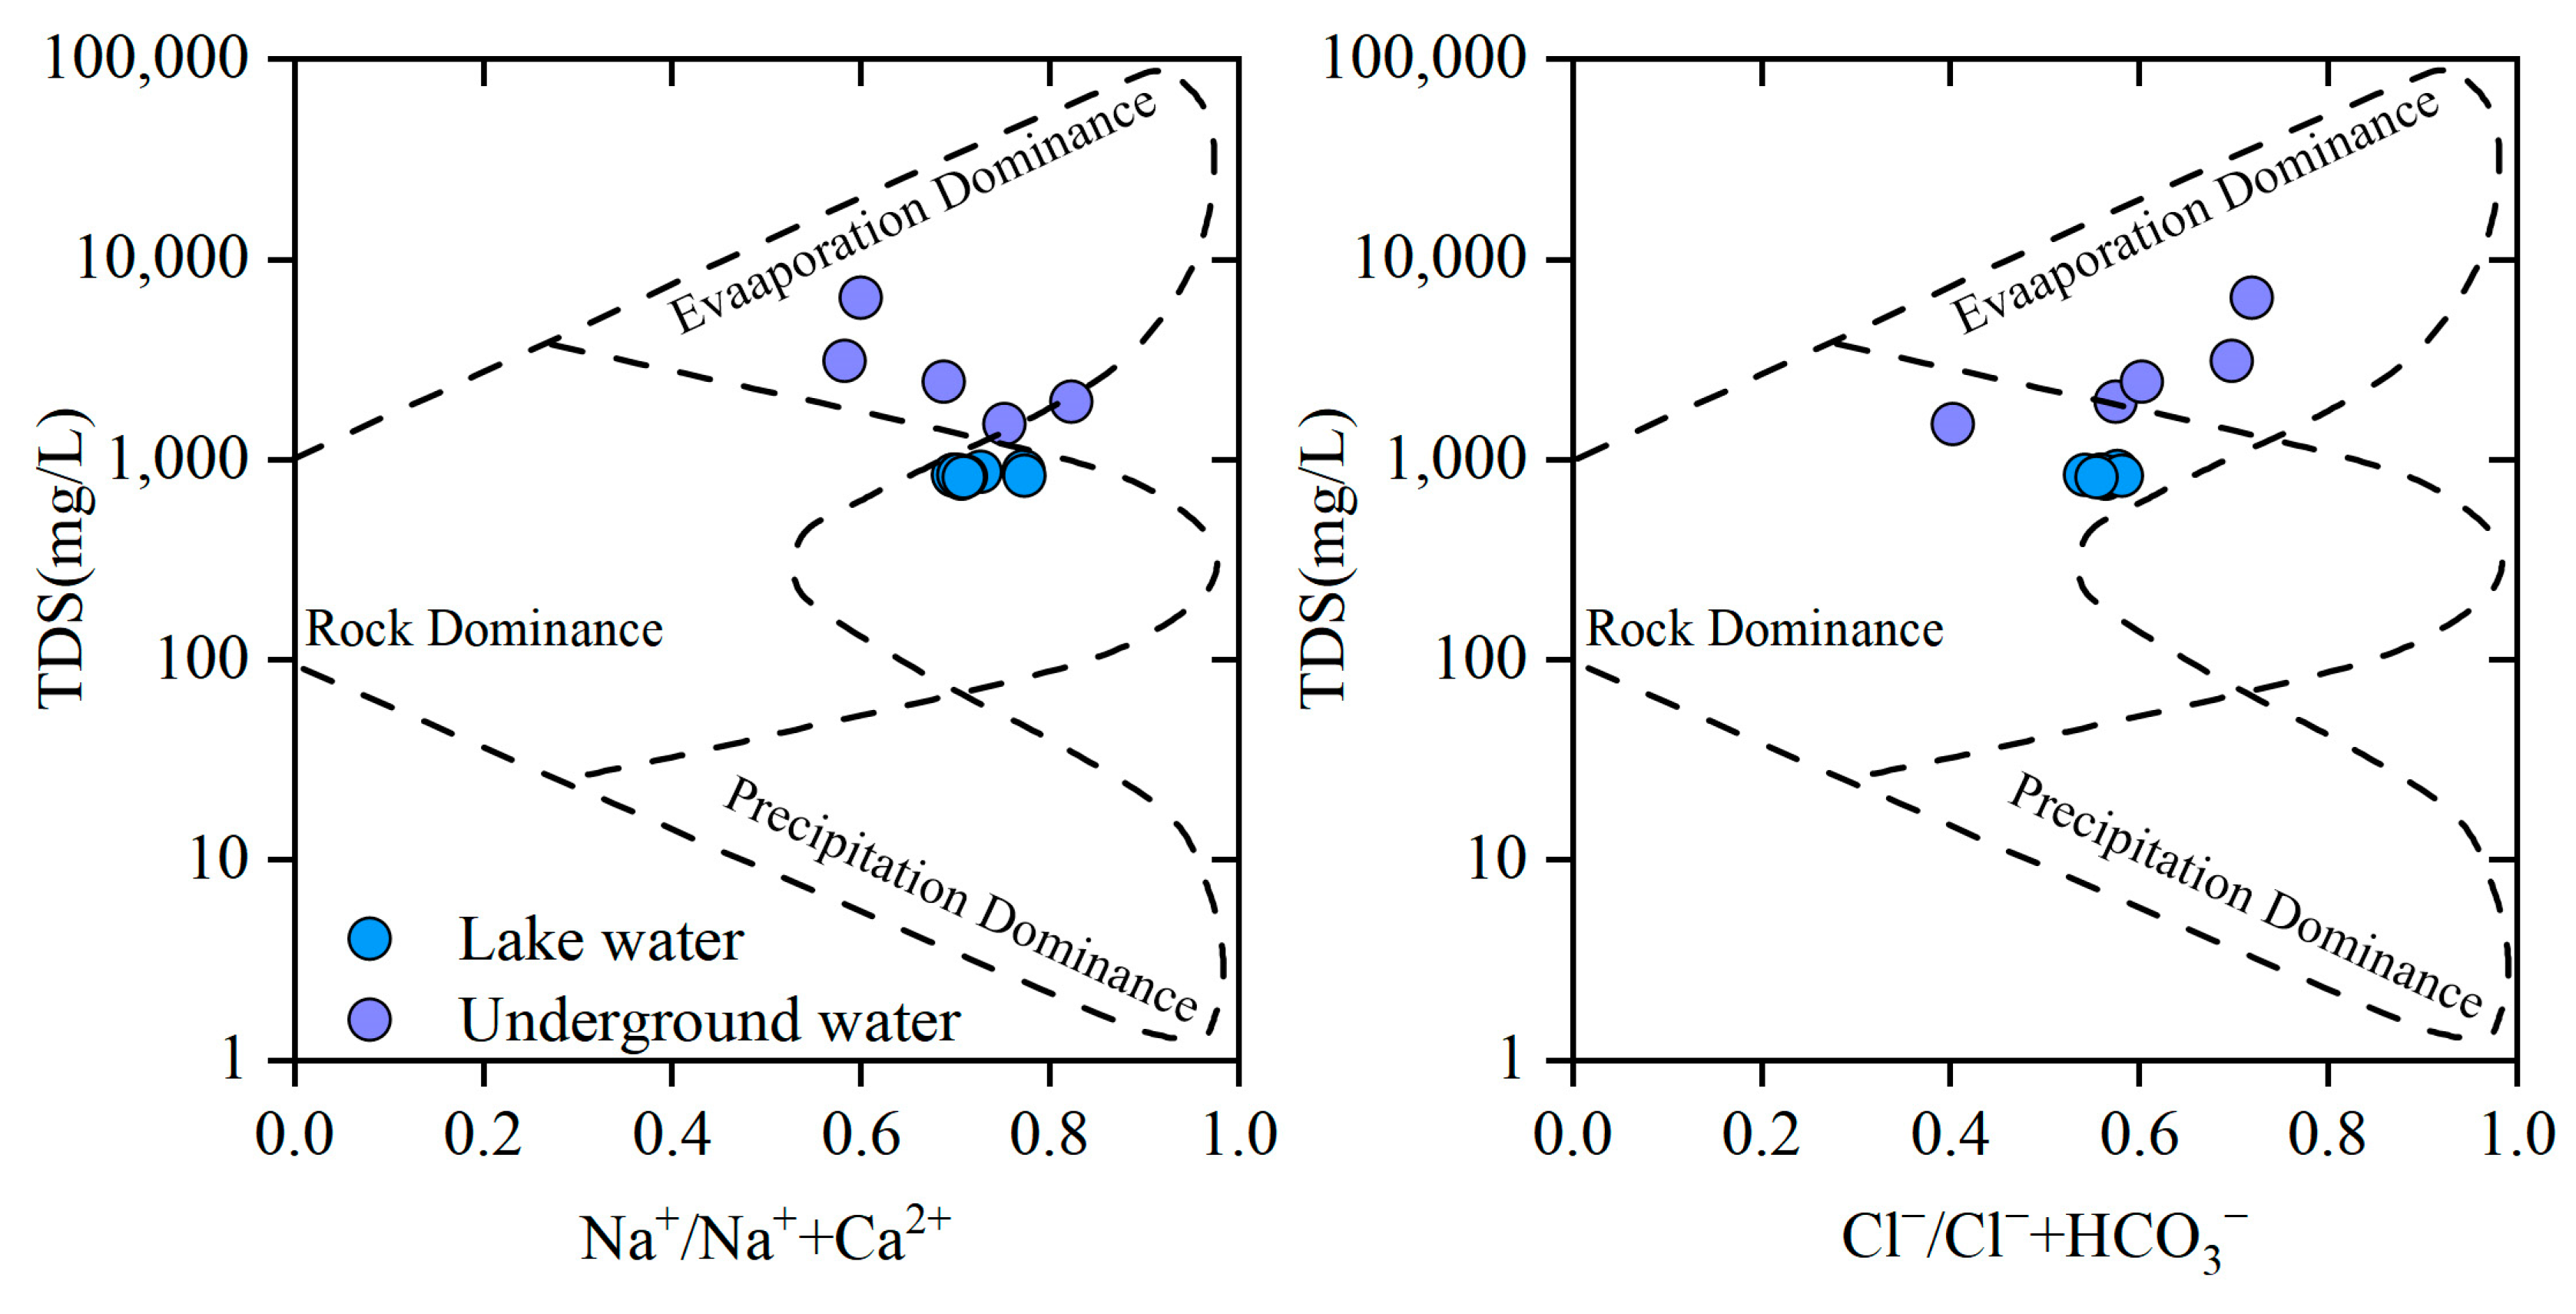
4.3.1. The Gibbs Diagram

Gibbs diagrams are commonly used to qualitatively assess the influence of atmospheric precipitation, rock weathering, and evaporation concentration on the ion sources of water bodies [40]. By analyzing the relationship between TDS and γ(Cl)/γ(Cl + HCO3) and γ(Na+)/γ(Na+ + Ca2+), the main controlling factors of the water chemistry characteristics in Hengshui Lake Wetland can be visually identified. As shown in Figure 6, most of the sampling points in the study area are located in the evaporation zone, indicating that evaporation concentration is the primary controlling factor of the water chemistry characteristics. A small number of samples are near the rock weathering zone, suggesting that these samples are influenced by rock weathering. All sampling points are far from the atmospheric precipitation zone, indicating that atmospheric precipitation has a minor effect on the wetland water chemistry composition. Comparative analysis of Gibbs diagrams between the studied wetland and Tianjin Qilihai Wetland [41] demonstrates that both systems are predominantly governed by evaporative concentration processes. This reveals intense evaporative dynamics in plain lake wetlands, a conclusion consistent with general hydrogeochemical principles applicable to regional hydrological systems.
The ratio relationship between n(HCO3)/n(Na+) and n(Ca2+)/n(Na+), and between n(Mg2+)/n(Na+) and n(Ca2+)/n(Na+) can be used to determine the mineral source of ions dissolved in the water [42]. As shown in Figure 7, both the lake water and groundwater in the study area are far from the carbonate rock endmember, located near the connection line between the silicate rock endmember and the evaporite salt endmember, and closer to the silicate rock endmember. This further indicates that the ion sources are controlled by the weathering and dissolution of silicate rocks and evaporite salts, which is consistent with the previous conclusion.

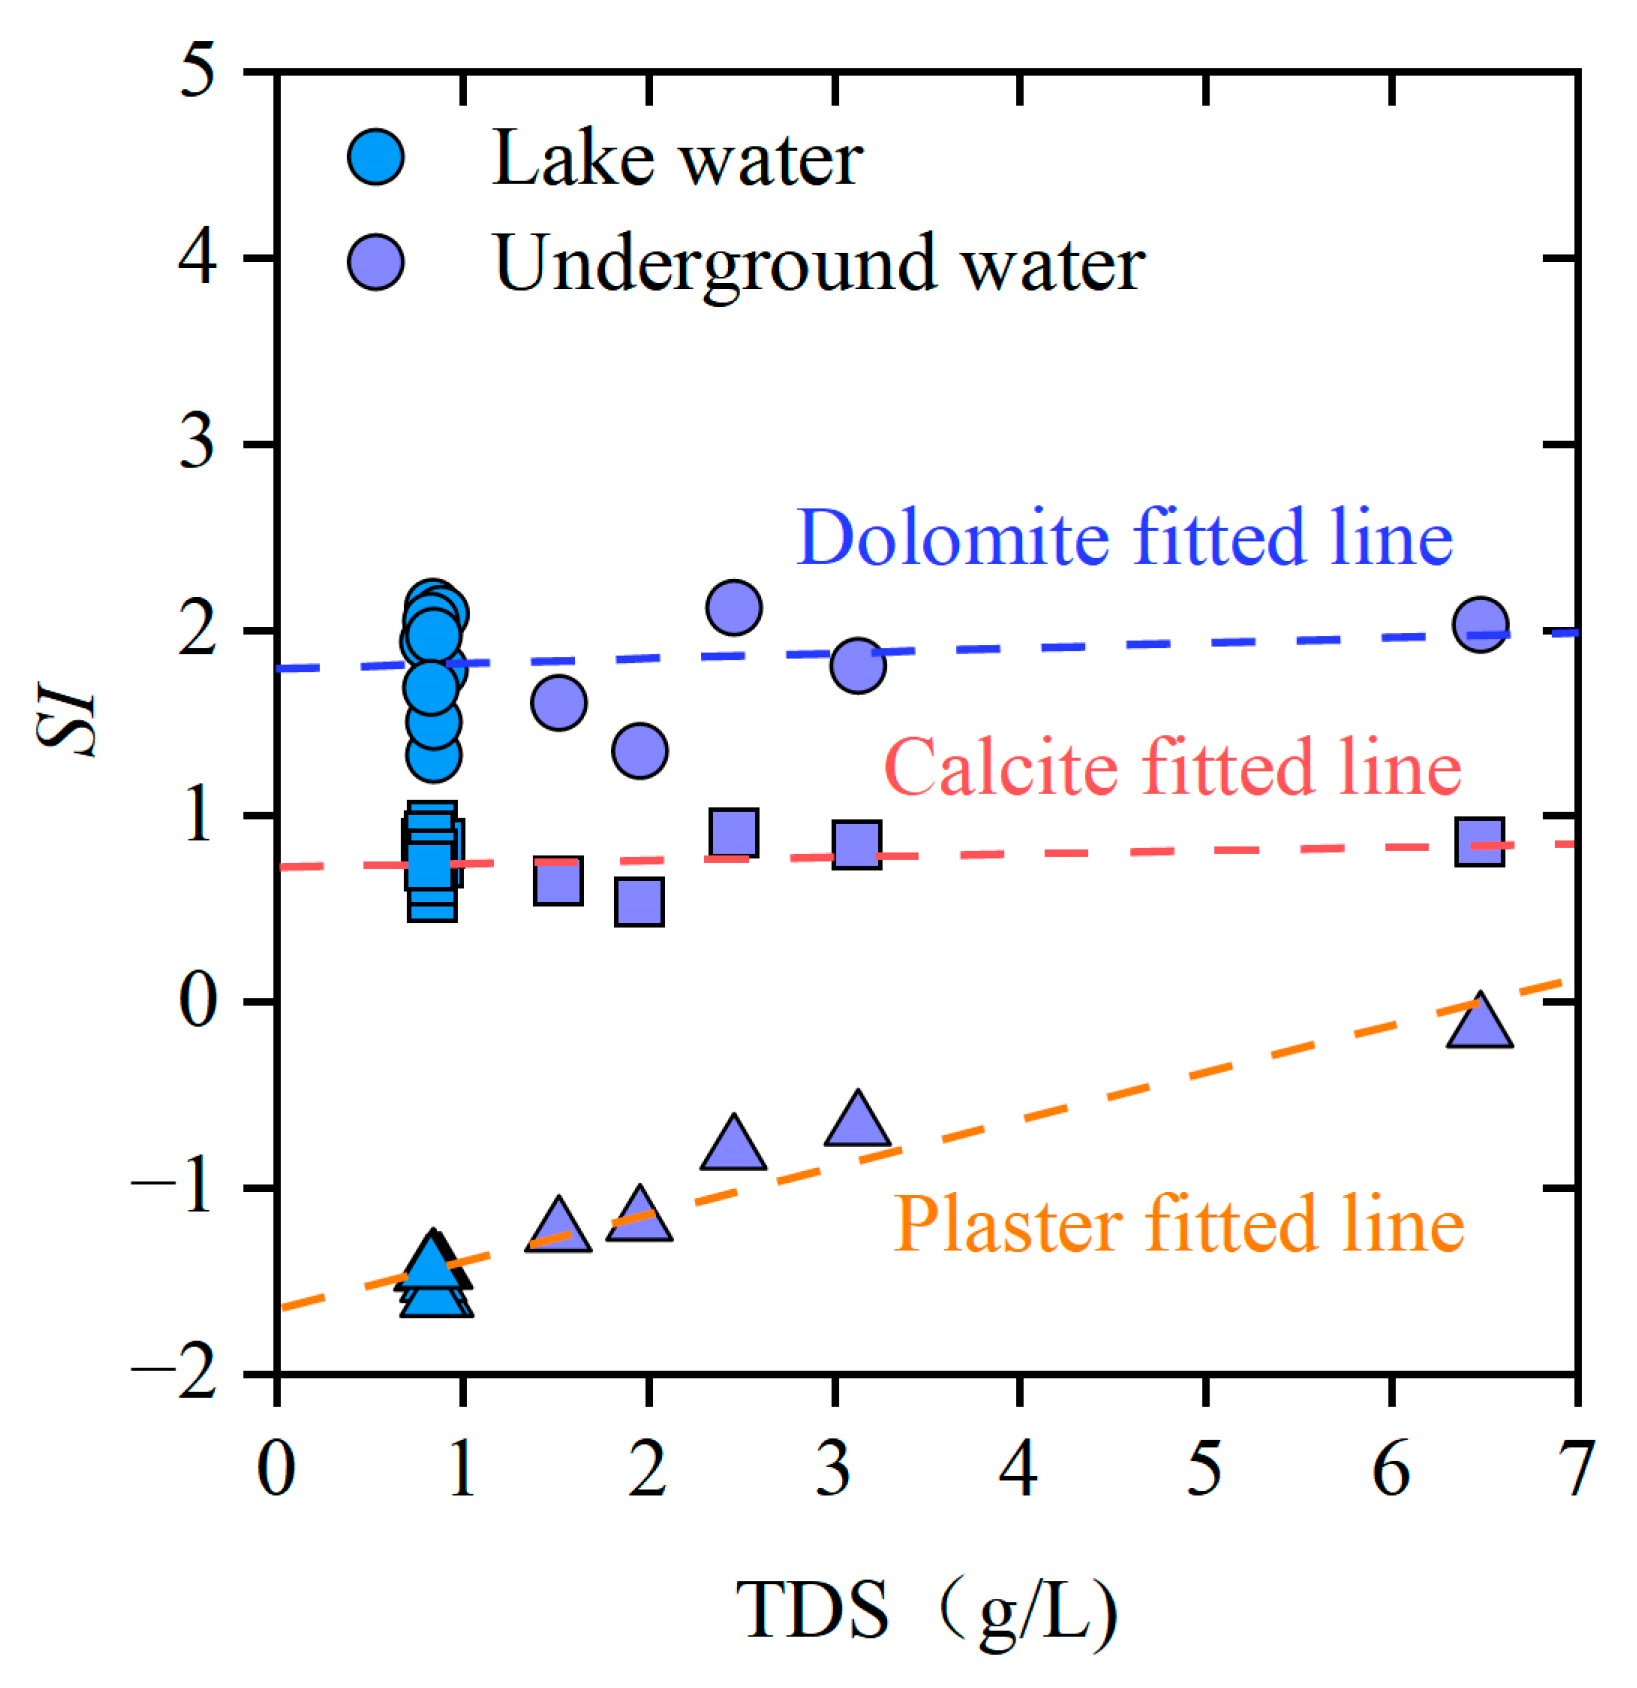
4.3.2. Mineral Saturation Index Analysis

The saturation index (SI) can reflect the form of different components in water bodies, providing a quantitative description of the deviation of water from equilibrium with respect to dissolved minerals. When the SI value is greater than 0, it indicates that the mineral is saturated and precipitation will occur. When the SI value is less than 0, it suggests that the mineral will not precipitate and will continue to dissolve. When the SI value equals 0, it indicates that the mineral has reached a dynamic equilibrium between precipitation and dissolution [43].
Using PHREEQC software (version 3), the saturation indices of three minerals in the Hengshui Lake wetland samples were calculated. The results are shown in Figure 8. The SI value of calcite in the lake water ranged from 0.56 to 0.95, with an average of 0.79. The SI value of calcite in the groundwater ranged from 0.54 to 0.91, with an average of 0.76. The SI value of calcite in the lake water was slightly higher than in the groundwater. The SI value of dolomite in the lake water ranged from 1.33 to 2.13, with an average of 1.85. The SI value of dolomite in the groundwater ranged from 1.35 to 2.12, with an average of 1.78. The SI value of dolomite in the lake water was slightly higher than in the groundwater. The SI value of gypsum in the lake water ranged from −1.59 to −1.42, with an average of −1.47. The SI value of gypsum in the groundwater ranged from −1.24 to −0.14, with an average of −0.81. The SI value of gypsum in the lake water was more negative, indicating a stronger dissolution capacity of gypsum.
In the study area, all samples of calcite and dolomite were saturated. HCO3 can interact with Ca2+ and Mg2+ to precipitate, showing weaker dissolution ability. Gypsum was not saturated in any samples, which increases the concentration of SO42− in the water, consistent with the previous analysis results.

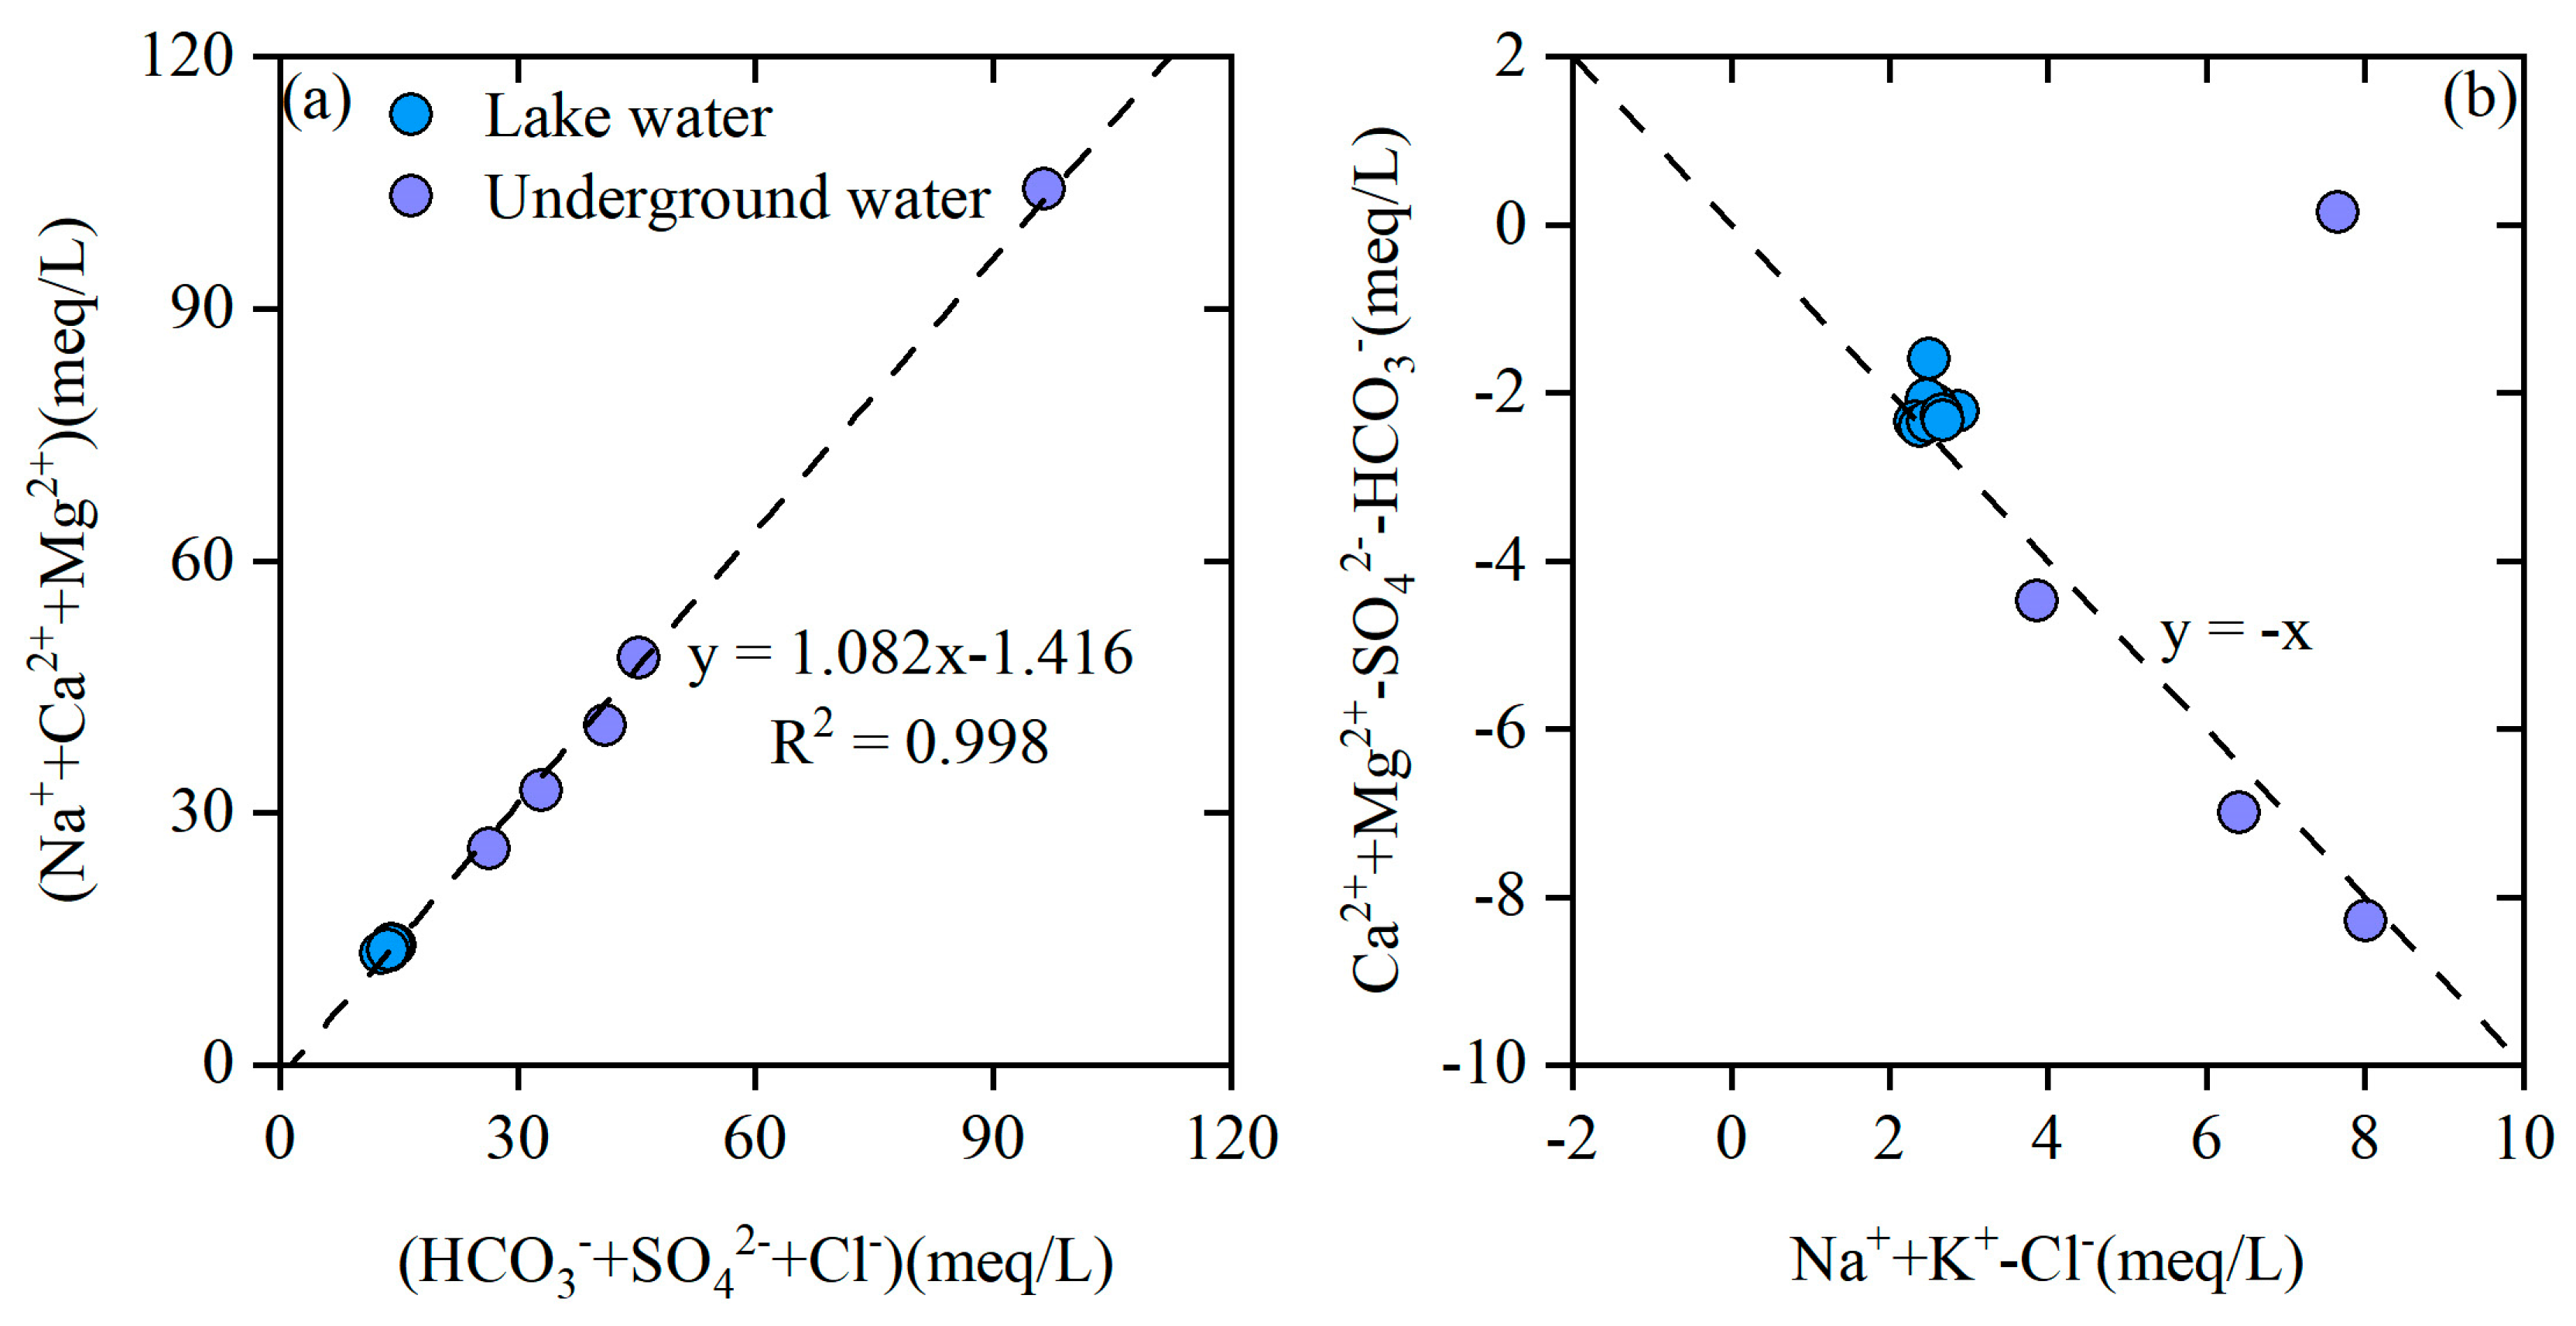
4.3.3. Cation Exchange

Cation exchange adsorption, as an important mechanism of water–rock interaction, is primarily manifested as the physical-chemical process in which cations on the surface of rocks are displaced by ions in the water, significantly influencing the evolution of regional water chemistry composition [44]. The sample data (Figure 9a) show a significant linear correlation between the milliequivalent concentrations of cations and anions in lake water and groundwater (y = 1.082x − 1.416), with a coefficient of determination (R2) of 0.998, indicating an excellent fit [34]. This provides quantitative evidence for the presence of active cation exchange adsorption in the wetland system. Further analysis of the ratio of γ(Ca2+ + Mg2+ − SO42− − HCO3) to γ(Na+ + K+ − Cl) (Figure 9b) reveals that a ratio of −1 characterizes a typical cation exchange adsorption equilibrium state. The majority of the samples in the study area are concentrated around the −1 ratio line, which fully demonstrates the dominant role of cation exchange adsorption in water–rock interactions within the study area.
The Chlor-Alkali Index (CAI) is a key indicator used to characterize the type and intensity of cation exchange reactions at the water–rock interface. Its mathematical expression is defined by both Equations (4) and (5). From the perspective of hydrochemical dynamics, when both CAI-1 and CAI-2 exhibit negative values, it indicates the occurrence of forward cation exchange adsorption, where Na⁺ from the aquifer medium enters the water phase through desorption, while Ca2⁺ from the water phase is adsorbed and fixed by the solid-phase medium. Conversely, if both indices are positive, it reflects the dominance of reverse adsorption, characterized by the reverse exchange of Na⁺ in the water phase and Ca2⁺ in the solid phase [45].
C A I - 1 = C l N a + + K + C l
C A I 2 = C l N a + + K + H C O 3 + S O 4 2 + C O 3 2 + N O 3
Analysis of the quadrant distribution characteristics in Figure 10 shows that 60% of the sampling points in the study area (n = 9) are concentrated in the third quadrant (CAI-1 < 0 and CAI-2 < 0), with a spatial distribution density 1.5 times higher than that in the first quadrant (CAI-1 > 0 and CAI-2 > 0). This asymmetric distribution pattern clearly reveals that forward cation exchange adsorption is the dominant hydrogeochemical process in this region. It is noteworthy that the shallow groundwater system exhibits a stronger ion exchange intensity, with the absolute value of the CAI-1 index averaging 0.19, significantly higher than the 0.03 observed in lake water. This is closely related to the more active water–rock interaction near the phreatic surface.

4.3.4. Human Activities’ Impact

Against the backdrop of rapid socio-economic development, human activities have become a significant driver of the evolution of ion composition in water bodies [46]. This process is particularly evident in the spatiotemporal variations in characteristic ions such as Cl, SO42−, and NO3 in water. Specifically, the abnormal increase in Cl and NO3 concentrations is often closely related to point source pollution from domestic sewage and nitrogen fertilizer leaching from agricultural non-point sources, while the accumulation of SO42− is primarily attributed to the atmospheric migration and deposition of sulfur oxides from fossil fuel combustion [47]. By constructing a ratio system of γ(SO42−)/γ(Na+) and γ(NO3)/γ(Na+) (Figure 11a), the water chemical fingerprint characteristics of different human activity types can be effectively analyzed: an increase in the former ratio indicates dominance of industrial coal combustion pollution, while a rise in the latter ratio indicates dominance of agricultural non-point source pollution. The sample data show that the average values of γ(SO42−)/γ(Na+) and γ(NO3)/γ(Na+) are 0.75 and 0.03, respectively, with 86.67% of the samples concentrated in the low-value aggregation zone. This spatial heterogeneity confirms that the study area is generally weakly disturbed by industrial and agricultural activities.
Further, through the synergistic analysis of γ(NO3)/γ(Na+) and γ(Cl)/γ(Na+) (Figure 11b), it is observed that all sample points fall within the third quadrant (with average concentration ratios of 0.03 and 0.71, respectively), and their distribution significantly deviates from the typical human activity-impacted areas. This water chemical characteristic suggests that the ion composition of the Hengshui Lake wetland system is primarily controlled by natural geochemical processes such as the dissolution of evaporite rocks (release of chloride from rock salt) and silicate weathering (leaching of Na+ from feldspar minerals), forming a logical closure with the cation exchange adsorption-dominated mechanism established earlier. It is worth noting that although the overall characteristics are naturally local, some groundwater samples show a high γ(NO3)/γ(Na+) ratio. In the field investigation (Figure 1), the land use type around the Hengshui Lake Wetland, especially near the groundwater sampling points, is primarily farmland. NO3 typically originates from agricultural fertilization (such as nitrogen fertilizers in chemical fertilizers), and excessive application of nitrogen fertilizers can lead to elevated concentrations of NO3 in the groundwater. The research results suggest that the wetland’s edge zone is experiencing early-stage pollution, providing important spatial guidance for subsequent ecological monitoring.

5. Conclusions

The hydrochemical characteristics and influencing factors of Hengshui Lake Wetland during the dry season were investigated using Piper diagrams, Gibbs diagrams, and ionic ratio analysis. The main conclusions are as follows:
(1)
Stratified differentiation of hydrochemical characteristics: Both lake water and shallow groundwater exhibit weakly alkaline systems, but show magnitude-level differences in Total Dissolved Solids (TDS)—the lake water represents low-mineralized freshwater while shallow groundwater constitutes high-mineralized saline water. Na+ and Mg2+ serve as dominant cations in both water types, with anion composition following the sequence SO42− > Cl > HCO3. The shallow groundwater system displays complex hydrochemical types reflecting multi-source recharge and intense water–rock interactions, whereas the lake system demonstrates homogenization features.
(2)
Multi-process coupled ion sources and formation mechanisms: Multivariate ratio analysis reveals that major cations originate from silicate mineral weathering and dissolution of evaporites (gypsum and mirabilite). Gibbs diagrams indicate evaporation-crystallization dominance, while mineral saturation indices show calcite and dolomite in supersaturated states. Continuous gypsum dissolution drives SO42− accumulation, a process coupled with the regional Quaternary geological background rich in evaporites. The intensity of cation exchange adsorption was more pronounced in groundwater than in lake water.
(3)
The impact of human activities presents an edge-permeation characteristic. The analysis results show that the overall area of the study region remains in a natural local state; however, shallow groundwater in the lakeshore zone exhibits anomalies in NO3, indicating the potential risk of early-stage pollution in the wetland buffer zone. It is recommended to establish a long-term monitoring ecological early warning system with NO3 as the core indicator.

Author Contributions

All authors contributed to the study conception and design. H.A.: Form analysis software, methodology, writing-draft. T.W., X.M., X.N., D.S., Y.W., G.G., M.L., T.Z. and H.S.: Sample collection. X.W.: Read and approved the final manuscript. K.M.: Investigation. All authors have read and agreed to the published version of the manuscript.

Funding

This study was jointly supported by the Open Research Fund Program of the Hebei Provincial Research Center for Applied Technology of Ecological Environment Geology in Universities (Grant No. JSYF-202306), and the Geological Survey Project of the China Geological Survey (Grant No. DD20230505, “Investigation of lakes in the northern part of the plain lake region in eastern China”).

Data Availability Statement

The datasets used and analyzed during the current study are available from the corresponding author on reasonable request.

Conflicts of Interest

All authors declare that there were no commercial or financial relationships that might constitute potential conflicts of interest during the research process.

References

  1. Zhou, M.; Li, J.; Luo, Z.; Sun, J.; Xu, F.; Jing, Q.; Deng, H. Impact of water–rock interaction on the pore structures of red-bed soft rock. Sci. Rep. 2021, 11, 7398. [Google Scholar] [CrossRef] [PubMed]
  2. Zheng, L.; Dong, S.; Tang, S.; Ji, Y.; Luo, J.; Li, H.; Li, X.; Li, C.; Zeng, M. Molecular structure characterization of coal under the water–rock interaction in acid mine drainage (AMD). J. Mol. Struct. 2022, 1251, 132043. [Google Scholar] [CrossRef]
  3. Slukovskii, Z.I.; Dauvalter, V.; Guzeva, A.; Denisov, D.; Cherepanov, A.; Siroezhko, E. The Hydrochemistry and Recent Sediment Geochemistry of Small Lakes of Murmansk, Arctic Zone of Russia. Water 2020, 12, 1130. [Google Scholar] [CrossRef]
  4. Tuchman, N.C.; Larkin, D.J.; Geddes, P.; Wildova, R.; Jankowski, K.; Goldberg, D.E. Patterns of Environmental Change Associated with Typha x glauca Invasion in a Great Lakes Coastal Wetland. Wetlands 2009, 29, 964–975. [Google Scholar] [CrossRef]
  5. Sheta, B.M.; Abdelhalim, A.A.; Elgyar, E.E.; Khalil, M.A.; Ageba, M.F. Wetland Habitat Suitability and Diversity for Migratory and Resident Birds in the Ramsar Site Lake Burllus, Egypt. Egypt. J. Aquat. Biol. Fish. 2023, 27, 253–274. [Google Scholar] [CrossRef]
  6. Odero, D.O.; Odenyo, V.A.O. Optimizing community participation in the management of Yala Wetland Ecosystem, Lake Victoria Basin, Kenya: The Yala Hub Framework. Afr. J. Environ. Sci. Technol. 2022, 16, 10–36. [Google Scholar] [CrossRef]
  7. Munishi, S.J.G. Degradation of Kilombero Valley Ramsar wetlands in Tanzania. Phys. Chem. Earth 2019, 112, 216–227. [Google Scholar] [CrossRef]
  8. Olea-Olea, S.; Silva-Aguilera Raúl, A.; Alcocer, J.; Escolero, O.; Morales-Casique, E.; Florez-Peñaloza, J.; Almora-Fonseca, K.; Oseguera, L. Water–Rock Interaction Processes in Groundwater and Flows in a Maar Lake in Central Mexico. Water 2024, 16, 715. [Google Scholar] [CrossRef]
  9. Li, Z.; Yang, Q.; Xie, C.; Lu, X. Source identification and health risks of nitrate contamination in shallow groundwater: A case study in Subei Lake basin. Environ. Sci. Pollut. Res. Int. 2023, 30, 13660–13670. [Google Scholar] [CrossRef]
  10. Quenet, M.; Celle-Jeanton, H.; Voldoire, O.; Albaric, J.; Huneau, F.; Peiry, J.L.; Allain, E.; Garreau, A.; Beauger, A. Coupling hydrodynamic, geochemical and isotopic approaches to evaluate oxbow connection degree to the main stream and to adjunct alluvial aquifer. J. Hydrol. 2019, 577, 123936. [Google Scholar] [CrossRef]
  11. Nigate, F.; Van Camp, M.; Yenehun, A.; Sewale Belay, A.; Walraevens, K. Recharge-discharge relations of groundwater in volcanic terrain of semi-humid tropical Highlands of Ethiopia:The case of infranz springs, in the Upper Blue Nile. Water 2020, 12, 853. [Google Scholar] [CrossRef]
  12. Cheng, X.; Wang, S.; Chen, J.; Aghakouchak, A. Global assessment and hotspots of lake drought. Commun. Earth Environ. 2025, 6, 308. [Google Scholar] [CrossRef]
  13. Shen, B.; Wu, J.; Zhan, S.; Miao, J.; Saparov, A.S.; Abuduwaili, J. Spatial variations and controls on the hydrochemistry of surface waters across the Ili-Balkhash Basin, arid Central Asia. J. Hydrol. 2021, 600, 126565. [Google Scholar] [CrossRef]
  14. Zheng, L.; Jiang, C.; Chen, X.; Li, Y.; Li, C.; Zheng, L. Combining hydrochemistry and hydrogen and oxygen stable isotopes to reveal the influence of human activities on surface water quality in Chaohu Lake Basin. J. Environ. Manag. 2022, 312, 114933. [Google Scholar] [CrossRef]
  15. He, H.; Liu, Z.; Bao, Q.; Wei, Y.; Chen, C.; Sun, H.; Wang, Y. Lake metabolic processes and their effects on the carbonate weathering CO2 sink: Insights from diel variations in the hydrochemistry of a typical karst lake in SW China. Water Res. J. Int. Water Assoc. 2022, 222, 118907. [Google Scholar] [CrossRef]
  16. Pant, R.; Paudel, G.; Dahal, B.; Bishwakarma, K.; Sharma, S.; Shrestha, S.; Sharma, M.L.; Awasthi, M.P. Assessment of hydrochemical characteristics of the Taudaha lake, Kathmandu, Nepal. Sci. World 2022, 15, 70–85. [Google Scholar] [CrossRef]
  17. Qin, J. A Characterization of the Hydrochemistry and Main Controlling Factors of Lakes in the Badain Jaran Desert, China. Water 2021, 13, 2931. [Google Scholar] [CrossRef]
  18. Li, H. Analysis of Ammonia Nitrogen Pollution in Hengshui Lake. J. Henan Water Conserv. South-North Water Divers 2021, 3, 34–35. Available online: https://www.nstl.gov.cn/paper_detail.html?id=0b7ec83c8fcdb5bae99d95b185eba61f (accessed on 14 January 2025). (In Chinese).
  19. Liu, W.; Cui, L.; Guo, Z.; Wang, D.; Zhang, M. Wetland ecosystem health improvement from ecological conservation and restoration offset the decline from socio-economic development. Land Degrad. Dev. 2023, 34, 283–295. [Google Scholar] [CrossRef]
  20. Yang, T.; Li, H.; Cao, J.; Lu, Q.; Wang, Z.; He, L.; Sun, H.; Han, K. Investigating the climatology of North China’s urban inland lake based on six years of observations. Sci. Total Environ. 2022, 826, 154120. [Google Scholar] [CrossRef]
  21. Wei, Y.; Zhang, M.; Cui, L.; Pan, X.; Liu, W.; Li, W.; Li, Y. Winter Decomposition of Emergent Macrophytes Affects Water Quality under Ice in a Temperate Shallow Lake. Water 2020, 12, 2640. [Google Scholar] [CrossRef]
  22. Yu, Y.; Yan, B.; Tuo, Y.; Zhang, X.; Xie, X. Chemical evolution characteristics and influencing factors of groundwater in the saline and fresh water funnel area in Hengshui City, North China. Sci. Rep. 2025, 15, 3276. [Google Scholar] [CrossRef] [PubMed]
  23. Gao, Y.; Li, H.; Zheng, Y.; Guo, R.; Liu, Z. Study of water quality analysis and evaluation of Hengshui Lake. In Proceedings of the 2021 International Conference on Environmental Pollution and Governance (ICEPG 2021), Xiamen, China, 21–23 May 2021. [Google Scholar] [CrossRef]
  24. Zhang, Z.; Wei, S.; Liu, J. Pollution Characteristics and Risk Assessment of Heavy Metal Elements in Sediment in the West Lake of Hengshui Lake. Adv. Mater. Sci. Eng. 2021, 2021, 178966. [Google Scholar] [CrossRef]
  25. Wang, N.; Zhang, M.; Cui, L.; Ma, M.; Yan, L.; Mu, Y.; Qin, P. Contamination and ecological risk assessment of mercury in Hengshuihu wetland, Hebei Province. Environ. Sci. 2016, 37, 1754–1762. (In Chinese) [Google Scholar] [CrossRef]
  26. Wang, H.; Zhang, M.; Cui, L.; Guo, Z.; Wang, D. Evaluation of Ecological Environment Quality of HengshuiLake Wetlands based on DPSlR Model. Wetl. Sci. 2019, 17, 193–198. Available online: https://www.nstl.gov.cn/paper_detail.html?id=bac60e1c452463514e4507d3d3834d28 (accessed on 14 January 2025). (In Chinese).
  27. Liu, W.; Guo, Z.; Wang, D.; Zhang, M.; Zhang, Y. Spatial-Temporal Variation of Water Environment Quality and Pollution Source Analysis in Hengshui Lake. Environ. Sci. 2021, 42, 361–371. (In Chinese) [Google Scholar] [CrossRef]
  28. Zhang, B.; Xie, P.; Sun, D.; Liu, Z.; Sun, Y.; Huang, F.; Qiao, F. Effects of aquatic plant growth on water quality in Hengshui Lake wetland. China Environ. Sci. 2024, 44, 2247–2255. Available online: https://www.cnki.com.cn/Article/CJFDTotal-ZGHJ202404046.html (accessed on 14 January 2025). (In Chinese).
  29. Wang, H.; Zhang, M.; Guo, Z.; Wang, D.; Liu, W. Distribution of contents of 7 kinds of heavy metal elements in the sediments of Hengshui Lake and their ecological risk assessment. Wetl. Sci. 2020, 18, 191–199. Available online: https://www.nstl.gov.cn/paper_detail.html?id=81327899b15a34e8e113c3ae68ebf25f (accessed on 17 April 2025). (In Chinese).
  30. Yongliang, W. Mechanism analysis and prediction of water level influencing factors in Hengshui Lake. Water Sci. Eng. Technol. 2020, 3, 55–60. Available online: https://www.nstl.gov.cn/paper_detail.html?id=ae7297c42833ca4ae81ac7aa1ded1556 (accessed on 14 January 2025). (In Chinese).
  31. Wang, L.; Wang, Z.; Li, X.; Wu, L.; Li, Z. Study on the interaction between lake water and groundwater in Hengshui Lake. Anhui Agric. Sci. 2019, 49, 60–63. (In Chinese) [Google Scholar] [CrossRef]
  32. Piper, A.M. A Graphic Procedure in the Geochemical Interpretation and Analysis of Water Samples; USGS, Water Supply 1953, Paper 1454; US Geological Survey: Reston, VA, USA, 1953.
  33. Omed, M.; Broder, M.; Stephan, W. Assessment of Hydrogeochemistry and Environmental Isotopes in Karst Springs of Makook Anticline, Kurdistan Region, Iraq. Hydrology 2015, 2, 48–68. [Google Scholar] [CrossRef]
  34. Mandal, U.; Dhar, A.; Panda, S.N.; Sena, D.R. Correction to: Spatiotemporal evaluation and assessment of shallow groundwater quality for irrigation of a tropical coastal groundwater basin. Environ. Sci. Pollut. Res. 2022, 30, 116741. [Google Scholar] [CrossRef]
  35. Masoud, A.M.; Abu El-Magd, S.A. Integration of hydrochemical and isotopic characteristics for identifying groundwater recharge sources of the Eocene carbonate aquifer, Western Desert, Egypt. J. Afr. Earth Sci. 2022, 187, 104449. [Google Scholar] [CrossRef]
  36. Mokadem, N.; Demdoum, A.; Hamed, Y.; Bouri, S.; Hadji, R.; Boyce, A.; Laouar, R.; Saad, A. Hydrogeochemical and stable isotope data of groundwater of a multi-aquifer system: Northern Gafsa basin—Central Tunisia. J. Afr. Earth Sci. 2016, 114, 174–191. [Google Scholar] [CrossRef]
  37. Nordstrom, D.K.; Blowes, D.W.; Ptacek, C.J. Hydrogeochemistry and microbiology of mine drainage: An update. Appl. Geochem. 2015, 57, 3–16. [Google Scholar] [CrossRef]
  38. Ekwere, A.S.; Kudamnya, E.A.; Oyonga, O.A. Hydrogeochemistry, ionic speciation, controlling processes and agricultural suitability of groundwaters in sections of the semi-arid basement complex of north-central Nigeria. Solid Earth Sci. 2023, 8, 208–218. [Google Scholar] [CrossRef]
  39. Niu, H.; Liang, X.; Li, J.; Ma, B.; Ge, Q. Paleoclimate indication of grain size and deuterium-oxygen isotope of saline sediments in Hengshui Area. Earth Sci. 2016, 41, 499–507. (In Chinese) [Google Scholar] [CrossRef]
  40. Gibbs, R.J. Mechanisms Controlling World Water Chemistry. Science 1970, 170, 1088–1090. [Google Scholar] [CrossRef] [PubMed]
  41. He, M.; Zhang, B.; Xia, W.; Cui, Z.; Wang, L. Analysis of water chemical composition and main ion sources in Tianjin Qilihai Wetland. Environ. Sci. 2021, 42, 10. (In Chinese) [Google Scholar]
  42. Soulsby, C.; Chen, M.; Ferrier, R.C.; Helliwell, R.C.; Jenkins, A.; Harriman, R. Hydrogeochemistry of shallow groundwater in an upland Scottish catchment. Hydrol. Process. 2015, 12, 1111–1127. [Google Scholar] [CrossRef]
  43. Asmoay, A.A.; Mousa, I.E.; Mabrouk, W.A. Simulation of Rock-Water Interaction in the Southwestern Part of El Minya Governorate of Egypt. J. Geol. Soc. India 2024, 100, 153–304. [Google Scholar] [CrossRef]
  44. Wang, S.; Chen, J.; Zhang, S.; Zhang, X.; Chen, D.; Zhou, J. Hydrochemical evolution characteristics, controlling factors, and high nitrate hazards of shallow groundwater in a typical agricultural area of Nansi Lake Basin, North China. Environ. Research. Sect. A 2023, 223, 115430. [Google Scholar] [CrossRef] [PubMed]
  45. Zhang, J.; Zhou, J.; Chen, Y.; Wei, X.; Zeng, Y.; Sun, Y. Identifying the factors controlling surface water and groundwater chemical characteristics and irrigation suitability in the Yarkant River Basin, northwest China. Environ. Res. 2023, 223, 115452. [Google Scholar] [CrossRef] [PubMed]
  46. Ren, X.; Zhang, Z.; Yu, R.; Li, Y.; Li, Y.; Zhao, Y. Hydrochemical variations and driving mechanisms in a large linked river-irrigation-lake system. Environ. Res. 2023, 225, 115596. [Google Scholar] [CrossRef]
  47. Singh, G.; Rishi, M.S.; Herojeet, R.; Kaur, L.; Sharma, K. Evaluation of groundwater quality and human health risks from fluoride and nitrate in semi-arid region of northern India. Environ. Geochem. Health 2020, 42, 1833–1862. [Google Scholar] [CrossRef]
Figure 1. Geographical location of the study area and distribution of sampling points.
Water 17 01468 g001
Figure 2. Piper diagram in the study area.
Water 17 01468 g002
Figure 3. Main ion correlation heat map. Note: K+, Na+, Ca2+, Mg2+, Cl, SO42−, HCO3, NO3-N, TDS, and TA represent their concentrations; * indicates a correlation coefficient significant at the 0.05 level; ** indicates a correlation coefficient significant at the 0.01 level; *** indicates a correlation coefficient significant at the 0.001 level; circles represent the magnitude of the correlation coefficient, with larger circles indicating stronger correlations, and smaller circles indicating weaker correlations. Red represents a positive correlation, while blue represents a negative correlation.
Water 17 01468 g003
Figure 4. Isotopic Relationship Between Lake Water and Shallow Groundwater in Hengshui Lake Wetland (Adapted from Reference [31]). (a) shows the isotopic relationship of different water bodies in Hengshui Lake Wetland; (b) shows the d-excess relationship of different water bodies in Hengshui Lake Wetland.
Water 17 01468 g004
Figure 5. Ratio relationship of ions. (a) shows the relationship between γ(Na+ + K+) and γ(Cl); (b) shows the relationship between γ(Ca+) and γ(SO42−); (c) shows the relationship between γ(Ca++Mg2+) and γ(HCO3+SO42−); (d) shows the relationship between γ(SO42−+Cl) and γ(HCO3).
Water 17 01468 g005
Figure 6. Gibbs diagram in the study area.
Water 17 01468 g006
Figure 7. The relationships between n(HCO3/Na+) and n(Ca2+/Na+), and between n(Mg2+/Na+) and n(Ca2+/Na+).
Water 17 01468 g007
Figure 8. Relationship between mineral saturation index and TDS.The circle is represented as Dolomite; The square is represented as Calcite; The triangle is represented as Plaster.
Water 17 01468 g008
Figure 9. Ratio diagram of cation alternating adsorption. (a) shows the relationship between γ(Na+ + Ca2++ Mg2+) and γ(HCO3+SO42−+Cl); (b) shows the relationship between γ(Ca2++ Mg2+ − SO42−− HCO3) and γ(Na++K+−Cl).
Water 17 01468 g009
Figure 10. CAI distribution.
Water 17 01468 g010
Figure 11. Ratio of γ(SO42−)/γ(Na+) to γ(NO3)/γ(Na+) and γ(Cl)/γ(Na+) to γ(NO3)/γ(Na+). (a) can be used to determine the sources of SO42− and NO3; (b) can be used to determine the sources of NO3 and Cl.
Water 17 01468 g011
Table 1. Statistics of hydrochemical parameters in the study area.
IndexUnderground Water (N = 5)Lake Water (N = 10)
MINMAXAVGSDCVMINMAXAVGSDCV
Ca2+92.20507.98230.13174.3375.7545.3360.6355.895.6410.09
Mg2+78.70497.70199.06172.0286.4143.5352.2248.062.755.71
Na+319.74871.92515.35209.6740.69155.97178.12164.337.944.83
K+1.1113.414.215.24124.389.9110.9310.480.333.13
Cl267.151076619.31306.0549.42160.85196.15172.0511.916.92
SO42−367.402606.50988.02921.8093.30206.05268.65250.0619.337.73
HCO3551.62724.92634.8568.9910.87219.06247.74228.158.863.88
NO3-N10.66343.9095.33141.92148.864.045.374.590.4910.73
F0.111.600.780.6481.590.640.790.720.056.67
pH7.307.697.510.141.898.028.458.310.141.66
TDS151264753103.801978.1763.73807881840.1022.052.63
TA452.36594.48520.6256.5710.87179.64203.16187.107.263.88
Note: “MIN”, “MAX”, “AVG”, “SD”, and “CV” represent minimum value, maximum value, average value, standard deviation, and coefficient of variation, respectively. The coefficient of variation is expressed in percentage (%), while all other units are in mg/L. Among the parameters, pH is dimensionless, and all other indicators are measured in mg/L.
Disclaimer/Publisher’s Note: The statements, opinions and data contained in all publications are solely those of the individual author(s) and contributor(s) and not of MDPI and/or the editor(s). MDPI and/or the editor(s) disclaim responsibility for any injury to people or property resulting from any ideas, methods, instructions or products referred to in the content.

