
Optimizing the Coordinated Regulation of Storage and Discharge Across Regions in Plain City Under Extreme Rainfall Scenarios


Abstract
1. Introduction
2. Study Area and Data Sources
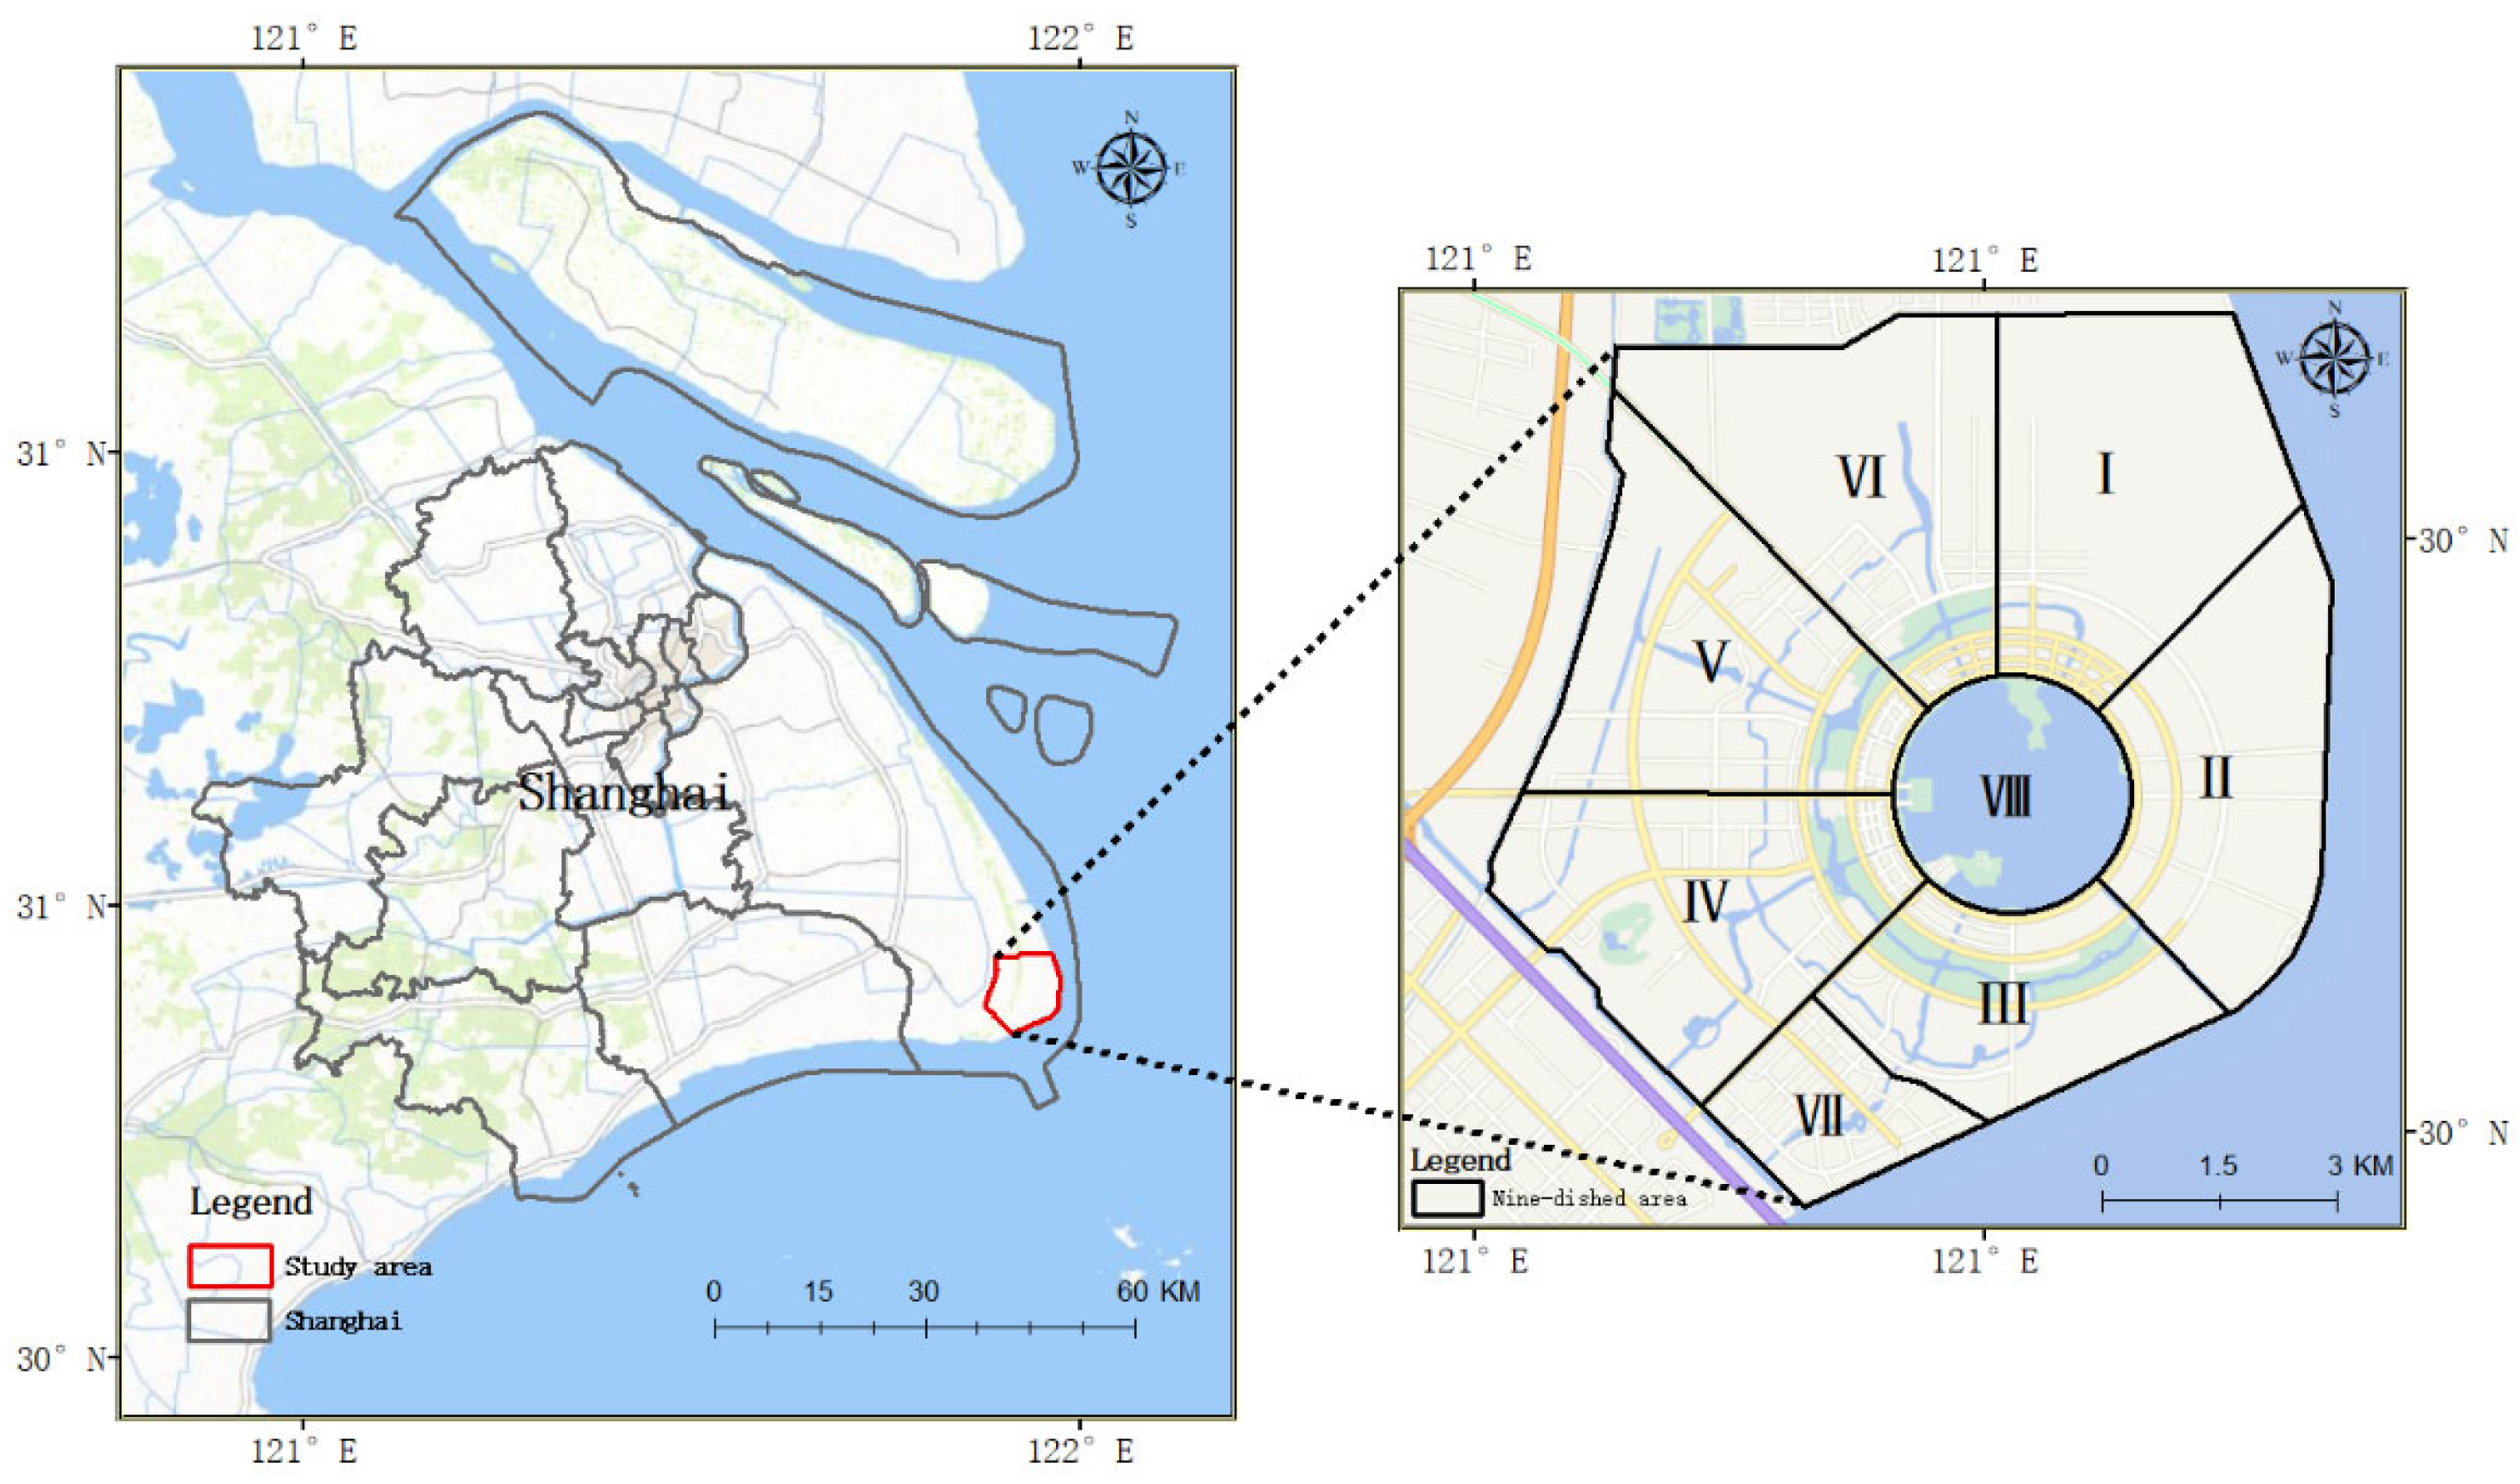
2.1. Study Area
2.2. Data Collection
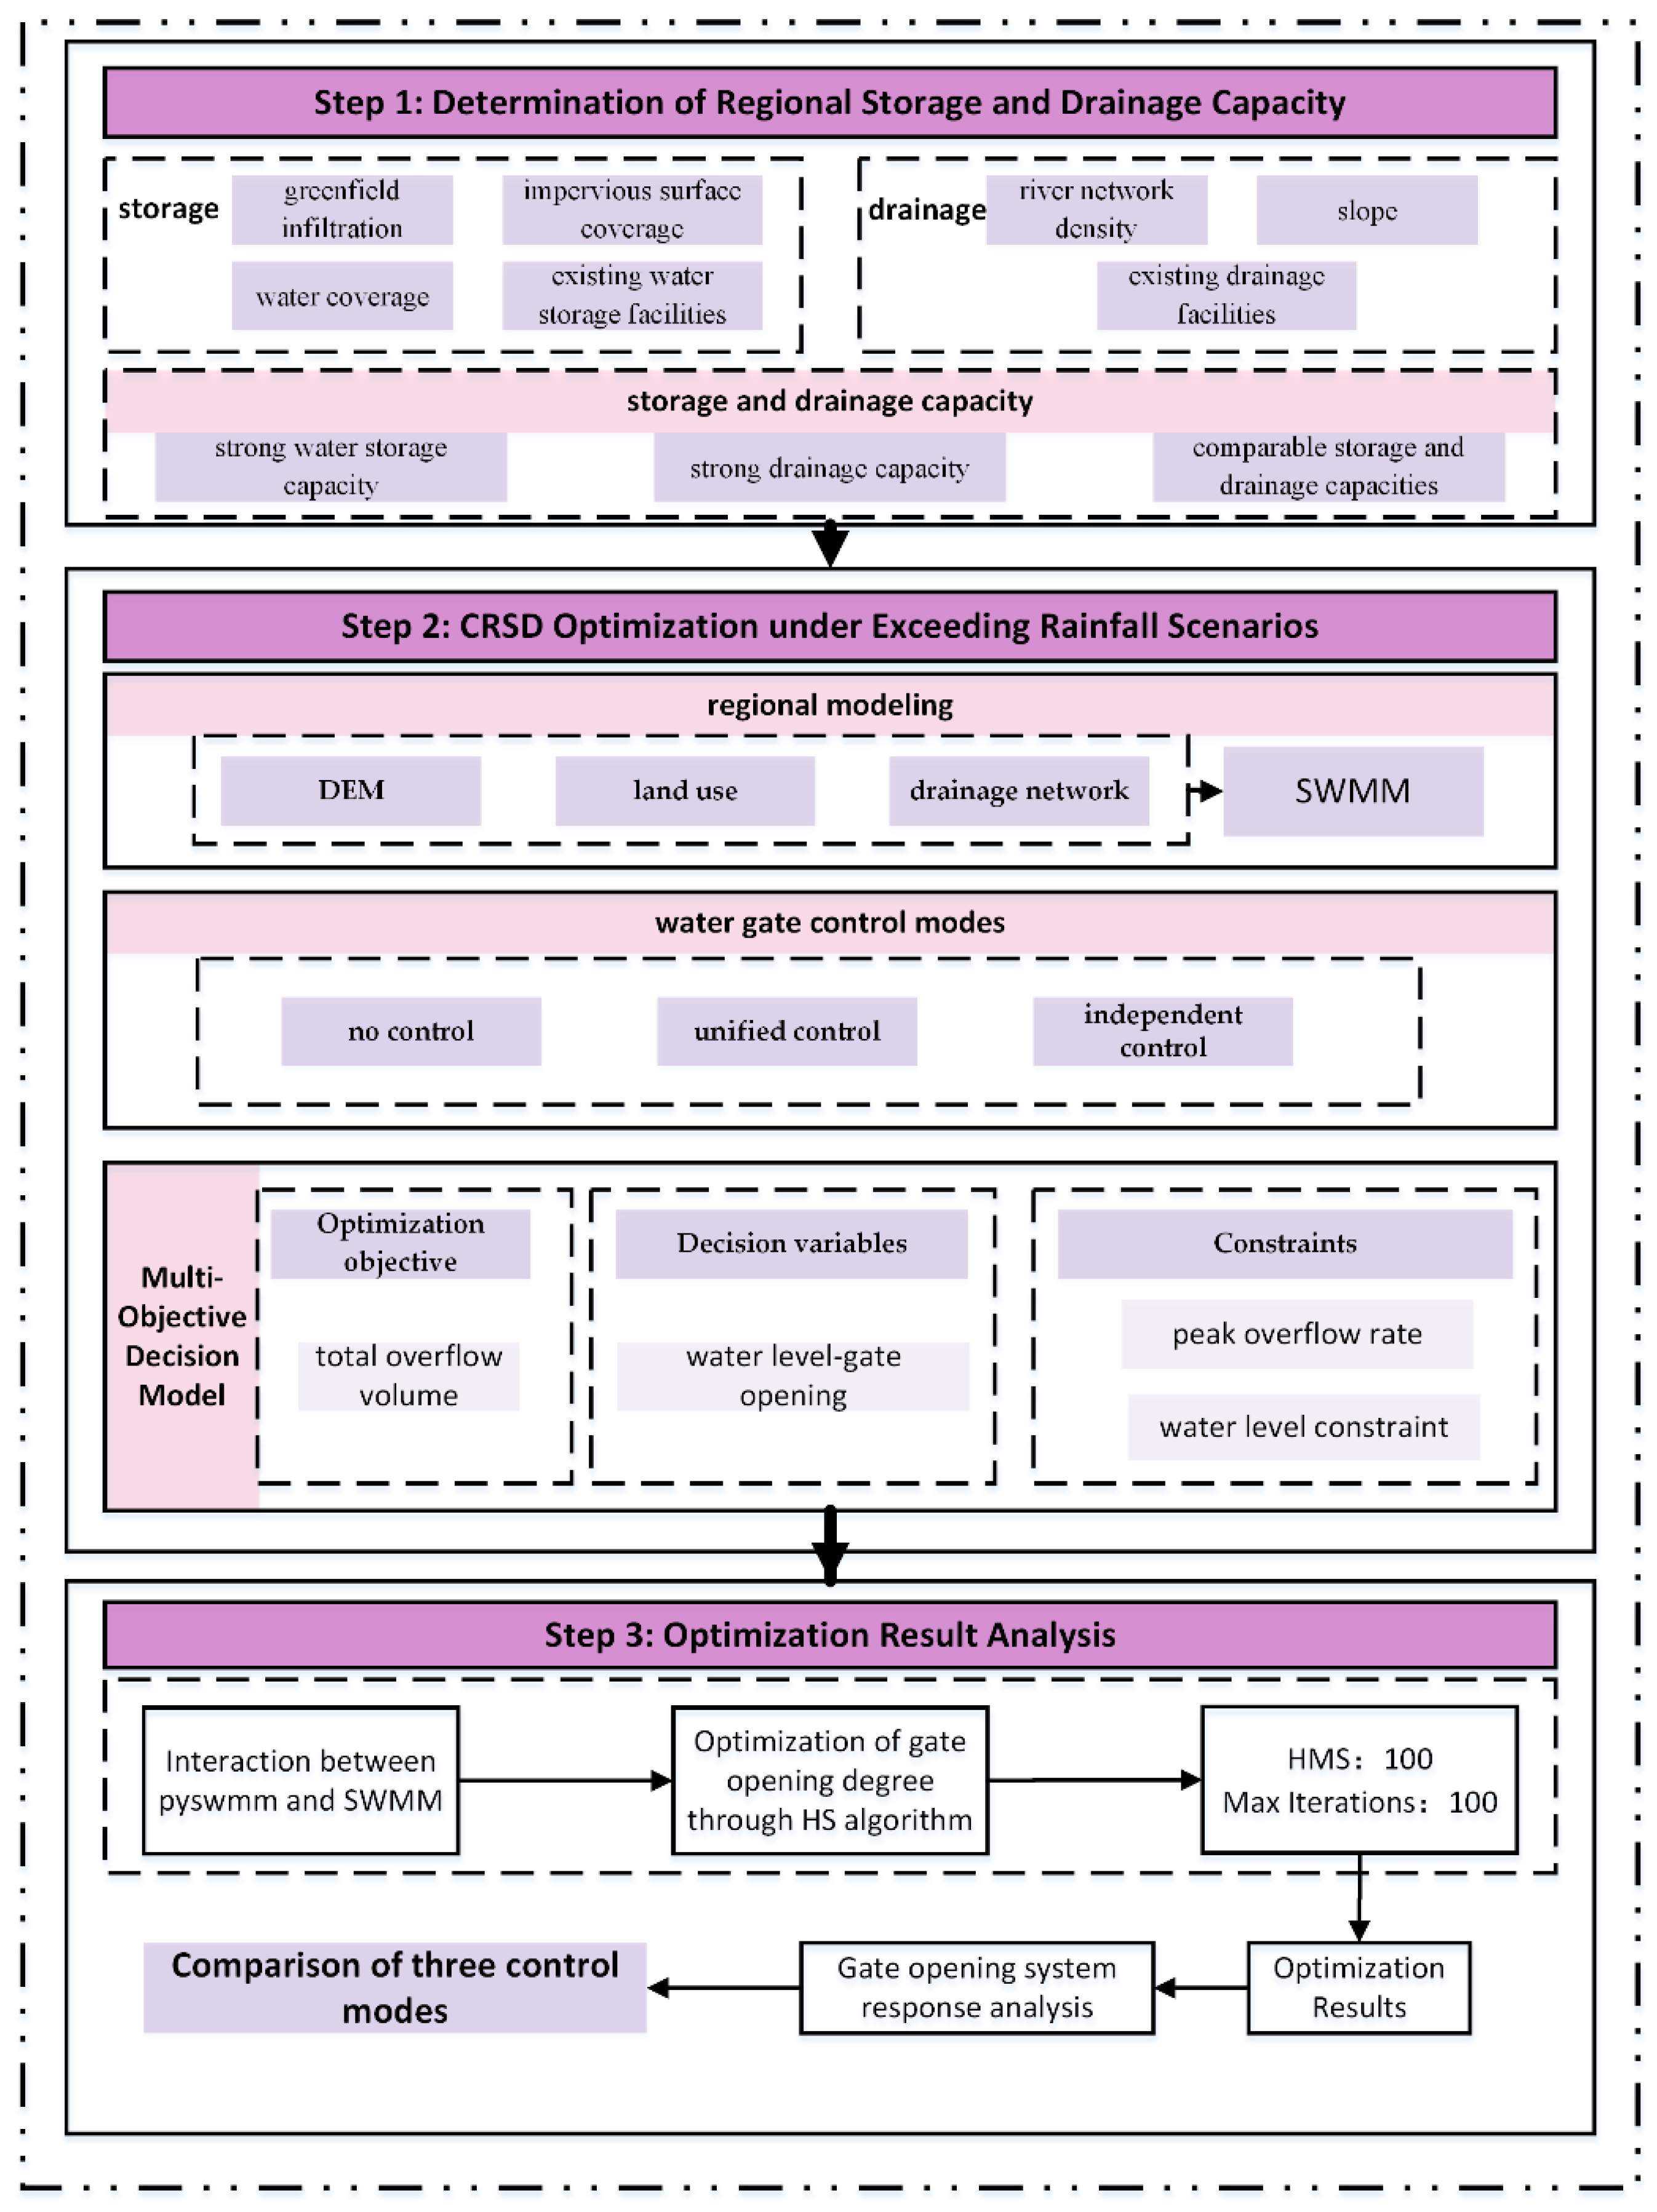
3. Methods
3.1. Assessment of Storage and Drainage Capacity
3.2. Optimization of CRSD Under Extreme Rainfall Scenarios
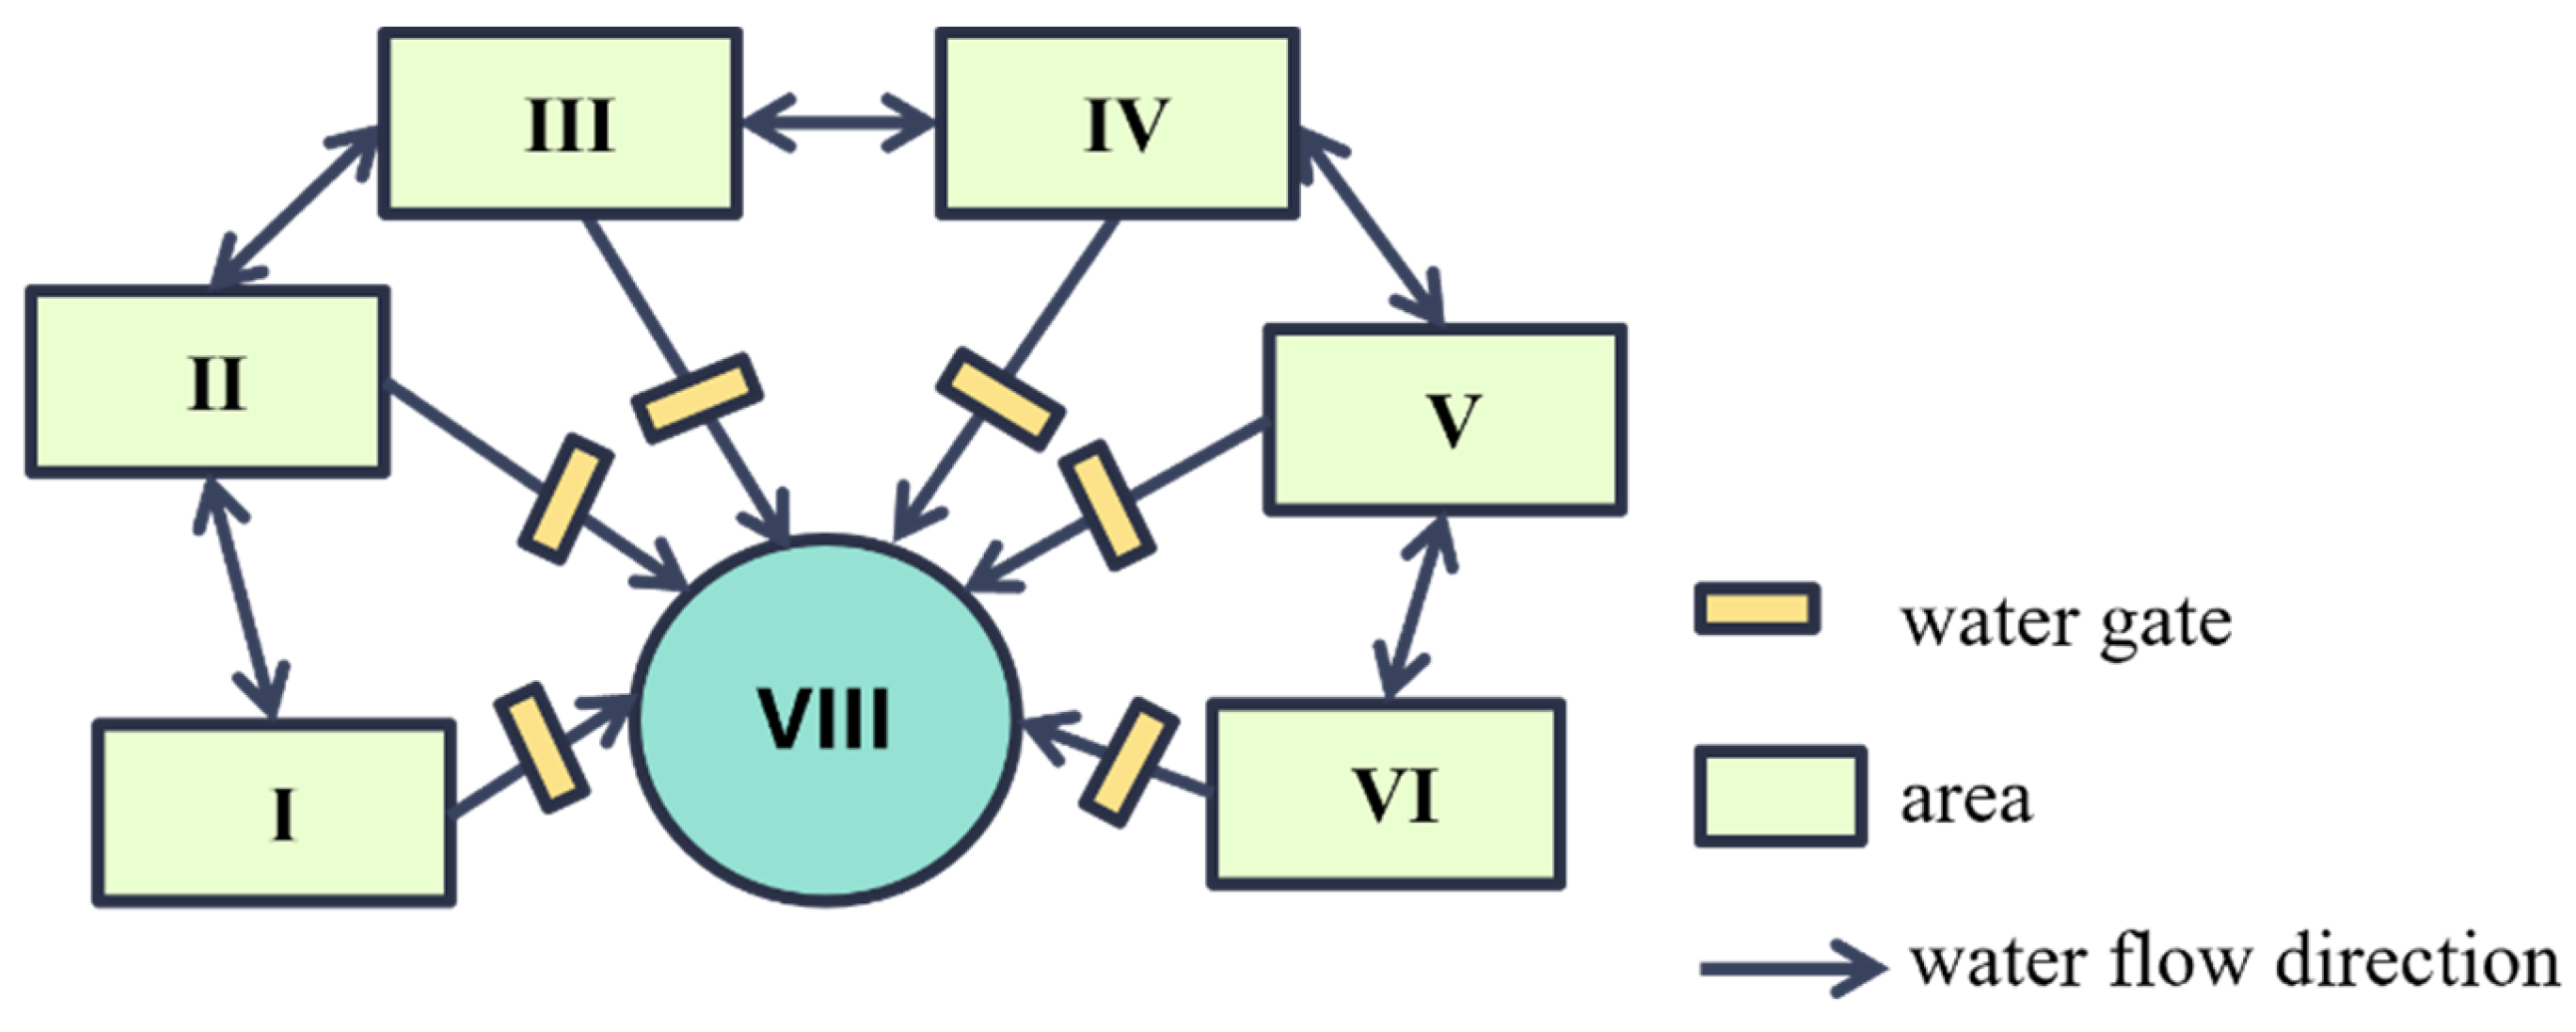
3.2.1. Water Gate Control Modes
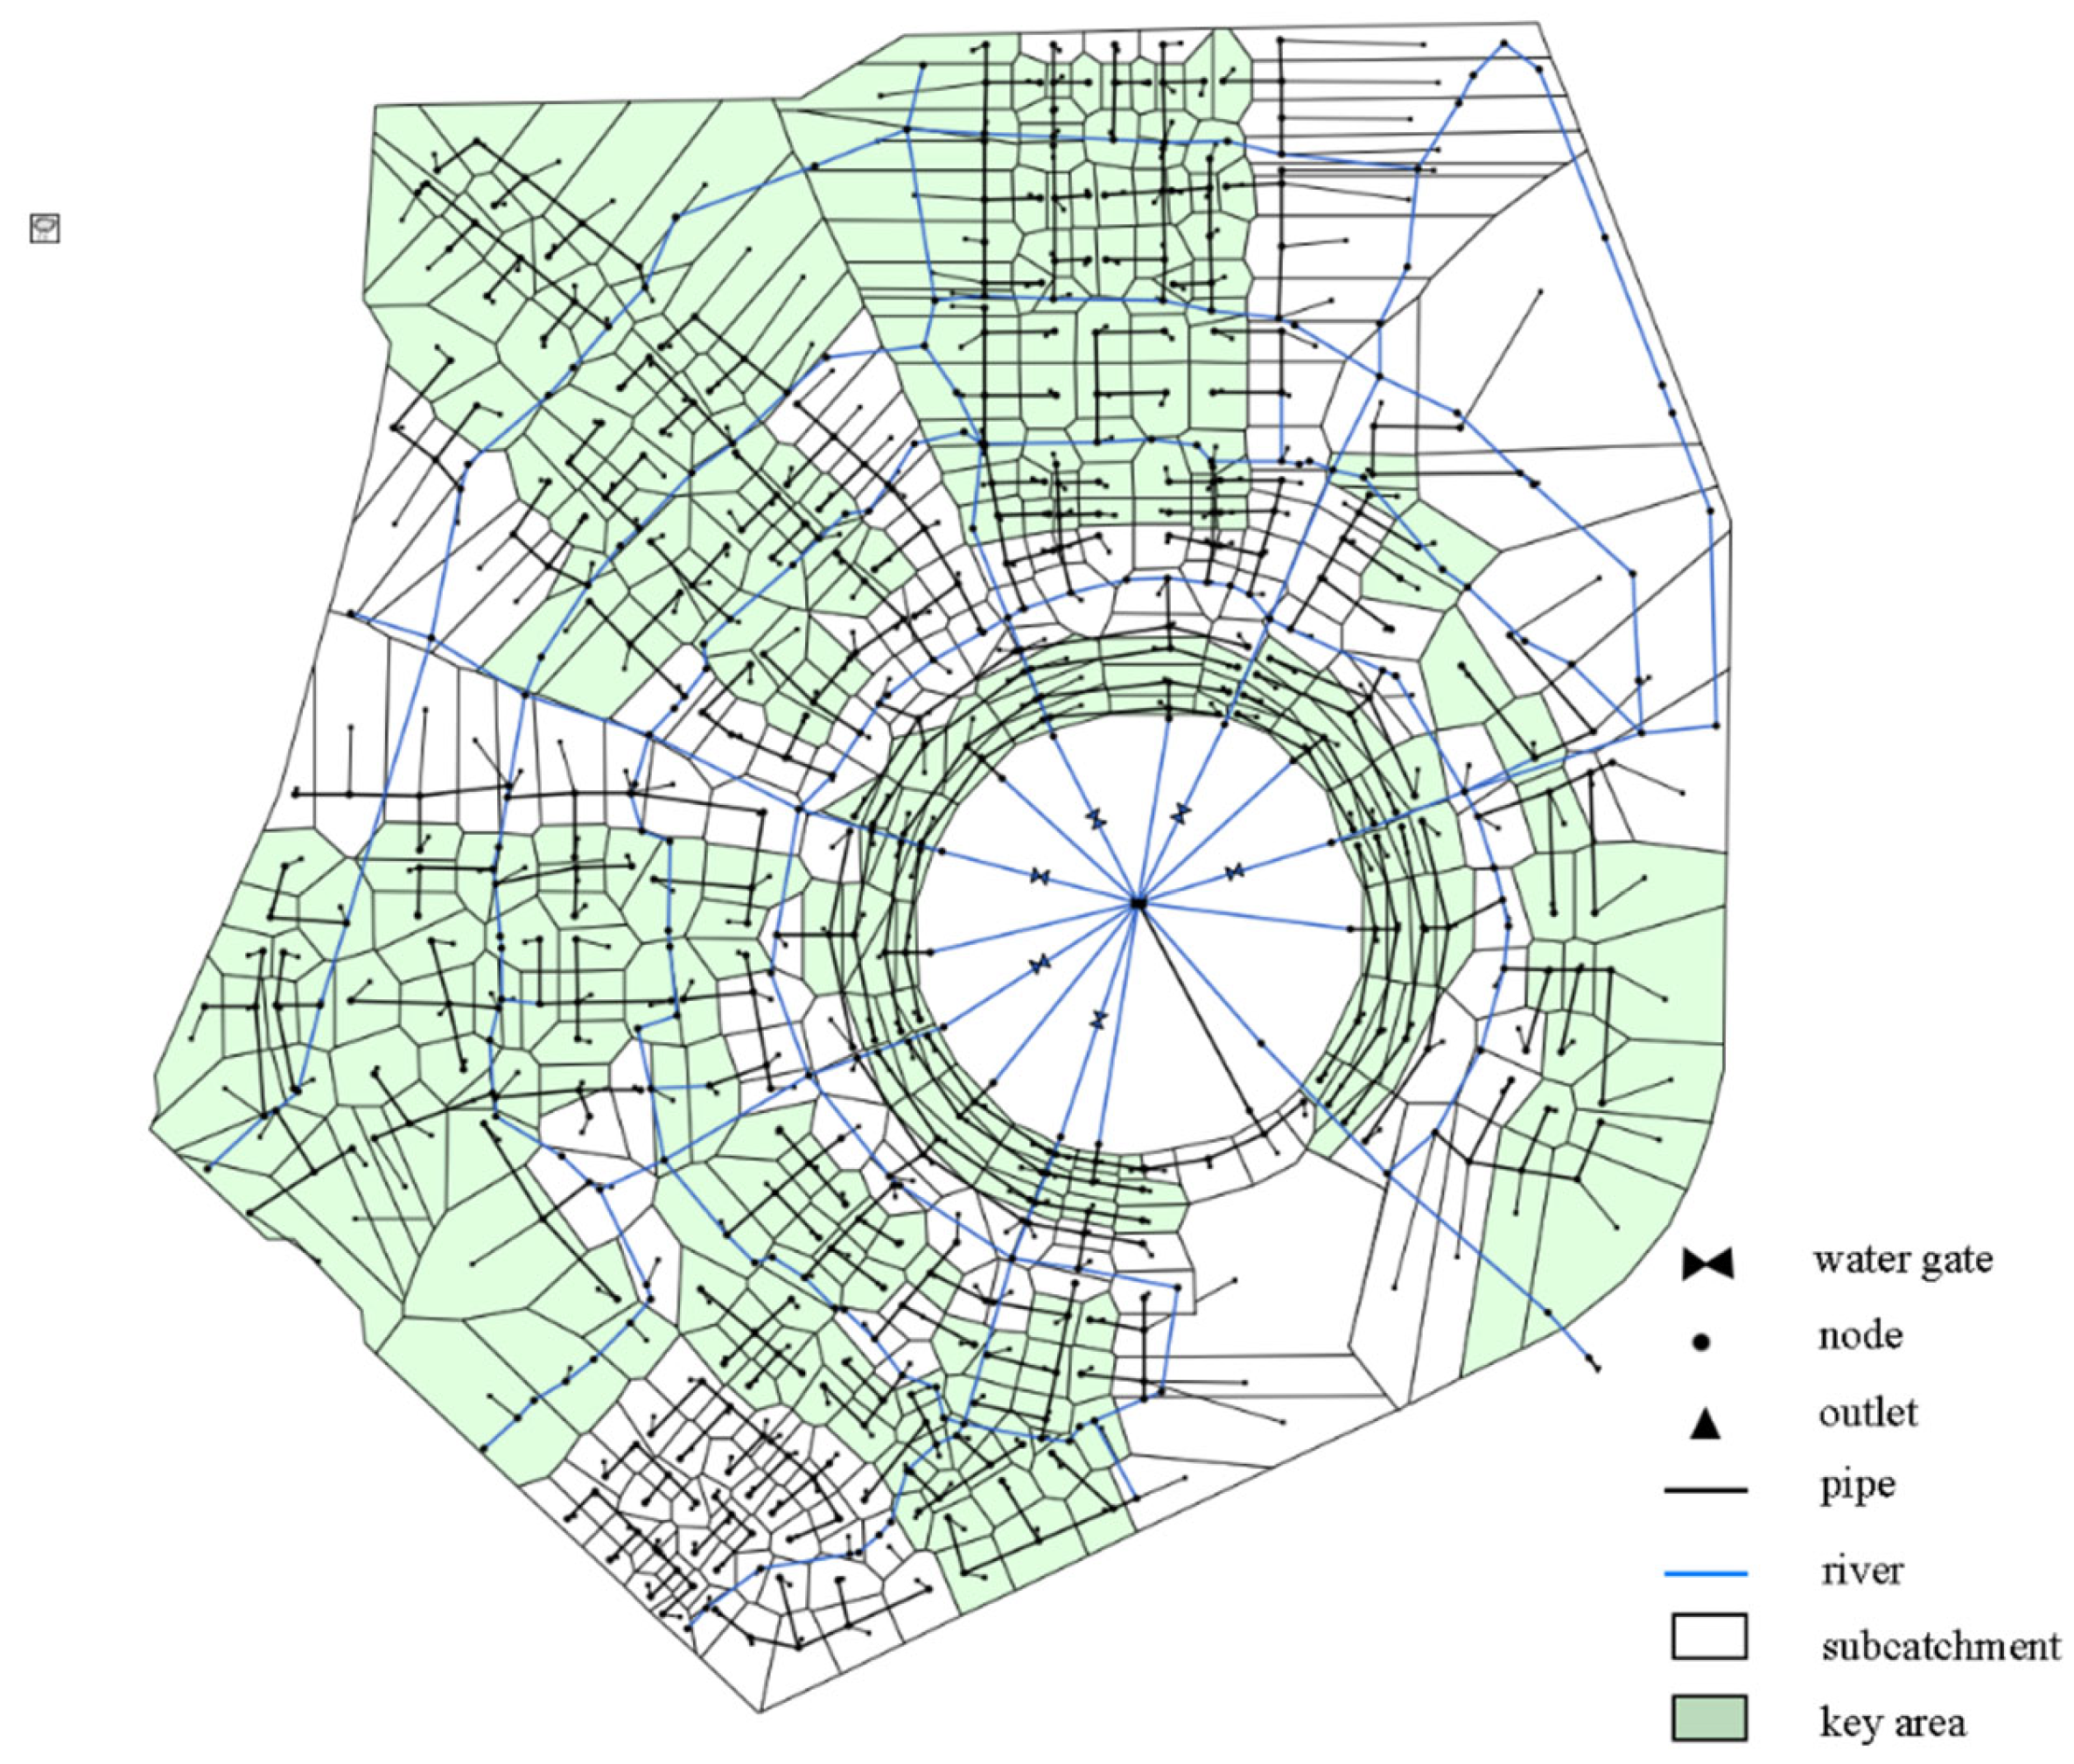
3.2.2. Regional Modeling
3.2.3. Water Gate Operation Optimization
Optimization Objective
- (1)
- Upstream overflow
- (2)
- Downstream overflow
Constraints
- (1)
- Peak overflow rate
- (2)
- Water level constraint
Decision Variables
Computational Experiment
3.2.4. System Response Analysis of Gate Opening Degree Adjustment
4. Results and Discussion
4.1. Regional Storage and Discharge Capacity
4.2. Water Gate Operation Optimization Results
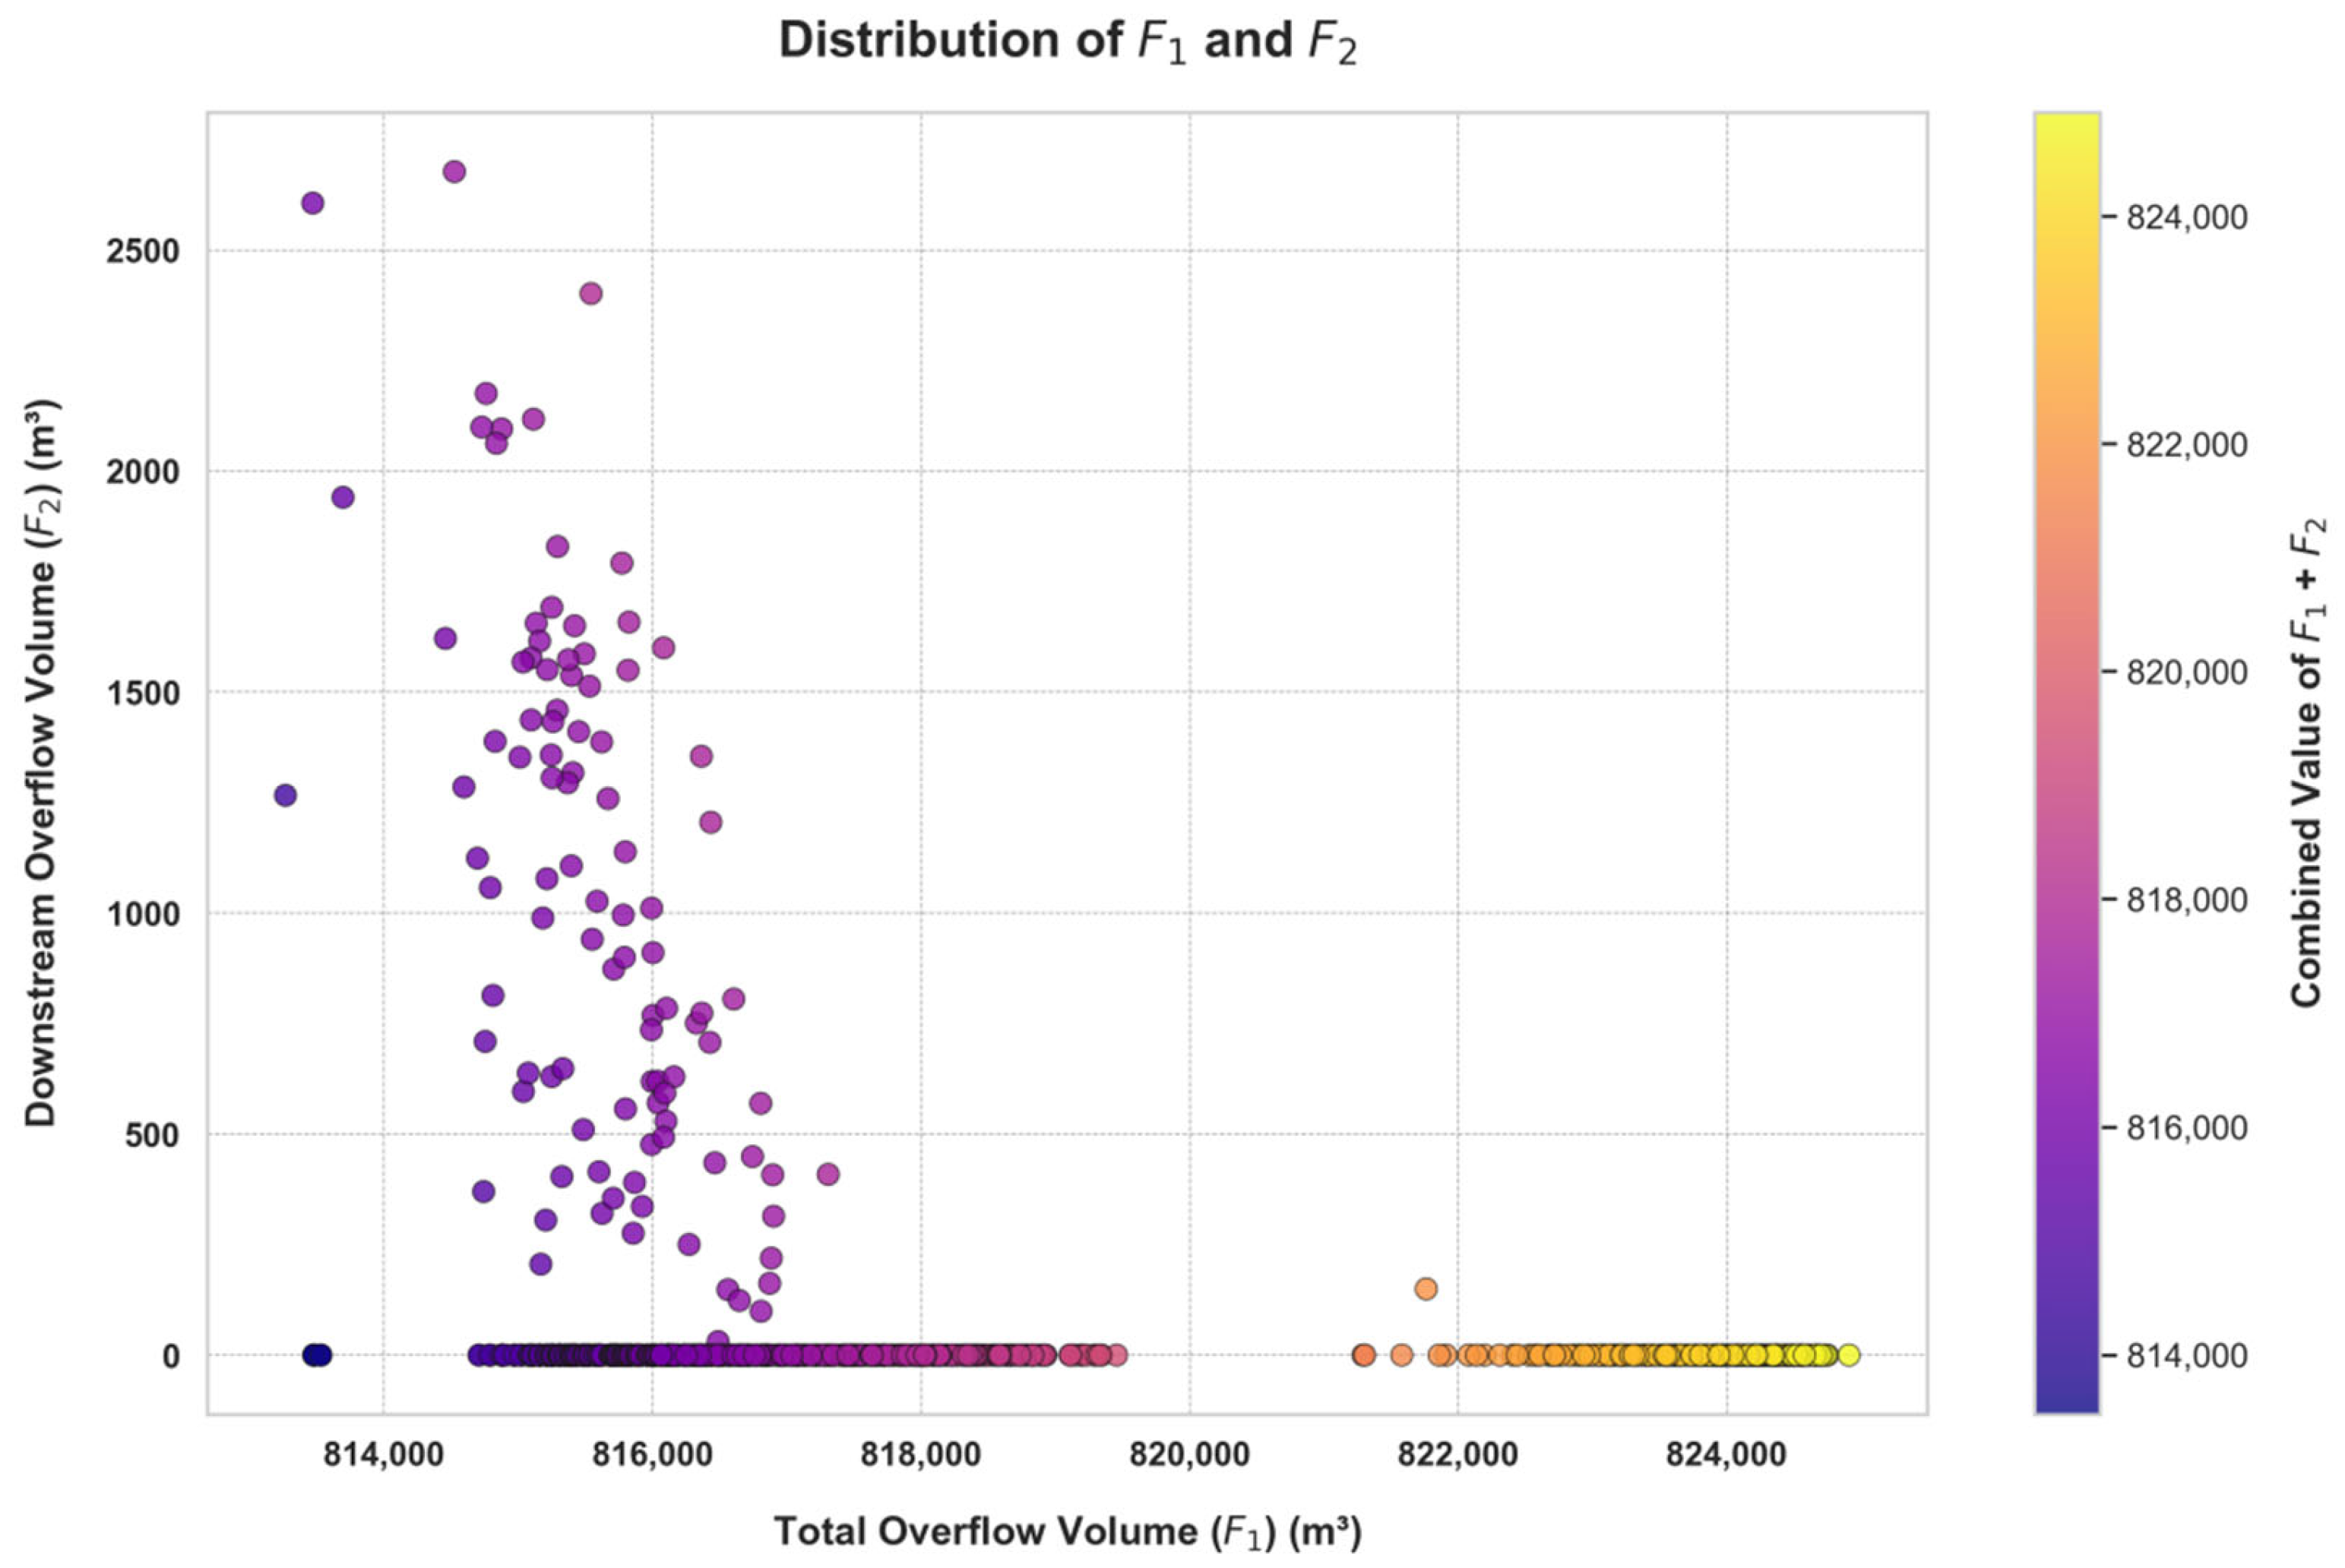
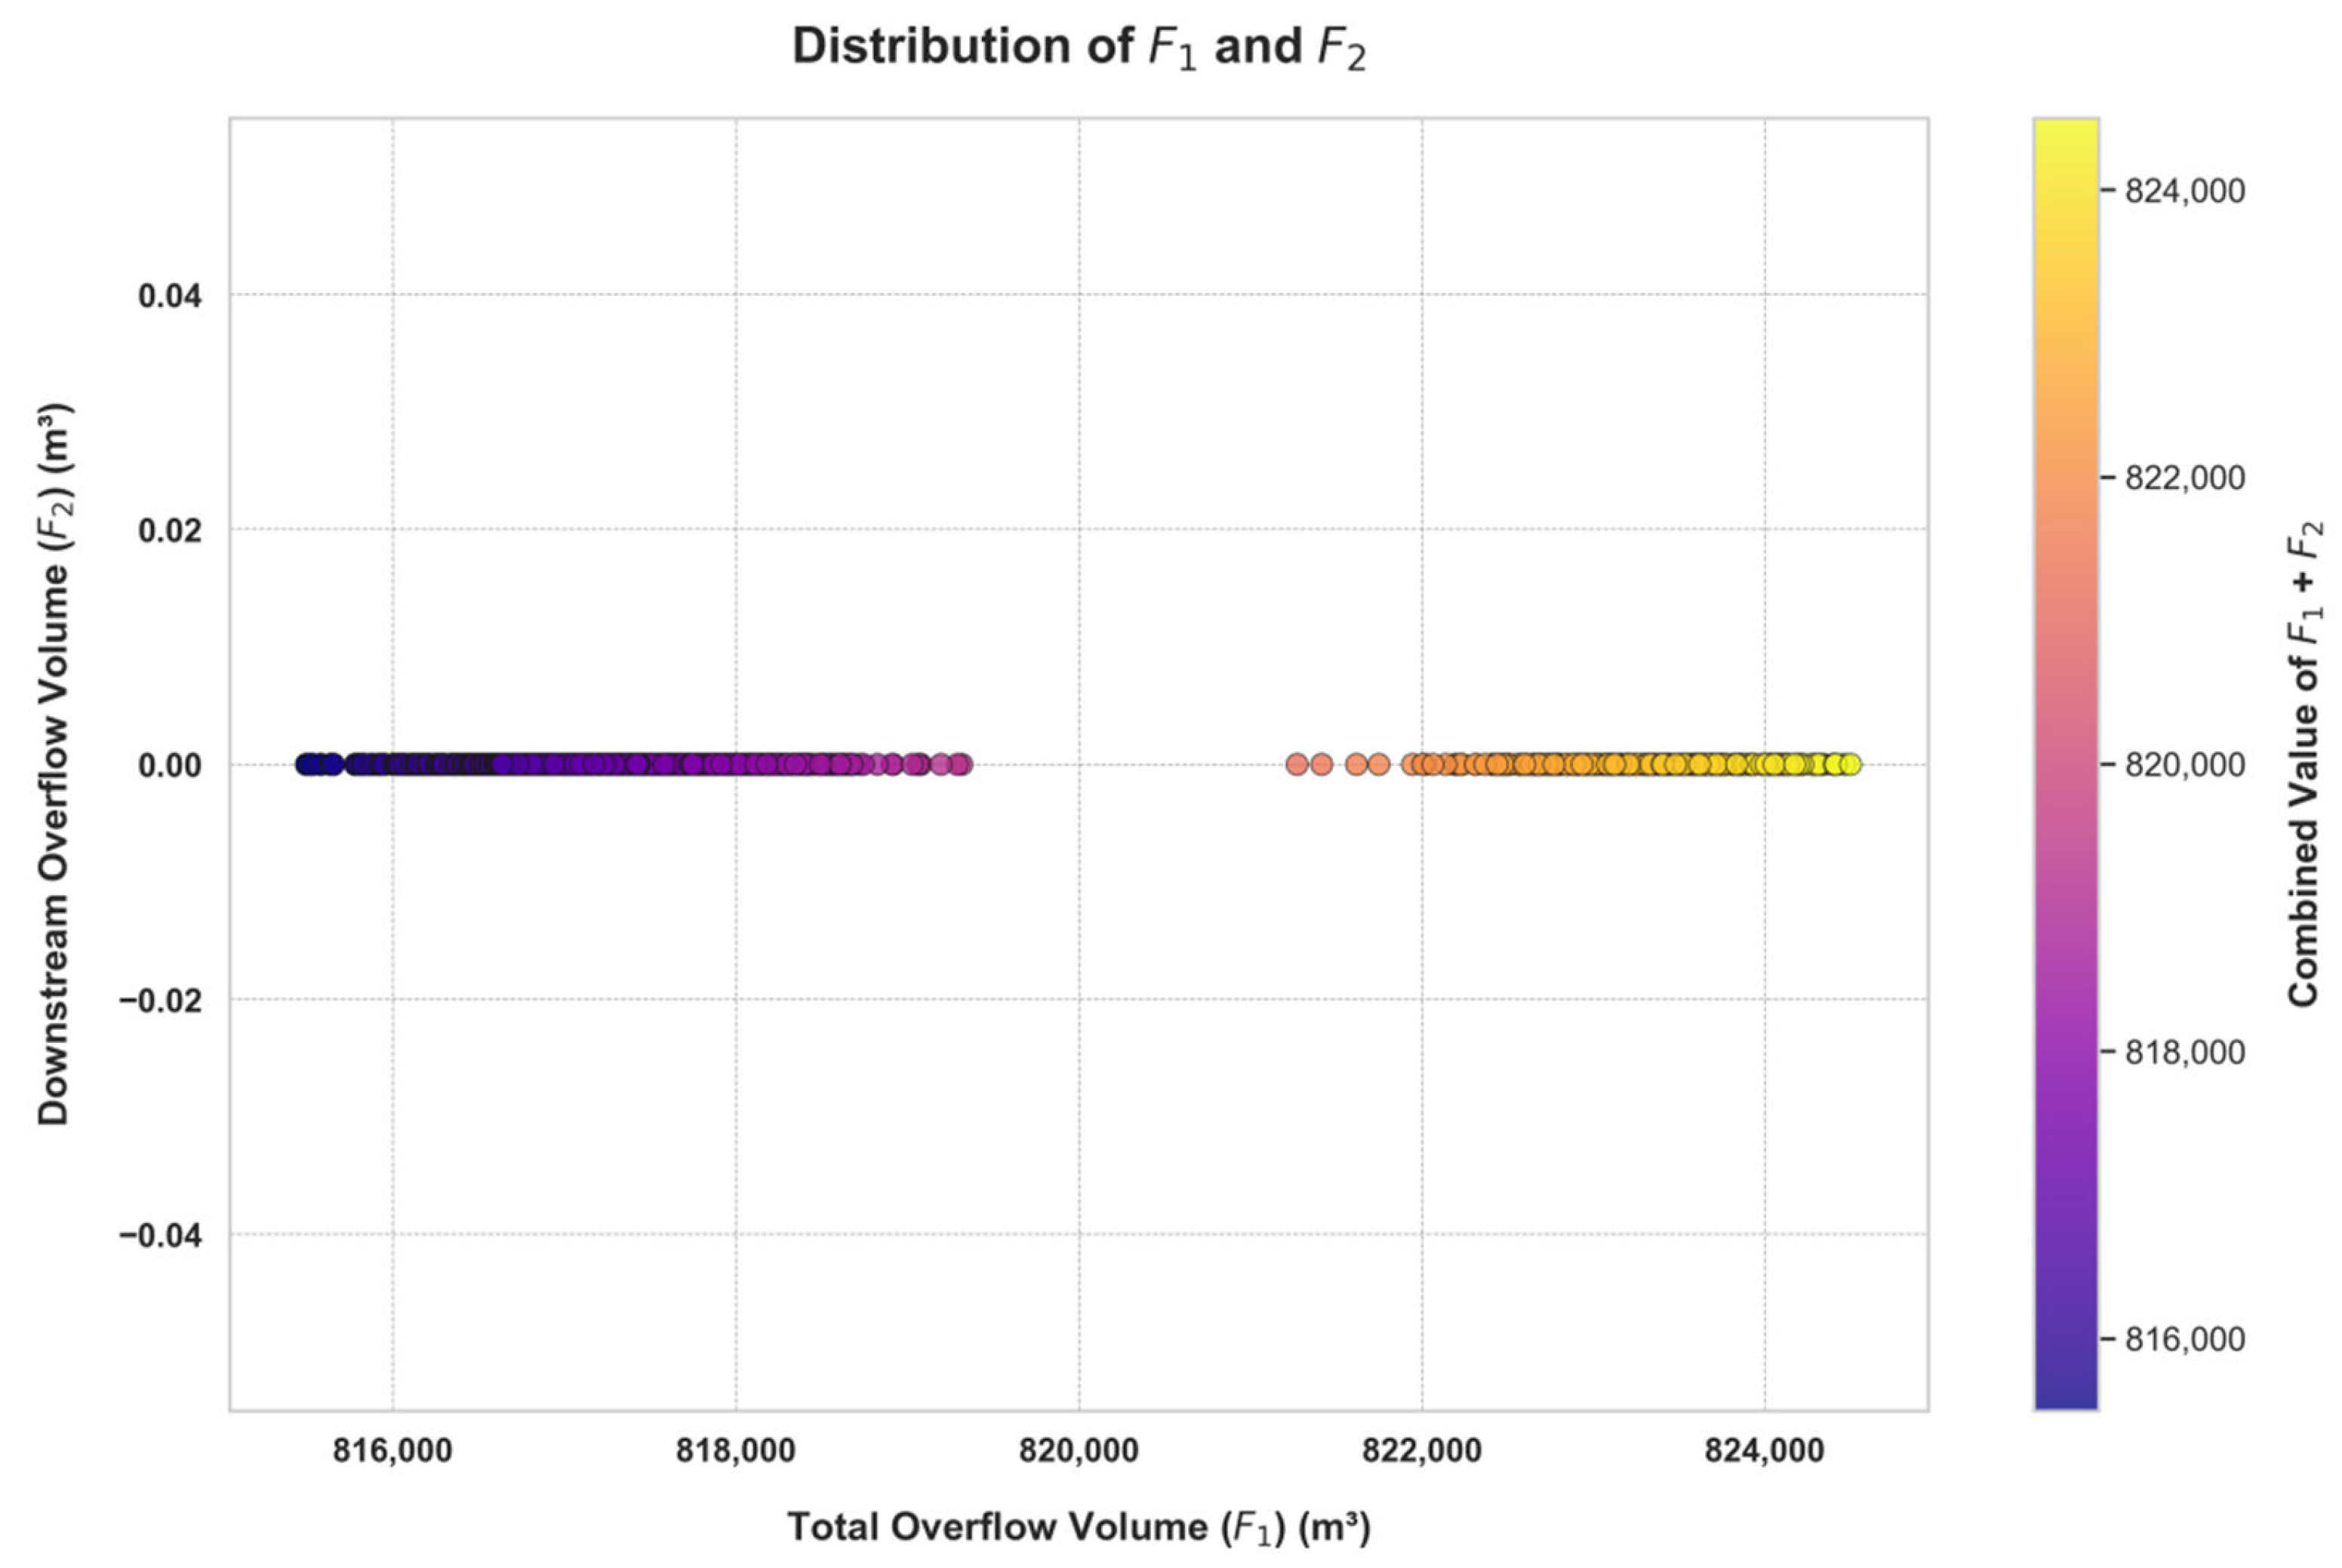
4.2.1. Objective Function Distribution Under Different Control Modes
4.2.2. Optimal Solutions Under Different Control Modes
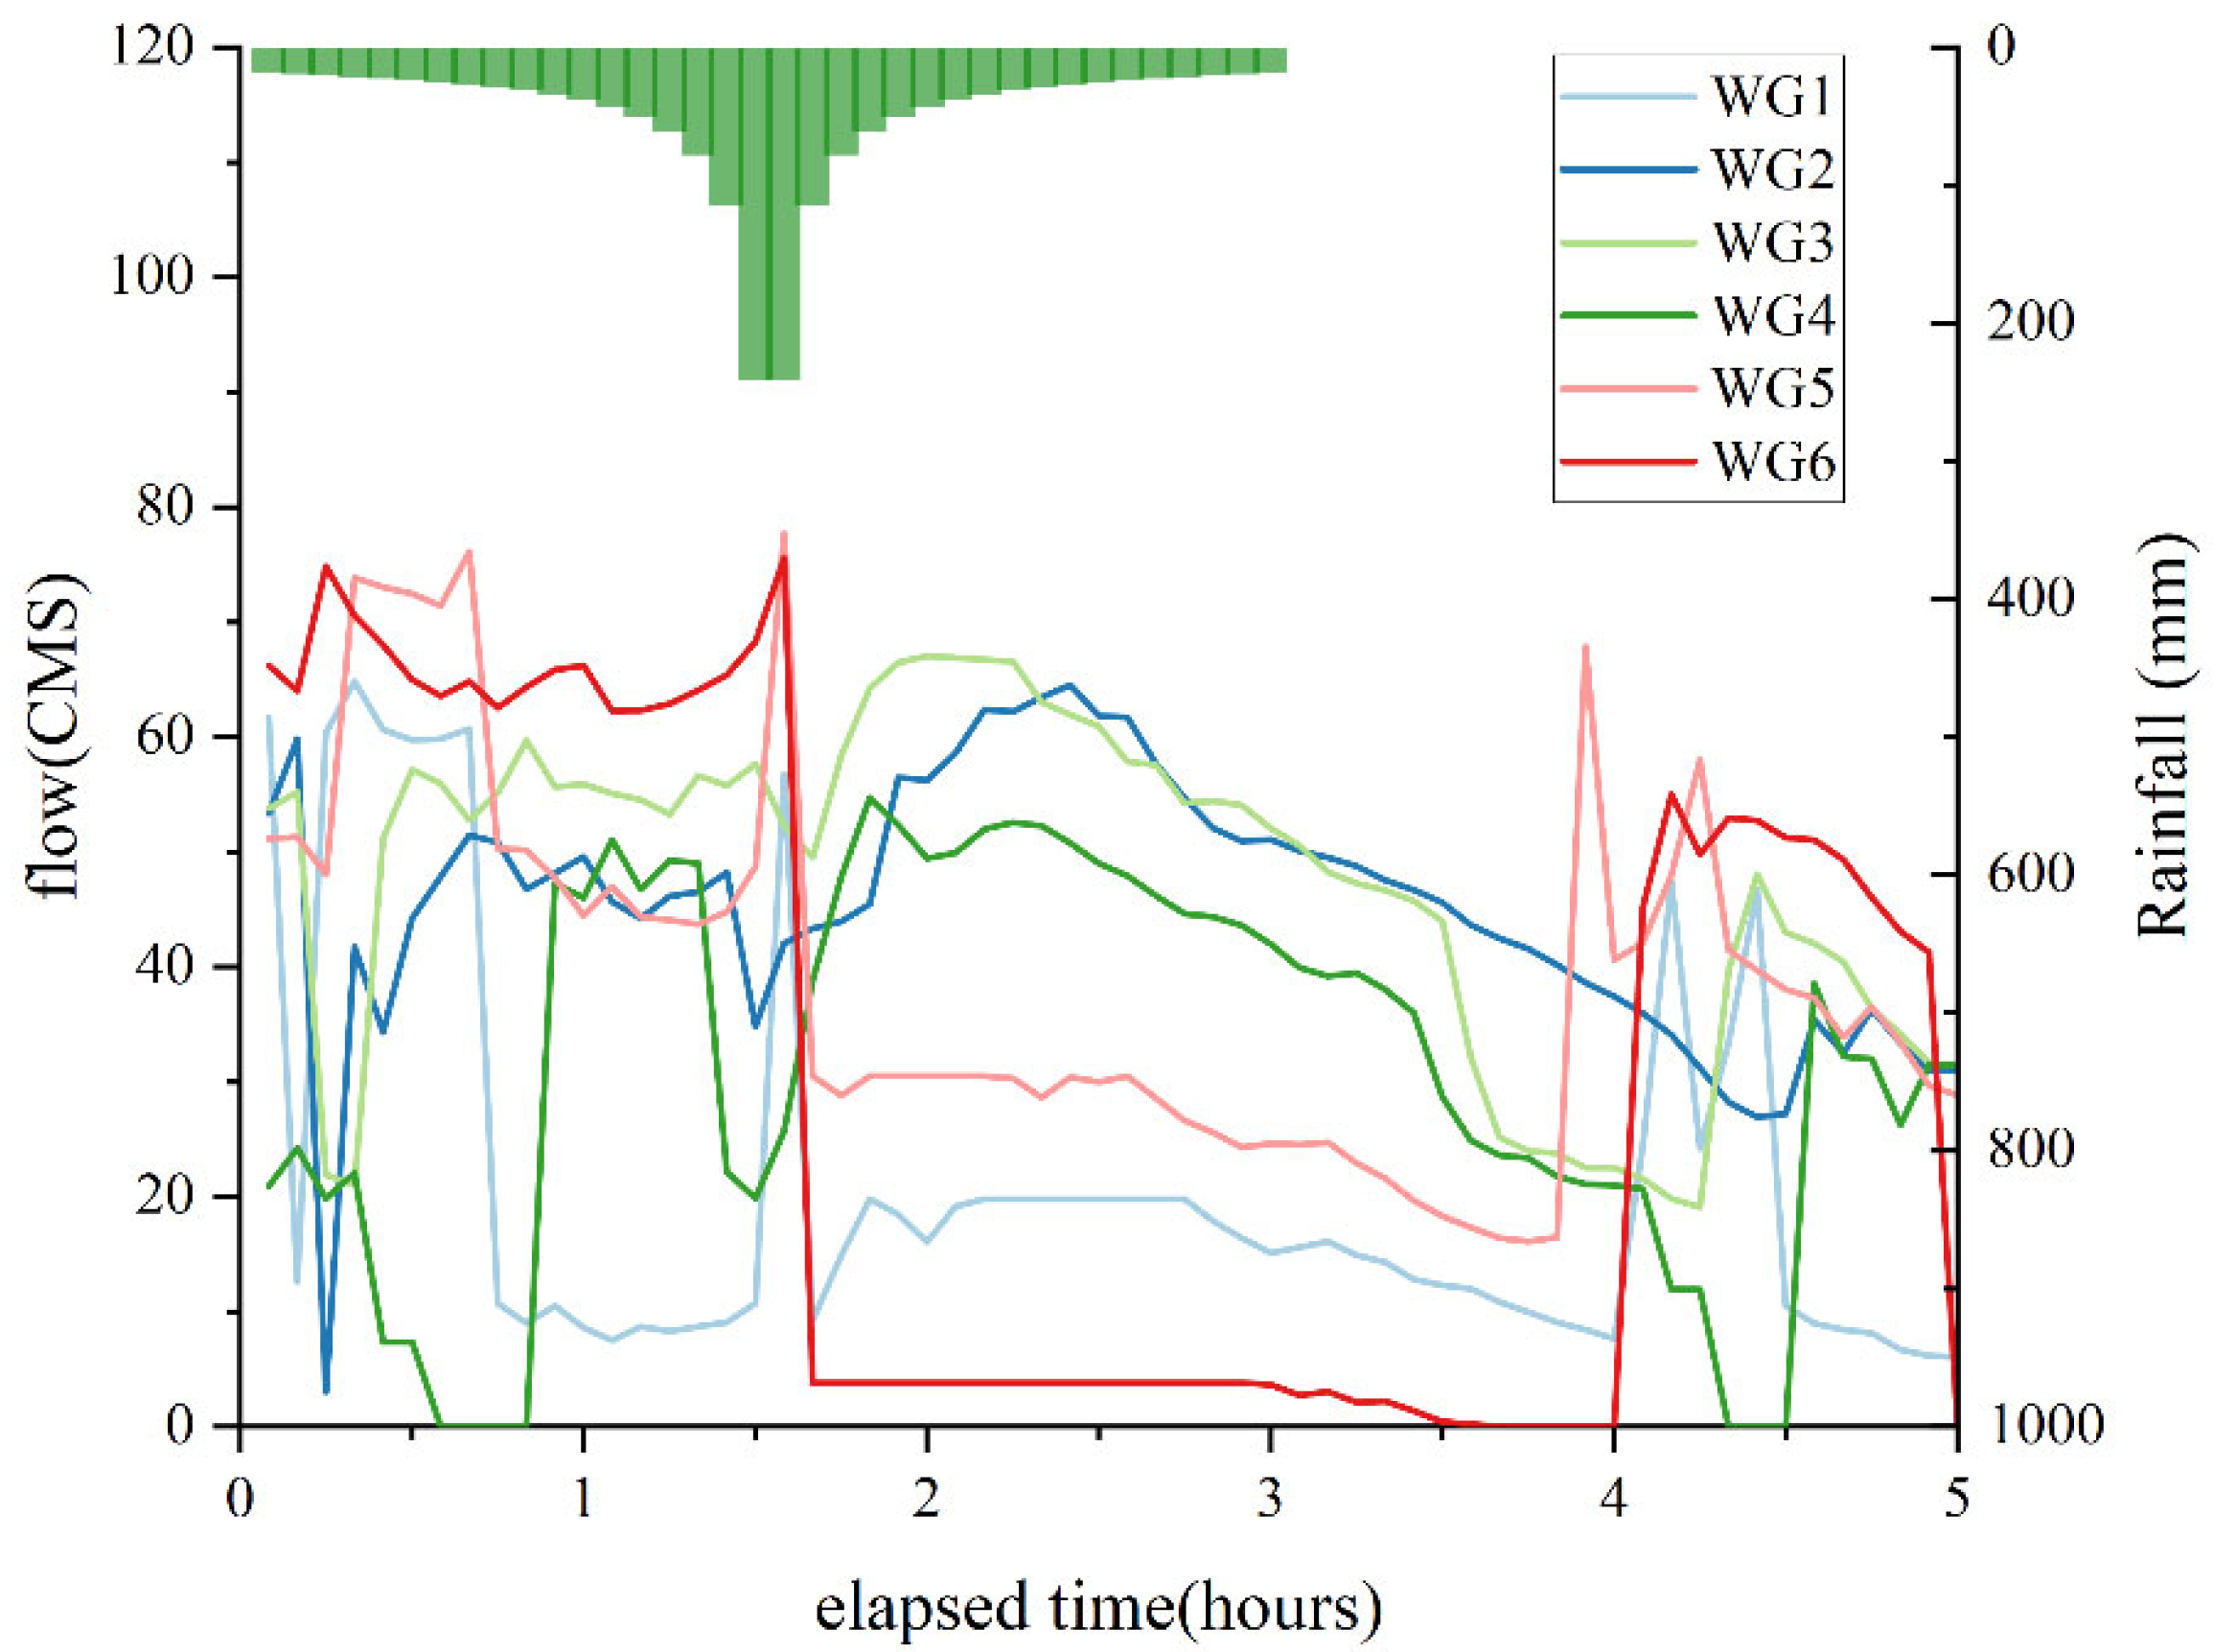
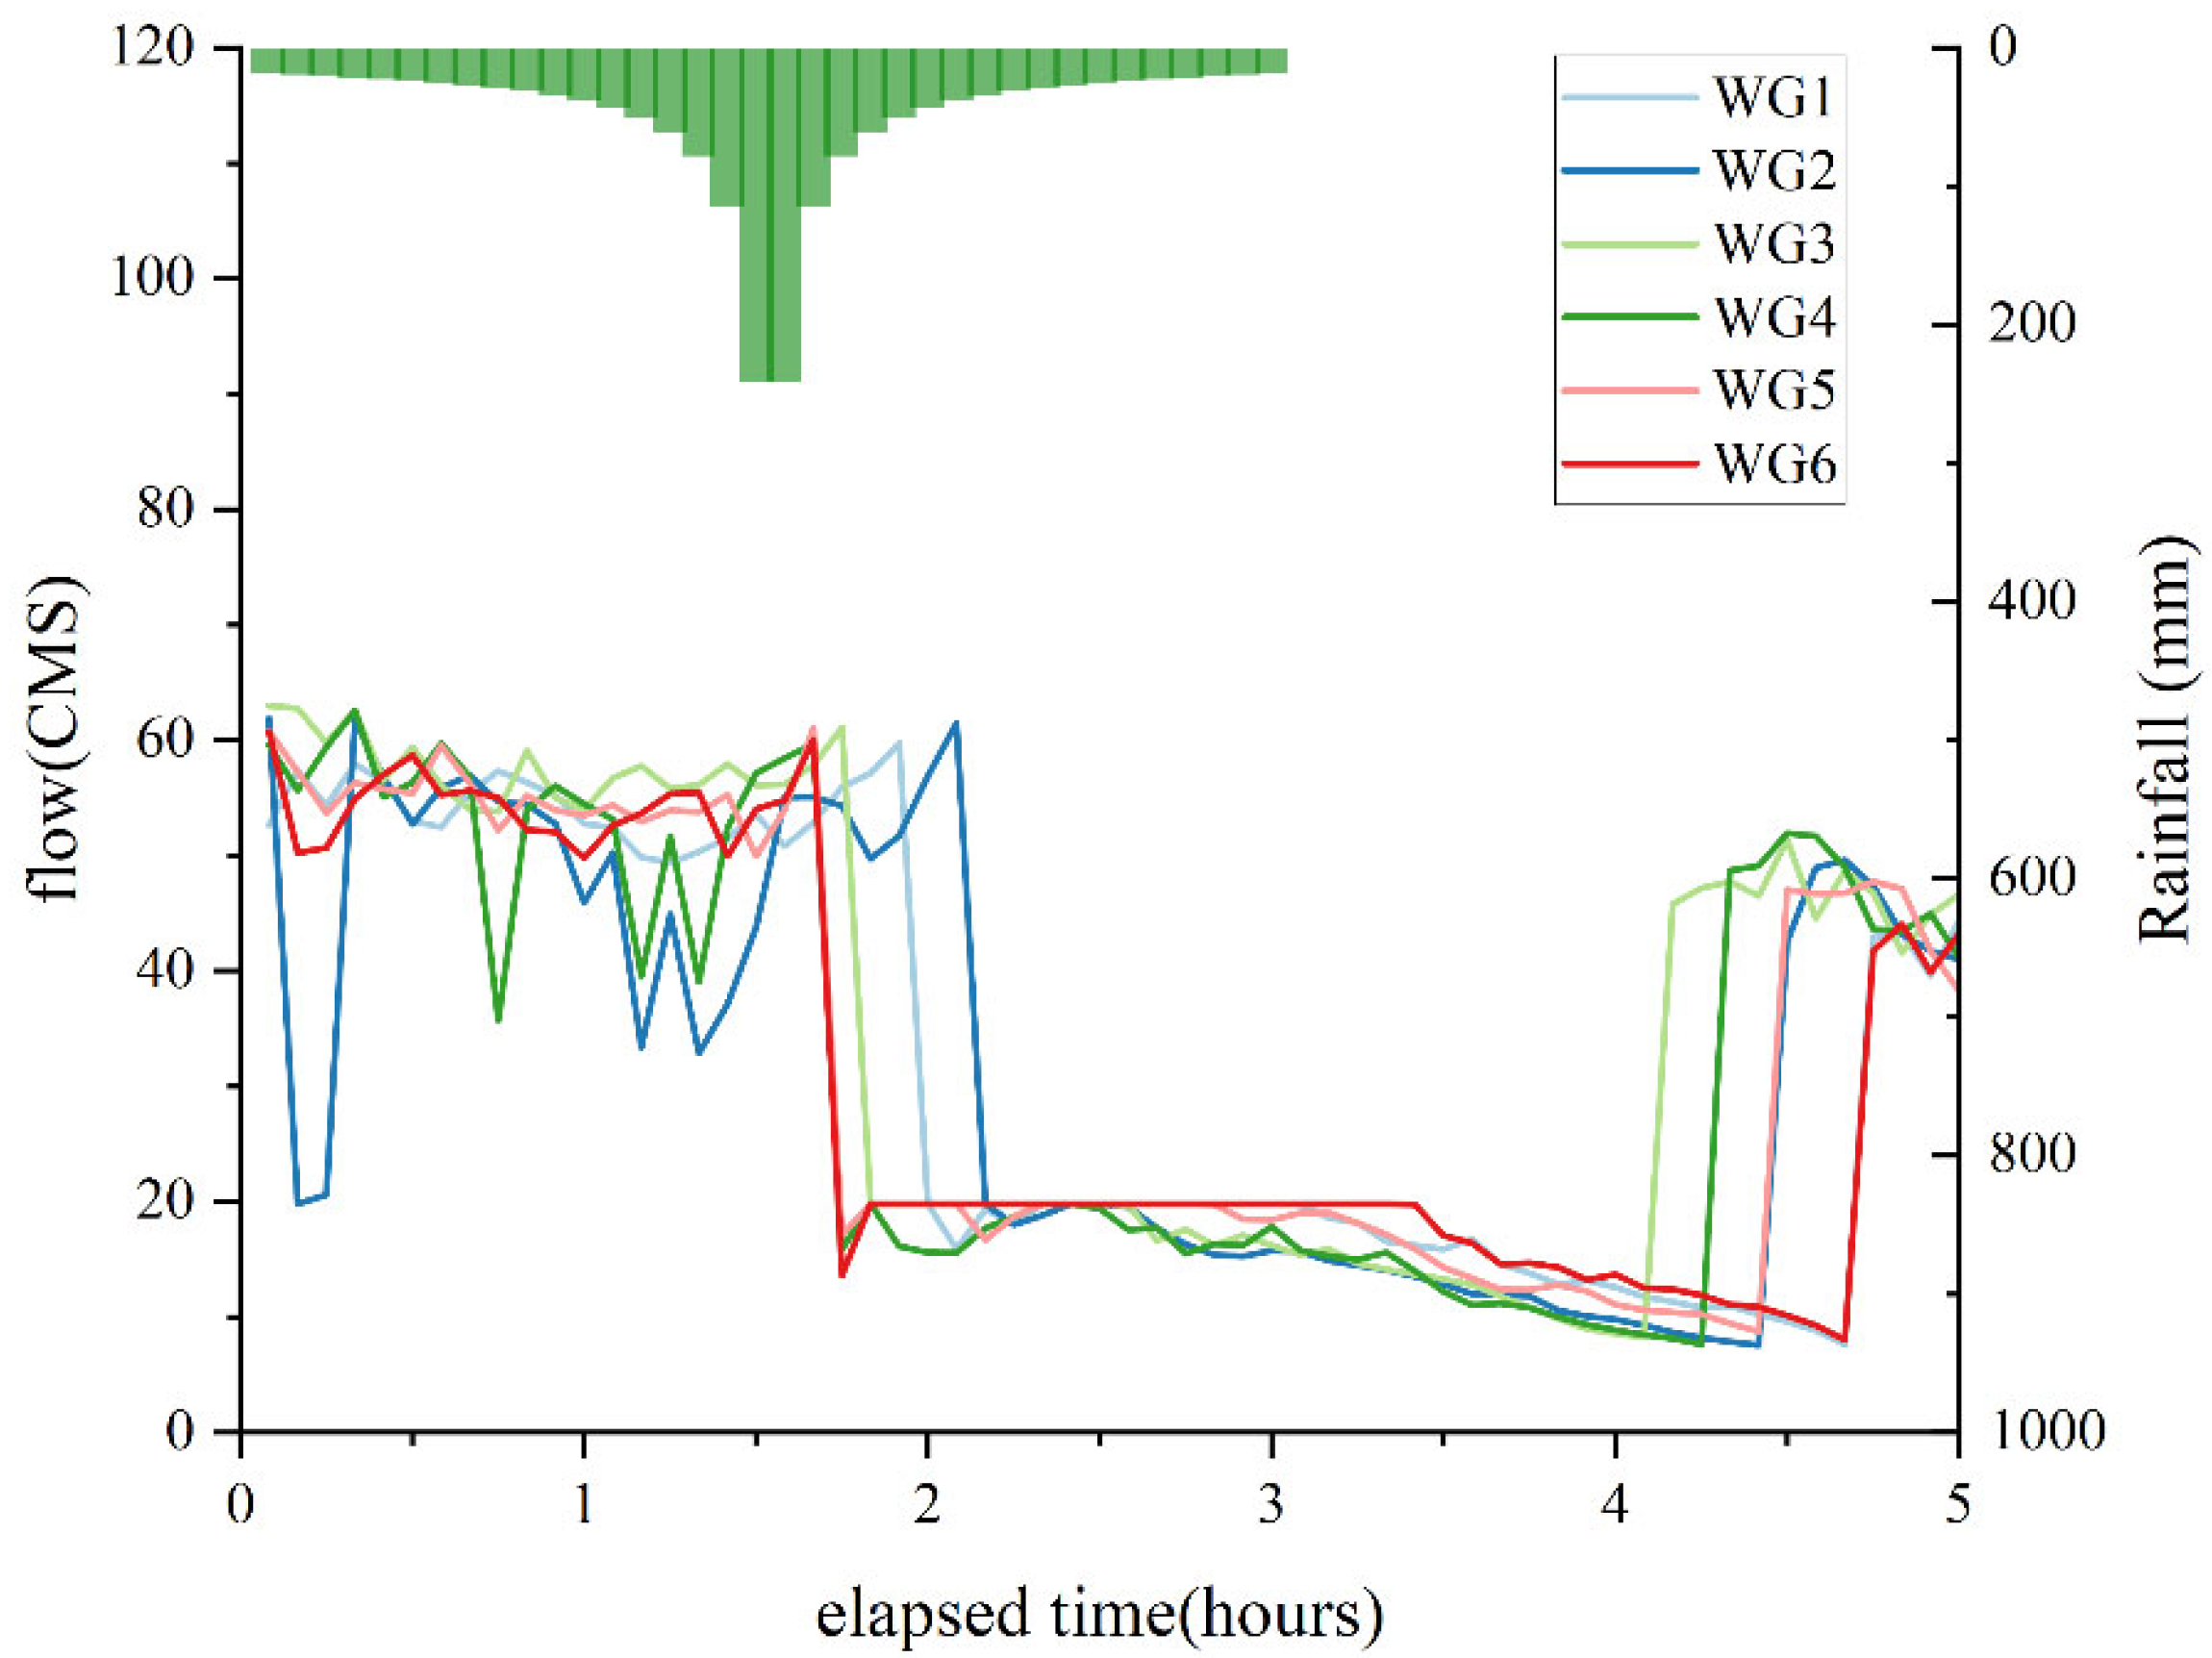
4.3. System Response Analysis Results of Water Gate Opening Degree Adjustment
4.4. Limitations and Future Research Directions
5. Conclusions
- (1)
- This study introduces a method for evaluating the storage and drainage capacities of upstream areas. The method classifies areas based on their capacities into three categories: strong water storage capacity, strong drainage capacity, and balanced storage and drainage capacities.
- (2)
- Through the CRSD strategy, both the unified control and independent control models significantly reduce the total overflow compared to the no-control model, improving the system’s resilience to urban waterlogging.
- (3)
- This study highlights that in areas with strong drainage capacity, setting a reasonable upper limit for gate openings is crucial, especially during high water levels.
- (4)
- The unified control model optimizes drainage coordination by increasing the drainage rate in the medium water level range and reducing it in the high water level range. This model excels in global coordination, making it ideal for situations with a low downstream overflow risk and a need for a balanced system performance.
- (5)
- The independent control model improves system efficiency by optimizing drainage performance in the medium water level range, where the effect of gate opening adjustments is most significant. To avoid excessive adjustments, the importance of setting reasonable upper and lower limits for gate openings is emphasized. This model is particularly suitable for systems that require prioritized control in key areas, such as downstream regions.
Author Contributions
Funding
Data Availability Statement
Conflicts of Interest
References
- O’Gorman, P.A. Precipitation Extremes under Climate Change. Curr. Clim. Change Rep. 2015, 1, 49–59. [Google Scholar] [CrossRef] [PubMed]
- Shiu, C.J.; Liu, S.C.; Fu, C.; Dai, A.; Sun, Y. How Much Do Precipitation Extremes Change in a Warming Climate? Geophys. Res. Lett. 2012, 39, L17707. [Google Scholar] [CrossRef]
- Yang, L.; Franzke, C.L.; Duan, W. Evaluation and Projections of Extreme Precipitation Using a Spatial Extremes Framework. Int. J. Climatol. 2023, 43, 3453–3475. [Google Scholar] [CrossRef]
- Zhang, D.-L. Rapid Urbanization and More Extreme Rainfall Events. Sci. Bull. 2020, 65, 516–518. [Google Scholar] [CrossRef] [PubMed]
- Zhou, X.; Bai, Z.; Yang, Y. Linking Trends in Urban Extreme Rainfall to Urban Flooding in China. Int. J. Climatol. 2017, 37, 4586–4593. [Google Scholar] [CrossRef]
- Yin, C.; Wang, J.; Yu, X.; Li, Y.; Yan, D.; Jian, S. Definition of Extreme Rainfall Events and Design of Rainfall Based on the Copula Function. Water Resour. Manag. 2022, 36, 3759–3778. [Google Scholar] [CrossRef]
- Deng, S.; Wu, Q.; Wang, Z.; Wu, L.; Huang, Z.; Zhang, G. Investigating Flood Characteristics and Mitigation Measures in Plain-Type River-Connected Lakes: A Case Study of Poyang Lake. Water 2024, 16, 281. [Google Scholar] [CrossRef]
- Kim, Y.; Newman, G. Climate Change Preparedness: Comparing Future Urban Growth and Flood Risk in Amsterdam and Houston. Sustainability 2019, 11, 1048. [Google Scholar] [CrossRef] [PubMed]
- Asselman, N.; de Jong, J.S.; Kroekenstoel, D.; Folkertsma, S. The Importance of Peak Attenuation for Flood Risk Management, Exemplified on the Meuse River, The Netherlands. Water Secur. 2022, 15, 100114. [Google Scholar] [CrossRef]
- Green, C.H.; Parker, D.J.; Tunstall, S.M. Assessment of Flood Control and Management Options; WCD Thematic Reviews; World Commission on Dams Secretariat: Cape Town, South Africa, 2000. [Google Scholar]
- Sayers, P.; Yuanyuan, L.; Galloway, G.; Penning-Rowsell, E.; Fuxin, S.; Kang, W.; Yiwei, C.; Le Quesne, T. Flood Risk Management: A Strategic Approach; Asian Development Bank, GIWP, UNESCO and WWF: London, UK, 2013. [Google Scholar]
- Fasahat, V.; Sadatinejad, S.J.; Honarbakhsh, A.; Samadi, B.H. Influence of Storage Dam Construction on Downstream Flood Reduction. J. Watershed Manag. Res. 2015, 5, 44–54. [Google Scholar]
- Wei, C.-C.; Hsu, N.-S. Optimal Tree-Based Release Rules for Real-Time Flood Control Operations on a Multipurpose Multireservoir System. J. Hydrol. 2009, 365, 213–224. [Google Scholar] [CrossRef]
- Volpi, E.; Di Lazzaro, M.; Bertola, M.; Viglione, A.; Fiori, A. Reservoir Effects on Flood Peak Discharge at the Catchment Scale. Water Resour. Res. 2018, 54, 9623–9636. [Google Scholar] [CrossRef]
- Zhou, C.; Sun, N.; Chen, L.; Ding, Y.; Zhou, J.; Zha, G.; Luo, G.; Dai, L.; Yang, X. Optimal Operation of Cascade Reservoirs for Flood Control of Multiple Areas Downstream: A Case Study in the Upper Yangtze River Basin. Water 2018, 10, 1250. [Google Scholar] [CrossRef]
- Zhu, D.; Mei, Y.; Xu, X.; Liu, Z.; Wu, Z.; Cai, H. Optimal Operation of a Parallel Multireservoir System for Flood Control Using a Stagewise Compensation Method. Water Resour. Manag. 2021, 35, 1689–1710. [Google Scholar] [CrossRef]
- Acheampong, J.N.; Gyamfi, C.; Arthur, E. Impacts of Retention Basins on Downstream Flood Peak Attenuation in the Odaw River Basin, Ghana. J. Hydrol. Reg. Stud. 2023, 47, 101364. [Google Scholar] [CrossRef]
- Wang, H.; Lei, X.; Wang, C.; Liao, W.; Kang, A.; Huang, H.; Ding, X.; Chen, Y.; Zhang, X. A Coordinated Drainage and Regulation Model of Urban Water Systems in China: A Case Study in Fuzhou City. River 2023, 2, 5–20. [Google Scholar] [CrossRef]
- Muroi, H.; Mine, K.; Eguchi, Y. Scenario Analysis of Sluice Gate Operations for Evaluating Inland Flood Damage. J. Disaster Res. 2021, 16, 429–436. [Google Scholar] [CrossRef]
- Mel, R.A.; Viero, D.P.; Carniello, L.; D’Alpaos, L. Optimal Floodgate Operation for River Flood Management: The Case Study of Padova (Italy). J. Hydrol. Reg. Stud. 2020, 30, 100702. [Google Scholar] [CrossRef]
- Zhang, H.; Liu, S.; Ye, J.; Yeh, P.J.-F. Model Simulations of Potential Contribution of the Proposed Huangpu Gate to Flood Control in the Lake Taihu Basin of China. Hydrol. Earth Syst. Sci. 2017, 21, 5339–5355. [Google Scholar] [CrossRef]


| Assessment Object | Indicator | Quantitative Method |
|---|---|---|
| Water Storage Capacity | existing water storage facilities | Calculate the storage capacity of the facility |
| greenfield infiltration | Where A is the urban green space area (m2); K is the infiltration capacity of the urban green space(m/s), with a K-value of 2.778 × 10⁻⁷ for Shanghai (m/s); Q is the infiltration volume of the urban green space(m3/s). | |
| water coverage | Use Geographic Information System (GIS) technology to perform regional statistics on all river networks in each city. | |
| impervious surface coverage | Impervious surface coverage was estimated from land use types with imperviousness coefficients of 0.1 for green space, 0.6 for residential, 0.8 for commercial, and 0.7 for cultural areas. | |
| Drainage Capacity | slope | ArcGIS 10.8 software was used to extract slopes from elevation raster data. |
| existing drainage facilities | The drainage capacity is quantified in cubic meters per second. | |
| river network density | Define river network density as the river’s total length ratio to the region’s area. |
| Assessment Object | Indicator | Weights |
|---|---|---|
| Regional Water Storage Capacity | greenfield infiltration | 0.27 |
| water coverage | 0.49 | |
| impervious surface coverage | 0.24 | |
| Regional Drainage Capacity | slope | 0.46 |
| river network density | 0.54 |
| Area I | Area II | Area III | Area IV | Area V | Area VI | |
|---|---|---|---|---|---|---|
| Area (km2) | 9.35 | 8.39 | 6.96 | 10.53 | 11.00 | 11.73 |
| Greenfield Infiltration (m3/s) | 1.33 | 1.07 | 0.79 | 0.72 | 1.01 | 0.90 |
| Water Surface Area (km2) | 0.85 | 0.88 | 0.82 | 0.82 | 1.08 | 1.03 |
| Impervious Surface Coverage (%) | 32.00 | 38.00 | 35.00 | 52.00 | 41.00 | 50.00 |
| Slope (°) | 0.36 | 0.58 | 0.64 | 0.85 | 1.06 | 0.69 |
| River Network Density (km/km2) | 1.07 | 1.18 | 1.30 | 1.06 | 1.21 | 0.99 |
| Water Storage Capacity (dimensionless) | 0.81 | 0.65 | 0.68 | 0.00 | 0.57 | 0.22 |
| Drainage Capacity (dimensionless) | 0.08 | 0.35 | 0.47 | 0.64 | 0.91 | 0.43 |
| Regional Storage and Drainage Capacity | strong water storage capacity | strong water storage capacity | comparable storage and drainage capacities | strong drainage capacity | strong drainage capacity | strong drainage capacity |
| Control Modes | Upstream Overflow (m3) | Downstream Overflow (m3) | Peak Overflow Rate (m3/s) | Total Overflow (m3) |
|---|---|---|---|---|
| no control | 812,926.96 | 3806.80 | 409.17 | 816,733.76 |
| unified control | 813,478.60 | 0.00 | 0.00 | 813,478.60 |
| independent control | 815,495.20 | 0.00 | 0.00 | 815,495.20 |
| Water Level Range (m) | 2.0–2.2 | 2.2–2.4 | 2.4–2.6 | 2.6–2.8 | 2.8–3.0 | 3.0–3.2 | 3.2–3.4 | ||
|---|---|---|---|---|---|---|---|---|---|
| Gate opening degree (%) | no control | WG1–WG6 | 100 | 100 | 100 | 100 | 100 | 100 | 100 |
| unified control | WG1–WG6 | 70 | 80 | 100 | 90 | 80 | 80 | 30 | |
| independent control | WG1 | 90 | 10 | 30 | 40 | 90 | 30 | 80 | |
| WG2 | 40 | 40 | 90 | 70 | 70 | 70 | 70 | ||
| WG3 | 80 | 20 | 90 | 90 | 50 | 70 | 60 | ||
| WG4 | 80 | 20 | 90 | 10 | 50 | 60 | 50 | ||
| WG5 | 100 | 90 | 90 | 80 | 100 | 40 | 60 | ||
| WG6 | 90 | 100 | 10 | 100 | 100 | 10 | 10 |
Disclaimer/Publisher’s Note: The statements, opinions and data contained in all publications are solely those of the individual author(s) and contributor(s) and not of MDPI and/or the editor(s). MDPI and/or the editor(s) disclaim responsibility for any injury to people or property resulting from any ideas, methods, instructions or products referred to in the content. |
© 2025 by the authors. Licensee MDPI, Basel, Switzerland. This article is an open access article distributed under the terms and conditions of the Creative Commons Attribution (CC BY) license (https://creativecommons.org/licenses/by/4.0/).
Share and Cite
Yang, L.; Zhang, Z.; Liu, Q.; Wang, Z. Optimizing the Coordinated Regulation of Storage and Discharge Across Regions in Plain City Under Extreme Rainfall Scenarios. Water 2025, 17, 1272. https://doi.org/10.3390/w17091272
Yang L, Zhang Z, Liu Q, Wang Z. Optimizing the Coordinated Regulation of Storage and Discharge Across Regions in Plain City Under Extreme Rainfall Scenarios. Water. 2025; 17(9):1272. https://doi.org/10.3390/w17091272
Chicago/Turabian StyleYang, Liangrui, Zhiming Zhang, Qianting Liu, and Zhe Wang. 2025. "Optimizing the Coordinated Regulation of Storage and Discharge Across Regions in Plain City Under Extreme Rainfall Scenarios" Water 17, no. 9: 1272. https://doi.org/10.3390/w17091272
APA StyleYang, L., Zhang, Z., Liu, Q., & Wang, Z. (2025). Optimizing the Coordinated Regulation of Storage and Discharge Across Regions in Plain City Under Extreme Rainfall Scenarios. Water, 17(9), 1272. https://doi.org/10.3390/w17091272