Article

Optimizing the Coordinated Regulation of Storage and Discharge Across Regions in Plain City Under Extreme Rainfall Scenarios

1
Department of Environment and Energy Engineering, Beijing University of Civil Engineering and Architecture, No. 1 Zhanlanguan Road, Beijing 100044, China
2
Beijing Climate Change Response Research and Education Center, School of Environment and Energy Engineering, Beijing University of Civil Engineering and Architecture, Beijing 100044, China
*
Author to whom correspondence should be addressed.
Water 2025, 17(9), 1272; https://doi.org/10.3390/w17091272
Submission received: 1 March 2025 / Revised: 15 April 2025 / Accepted: 22 April 2025 / Published: 24 April 2025
(This article belongs to the Section Urban Water Management)

Abstract

:
Under excessive rainfall conditions, achieving Coordinated Regulation of Storage and Discharge (CRSD) across different regions can effectively reduce the overall risk of urban flooding. This study proposes three water gate control modes: no control, unified control, and independent control, taking the Lingang New Area as a case study, based on the differences in regional storage and discharge capacities, and evaluating the effectiveness of the three control modes through the model. The results show that both the unified control and independent control models significantly outperform the no control model in terms of total overflow volume control. When compared to each other, the unified control model is more suitable for overall drainage coordination across the system, while the independent control model is better suited for prioritizing the protection of specific regions, emphasizing the importance of identifying gate response thresholds.

1. Introduction

As a result of the combined effects of climate change and urbanization, an increasing frequency of rainfall is exceeding the design capacity of urban drainage systems [1,2,3,4,5], leading to excessive rainfall events [6]. Due to the flat terrain of plain cities, stormwater drainage is slow, and the water levels in drainage channels are prone to create backflow effects, which can lead to prolonged water accumulation [7]. For example, in July 2012, an extreme rainfall of 541 mm in Beijing caused 79 deaths and economic losses of USD 1.6 billion. In 2017, Hurricane Harvey brought over 1000 mm of rainfall to Houston, leading to the flooding of more than 300,000 infrastructure sites and economic losses exceeding USD 125 billion [8].
To efficiently utilize existing drainage infrastructure, peak flow management of different tributaries upstream is an important method for reducing excessive runoff in downstream areas. Unorganized drainage can lead to significant runoff aggregation, exacerbating flood risks and causing substantial damage [9]. Achieving peak flow offset through regional CRSD is an important method [10]. This can be accomplished through both engineering and non-engineering measures [11], such as using storage facilities to control flow and mitigate the risks posed by flood peaks [12,13]. Numerous studies have demonstrated that coordinated storage and discharge can effectively enhance the overall efficiency of drainage systems [14,15,16,17].
In these studies, proper gate operations in river networks can effectively distribute runoff loads, alleviate local flooding pressure, and reduce flood risks. Existing research by Wang applies Model Predictive Control (MPC) technology to develop a real-time flood scheduling model aimed at optimizing water system operations in Fuzhou. The method significantly reduced the peak river water levels, demonstrating the effectiveness of the coordinated system in flood risk management [18]; Muroi used InfoWorks to analyze the impact of gate operations on flooding, emphasizing that real-time optimization through water level monitoring and pump station coordination can effectively improve system operational efficiency [19]; Mel proposed an optimized gate operation scheme for the Voltabarozzo control structures, focusing on enhancing the responsiveness and flexibility of the drainage system [20]; Zhang investigated the potential contribution of gate operations in the Huangpu River to flood control in the Taihu Basin, proposing various gate operation rules to optimize flood protection [21]. Although the above studies achieved positive results in different regions, there are still some shortcomings from a systematic evaluation perspective. Existing research mainly focuses on specific watersheds or urban case studies, which limits the applicability and generalizability of the methods. Furthermore, most of the existing literature concentrates on large-scale scheduling optimization for watersheds or river systems, lacking studies on medium and small-scale CRSD within urban areas. Urban areas face more complex land use patterns, and more limited infrastructure space, thus requiring more refined scheduling strategies. Based on this, this study aims to conduct a systematic investigation into medium and small-scale CRSD systems in plain cities.
To investigate the applicability of different CRSD modes for small-scale areas, the study proposes three water gate control modes: no control, unified control, and independent control. Using the water system of Shanghai’s Lingang New Area as a case study, the effectiveness of these control modes is evaluated through a model. The reliability of the independent control mode in practical applications is studied based on the storage and discharge characteristics of different regions. The aim is to improve regional runoff organization efficiency, reduce the risks brought by excessive rainfall, and provide a reference for drainage system management in plain cities under extreme climate conditions.

2. Study Area and Data Sources

2.1. Study Area

The study area, centered on Dishui Lake, which covers 5.6 km2, is a typical plain region located in the Lingang Special Area of Shanghai, China, with a planned area of 67.8 km2, as shown in Figure 1. The average annual rainfall is 1200.0 mm, with the maximum recorded at 1330.4 mm in 1959. The area features flat terrain, with a dense network of rivers and well-developed waterways that perform crucial water collection and storage functions. The entire study area is enclosed by dikes, forming a polder. The rainwater is channeled into the surrounding rivers through a diversion drainage system and eventually flows into the East Sea via the harbor located at the junction of Areas II and III on the southeastern side. The inflow and outflow of water within the polder are regulated by the sea discharge gates. Figure 1 shows the region’s hydrological zoning. Area VII is classified as a strong drainage area and is excluded from this study due to its distinct water flow control, which differs significantly from the natural drainage processes in other areas.

2.2. Data Collection

The data used in this study primarily include (1) The Digital Elevation Model (DEM) data, sourced from the Geospatial Data Cloud website (http://www.gscloud.cn/), has a resolution of 30 m. (2) Land use data: As the study area is still under development, this study adopts the planning data from the “Shanghai Nanhui New City Water Affairs Plan (2022–2035)”. (3) Drainage network data: Due to the unavailability of drainage network data, and to ensure the smooth calculation of the simulation, the design is based on the layout of the main roads within the study area, using a 5-year return period standard.

3. Methods

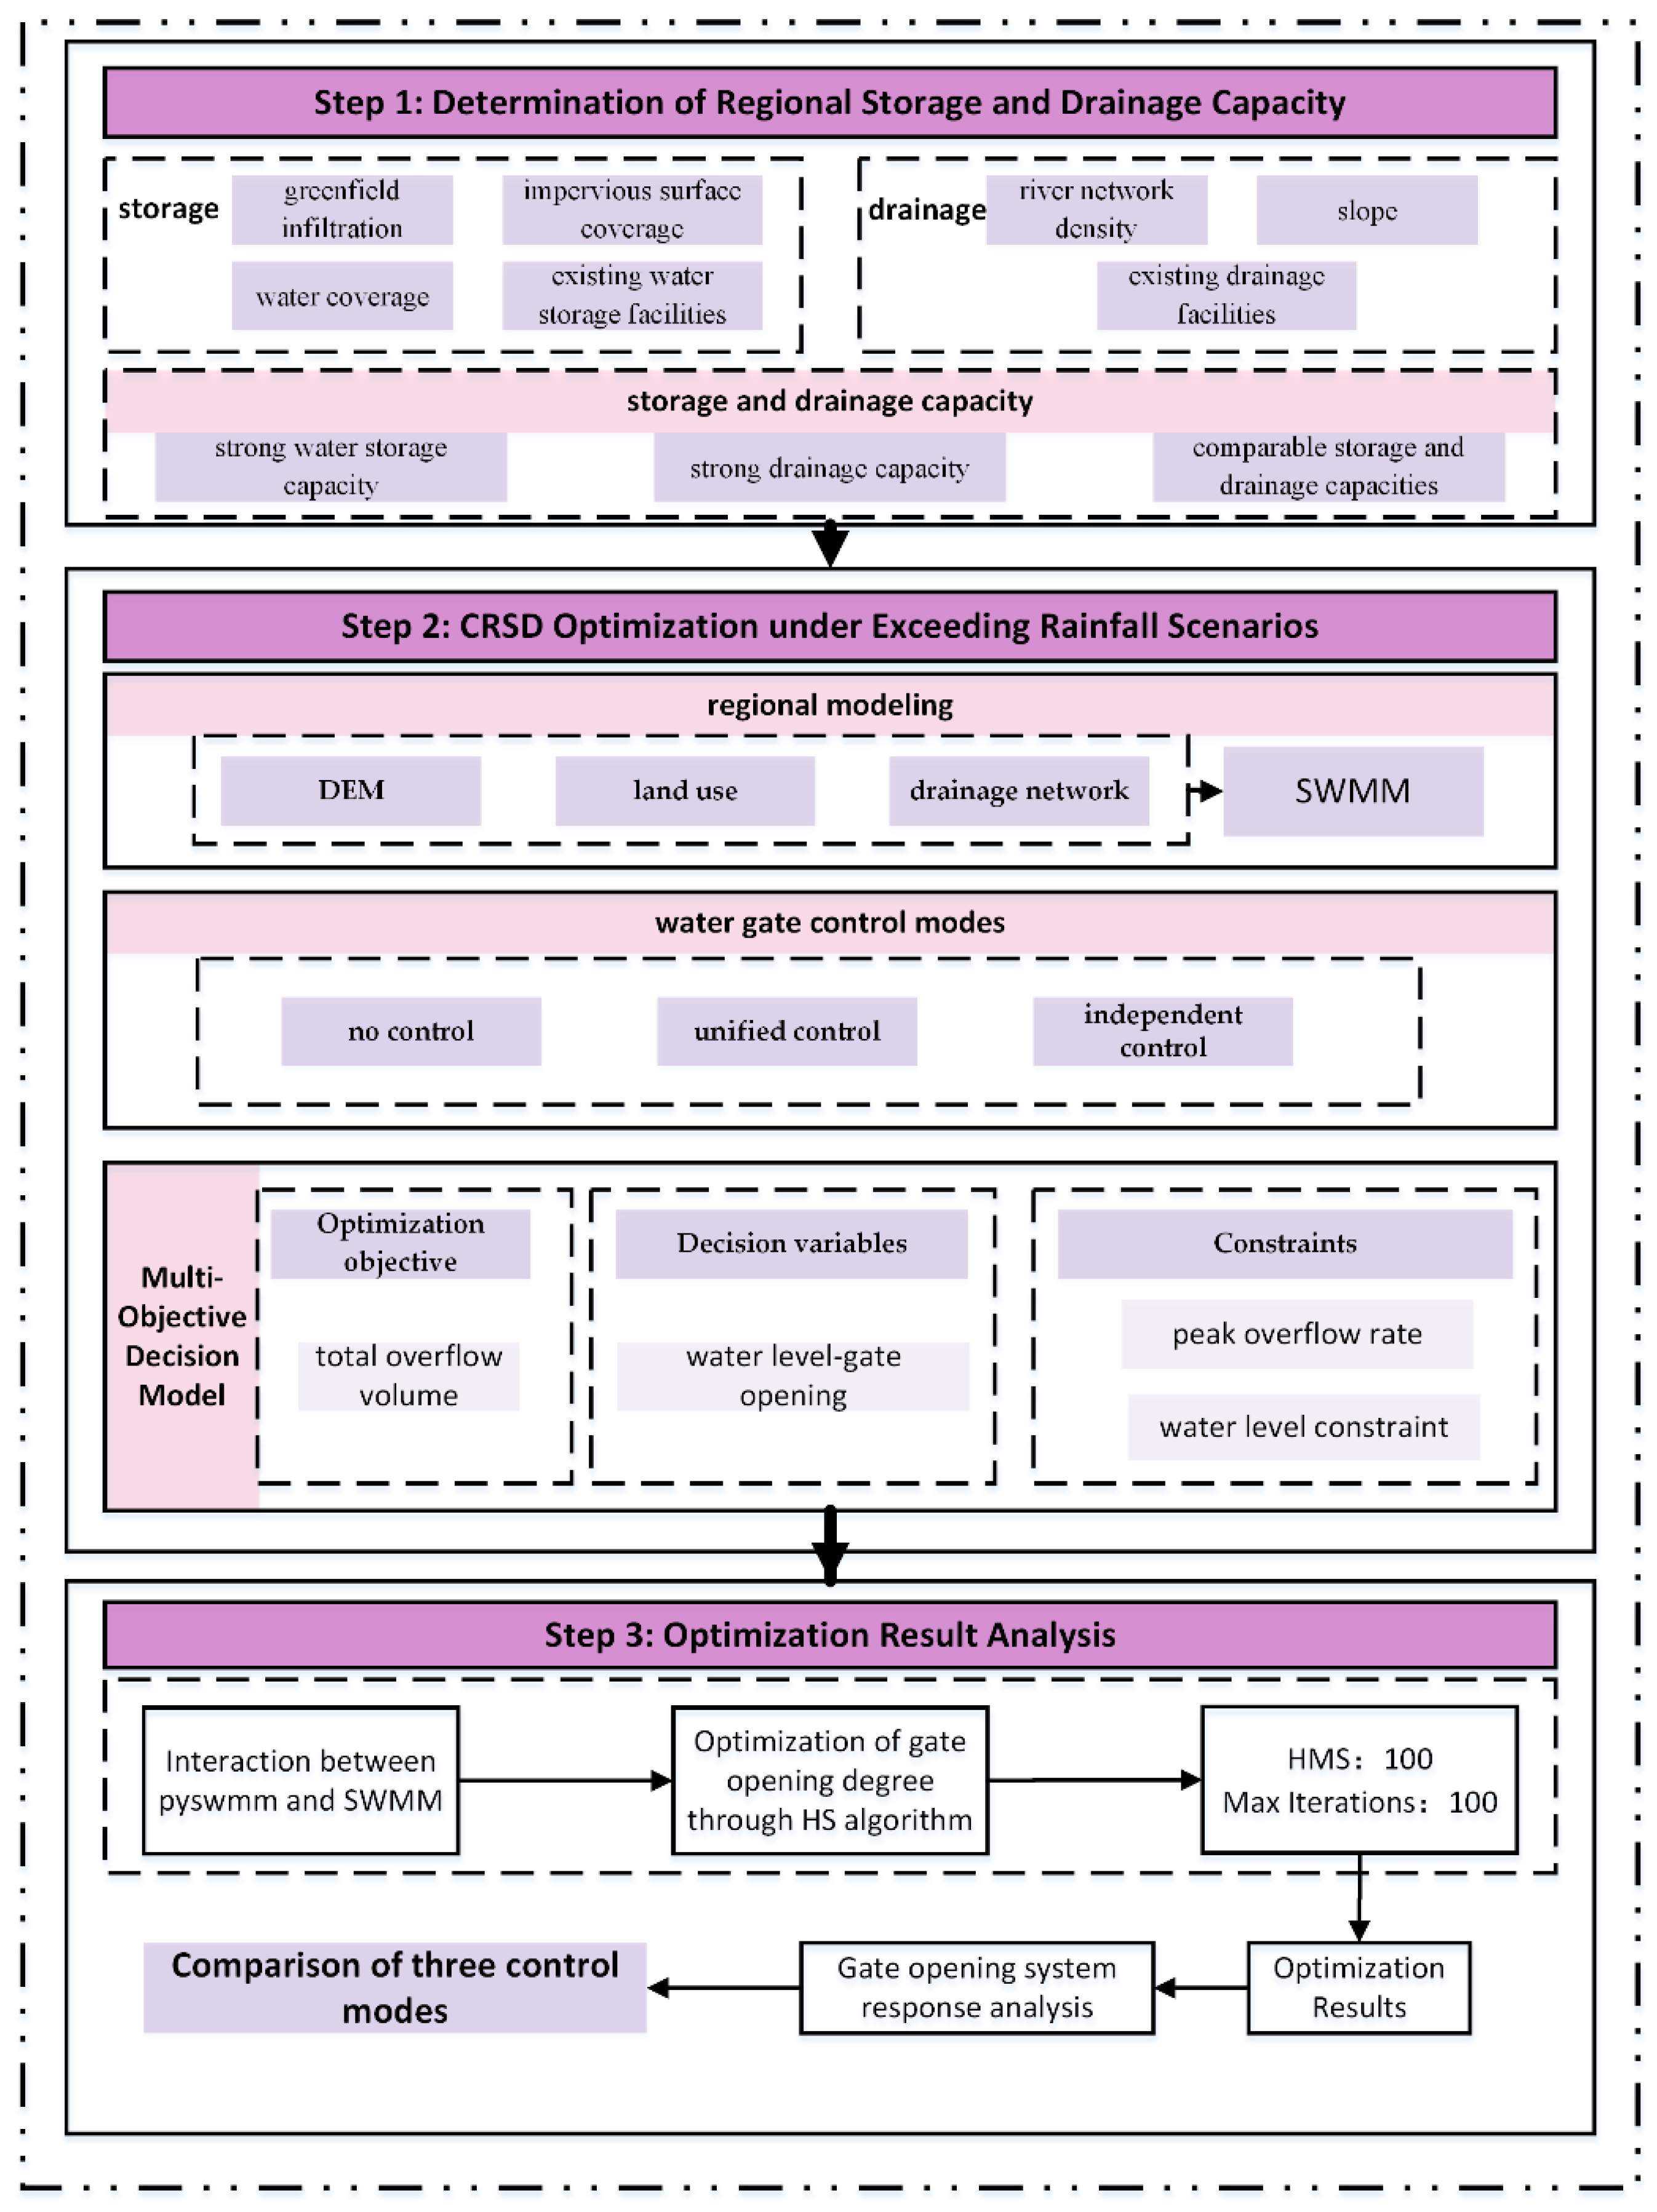
The methodology used in this study for CRSD is divided into three steps: (1) First, an indicator system is established to assess the storage and discharge capacity of each region. (2) Based on the Storm Water Management Model (SWMM) 5.1 model, an optimization model for coordinated storage–discharge regulation is developed for each region under extreme rainfall scenarios. (3) Based on the decision results, the effectiveness of three operational models for regulating gate operation under extreme rainfall scenarios is analyzed. The specific technical roadmap is shown in Figure 2.

3.1. Assessment of Storage and Drainage Capacity

This study constructed an evaluation indicator system to assess the differences in storage and drainage capacity across different regions, aiming to adjust gate control strategies more effectively. The regional storage and drainage potential is influenced by various factors, including existing storage and drainage facilities, green-blue spaces, terrain slope, river network density, and others. The relevant indicators involved in the assessment and their quantification methods are presented in Table 1.
The entropy weight method is employed for objective weighting, as it minimizes subjective bias and provides a more data-driven approach to represent the information within the data. Compared to the Analytic Hierarchy Process (AHP), the advantage of the entropy weight method lies in its complete reliance on data, eliminating the need for expert judgment and avoiding the subjectivity inherent in the pairwise comparisons of the AHP. For multi-criteria comprehensive evaluation, the Technique for Order of Preference by Similarity to Ideal Solution (TOPSIS) method is applied. The regional capacity is classified using Equation (1), distinguishing between areas with strong water storage capacity, strong drainage capacity, or comparable storage and drainage capacities.
c i 1 > k c i 2     s t r o n g   w a t e r   s t o r a g e   c a p a c i t y c i 2 > k c i 1     s t r o n g   d r a i n a g e   c a p a c i t y w h e n   c i 1 k c i 2   a n d   c i 2 k c i 1     c o m p a r a b l e   s t o r a g e   a n d   d r a i n a g e   c a p a c i t i e s
where ci1 represents the comprehensive score of the region’s water storage capacity; ci2 represents the comprehensive score of the region’s drainage capacity; and k is set to 1.5.

3.2. Optimization of CRSD Under Extreme Rainfall Scenarios

3.2.1. Water Gate Control Modes

To study and compare the effects of different control modes for CRSD, this paper establishes three operational models for regulating gate operation: no control, unified control, and independent control.
The no control model serves as the baseline, assuming the gate is always fully open at 100%, without control rules. When the water level reaches the bottom edge of the gate, it automatically discharges water, disregarding current hydrological conditions or inflow changes. This model is characterized by its simple operation, with drainage entirely dependent on natural free-flow conditions.
The unified control model assumes that all gates share a set of water level-opening degree rules, meaning that the opening degree of all gates is determined by the same function f(W). This implies that when the water level reaches a specific range, all gates will operate according to the opening degree corresponding to that range. Therefore, the key feature of the unified control model is that the operating rules of all gates are completely consistent, and the system achieves global coordinated control through the optimization of this shared rule, simplifying the complexity of gate operations. The control logic of the model can be expressed as:
G i = f ( W )     i = 1 , 2 , 3 m
where Gi is the gate opening degree; W is the water level at the node; and f(W) is the globally shared water level-opening degree control rule.
The independent control model assumes that each gate operates under its own water level-opening degree rules. Unlike the unified control model, each gate adjusts its opening degree based on distinct control rules tailored to its specific characteristics. This flexibility allows each gate to define control rules according to area hydrological conditions. The control logic of this model can be expressed as:
G i = f i ( W i )       i = 1 , 2 , 3 m
f i ( W i ) f j ( W j )   when   i j
where Gi is the opening degree of the i-th gate; Wi is the water level at the i-th node; and fi(Wi) is the independent control rule of the gate, with different control rules for each gate.

3.2.2. Regional Modeling

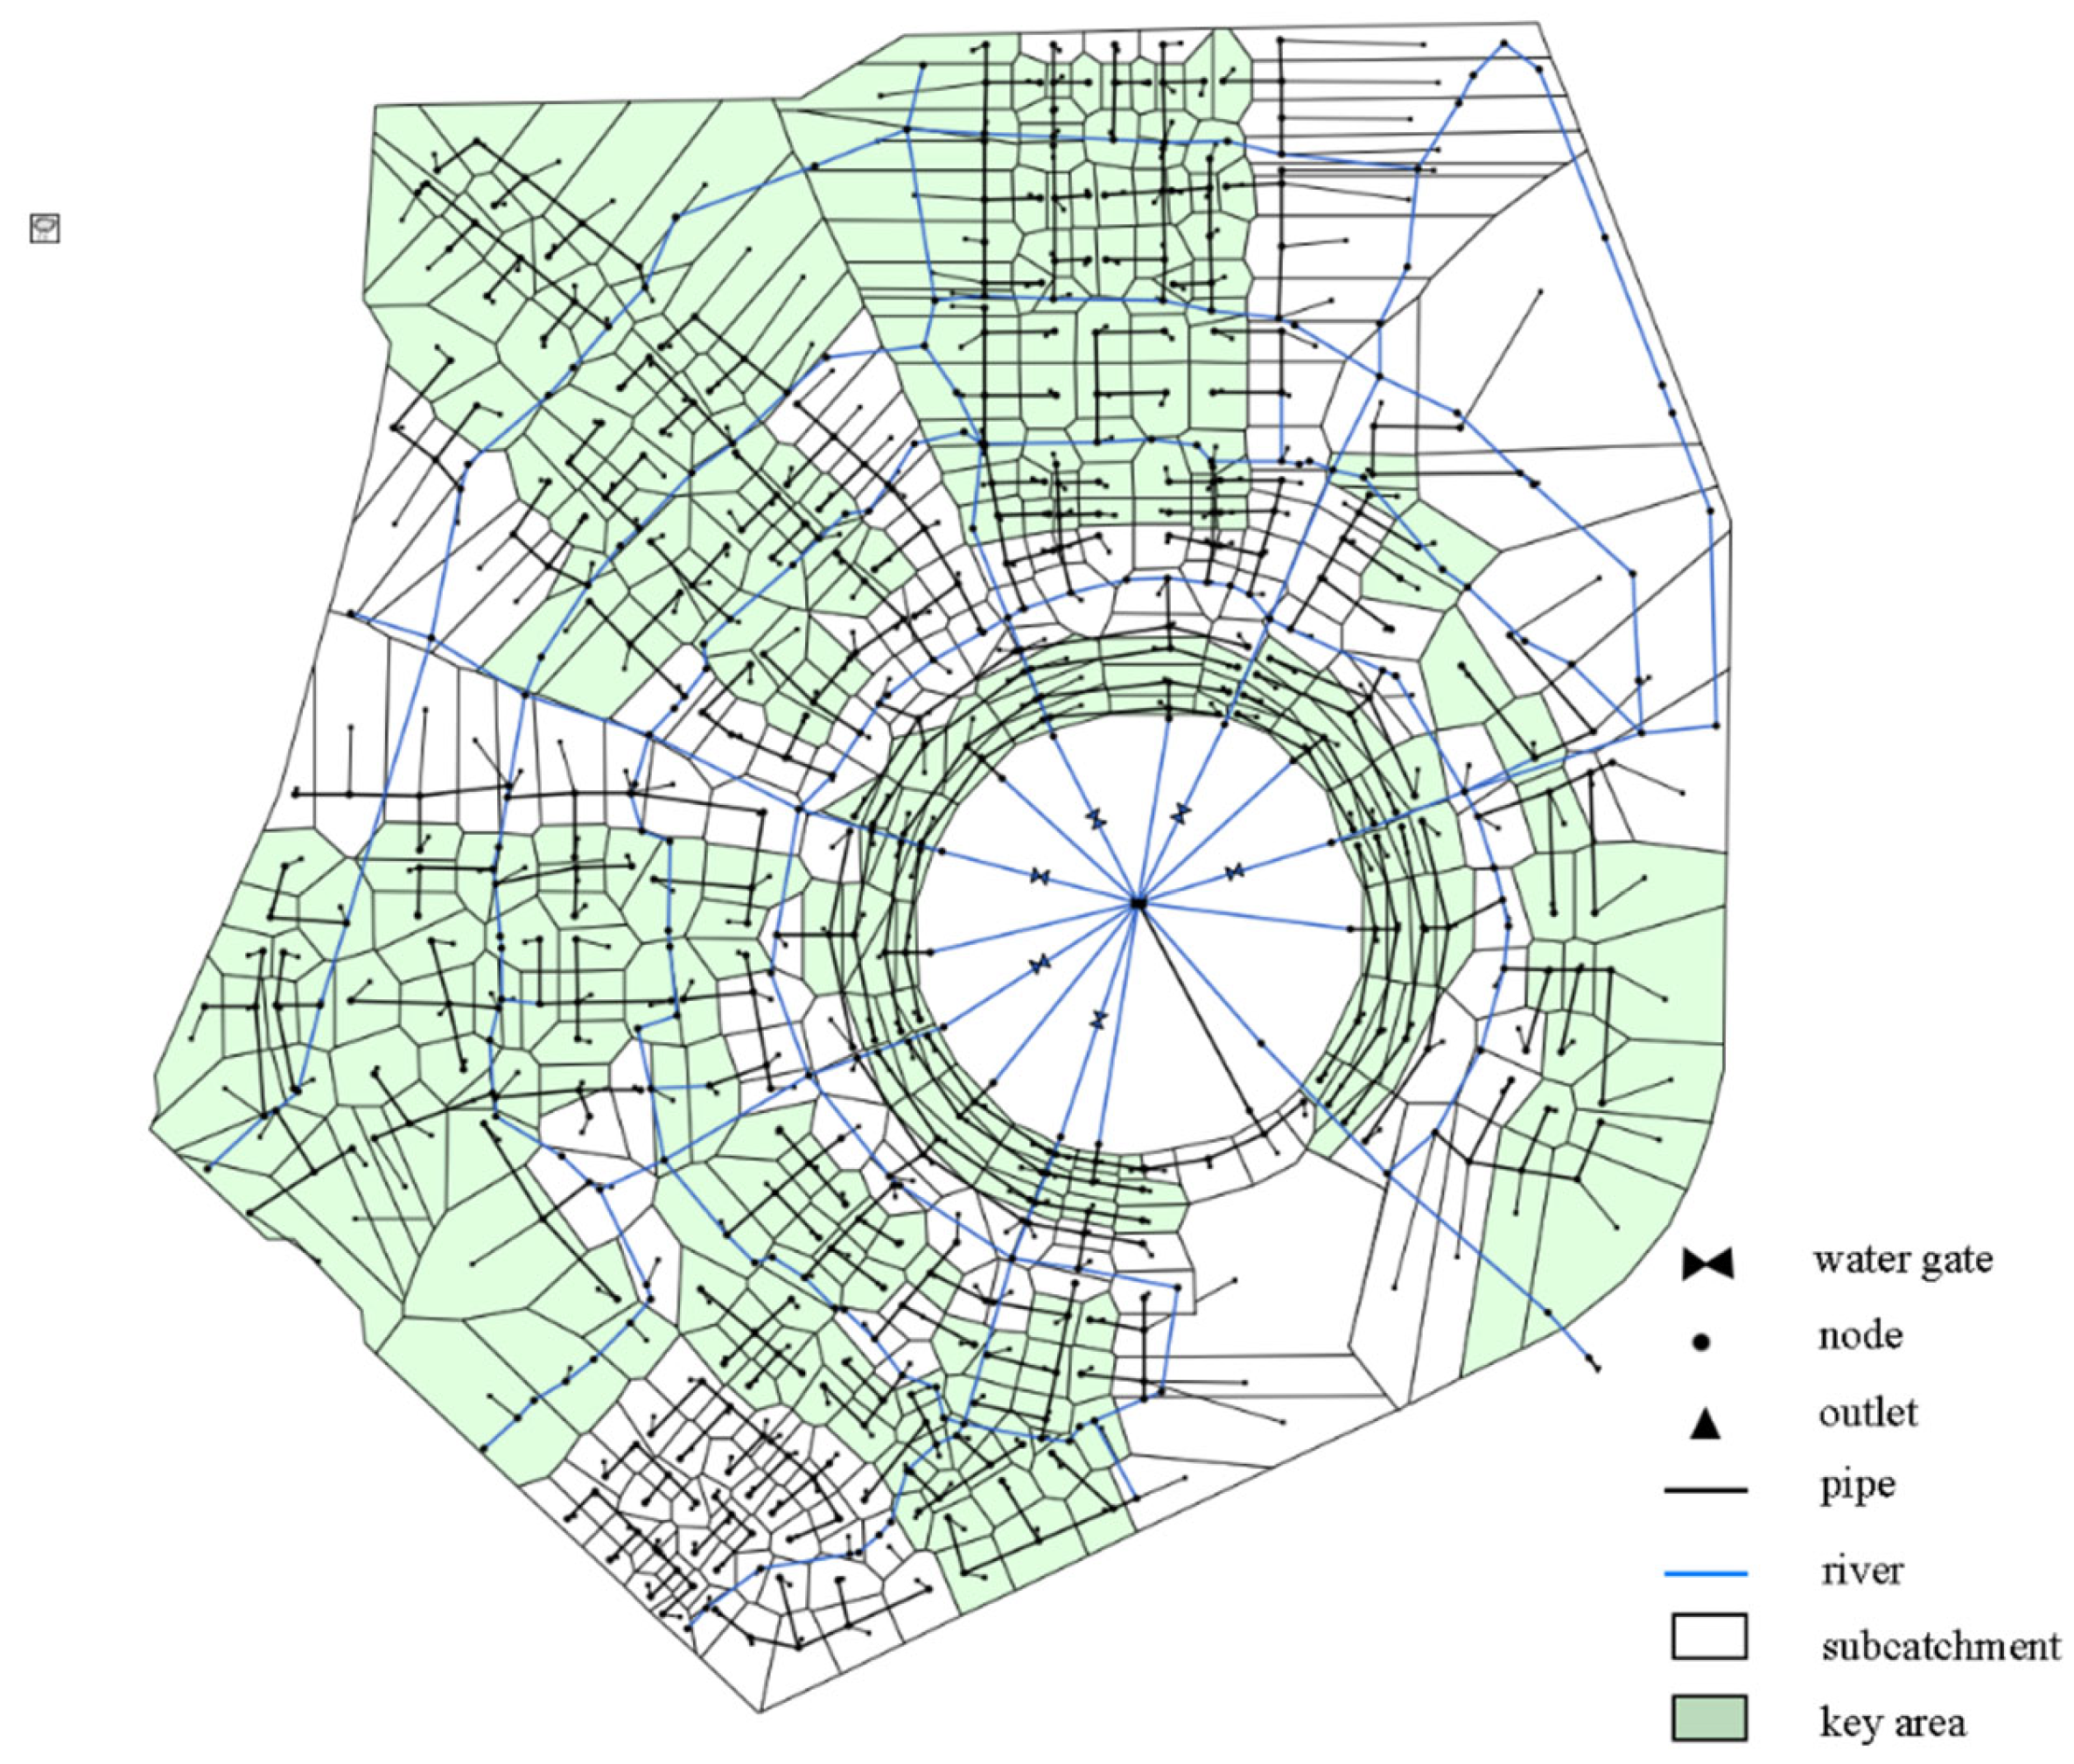
In the SWMM model, the drainage network of the study area includes 411 pipes and 428 inspection wells. The river system was represented by 204 river pipes and 222 river nodes, with the river cross-sections simplified as open channels. Dishui Lake was modeled as a 16.2 million retention basin capacity reservoir. The 498 sub-catchments were delineated using Thiessen polygons, considering the actual topography, land use, and drainage design. Based on subsurface types, land use is categorized into green spaces, residential areas, commercial areas, and cultural sites, with respective runoff coefficients of 0.20, 0.75, 0.70, and 0.72. The generalized results are modeled in Figure 3.
Rainfall data are generated using the Chicago rainfall pattern, with the Shanghai storm formula shown in Equation (5). The scenario analysis selects the 3-h precipitation for a 100-year return period (100 a, 3 h).
q = 1600 ( 1 + 0.846 lg P ) ( t + 7.0 ) 0.656

3.2.3. Water Gate Operation Optimization

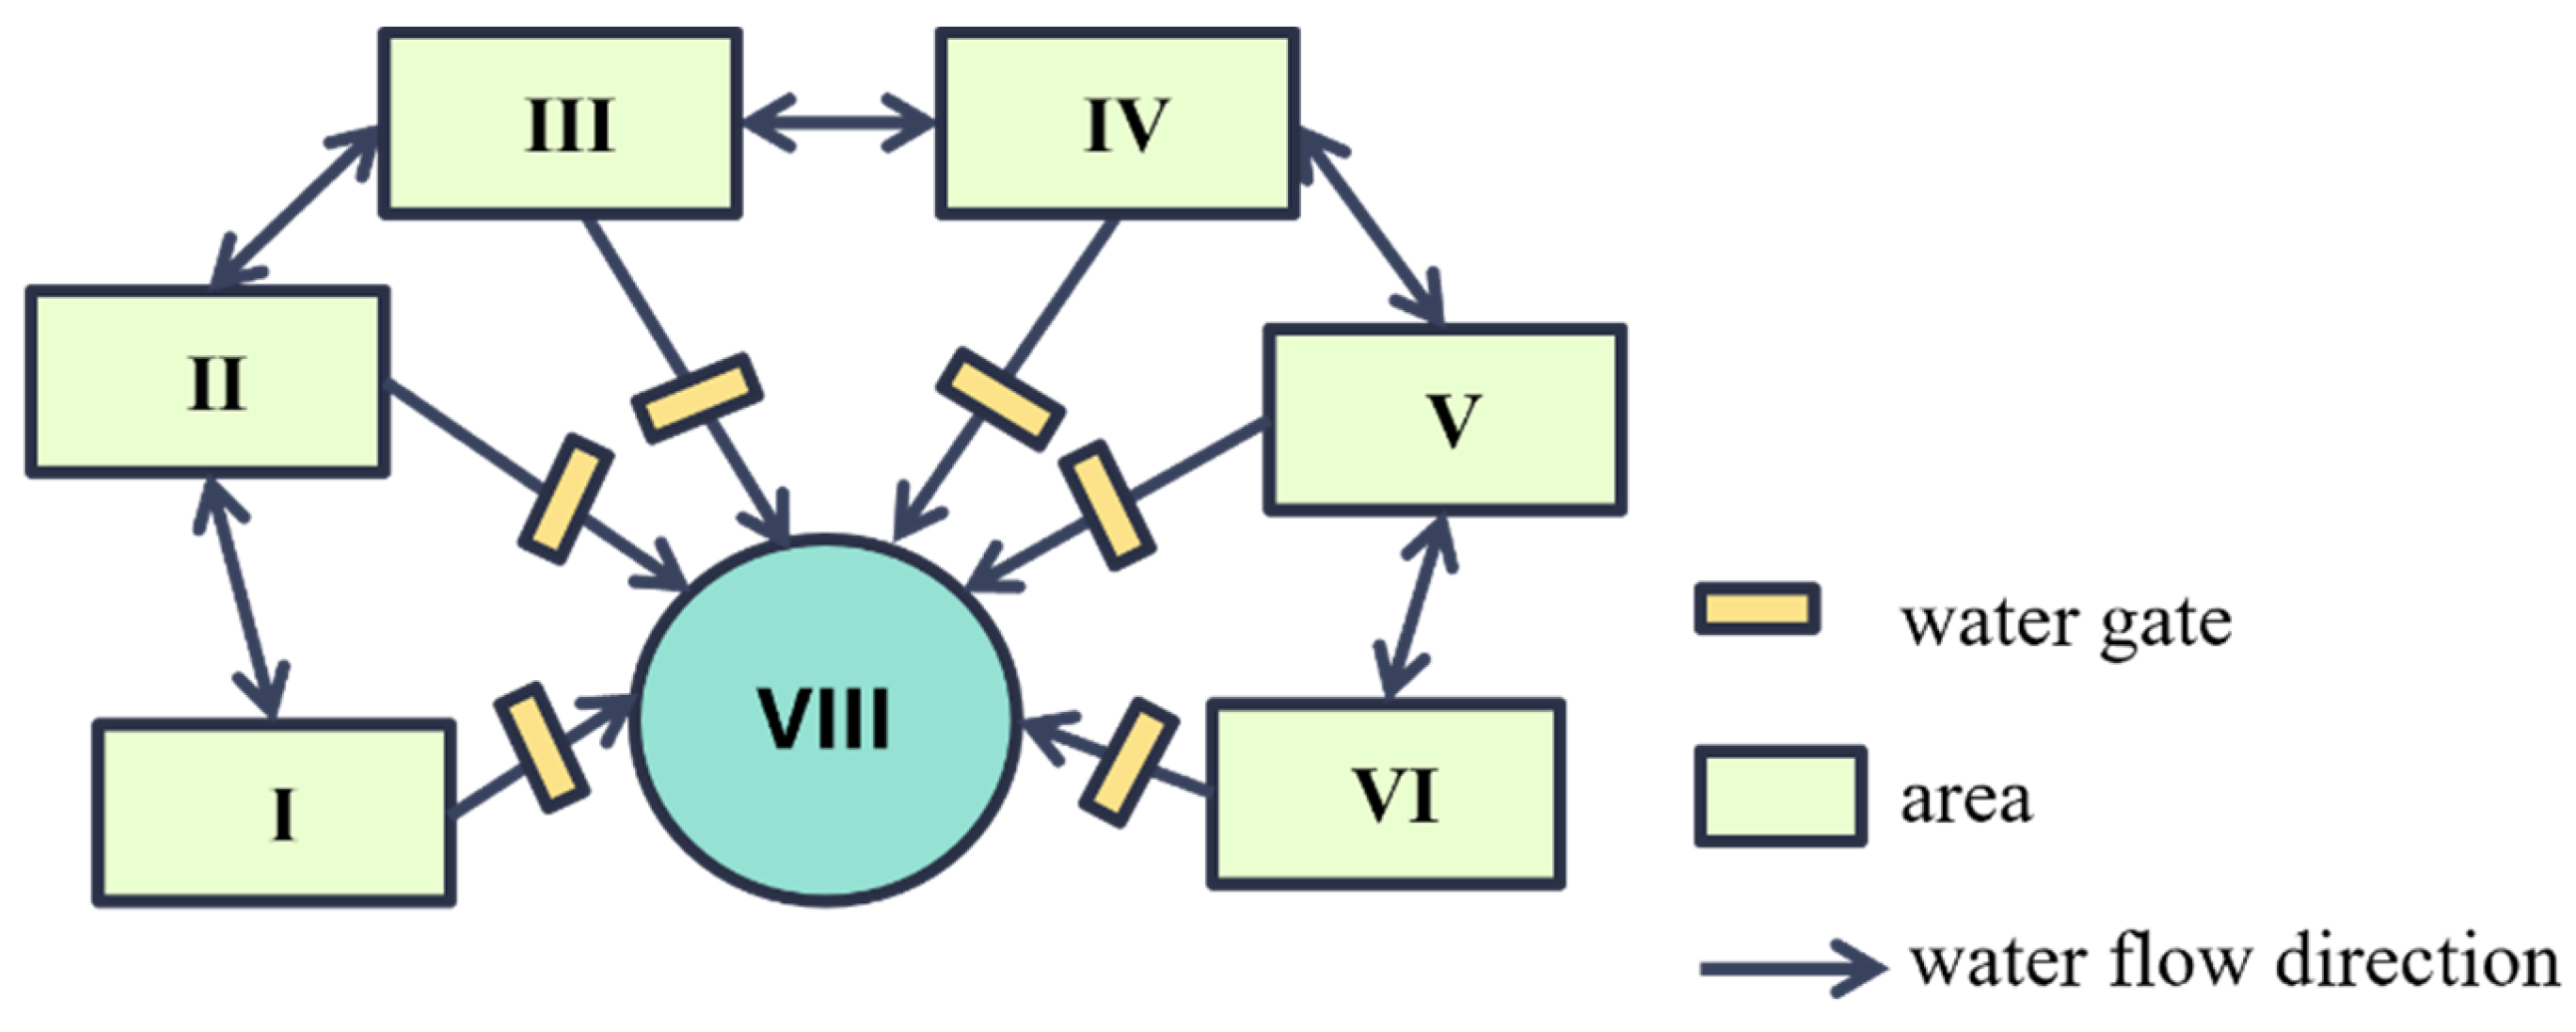
The schematic map of the study area, as shown in Figure 4, concisely illustrates the hydrological connectivity between the subareas. In particular, Areas I through VI are interconnected by water systems, allowing them to share runoff. Floodwaters exceeding the carrying capacity of one area can be diverted to areas with available capacity. Ultimately, all the runoff is discharged through the river into the downstream area (Area VIII).
To control the orderly storage and drainage in each area, Water Gate 1 (WG1), Water Gate 2 (WG2), Water Gate 3 (WG3), Water Gate 4 (WG4), Water Gate 5 (WG5), and Water Gate 6 (WG6) are proposed to be installed along the route leading to Dishui Lake, with specific locations shown in Figure 4. Each water gate can regulate the timing of runoff from its respective area into the downstream Dishui Lake.

Optimization Objective

To mitigate flood risk in the study area and improve the drainage system’s regulation capacity, this paper minimizes the total regional overflow as the objective function, balancing the flooding risks of upstream key areas and downstream regions. The optimization objective function is defined as follows:
F = F 1 + F 2
where F is the total overflow volume; F1 represents the total overflow volume at upstream key nodes; and F2 represents the total overflow volume in the downstream area.
(1)
Upstream overflow
During a rainfall event, node overflow occurs when the flow of rainwater into the drainage system through inspection wells exceeds the downstream pipeline’s carrying capacity. To assess the degree of flooding in the six areas, we set the total overflow volume at key nodes in upstream areas I–VI as the optimization objective F 1 . These key nodes are primarily located in critical functional zones that require protection, including residential areas, commercial districts, and cultural sites, as shown in Figure 3.
F 1 = i = 1 N J Q i
where Qi is the overflow volume at the i-th node; and NJ is the total number of key nodes in the study area.
(2)
Downstream overflow
F 2 = Q d o w n
where Qdown is the total overflow volume in the downstream area. This indicator reflects the drainage capacity and flooding risk in the downstream area under rainfall conditions.

Constraints

(1)
Peak overflow rate
Under extreme rainfall, it is crucial to maintain controlled water levels in Area VIII to protect infrastructure and ensure safety. The peak overflow rate in the downstream area (Area VIII) is used as the constraint, representing the scenario where water exceeds its maximum possible capacity.
Q max 30
where Qmax is the maximum overflow volume at Dishui Lake in the downstream area, m3/s.
(2)
Water level constraint
0 h t H max
where ht is the river water level; and Hmax is the maximum river water level.

Decision Variables

The normal water level of the rivers around Shanghai Lingang Old Town (the study area) is 2.6 m, with actual water levels typically fluctuating between 2.0 m and 3.75 m. The range of 2.0 m to 3.4 m covers most water level situations, including low levels and those approaching the extreme high of 3.4 m. Therefore, the range of water levels at the upstream nodes of the six gates (WG1–WG6) is determined to be between 2.0 m and 3.4 m. The water level interval step size is 0.2 m, meaning that each 0.2 m change triggers a new control strategy for the gates. The water levels are divided into seven discrete intervals as follows:
W = 2.0 , 2.2 , 2.2 , 2.4 , 2.4 , 2.6 , 2.6 , 2.8 , 2.8 , 3.0 , 3.0 , 3.2 , 3.2 , 3.4
where W represents the water level range.
Under unified control, all gates are governed by a single set of water level-gate opening control rules. The optimization variables are defined as the gate openings corresponding to each water level interval:
X = G j G j 0 , 0.1 , 0.2 , 1.0 , j = 1 , 2 7
where Gj represents the gate opening degree corresponding to the j-th water level range.
Under the independent control, each gate is governed by its own water level-gate opening control rule. The optimization variables are defined as the gate openings of each gate for each water level interval:
X = G i , j G i , j 0 , 0.1 , 0.2 1.0 , i = 1 , 2 6 ; j = 1 , 2 7
where Gi,j represents the gate opening degree of the i-th gate under the j-th water level range.

Computational Experiment

Since the optimization model is actually a Mixed Integer Nonlinear Programming (MINLP) problem, which is difficult to solve using gradient-based techniques, the Harmony Search (HS) algorithm, as a well-known meta-heuristic algorithm, is a suitable choice. The HS algorithm does not rely on gradient information and can effectively handle complex optimization problems that involve nonlinear equations and discrete decision variables. Compared to other evolutionary algorithms, such as Genetic Algorithm (GA), the HS algorithm generates new solutions through a Harmony Memory Consideration Rate (HMCR) and Pitch Adjustment Rate (PAR), which allow for a more comprehensive exploration of the solution space and improve optimization efficiency. In the 100-year scenario, the Harmony Search (HS) algorithm is used to optimize the water levels and gate openings. The HS algorithm constructs a Harmony Memory (HM) and generates new solutions through three core operations: memory consideration, pitch adjustment, and random generation. After a series of trial runs, suitable parameter values were determined. Key parameters include a Harmony Memory Size of 100, a Harmony Memory Consideration Rate of 0.9, a Pitch Adjustment Rate of 0.3, and a maximum of 100 iterations. Each iteration generates 100 candidate solutions, which are evaluated using the Storm Water Management Model (SWMM) to calculate objective function values. This results in 10,000 SWMM simulations per 24-h decision cycle. With a 5-min simulation time step to resolve hydrological and hydraulic dynamics, the HS algorithm iteratively refines solutions by updating the Harmony Memory until converging on the optimal control strategy.

3.2.4. System Response Analysis of Gate Opening Degree Adjustment

To further analyze the impact of water level intervals on optimization results, this study conducts a sensitivity analysis of gate opening degrees based on a single water level interval, using the optimization results from the independent control model. The analysis focuses on adjusting the settings of each water level interval to investigate their effect on the objective function values. Additionally, it quantifies the coupling relationship between water level interval parameters and gate strategies. Specifically, the study first fixes the other parameters of the optimal strategy and then gradually adjusts the opening degree of a specific gate within a particular water level interval, testing system performance under each variation.

4. Results and Discussion

4.1. Regional Storage and Discharge Capacity

The weights of each indicator, calculated using the entropy weighting method, are presented in Table 2.
The calculated storage and drainage capacities for each area are summarized in Table 3. Areas I and II exhibit strong water storage capacity but relatively weak drainage performance. Area III stands out with both high storage and drainage capacities, indicating a balanced water management profile. Areas IV, V, and VI are primarily drainage-oriented, with Area V demonstrating the highest combined storage and drainage capabilities within this group.

4.2. Water Gate Operation Optimization Results

4.2.1. Objective Function Distribution Under Different Control Modes

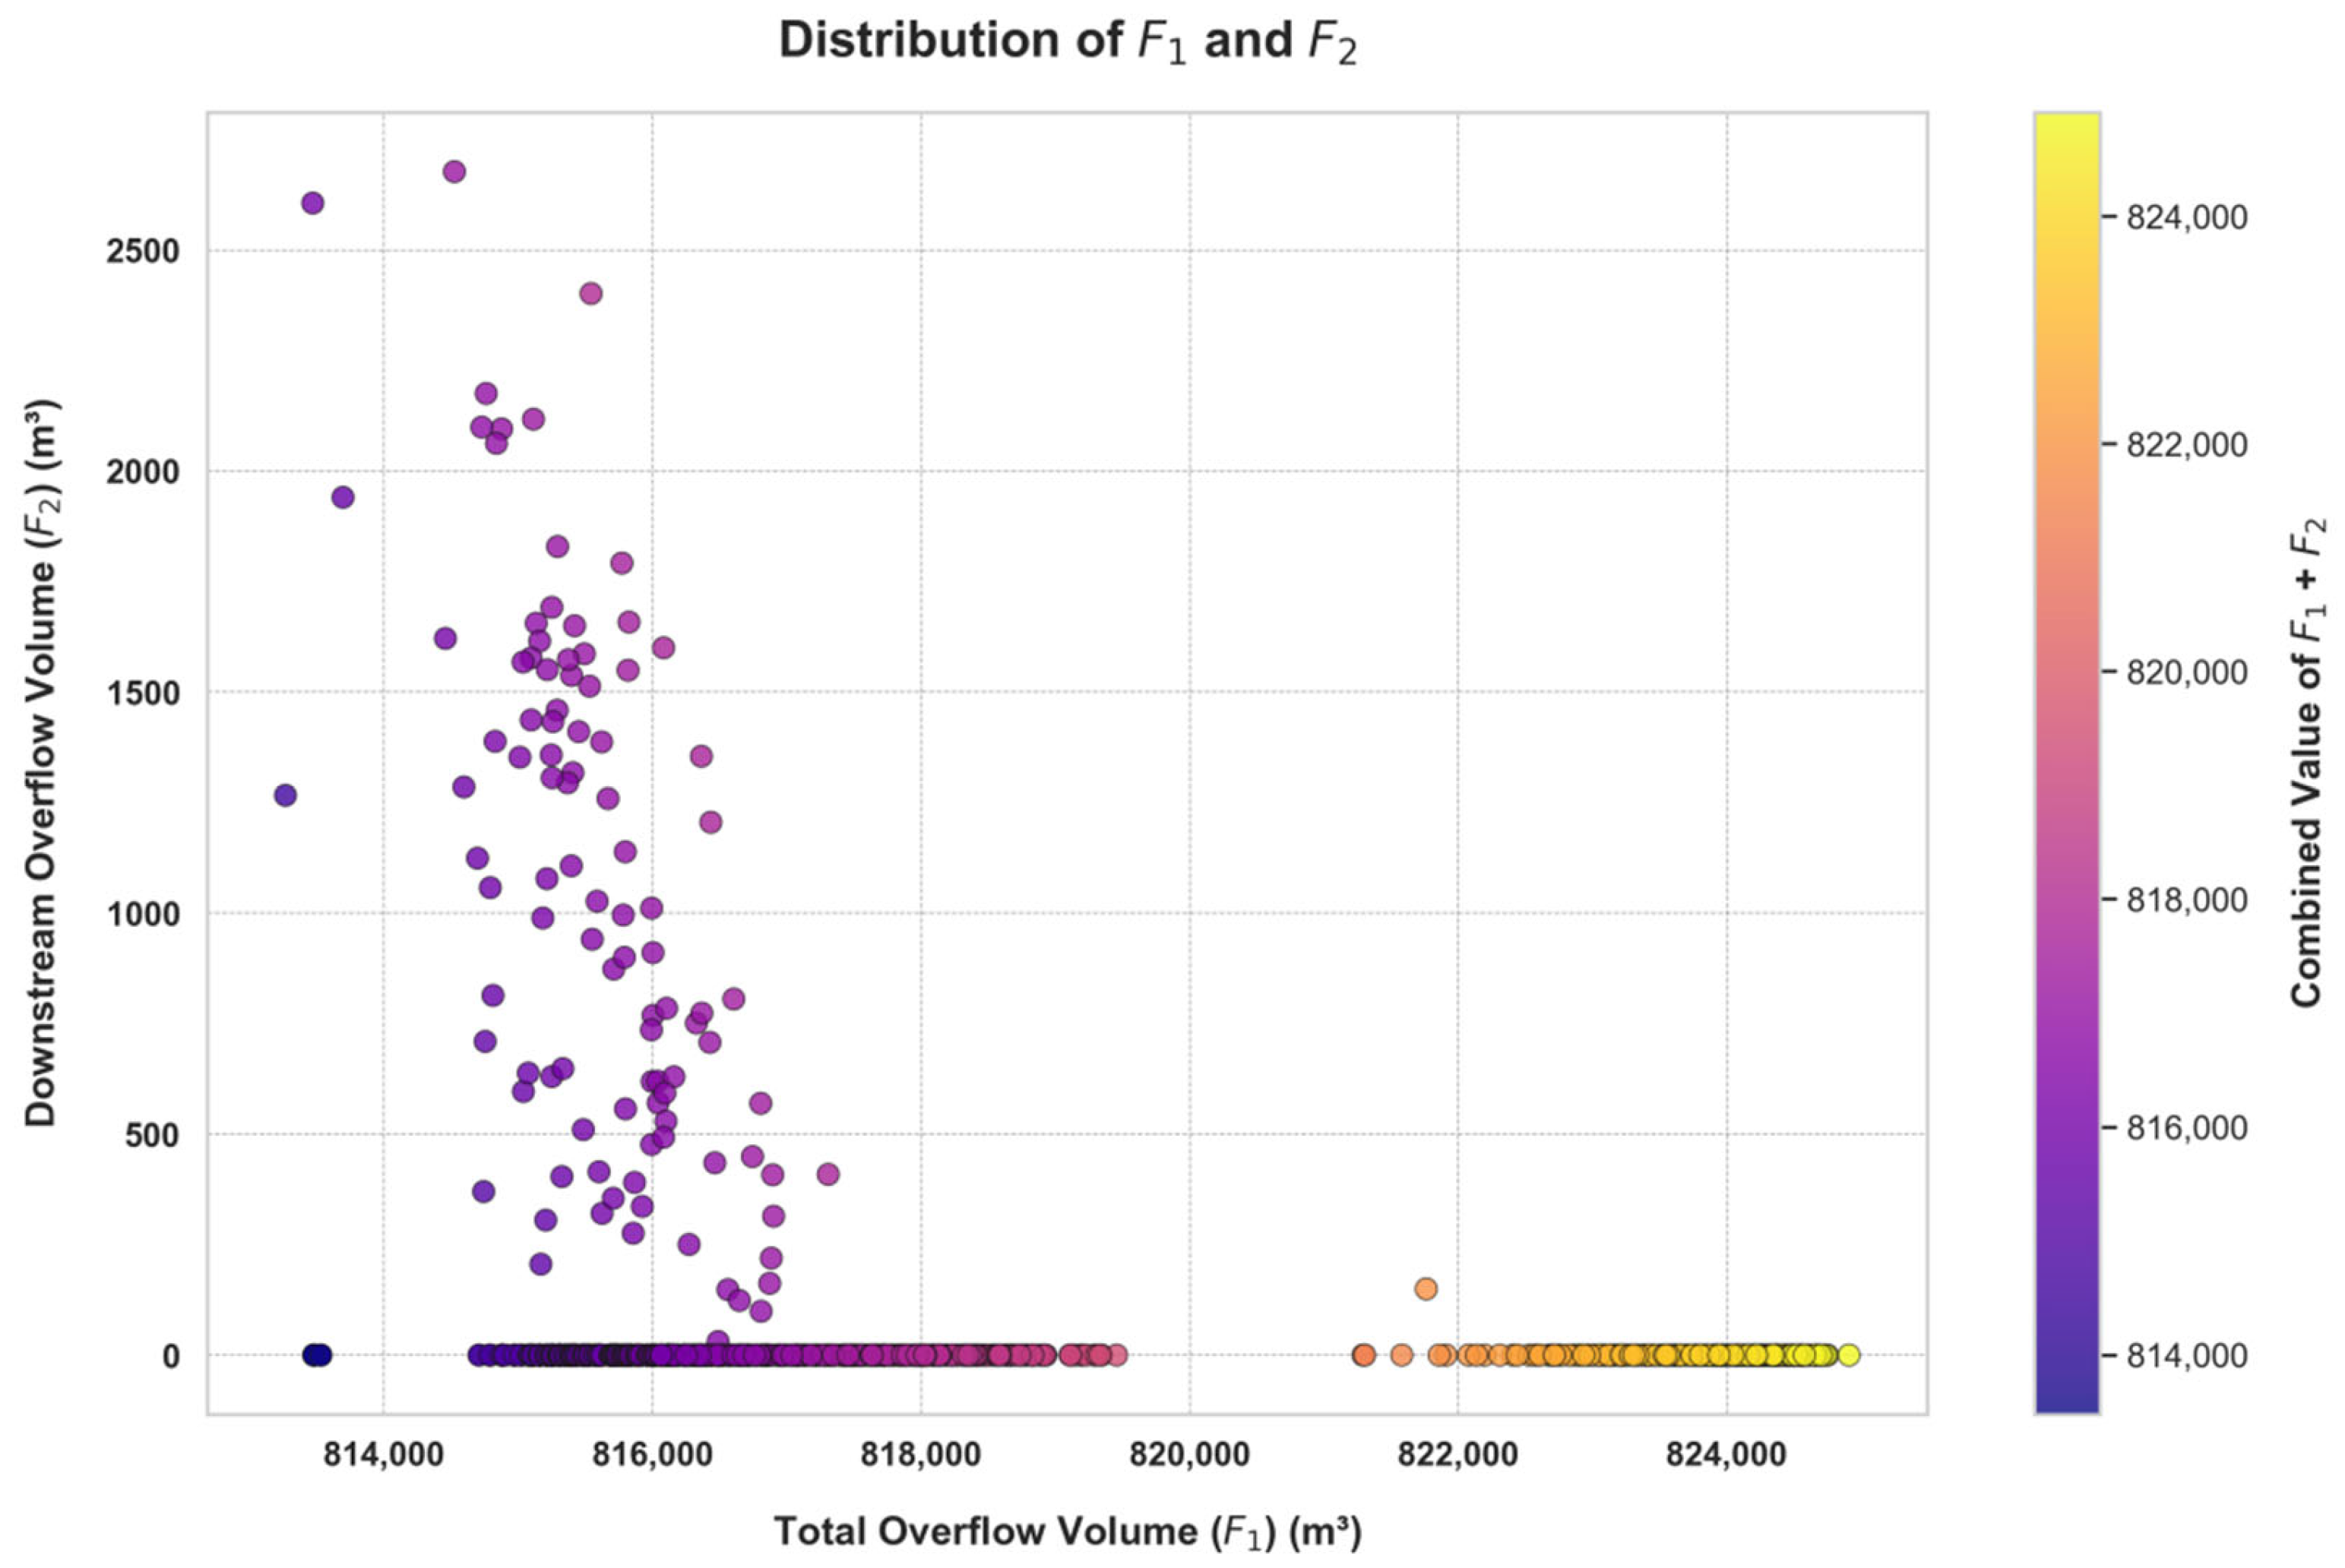
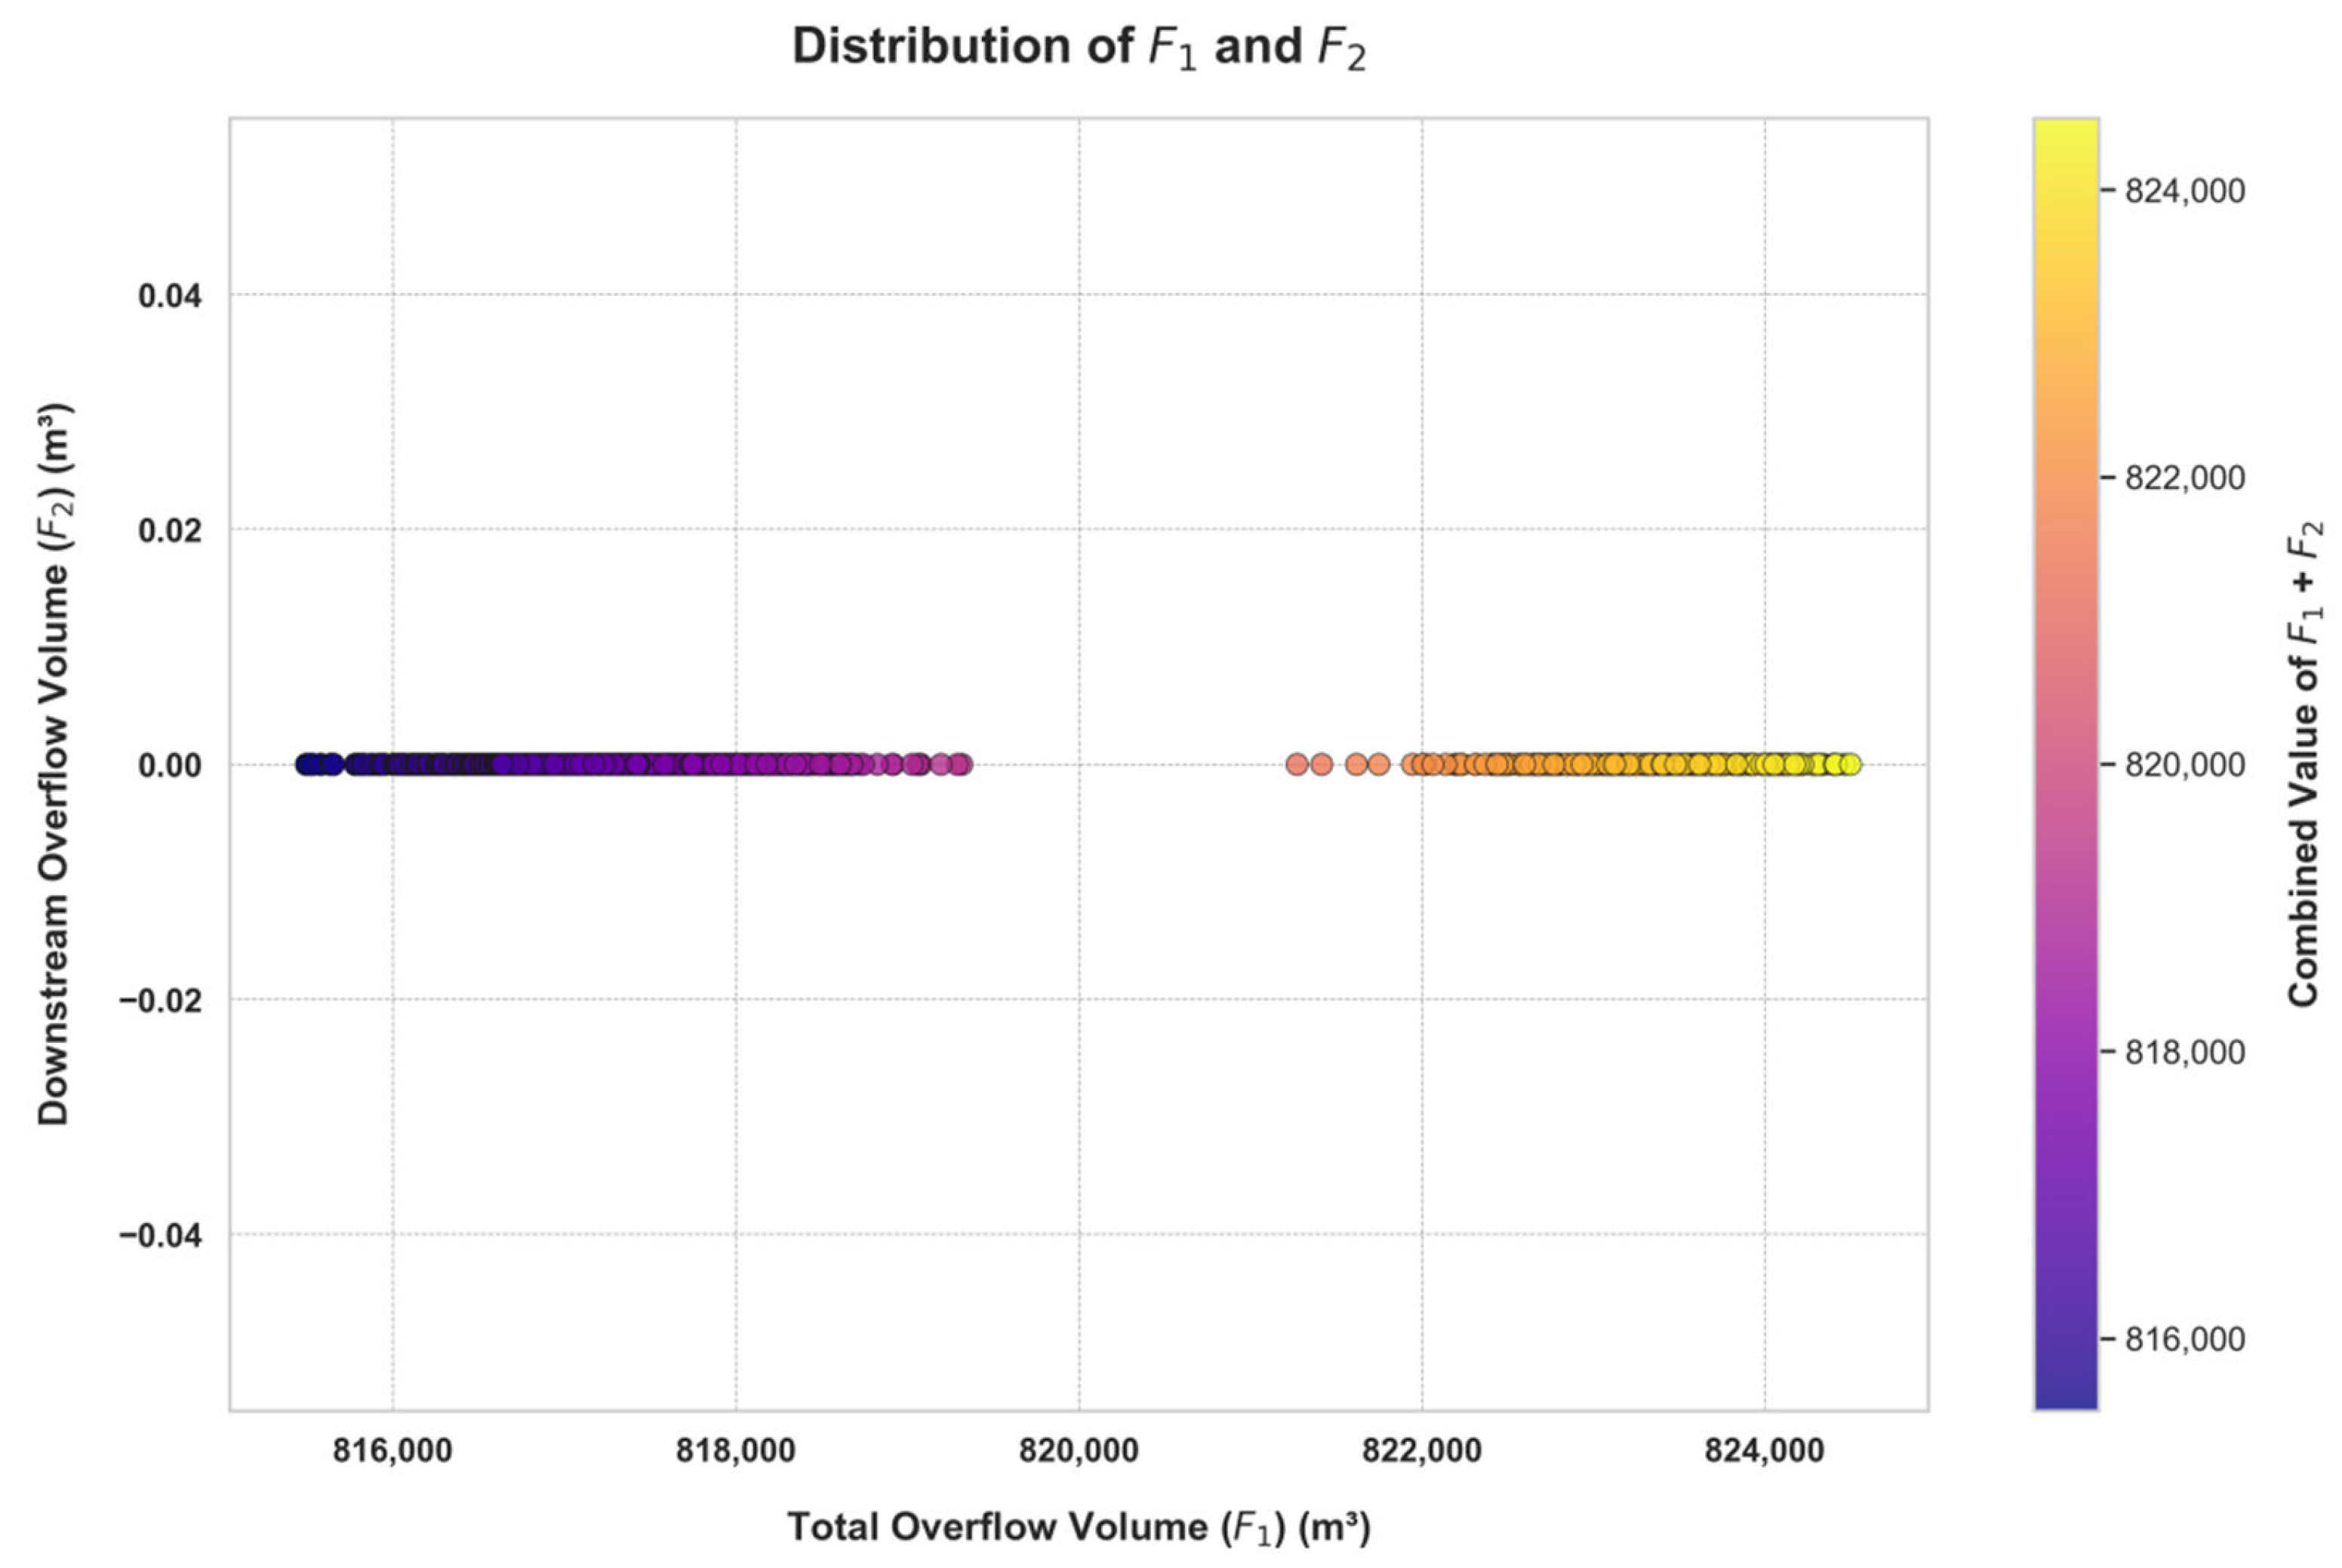
Figure 5 and Figure 6 show the distribution of optimization objectives under different control rules, including the final and intermediate solutions from the HS algorithm. The impact of the control rules on overflow volumes is different. Figure 5 shows the upstream and downstream overflow volumes under the unified control rule, with a color gradient representing the combined values of F1 + F2. As the upstream overflow increases, some downstream overflow volumes decrease until a certain threshold, after which downstream overflow is effectively controlled. With the constraint on the maximum downstream overflow rate, most of the downstream overflow volumes remain low, though a few points reach as high as 2670 m3. Figure 6 shows the distribution under the independent control rule, where the downstream overflow is effectively controlled (F2 = 0), but the range of upstream overflow is wider compared to the unified control rule.
In summary, both the unified control rule and the independent control rule have their advantages and disadvantages. The unified control rule excels in global coordination, making it suitable for scenarios with low downstream overflow risk and where balanced system performance is needed. The independent control rule is better for systems that prioritize control of key areas (such as downstream), but it may lead to increased upstream overflow. In practical applications, the appropriate rule can be chosen based on system complexity and control requirements, or a combination of the two strategies can be used to explore hybrid control schemes for global optimization, such as applying the independent control rule to certain key gates while using the unified control rule for others.

4.2.2. Optimal Solutions Under Different Control Modes

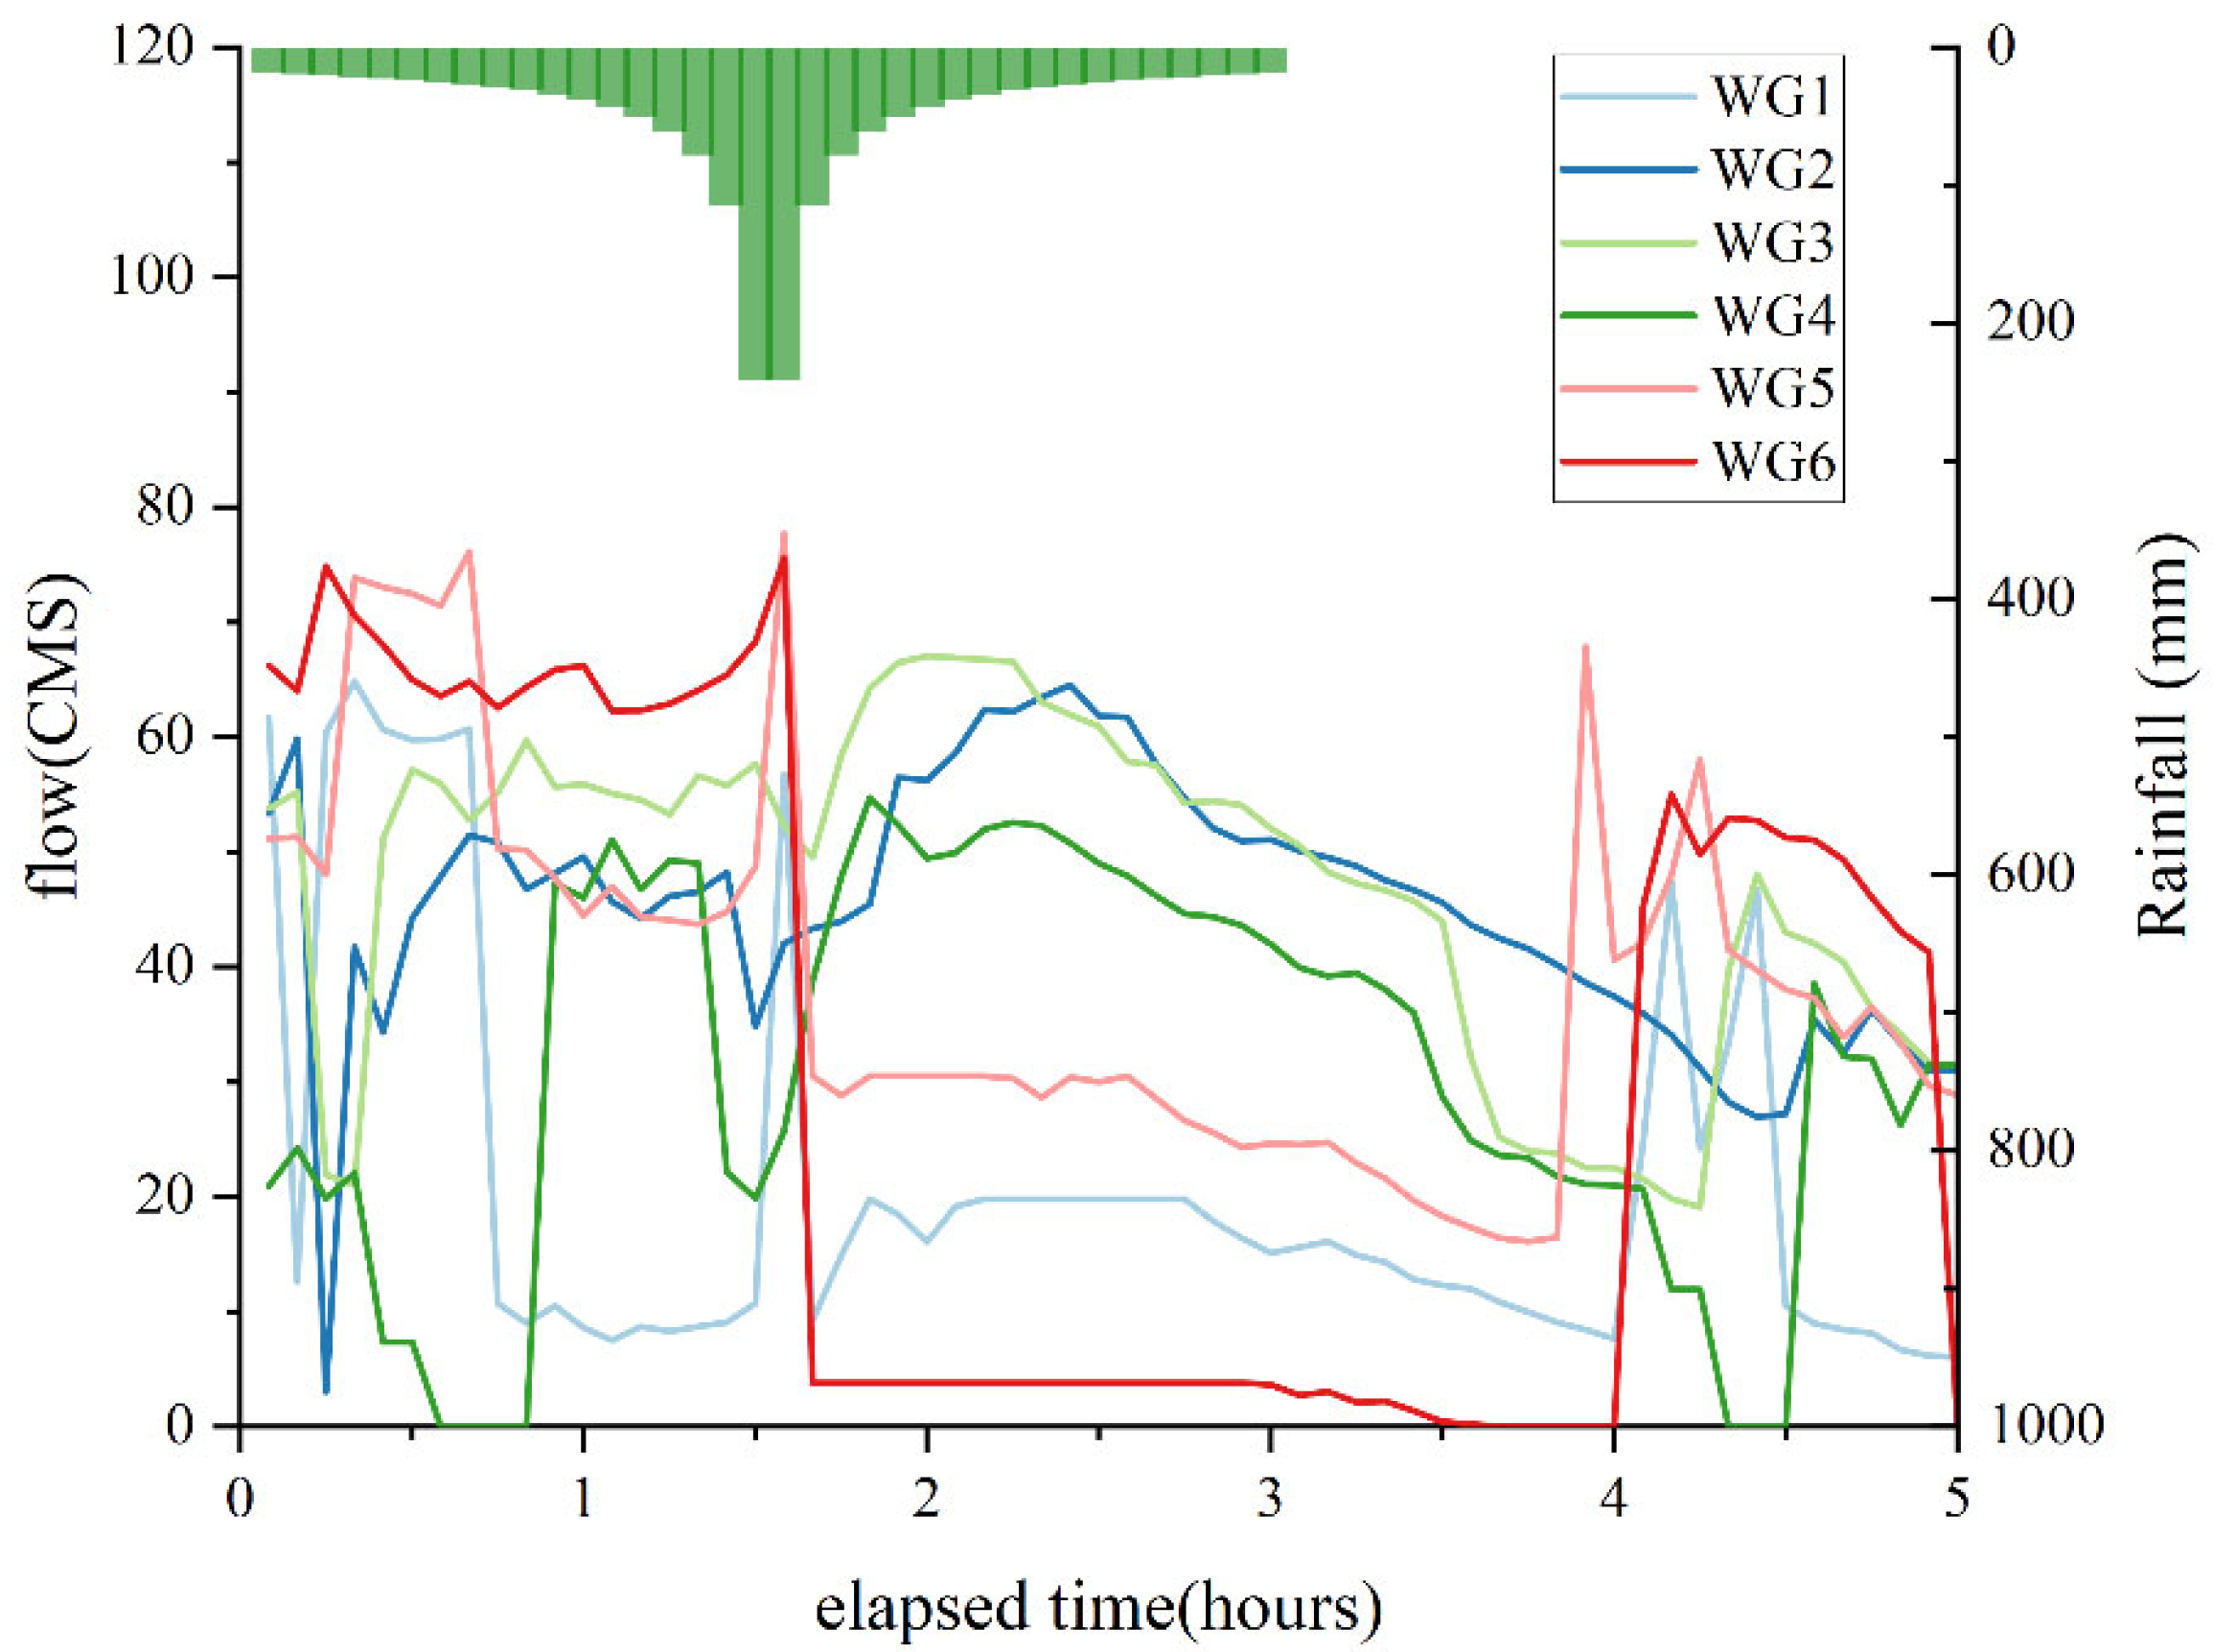
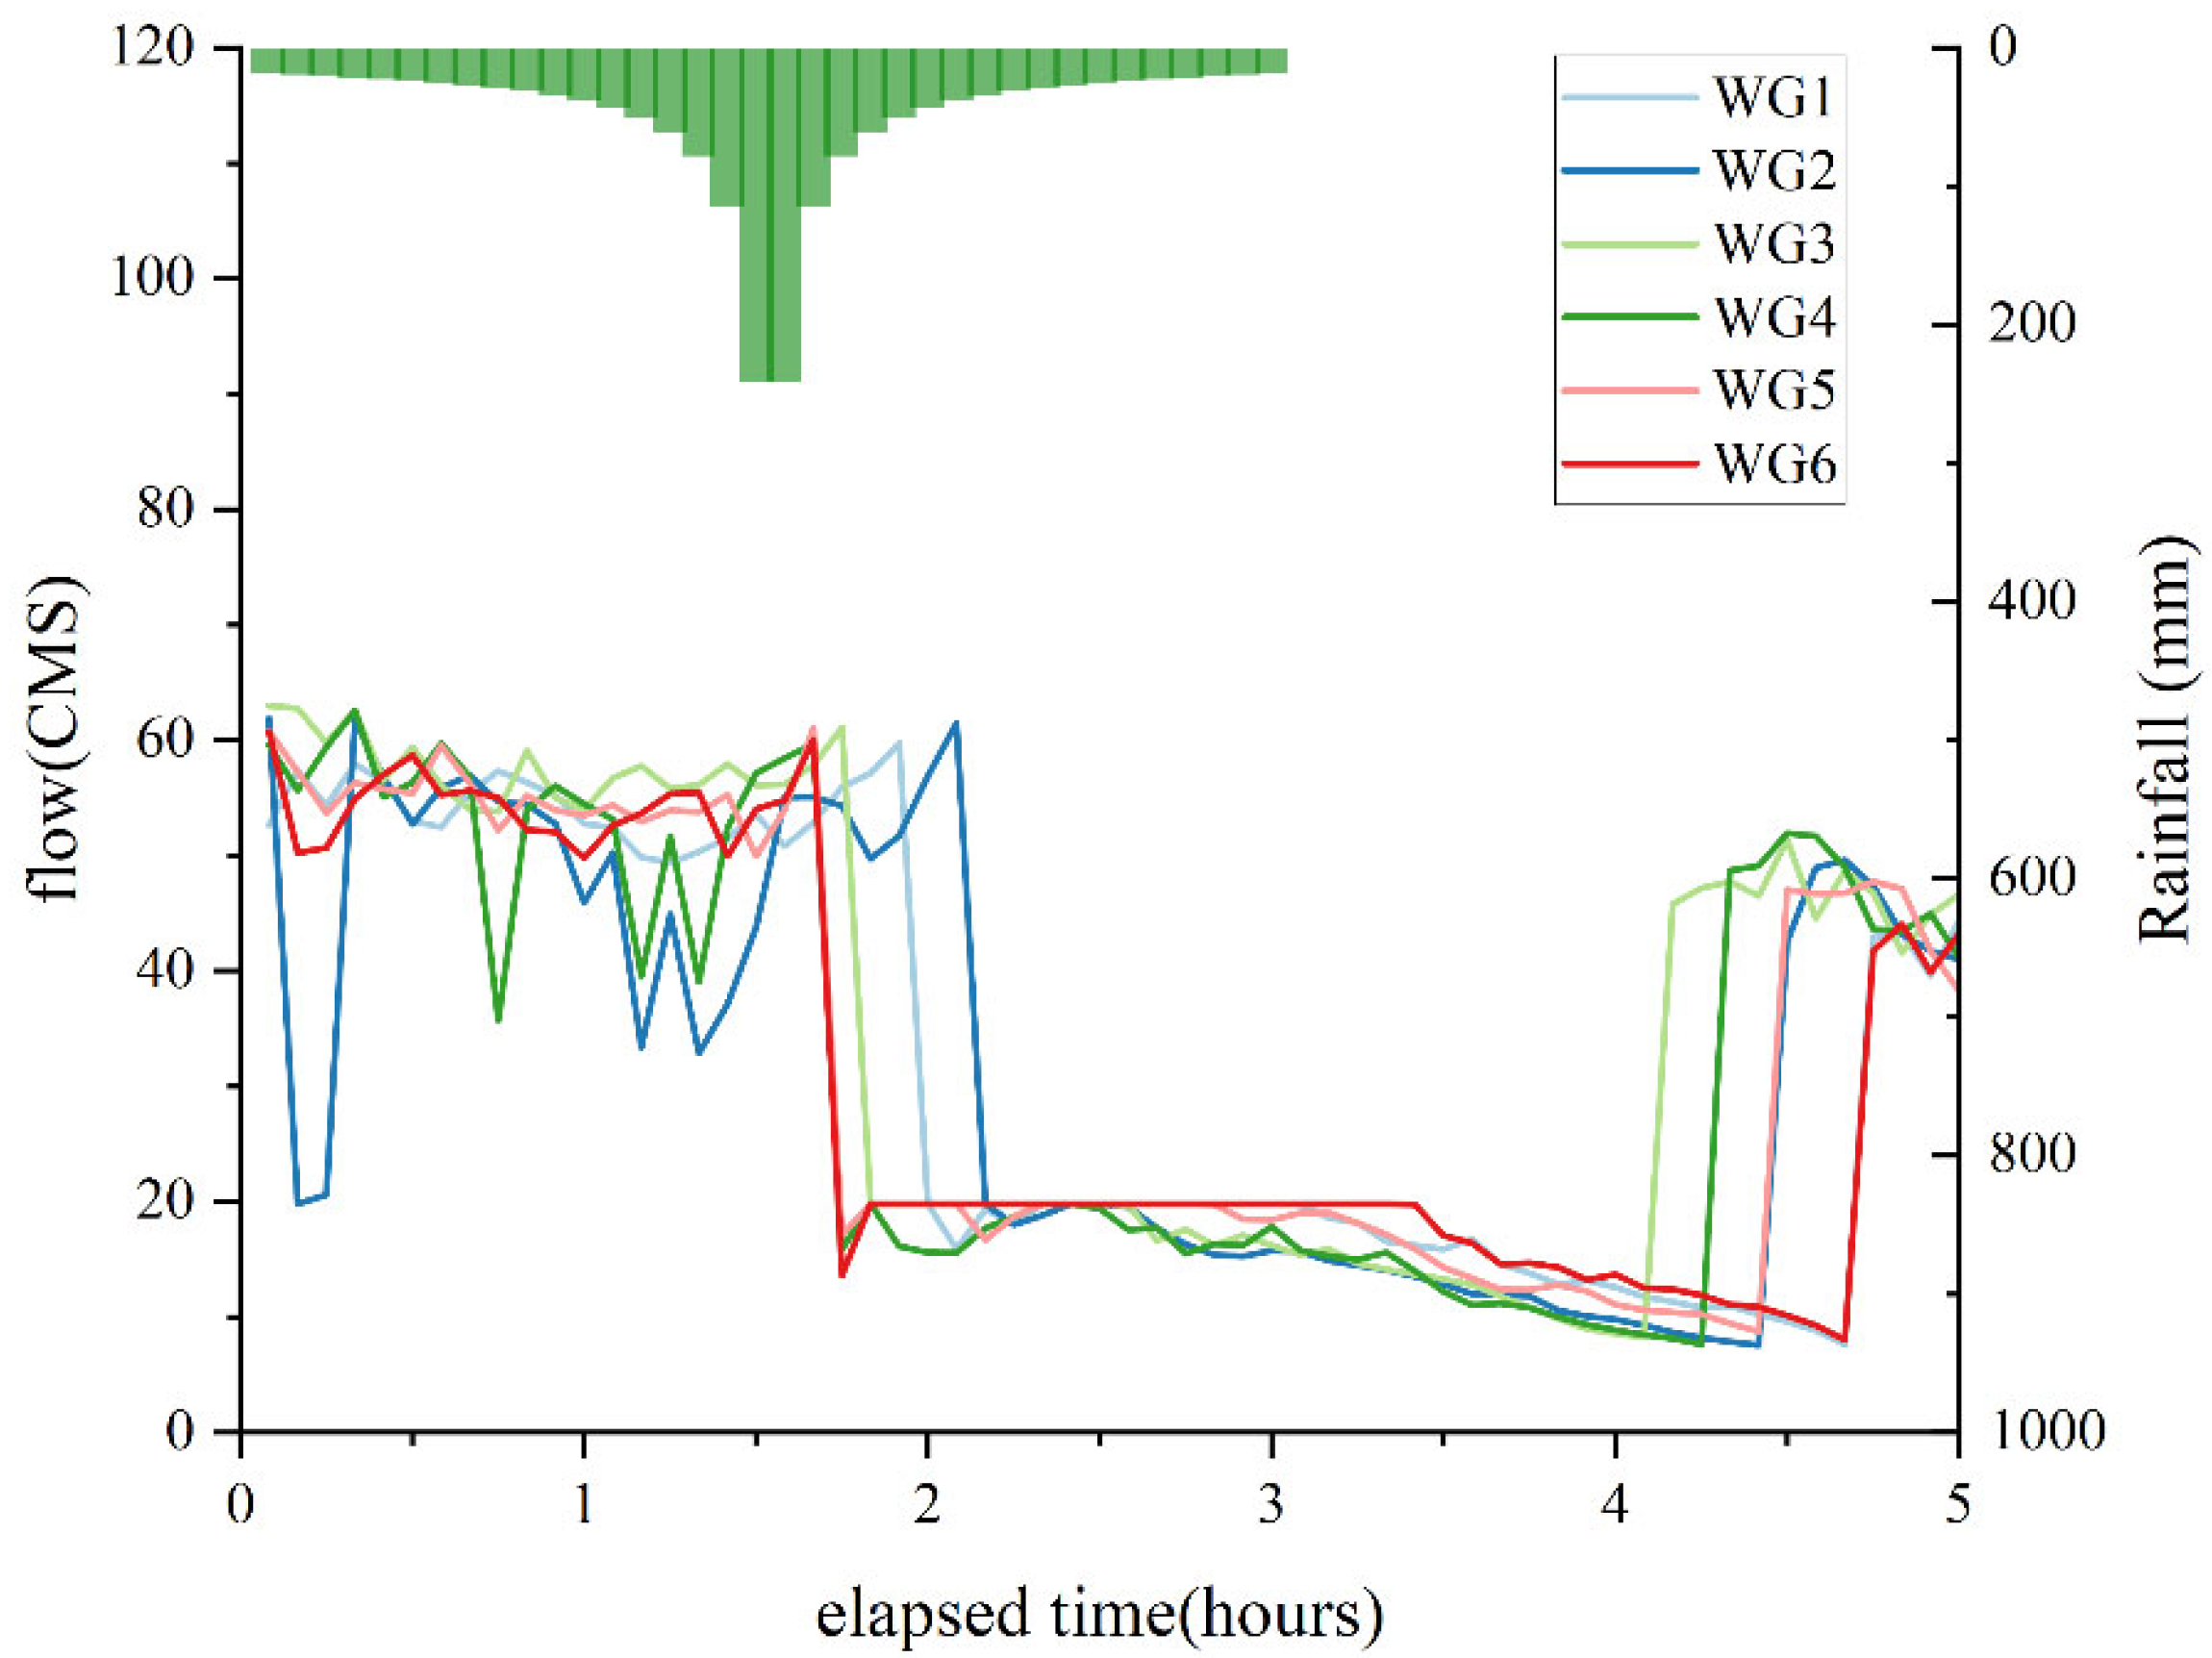
Table 4 presents the optimal performance of different control rules after optimization. There are significant differences in objective values and performance metrics, with the no-control rule performing the worst, relying entirely on passive gravitational drainage, resulting in high upstream overflow and severe downstream flooding. In contrast, both the unified and independent control rules reduce downstream overflow from 3806.80 m3 to 0 m3, achieving a 100% reduction. The unified control rule lowers the total objective value by 3255.16 m3 compared to the no-control rule, while the independent control rule achieves a similar improvement but is slightly higher than the unified control rule, indicating the unified control rule’s advantage in global optimization. The gate discharge curves under both control models are shown in Figure 7 and Figure 8, clearly showing that the independent control model better staggers runoff discharge into the downstream area.
Table 5 shows the optimal gate-opening configurations for the three control models after optimization. In the no-control rule, all gates are closed (0%). In the unified control rule, gates in the same water level interval have identical openings, following a clear pattern: In the low water level range (2.0–2.4 m), the gates are set to a moderate opening (70–80%), which helps prevent the system from being overloaded due to excessive flow while maintaining an efficient drainage process. In the medium water level range (2.4–2.8 m), the gates are opened to their maximum (90–100%) to accelerate the drainage process, facilitating the rapid removal of water and preventing further accumulation. In the high water level range (2.8–3.3 m), the gates are again set to a moderate opening (70–80%) to balance the drainage rate with the system’s capacity, ensuring effective drainage while avoiding system overload. When the water level exceeds 3.2 m, the gate opening is reduced to 30% to mitigate overflow risks. This adjustment limits the drainage rate, preventing excessive water discharge, avoiding system overload, and ensuring that the risk of overflow is minimized. This approach focuses on overall system coordination by adjusting drainage rates across intervals. The independent control rule offers more flexibility, with varied gate openings across water levels for localized control. These differences are influenced by multiple factors. Further research will explore the impact of local adjustments on system performance and the key characteristics of each water level interval.

4.3. System Response Analysis Results of Water Gate Opening Degree Adjustment

The impact of gate opening degree changes for gates WG1–WG6 on upstream overflow under different water level intervals is shown in Figure 9. The figure clearly illustrates significant differences in the response of each gate across various water level intervals. Overall, the medium water level interval (2.4–3.0) has a greater impact on upstream overflow, particularly in the water level range of (2.6–2.8), while the low water level interval (2.0–2.4) and high water level interval (3.0–3.4) show lower response levels. This difference in response reflects the system’s strong reliance on the medium water level interval during high-efficiency drainage stages.
The performance of individual gates further underscores the complexity of coordination between different areas. WG4, with minimal fluctuation across all water level intervals, shows that changes in its opening degree have a limited impact on overflow, indicating a lower response level. The control priority for such gates can be reduced to simplify the optimization strategy. In contrast, other gates show a higher response in the medium water level interval, where adjusting their opening degrees can significantly reduce upstream overflow, revealing greater control potential.
Some gates show threshold effects in their impact on system performance. For instance, once the opening degree of WG2 exceeds 0.7, improvements in upstream overflow level and slight performance degradation may even occur. This suggests that at higher opening degrees, excessive drainage rates can lead to local pressure overload, and increasing the opening further will not improve performance but may destabilize the system. Identifying the response threshold of each gate helps avoid excessive adjustments, reducing operational costs and risks. These threshold effects also reinforce the nonlinear behavior of the system and highlight the importance of setting appropriate upper and lower limits for opening degrees during optimization.
Overall, the medium water level interval is the key to optimizing the system’s drainage performance, as most gates exhibit a strong response in this range, with the effect of opening degree adjustment being most pronounced. In contrast, control in the high water level interval should focus on the threshold control to avoid system pressure overload caused by excessive gate opening. Additionally, the impact of some low-sensitivity gates (such as WG4) is relatively small, allowing for a simplified control strategy that concentrates optimization resources on key gates and response intervals. These patterns provide clear guidance for optimizing gate control strategies and contribute to improving the overall coordination of storage and drainage.
Figure 10 shows the impact of gate opening degree changes for gates WG1–WG6 on downstream overflow under different water level intervals. The results indicate that gates WG4 and WG6, corresponding to areas IV and VI, exhibit a higher response in controlling downstream overflow. Both areas IV and VI have strong drainage capacity but weak storage capacity, which may explain this phenomenon. These areas have limited buffering effects for rainwater runoff, and rainfall quickly transforms into runoff directed downstream. This characteristic makes them more prone to significantly affecting downstream overflow under high water level conditions. Particularly, when the gate opening degree is large, the drainage rate increases rapidly, causing a large amount of accumulated water to rush downstream, leading to a dramatic rise in pressure in the downstream drainage system, thus increasing the overflow risk. Therefore, it is crucial to set a reasonable upper limit for gate opening degrees in high drainage capacity areas, especially under high water levels, as a larger gate opening is not always better.

4.4. Limitations and Future Research Directions

The current SWMM model has certain limitations, mainly due to the lack of real-world data on the pipe network, nodes, and underlying surfaces. This results in the model being unable to fully validate the accuracy of the data during simulations, which may lead to certain errors. Therefore, the simulation results may not be entirely precise. In the future, once data become available, the accuracy of the results can be further validated.

5. Conclusions

(1)
This study introduces a method for evaluating the storage and drainage capacities of upstream areas. The method classifies areas based on their capacities into three categories: strong water storage capacity, strong drainage capacity, and balanced storage and drainage capacities.
(2)
Through the CRSD strategy, both the unified control and independent control models significantly reduce the total overflow compared to the no-control model, improving the system’s resilience to urban waterlogging.
(3)
This study highlights that in areas with strong drainage capacity, setting a reasonable upper limit for gate openings is crucial, especially during high water levels.
(4)
The unified control model optimizes drainage coordination by increasing the drainage rate in the medium water level range and reducing it in the high water level range. This model excels in global coordination, making it ideal for situations with a low downstream overflow risk and a need for a balanced system performance.
(5)
The independent control model improves system efficiency by optimizing drainage performance in the medium water level range, where the effect of gate opening adjustments is most significant. To avoid excessive adjustments, the importance of setting reasonable upper and lower limits for gate openings is emphasized. This model is particularly suitable for systems that require prioritized control in key areas, such as downstream regions.

Author Contributions

L.Y.: Methodology, Software, Validation, Writing—original draft, Conceptualization; Z.Z.: Supervision, Project administration, Funding acquisition, Writing—review and editing; Q.L.: Data curation; Z.W.: Data curation. All authors have read and agreed to the published version of the manuscript.

Funding

This research was supported by the National Key R&D Program of China (Grant No. 2022YFC3800500).

Data Availability Statement

The original contributions presented in this study are included in the article. Further inquiries can be directed to the corresponding author.

Conflicts of Interest

The authors declare no conflicts of interest.

References

  1. O’Gorman, P.A. Precipitation Extremes under Climate Change. Curr. Clim. Change Rep. 2015, 1, 49–59. [Google Scholar] [CrossRef] [PubMed]
  2. Shiu, C.J.; Liu, S.C.; Fu, C.; Dai, A.; Sun, Y. How Much Do Precipitation Extremes Change in a Warming Climate? Geophys. Res. Lett. 2012, 39, L17707. [Google Scholar] [CrossRef]
  3. Yang, L.; Franzke, C.L.; Duan, W. Evaluation and Projections of Extreme Precipitation Using a Spatial Extremes Framework. Int. J. Climatol. 2023, 43, 3453–3475. [Google Scholar] [CrossRef]
  4. Zhang, D.-L. Rapid Urbanization and More Extreme Rainfall Events. Sci. Bull. 2020, 65, 516–518. [Google Scholar] [CrossRef] [PubMed]
  5. Zhou, X.; Bai, Z.; Yang, Y. Linking Trends in Urban Extreme Rainfall to Urban Flooding in China. Int. J. Climatol. 2017, 37, 4586–4593. [Google Scholar] [CrossRef]
  6. Yin, C.; Wang, J.; Yu, X.; Li, Y.; Yan, D.; Jian, S. Definition of Extreme Rainfall Events and Design of Rainfall Based on the Copula Function. Water Resour. Manag. 2022, 36, 3759–3778. [Google Scholar] [CrossRef]
  7. Deng, S.; Wu, Q.; Wang, Z.; Wu, L.; Huang, Z.; Zhang, G. Investigating Flood Characteristics and Mitigation Measures in Plain-Type River-Connected Lakes: A Case Study of Poyang Lake. Water 2024, 16, 281. [Google Scholar] [CrossRef]
  8. Kim, Y.; Newman, G. Climate Change Preparedness: Comparing Future Urban Growth and Flood Risk in Amsterdam and Houston. Sustainability 2019, 11, 1048. [Google Scholar] [CrossRef] [PubMed]
  9. Asselman, N.; de Jong, J.S.; Kroekenstoel, D.; Folkertsma, S. The Importance of Peak Attenuation for Flood Risk Management, Exemplified on the Meuse River, The Netherlands. Water Secur. 2022, 15, 100114. [Google Scholar] [CrossRef]
  10. Green, C.H.; Parker, D.J.; Tunstall, S.M. Assessment of Flood Control and Management Options; WCD Thematic Reviews; World Commission on Dams Secretariat: Cape Town, South Africa, 2000. [Google Scholar]
  11. Sayers, P.; Yuanyuan, L.; Galloway, G.; Penning-Rowsell, E.; Fuxin, S.; Kang, W.; Yiwei, C.; Le Quesne, T. Flood Risk Management: A Strategic Approach; Asian Development Bank, GIWP, UNESCO and WWF: London, UK, 2013. [Google Scholar]
  12. Fasahat, V.; Sadatinejad, S.J.; Honarbakhsh, A.; Samadi, B.H. Influence of Storage Dam Construction on Downstream Flood Reduction. J. Watershed Manag. Res. 2015, 5, 44–54. [Google Scholar]
  13. Wei, C.-C.; Hsu, N.-S. Optimal Tree-Based Release Rules for Real-Time Flood Control Operations on a Multipurpose Multireservoir System. J. Hydrol. 2009, 365, 213–224. [Google Scholar] [CrossRef]
  14. Volpi, E.; Di Lazzaro, M.; Bertola, M.; Viglione, A.; Fiori, A. Reservoir Effects on Flood Peak Discharge at the Catchment Scale. Water Resour. Res. 2018, 54, 9623–9636. [Google Scholar] [CrossRef]
  15. Zhou, C.; Sun, N.; Chen, L.; Ding, Y.; Zhou, J.; Zha, G.; Luo, G.; Dai, L.; Yang, X. Optimal Operation of Cascade Reservoirs for Flood Control of Multiple Areas Downstream: A Case Study in the Upper Yangtze River Basin. Water 2018, 10, 1250. [Google Scholar] [CrossRef]
  16. Zhu, D.; Mei, Y.; Xu, X.; Liu, Z.; Wu, Z.; Cai, H. Optimal Operation of a Parallel Multireservoir System for Flood Control Using a Stagewise Compensation Method. Water Resour. Manag. 2021, 35, 1689–1710. [Google Scholar] [CrossRef]
  17. Acheampong, J.N.; Gyamfi, C.; Arthur, E. Impacts of Retention Basins on Downstream Flood Peak Attenuation in the Odaw River Basin, Ghana. J. Hydrol. Reg. Stud. 2023, 47, 101364. [Google Scholar] [CrossRef]
  18. Wang, H.; Lei, X.; Wang, C.; Liao, W.; Kang, A.; Huang, H.; Ding, X.; Chen, Y.; Zhang, X. A Coordinated Drainage and Regulation Model of Urban Water Systems in China: A Case Study in Fuzhou City. River 2023, 2, 5–20. [Google Scholar] [CrossRef]
  19. Muroi, H.; Mine, K.; Eguchi, Y. Scenario Analysis of Sluice Gate Operations for Evaluating Inland Flood Damage. J. Disaster Res. 2021, 16, 429–436. [Google Scholar] [CrossRef]
  20. Mel, R.A.; Viero, D.P.; Carniello, L.; D’Alpaos, L. Optimal Floodgate Operation for River Flood Management: The Case Study of Padova (Italy). J. Hydrol. Reg. Stud. 2020, 30, 100702. [Google Scholar] [CrossRef]
  21. Zhang, H.; Liu, S.; Ye, J.; Yeh, P.J.-F. Model Simulations of Potential Contribution of the Proposed Huangpu Gate to Flood Control in the Lake Taihu Basin of China. Hydrol. Earth Syst. Sci. 2017, 21, 5339–5355. [Google Scholar] [CrossRef]
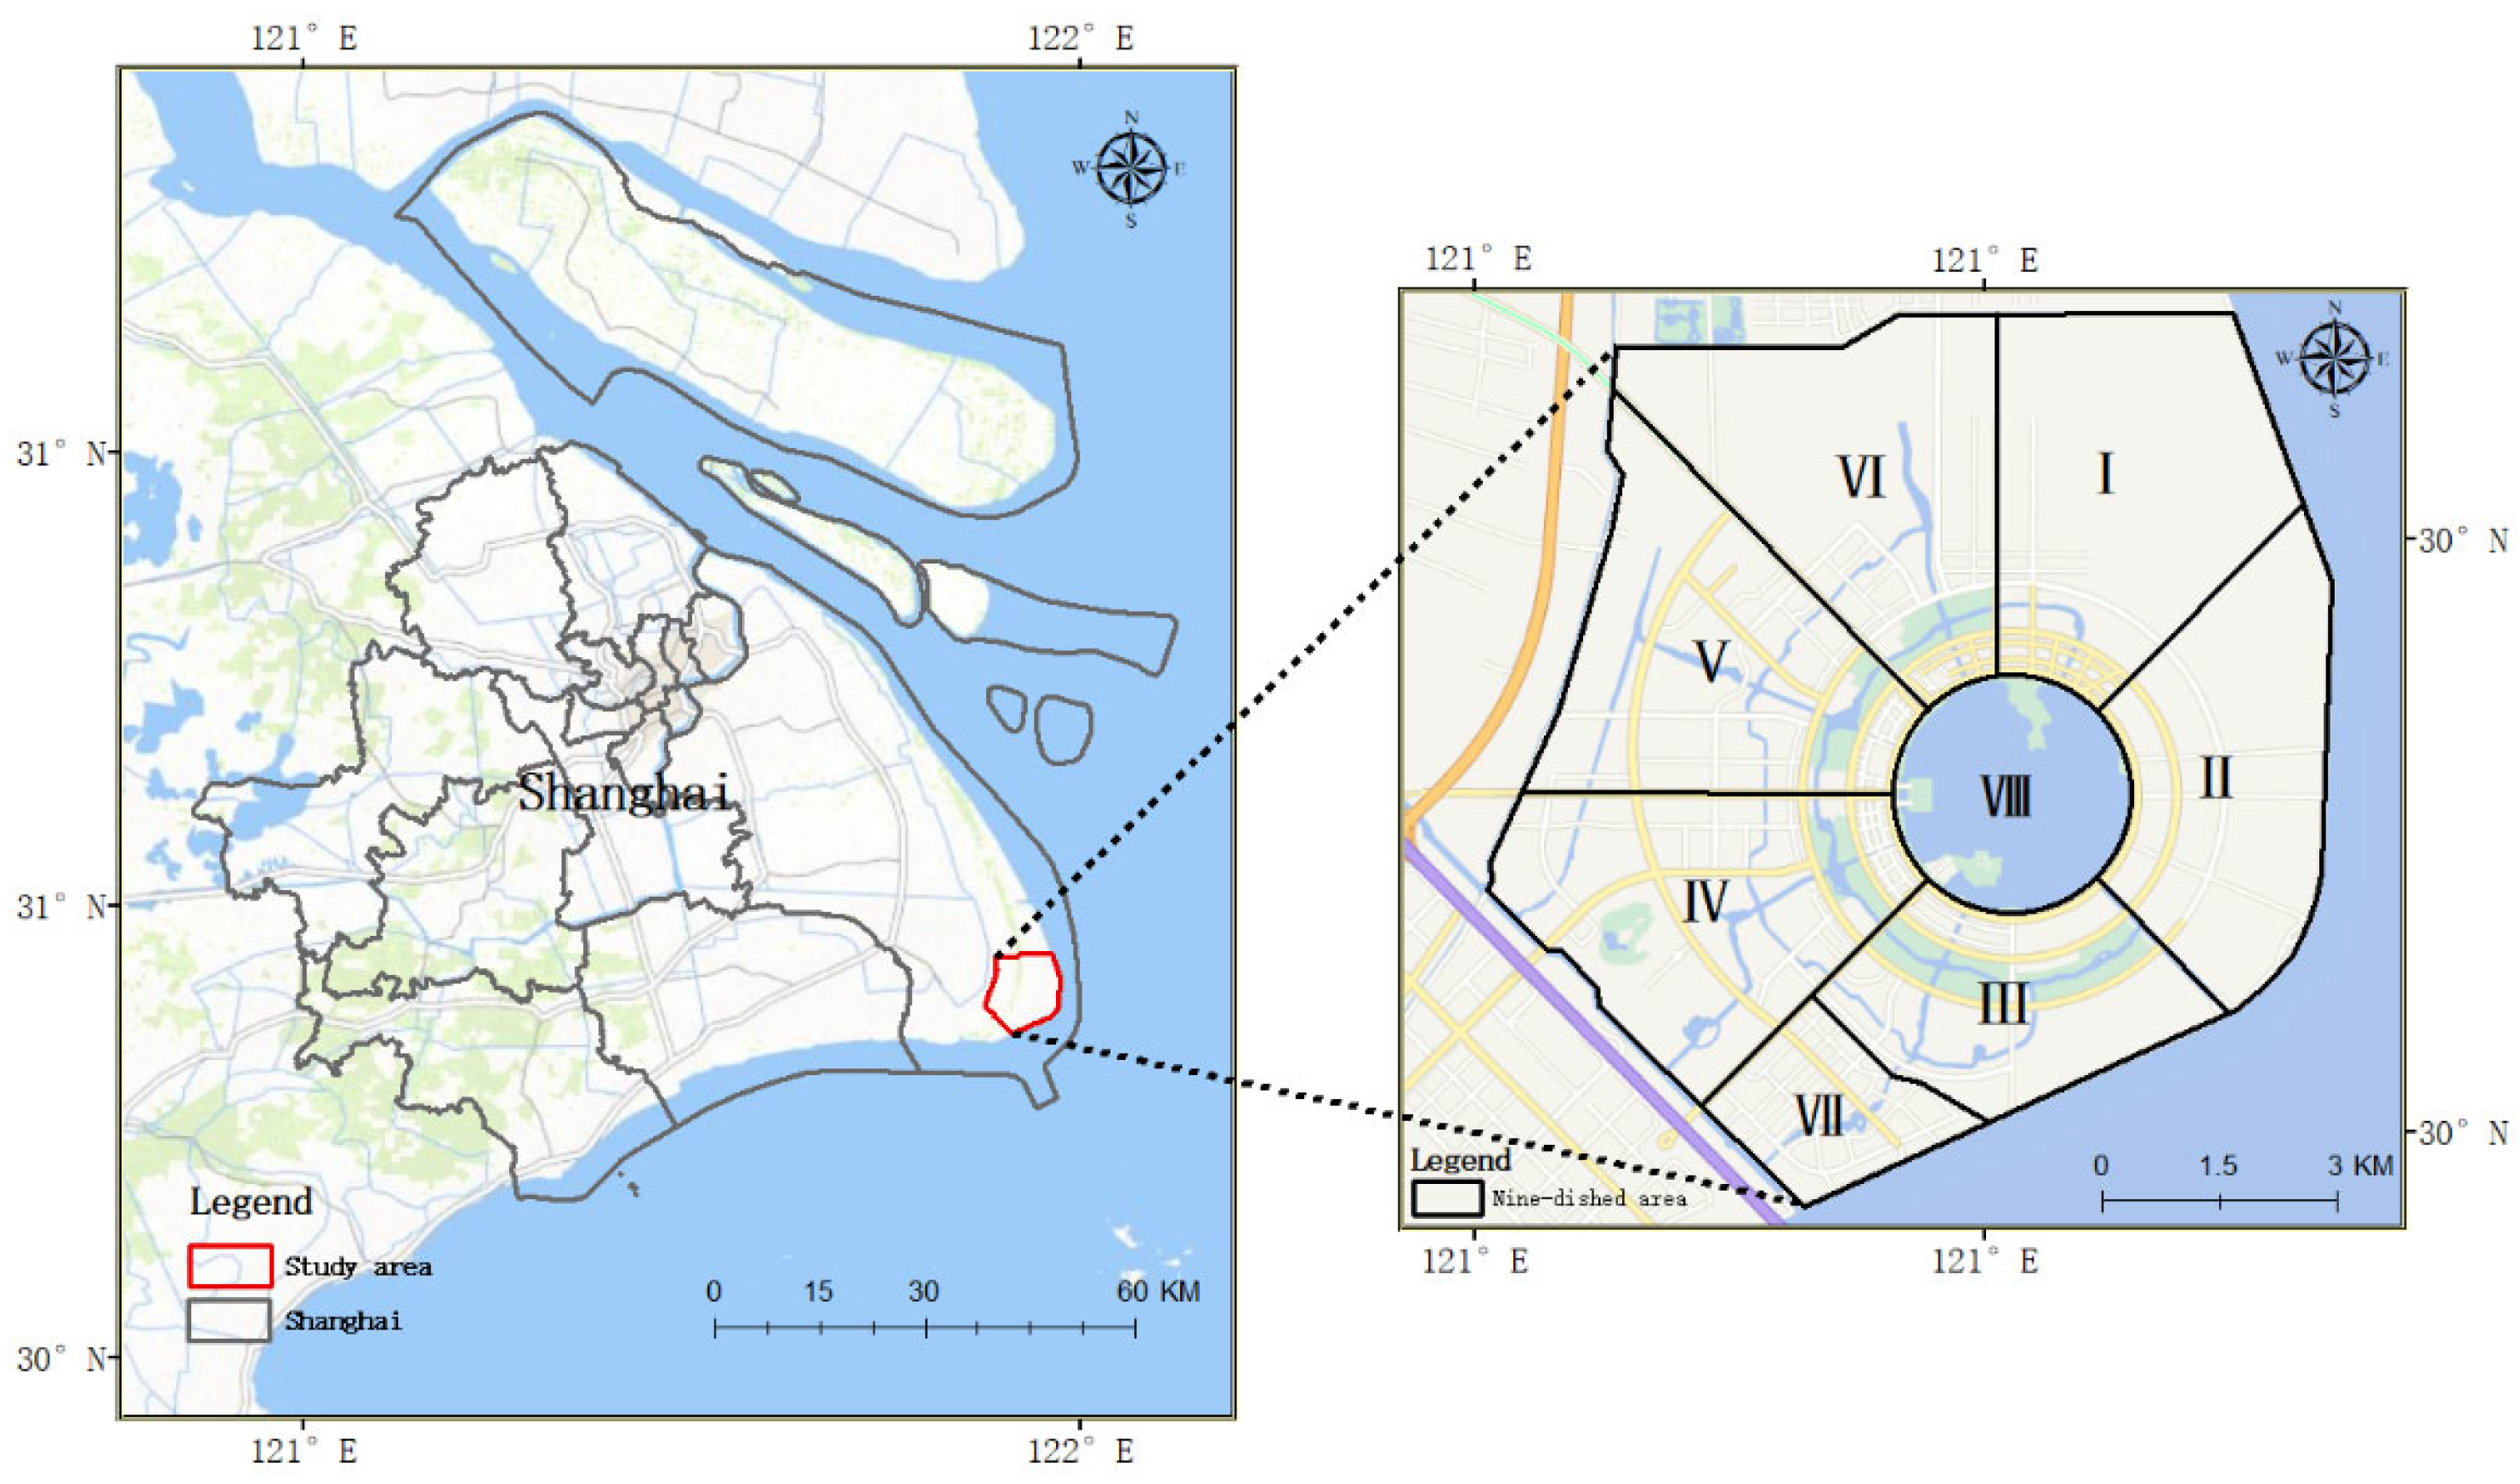
Figure 1. Location of the study area and drainage district.
Water 17 01272 g001
Figure 2. Methodology flowchart.
Water 17 01272 g002
Figure 3. Schematic map of the study area.
Water 17 01272 g003
Figure 4. Schematic map of the study area and diagram of the hypothetical gate locations.
Water 17 01272 g004
Figure 5. Distribution characteristics of the objective function under the unified control mode.
Water 17 01272 g005
Figure 6. Distribution characteristics of the objective function under the independent control mode.
Water 17 01272 g006
Figure 7. Gate process runoff curve of the optimization strategy under the independent control model (Green bars represent rainfall).
Water 17 01272 g007
Figure 8. Gate process runoff curve of the optimization strategy under the unified control model (Green bars represent rainfall).
Water 17 01272 g008
Figure 9. Analysis of changes in total upstream overflow volume with different water gate opening degrees under varying water levels.
Water 17 01272 g009
Figure 10. Analysis of changes in total downstream overflow volume with different water gate opening degrees under varying water levels.
Water 17 01272 g010
Table 1. Assessment indicators and quantification methods for storage and drainage capacity.
Assessment ObjectIndicatorQuantitative Method
Water Storage Capacityexisting water storage facilitiesCalculate the storage capacity of the facility
greenfield infiltration Q = K A Where A is the urban green space area (m2); K is the infiltration capacity of the urban green space(m/s), with a K-value of 2.778 × 10⁻⁷ for Shanghai (m/s); Q is the infiltration volume of the urban green space(m3/s).
water coverageUse Geographic Information System (GIS) technology to perform regional statistics on all river networks in each city.
impervious surface coverageImpervious surface coverage was estimated from land use types with imperviousness coefficients of 0.1 for green space, 0.6 for residential, 0.8 for commercial, and 0.7 for cultural areas.
Drainage CapacityslopeArcGIS 10.8 software was used to extract slopes from elevation raster data.
existing drainage facilitiesThe drainage capacity is quantified in cubic meters per second.
river network densityDefine river network density as the river’s total length ratio to the region’s area.
Table 2. Regional storage and discharge capacity indicator weights.
Assessment ObjectIndicatorWeights
Regional Water Storage Capacitygreenfield infiltration0.27
water coverage0.49
impervious surface coverage0.24
Regional Drainage Capacityslope0.46
river network density0.54
Table 3. Regional storage and discharge capacity.
Area IArea IIArea IIIArea IVArea VArea VI
Area (km2)9.358.396.9610.5311.0011.73
Greenfield Infiltration (m3/s)1.331.070.790.721.010.90
Water Surface Area (km2)0.850.880.820.821.081.03
Impervious Surface Coverage (%)32.0038.0035.0052.0041.0050.00
Slope (°)0.360.580.640.851.060.69
River Network Density (km/km2)1.071.181.301.061.210.99
Water Storage Capacity
(dimensionless)
0.810.650.680.000.570.22
Drainage Capacity
(dimensionless)
0.080.350.470.640.910.43
Regional Storage and Drainage Capacitystrong water storage capacitystrong water storage capacitycomparable storage and drainage capacitiesstrong drainage capacitystrong drainage capacitystrong drainage capacity
Table 4. Optimization results under different control modes.
Control ModesUpstream Overflow (m3)Downstream Overflow (m3)Peak Overflow Rate (m3/s)Total Overflow (m3)
no control812,926.963806.80409.17816,733.76
unified control813,478.600.000.00813,478.60
independent control815,495.200.000.00815,495.20
Table 5. Gate water level ranges and opening degree rules for the optimal strategy under different control modes.
Water Level Range (m)2.0–2.22.2–2.42.4–2.62.6–2.82.8–3.03.0–3.23.2–3.4
Gate opening degree (%)no controlWG1–WG6100100100100100100100
unified controlWG1–WG6708010090808030
independent controlWG190103040903080
WG240409070707070
WG380209090507060
WG480209010506050
WG51009090801004060
WG690100101001001010
Disclaimer/Publisher’s Note: The statements, opinions and data contained in all publications are solely those of the individual author(s) and contributor(s) and not of MDPI and/or the editor(s). MDPI and/or the editor(s) disclaim responsibility for any injury to people or property resulting from any ideas, methods, instructions or products referred to in the content.