1. Introduction
Minerals are inorganic compounds that play a critical role in numerous physiological and metabolic functions within the human body, such as maintaining acid–base balance, supporting immune responses, and regulating body fluids [
1]. Certain minerals like calcium, magnesium, sodium, and potassium are crucial for performance, assisting in oxygen transport, muscle contraction, and energy production [
2,
3]. The body needs larger amounts of macro-minerals (such as calcium and sodium) and smaller amounts of micro-minerals (such as magnesium and potassium) for optimal health [
1]. Calcium is especially important for muscle function, cardiovascular health, and blood clotting [
4], while sodium and potassium help to regulate fluid balance and muscle responsiveness [
3]. Additionally, magnesium and potassium are essential for proper nerve function [
1].
Water serves as a significant source of these key minerals. For example, mineral water rich in calcium can supply up to one-third of an adult’s daily recommended intake, promoting bone health and reducing the risk of osteoporosis [
4,
5]. Magnesium in mineral water is also highly bioavailable, with absorption rates comparable to those of oral supplements [
5]. Fluoride is another mineral that can be supplied through water and is highly effective in preventing dental caries, one of the most widespread oral diseases and a major global public health issue. Even at low concentrations, fluoride in the oral cavity can prevent or slow the development of dental caries [
6]. To ensure adequate fluoride exposure for dental caries prevention, the practice of community water fluoridation (CWF) was introduced. CWF adjusts the fluoride concentration in public water supplies to the optimal level of 0.7 mg/L (ppm), as recommended by the U.S. Public Health Service in 2015 [
7]. This concentration is designed to prevent dental caries while minimizing the risk of fluorosis, a condition caused by excessive fluoride intake. The mineral content of drinking water, whether from natural sources, tap, or desalinated sources, has important health implications, particularly in areas where water may lack sufficient mineral levels.
In many regions, particularly in the Arabian Gulf countries, there are significant challenges related to water scarcity due to limited natural freshwater resources, arid climates, and rapidly growing populations. These factors have led to a reliance on alternative water sources and technologies to meet both domestic and industrial demands. The Kingdom of Saudi Arabia (KSA) faces unique challenges due to the country’s arid climate, vast desert landscape, and extreme temperatures, leading to a persistent water shortages. The KSA’s water is sourced primarily from desalination, which supplies approximately 67% of the country’s municipal freshwater demand due to limited natural freshwater resources. For agriculture, about 80% of water comes from non-renewable groundwater, while the remaining 20% is sourced from regenerated or treated wastewater, amounting to roughly 2.2 billion cubic meters per year. Overall, 23% of total water consumption is attributed to municipal use, with the industrial sector consuming the remaining 8% [
8]. Jeddah, one of Saudi Arabia’s largest cities, heavily relies on desalination, with nearly 95% of its municipal water supply coming from this process. Between 2009 and 2018, the city had an average monthly supply of 31.5 million cubic meters and an annual consumption exceeding 373 million cubic meters [
9]. This reliance on desalination underscores the importance of evaluating water quality and mineral content, particularly given the widespread use of water filtration and purification systems in households.
The KSA government addresses water scarcity through a variety of efforts. In addition to large-scale desalination, there is extensive infrastructure development for transporting water to inland areas. Following the global success of CWF in reducing the prevalence of dental caries, the Saudi Ministry of Health’s adopted the concept of water fluoridation by implementing fluoride addition in the water networks of major cities across the Kingdom, with a target range of 0.6–0.8 ppm and a maximum level of 1.5 ppm [
10]. To encourage efficient water use, the government also runs conservation campaigns and invests in advanced technologies like solar-powered desalination. These strategies aim to ensure a reliable water supply despite the country’s dry climate and growing population. In response to water scarcity, many residents rely on storage units, which, due to prolonged storage times, can lead to microbial growth and chemical changes, potentially compromising water quality. Consequently, this has led residents to rely more on bottled water. Beyond losing the benefits of fluoride available in public water supplies, studies have reported inconsistent fluoride levels across different bottled water brands, further emphasizing the need for effective water filtration solutions.
The water filtration and purification system (WFPS) market has grown rapidly, particularly in the U.S., where it has nearly doubled over the past five years due to rising concerns about tap water safety and quality [
11]. WFPSs typically involve filtration, purification, or their combination to treat water. Filtration methods use a porous substance to remove specific components, from sediment to chemicals, depending on the filter’s characteristics. Activated carbon is commonly used in these filters. Compared to water purification systems, which may include advanced processes like ultraviolet disinfection, reverse osmosis (RO), and distillation, water filters are generally less expensive. It is important to note that water softener systems, which use ion exchange to replace health-promoting minerals like calcium and magnesium with sodium, should not be classified as WFPSs [
12].
WFPSs can be categorized into three types: point-of-entry, point-of-use, and pitcher-type filters. Point-of-entry systems connect to the main water supply line and treat all water entering the home, while point-of-use systems, which are more affordable, attach directly to the water line under the sink or faucet. These systems use methods such as reverse osmosis, absorption (activated carbon), distillation, disinfection, and filtration. For instance, reverse osmosis systems use high pressure to force water through a semipermeable membrane, trapping contaminants, while distillation removes impurities by evaporating and then condensing water. Absorption involves passing water through activated carbon, which traps contaminants through adsorption. Pitcher-type filters, defined as pitchers filled from the top with built-in filters, are particularly popular due to their low cost and ease of use. These filters typically include replacement cartridges filled with activated carbon and ion-exchange resin, which manufacturers claim clean water through a three-step system: a mesh barrier to capture debris, activated carbon granules to improve taste by removing mercury and chlorine, and ion-exchange resin to trap copper, zinc, and cadmium ions [
12].
Research on the impact of WFPSs on fluoride, calcium, magnesium, potassium, and sodium concentrations in tap water remains limited and outdated, yielding conflicting results, with no studies specifically assessing the prevalence of WFPS use among Saudi residents [
13,
14,
15,
16]. Therefore, the primary objectives of our study were to determine the frequency of WFPS use in Jeddah, Saudi Arabia, and assess the impact of these systems on the fluoride, calcium, magnesium, potassium, and sodium concentrations of tap water. Furthermore, we sought to examine whether there is a relationship between water insecurity (the population’s inability to meet personal water demands) and the use of WFPSs based on household water insecurity experiences (HWISEs), as water insecurity may be a key driver of WFPS adoption in the population [
17].
2. Materials and Methods
2.1. Ethical Approval
The present study took place at the King Abdulaziz University Faculty of Dentistry (KAUFD), Jeddah, KSA, from December 2023 to March 2024. Before conducting the study, the KAUFD Research Ethical Committee approved the proposal (no. 1160623).
2.2. Recruitment
Recruitment for the study was informed by data from the General Authority of Statistics in KSA, indicating that the population in the Makkah region was approximately evenly split between Saudis (52.21%) and non-Saudis (47.79%). This demographic distribution was taken into account to ensure a diverse participant sample. The study sample consisted of 99 participants, of whom 56% were Saudi and 41% were non-Saudi. Participants were recruited at the KAFUD, with participation open to anyone attending the school, including staff, faculty, students, and patients. The inclusion criteria included participants using tap water with or without a WFPS. Participants who did not use tap water in their daily routine (for drinking, cooking, and preparing beverages) and relied solely on bottled water could not participate in the study.
2.3. Questionnaire and Water Collection
The present study utilized an anonymous questionnaire that was based on a previously validated questionnaire developed by the Institute for Policy Research at Northwestern University. The questionnaire was content validated by three experts in the field and face validated by pilot testing it with a focus group (N = 15), and adjustments were made based on their feedback.
The questionnaire consisted of the following eight sections: (1) demographics, (2) water sources used and preferences for cooking and drinking, (3) WFPS usage, (4) type of WFPS installed or used, (5) awareness of water fluoridation, (6) opinions on water fluoridation, (7) whether they prefer WFPSs to remove fluoride, and finally (8) their household water insecurity experiences (HWISEs).
Two versions of the questionnaire were available, one in Arabic and one in English. Along with the questionnaire, each participant received a water collection kit, which included a plastic bag with two 20 mL vials for collecting water samples from their drinking water, whether tap water, water from an WFPS, or both if applicable. Each vial was labeled with a unique number (unique no. Vial “1” and unique no. Vial “2”) and the corresponding unique number from the questionnaire to link the questionnaire to the vials.
Based on the responses regarding using any form of WFPS, participants were prompted to select the appropriate vials. If they answered “yes” to using any type of WFPS, they provided a water sample from each WFPS they used at their home and wrote the corresponding number on the vials in the questionnaire section that matched the system they used. If they answered “no” to using any type of WFPS, they simply filled the vial labeled with the number “1” with water directly from the tap.
Instructions were given verbally by the study team and were also written in the questionnaire, with accompanying pictures to aid in the clarification of the process. All questionnaires were checked for data completeness, and missing information was obtained either during a one-on-one interview at the time the vials were returned or through phone contact. The questionnaire is provided as a
Supplementary File.
After collecting the questionnaires and water samples, the samples were always stored at room temperature. The samples were shipped to the United States, where the analysis was conducted at the Oral Health Research Institute (OHRI) of the Indiana University School of Dentistry, Indianapolis, IN, USA.
2.4. Fluoride Analysis
The fluoride concentration in all samples was measured using a fluoride ion-selective electrode (Orion #96-909-00) following the method outlined by Martínez-Mier et al. [
18]. Each water sample was prepared by adding 1 mL of total ionic strength adjustment buffer II (Fisher Scientific, Waltham, MA, USA) to a 1 mL aliquot of the sample, all contained within a 7 mL polyethylene vial (Fisher Scientific). The mixture was then homogenized using a vortex mixer and placed under the electrode for measurement. The resulting millivolt reading was then compared against a standard curve to determine the fluoride concentration. The detection limit was 0.01 ppm; accuracy was >95%; and precision, calculated as the percentage coefficient of variation, was <5% across all analysis days.
2.5. Calcium, Magnesium, Potassium, and Sodium Analyses
The concentrations of calcium, magnesium, potassium, and sodium were measured using an atomic absorption spectrometer (ICE 3000 series, Thermo, Oxford, UK) equipped with background correction via a deuterium lamp and specific cathode lamps set at wavelengths of 422.7 nm for calcium, 285.2 nm for magnesium, 589.0 nm for sodium, and 766.5 nm for potassium. The standard solutions were prepared to cover the entire measurement range, ensuring linearity in the calibration curve. Each sample was prepared in 7 mL polyethylene vials (Fisher Scientific). For calcium analysis, 1 mL of lanthanum chloride was added to each sample. The water samples were tested in volumes tailored to keep the measured concentrations within the pre-established measurement range: 0.25 mL for calcium, 0.05 mL for magnesium and potassium, and 0.20 mL for sodium [
19,
20]. The detection limit was 0.1 ppm; accuracy was >95%; and precision, calculated as the percentage coefficient of variation, was <7% for all metals and across all analysis days.
2.6. Statistical Analysis
Associations of age, number of household members, and HWISE total score with use of water filtration or not were tested using Kruskal–Wallis nonparametric tests. The association of education with the use of water filtration or not was tested using a Mantel–Haenszel chi-squared test for ordered categorical data. The associations of Saudi citizenship or not with the use of water filtration or not was tested using a chi-squares test. Comparisons between water sources regarding levels of fluoride, calcium, potassium, magnesium, and sodium were made using nonparametric tests based on a generalized estimating equation (GEE) model for ordinal outcomes; these comparisons were limited to reverse osmosis versus unfiltered tap water because of limited sample sizes for other water sources. Comparisons for differences in minerals were made using GEE models for ordinal outcomes. A two-sided 5% significance level was used for each test. Analyses were performed using SAS version 9.4 (SAS Institute, Inc., Cary, NC, USA).
A sample size of 100 subjects was selected for this study. The actual distribution of the WFPS responses was unknown prior to conducting the survey, so a precise sample size justification could not be performed. For the calculations, we assumed the fluoride levels to be log-normal with a coefficient of variation of 1.0. Based on a two-sample test for the ratio of means with a two-sided 5% significance level, sample sizes of 24 per subgroup would have 80% power to detect a 50% reduction in fluoride (ratio of means = 0.5). These calculations provided evidence that the study had sufficient power to compare fluoride levels between subjects with and without WFPSs and between types of WFPS.
3. Results
3.1. Demographics and Response Rate
The target number for participant recruitment was 100. Ninety-nine participants returned their questionnaires and vials, accounting for a response rate of 99%. However, two participants provided incomplete questionnaire data. For demographic details of the participants, please refer to
Table 1.
3.2. Water Usage
For drinking water, 86% of participants reported they never drink unfiltered water from the tap, while 35% always drink filtered water from the tap, and 44% always drink bottled water. When asked about the source of water for preparing drinks (such as beverages, tea, coffee, etc.), 65% said they never use unfiltered water from the tap, 50% always use filtered water from the tap, and 27% always use bottled water.
For cooking, 68% stated they never use unfiltered water, while 54% said they always use filtered water, and 23% reported they always use bottled water (
Table 2).
3.3. Water Sources, Awareness, and Attitudes Toward Fluoride Removal
Ninety-four percent of the participants used water from the National Water Company (desalinated seawater). When asked if they knew whether their drinking water contained fluoride, 84% said they did not know, 13% answered yes, and 3% claimed their water did not contain fluoride. Regarding their preference for fluoridated water, 29% preferred it, 13% did not, and 58% were unsure.
Overall, 60% of the participants confirmed using some type of WFPS, while 34% did not. According to the responses received, the most common WFPSs used by participants, in descending order, were RO systems (62%), carbon filters (whole house) (8%), faucet-mounted filters (6%), and water from the fridge or other sources (2%). The majority of participants (61%) did not care whether their WFPS removed fluoride, while 18% preferred their WFPS to remove fluoride, and 21% preferred fluoride in the water.
3.4. Household Water Insecurity Experiences (HWISEs)
The majority of respondents (89%) never worried about water-related issues. On a similar note, 81% reported no interruptions, “never” experiencing water problems. Only one respondent experienced interruptions “many times” (11–20 times). Likewise, 94% of participants never had to change their plans because of water issues. Regarding hand hygiene, 96% never had trouble washing their hands due to water shortages, and 98% always had enough water to drink. Moreover, emotional responses to water security were minimal, with 94% of participants never feeling anger-related emotions due to water issues. All participants reported never feeling shame due to water problems. Overall, the results of this survey indicate a general feeling of security about the water supply, with a few facing challenges occasionally (
Table 3).
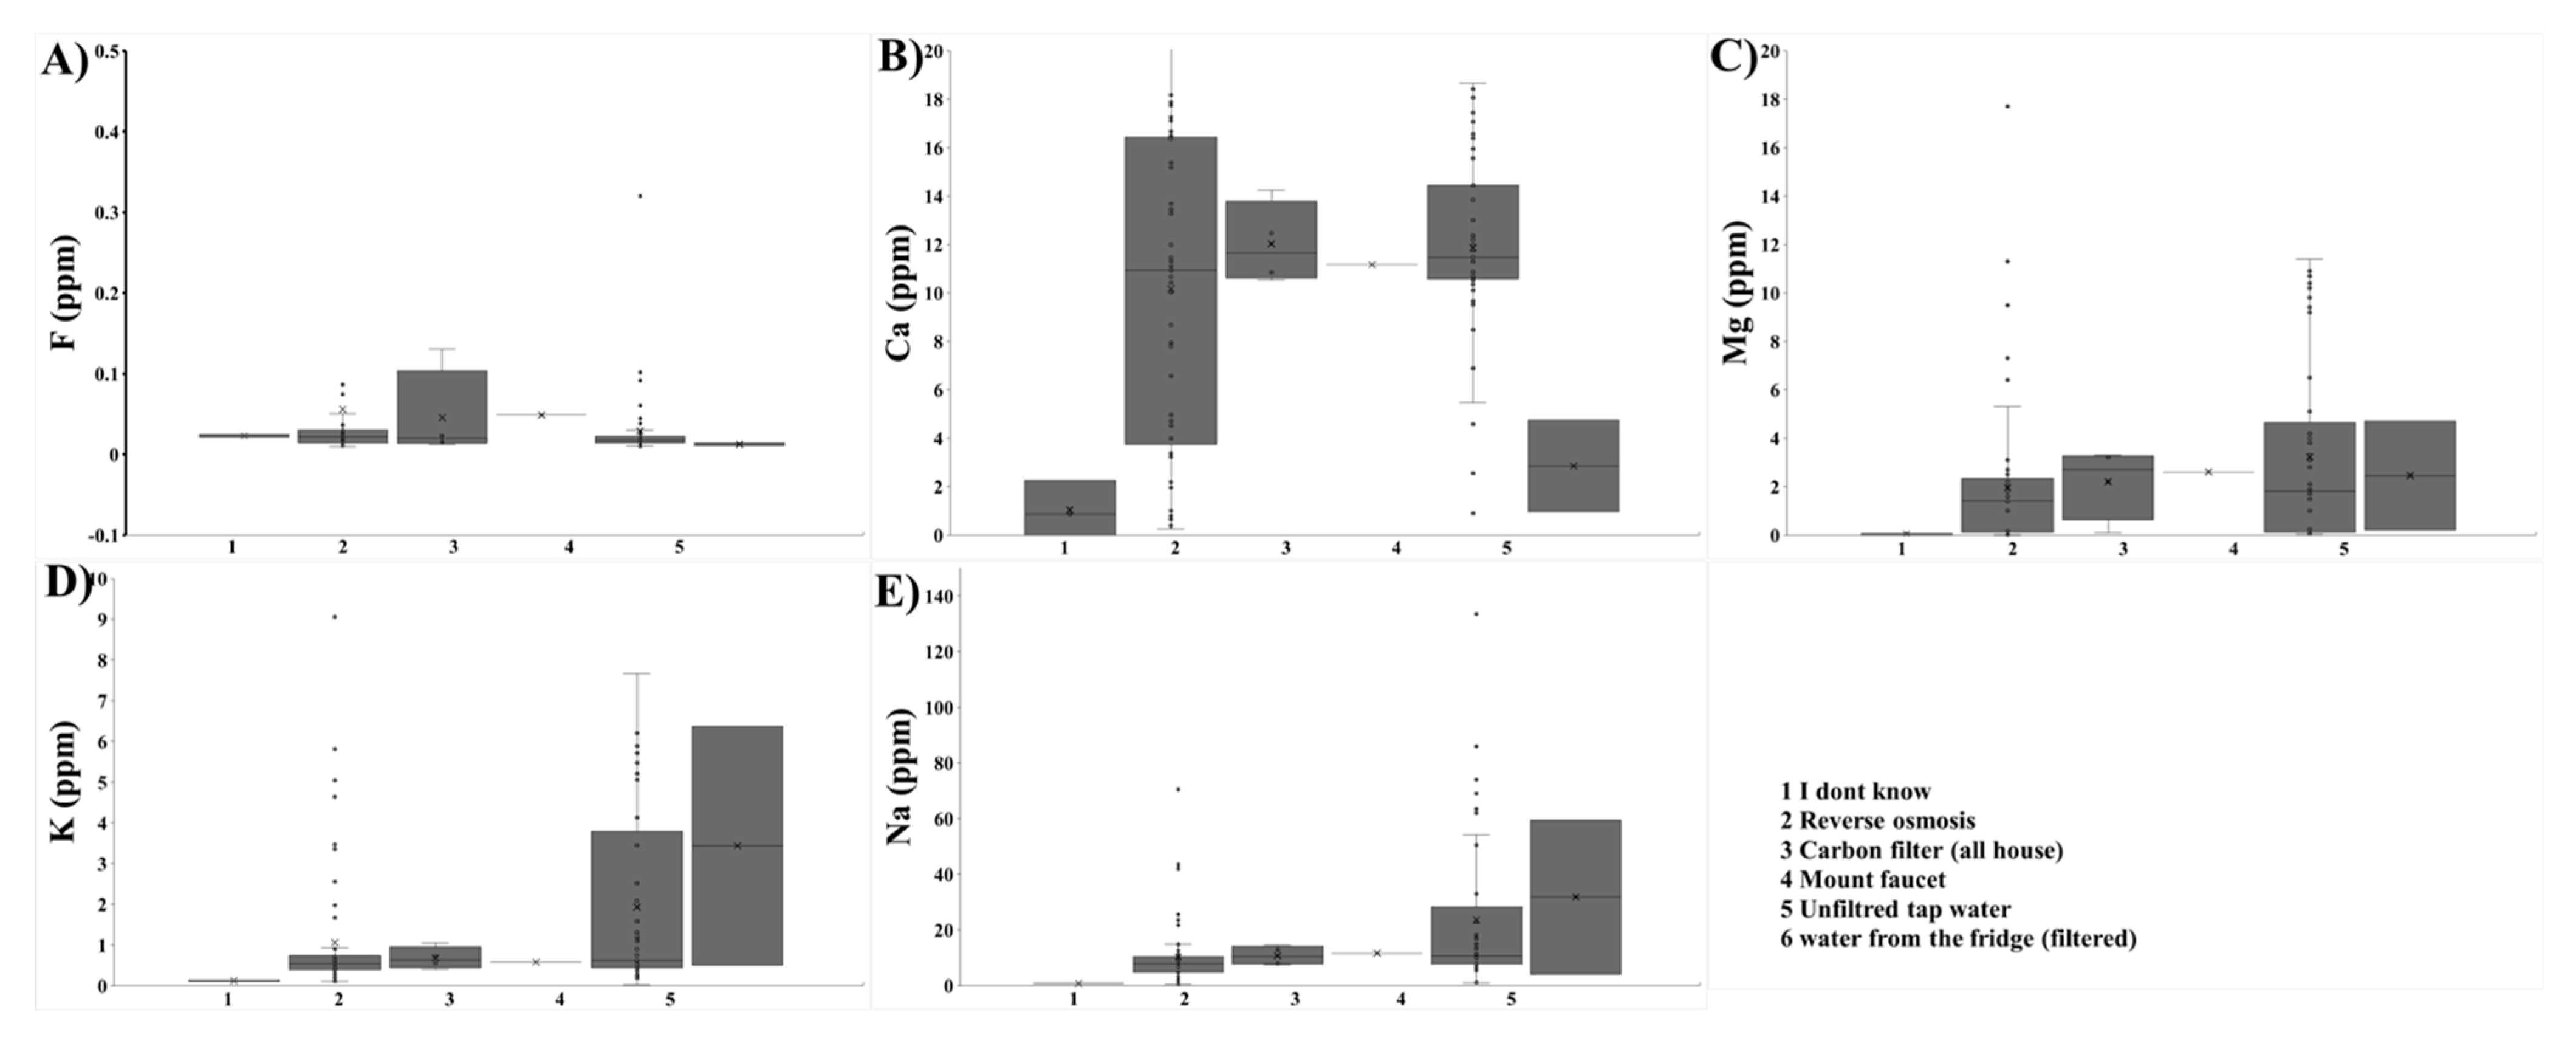
3.5. Effect of WFPSs on Studied Minerals (Figure 1)
Almost all participants provided samples from an RO system (N = 57) or unfiltered tap water (N = 49); four samples were tested from whole-house carbon filters, one sample was tested from a faucet-mounted filter, and two participants provided samples but did not report the source.
Fluoride: The median fluoride concentrations were as follows: Water from participants who answered “I don’t know”, as well as RO, whole-house carbon filter, and unfiltered tap water, had a median of 0.02 ppm. Filtered water from the fridge had a median of 0.01 ppm, while faucet-mounted filters showed a median of 0.05 ppm.
Calcium: Both RO and unfiltered tap water showed the highest median calcium levels, with reverse osmosis water at 10.93 ppm and unfiltered tap water at 11.47 ppm (p = 0.072). In contrast, filters installed in the fridge showed a much lower median level at 2.85 ppm, and those from participants who answered “I don’t know” had a median level of 1.56 ppm.
Magnesium: Samples from participants who answered “I don’t know” had the lowest median value at 0.07 ppm, followed by RO water at 1.40 ppm and unfiltered tap water at 1.80 ppm. Compared to those is unfiltered tap water, the magnesium concentrations in reverse osmosis systems were statistically significantly lower (p = 0.006).
Potassium: Similarly, samples from participants who answered “I don’t know” had the lowest median value at 0.12 ppm, followed by reverse osmosis water at 0.55 ppm and unfiltered tap water at 0.62 ppm. The reduction in potassium levels was significant in RO systems when compared to levels in unfiltered tap water (p = 0.016).
Sodium: Samples form participants who answered “I don’t know” had the lowest median value at 0.75 ppm, followed by reverse osmosis water at 7.88 ppm and unfiltered tap water at 10.60 ppm. Like magnesium and potassium, RO systems significantly removed sodium from tap water when compared to unfiltered tap water (p = 0.001).
3.6. Impact of Respondent and Household Characteristics on WFPS Usage
The statistical test demonstrated that participants with a larger number of household members were more likely to use tap water treatment systems (p = 0.002). Age (p = 0.874), Saudi citizenship (p = 0.254), education (p = 0.300), and HWISE total score (p = 0.671) were not significantly associated with using tap water treatment systems.
4. Discussion
This study highlights the effect of WFPSs on the mineral content of tap water in Jeddah, Saudi Arabia. The main objective was to evaluate the prevalence of WFPS usage and its effect on fluoride, calcium, magnesium, potassium, and sodium. Understanding the impact of WFPS on mineral retention in tap water helps to address gaps in water treatment practices in a region with distinct environmental and health challenges.
Surprisingly, our results showed that the fluoride concentration in unfiltered tap water was significantly below the recommended level of 0.7 ppm, contrasting with the Ministry of Health’s claim of fluoridating the water supply of major cities [
10]. This discrepancy could be due to inconsistencies in the water treatment process or variations in fluoride concentrations between different regions and water sources. One major factor is Saudi Arabia’s reliance on desalinated seawater, which naturally contains minimal fluoride. Studies have reported fluoride levels in desalinated water to be as low as 0.14 ppm, significantly below the recommended range of 0.5–1.0 ppm for hot climates [
21]. Additionally, the absence of a nationwide CWF program means that naturally low fluoride levels remain unadjusted, contributing to suboptimal concentrations in public water supplies. Regional differences in fluoride levels have also been documented, with concentrations ranging from 0.3 ppm in Jeddah to as high as 2.5 ppm in Makkah, highlighting disparities based on water sources and treatment practices [
22]. Another possibility is that the water may have undergone additional filtration at the household or municipal level, further reducing fluoride levels before reaching the tap. The widespread use of WFPSs, particularly RO systems, significantly decreases fluoride concentrations, as these systems are designed to remove minerals and contaminants [
23]. Additionally, water system maintenance issues, such as aging infrastructure or inadequate monitoring, may lead to fluctuations in fluoride levels that deviate from the Ministry of Health’s target range. These combined factors contribute to the consistently low fluoride levels observed in this study, underscoring the need for further evaluation of fluoride supplementation strategies to ensure adequate exposure for dental health.
The findings also revealed that most participants were unaware of the fluoride content in their drinking water. This could be because fluoride is not something most people actively think about when considering water quality. Many are more concerned about contaminants like lead or bacteria, which are more widely publicized. Additionally, there may be a lack of public education about the benefits of fluoride and its presence in tap water, or consumers may assume that tap water is generally safe without needing to know specific mineral levels. The general indifference of participants regarding whether their WFPSs remove fluoride can be explained by their focus on other water contaminants, such as chlorine, sediments, or heavy metals, which are often marketed as harmful. Many people may prioritize this over fluoride, especially if they do not fully understand fluoride’s role in dental health, or they might have misconceptions that all water should be free of additives, including beneficial ones like fluoride. The results also showed that the majority of the participants were WFPS users, with RO systems being the most commonly used; this could be because these are the most widely available systems in Saudi Arabia. In the present study, it was observed that households with more members were more likely to use WFPSs. Large family sizes are common in Middle Eastern countries like Saudi Arabia (KSA), in contrast to Western cultures. In the KSA, most children continue living in the family home until they marry or find employment in another city or region, which requires them to relocate. As the household size increases, so does the water demand, influenced by a variety of social and economic factors. In the context of Saudi Arabia, Vision 2030—a national development plan aimed at reducing the country’s reliance on oil by diversifying the economy and improving social infrastructure—also plays a role [
24]. This initiative has introduced reforms that impact household dynamics, such as empowering women in the workforce, increasing urbanization, and promoting economic opportunities. These changes can affect household water usage patterns as growing families, single-parent households, and widowed individuals adapt to evolving social and economic circumstances. For example, the introduction of a value-added tax (VAT) at 5% in 2018 and its increase in 2020 could have prompted families to seek more cost-effective water solutions. This rationale may explain why some families are increasingly opting for WFPSs in their homes to manage expenses more efficiently.
In addition, the significant reduction observed in magnesium, potassium, and sodium levels compared to those unfiltered tap water, despite fluoride levels remaining consistently low across all water sources, could be because the fluoride levels in unfiltered water were already low in the first place, therefore leaving little for filters to remove. To the authors’ knowledge, this is the first study to investigate the prevalence of WFPS usage and its effects on various nutrients, in addition to fluoride, in tap water in Jeddah, KSA. The findings showed that RO systems, the most commonly used among participants, consistently removed all tested minerals, although they did not completely remove calcium. A reduction in calcium was observed but did not reach statistical significance. Several factors could explain this exception. First, membrane selectivity might play a role, as some RO membranes are less efficient at removing divalent ions like calcium due to their specific configuration or material properties. Additionally, water chemistry factors, such as pH, temperature, or the presence of other substances, could influence calcium retention, as calcium might exist in a form that does not easily pass through the membrane. The condition of the membrane, including potential fouling or scaling, could also impact its performance by retaining more calcium due to deposits on the membrane surface. Finally, some RO systems are designed with a partial bypass or blending feature that allows small amounts of untreated water containing calcium to mix with filtered water, thus maintaining certain mineral levels for taste or nutritional value.
Although limited in number, several studies have attempted to evaluate the effectiveness of various WFPSs in removing fluoride and other minerals from drinking water. These studies offer valuable insights into the performance of different filtration technologies under varying conditions, highlighting the strengths and limitations of each approach. For instance, a study from Riyadh, KSA [
25], showed that most RO water filtration systems substantially reduced fluoride levels, with reductions ranging from 1.1% to 83.3%, depending on the filter. Advanced filters (with 4, 5, 6, and 7 stages) were particularly effective. Moreover, in 1991, Brown and Aaron [
26] evaluated various water filtration systems, including reverse osmosis, distillation, and carbon filters. They found that all filters reduced fluoride levels significantly, with distillation systems achieving the highest reduction (99%), followed by reverse osmosis (84%) and carbon filters (81%). Similarly, Jobson et al. [
27] examined the effects of RO, distillation, and carbon filters on fluoride levels, with RO filters showing the highest fluoride removal, followed by distillation. This study also revealed that carbon filters, especially the brand-name PUR system, removed significant amounts of fluoride. However, this finding regarding the PUR system contrasts with the American dental association (ADA) endorsement, which claims that the PUR system does not remove fluoride [
28]. This discrepancy suggests a need for the further evaluation of these systems to clarify their efficacy. In contrast to the aforementioned studies, a study conducted in Bauru, Brazil [
29], focused on activated carbon filters and found no significant difference in fluoride concentration between filtered and non-filtered water samples across nine regions. This outcome highlights the variability in filter performance and the importance of considering regional differences and specific filtration technologies when assessing the impact on fluoride levels.
In another study conducted by the same authors at the Indiana University School of Dentistry in Indianapolis, Indiana, USA, the same methods used in this study were applied. Both studies showed that reverse osmosis systems had the most significant impact on reducing mineral concentrations, with the exception of fluoride. However, a direct comparison of fluoride levels between the two studies was not possible because in the present study, the unfiltered tap water did not exhibit a significant level of fluoride to begin with. As a result, assessing the impact of WFPSs on fluoride concentration was not possible [
30]. In the Indianapolis study, it was found that a high percentage of participants were WFPS users, similar to the findings of the current study. However, unlike the present study, the most commonly used system in the Indianapolis study was the water pitcher filter, likely due to its ease of use and affordability. Notably, the current study did not report any use of water pitcher filters among participants, which may reflect the limited availability or popularity of such systems in the Saudi market. Instead, RO systems were the most frequently used in the current study.
The study had several strengths. Unlike studies focused on a single type of WFPS, this study collected water samples from the actual systems used by participants in their homes, providing a more realistic representation of what is commonly used by the population. This study employed the recommended approach for measuring fluoride concentrations in water [
18]. Furthermore, this study not only examined fluoride but also included other minerals that may contribute to overall health. The HWISE scale was also incorporated into the survey. Although no connection was found between the use of WFPSs and water insecurity in this study, we believe that this tool could be valuable in future studies with larger sample sizes and broader geographic coverage, particularly in potentially underserved areas. We acknowledge several limitations of the present study. The limitations of this study, including the small sample size, lack of detailed filter information, and single-repetition mineral concentration measurements, may have influenced the findings in several ways. A small sample size reduces the statistical power of the study, making it more challenging to detect significant differences between groups and potentially limiting the generalizability of the results to the broader population. With only 99 participants, the study may not fully capture the diversity of water filtration and purification system (WFPS) usage patterns across Jeddah or account for variations in household water sources and consumption behaviors. Additionally, the absence of detailed information about the filters used—such as brand, model, filter age, and maintenance history—introduces uncertainty regarding the extent of filtration and mineral removal. Different WFPS brands and models vary in their effectiveness at removing fluoride and other minerals, while factors such as filter age or inadequate maintenance could lead to inconsistent performance, affecting the accuracy of mineral concentration measurements. Without this data, it is difficult to determine whether the observed reductions in fluoride, magnesium, potassium, and sodium levels were due to the filtration process itself or external factors such as filter efficiency degradation over time.
Another limitation of this study is that mineral concentration measurements were conducted using a single repetition per sample rather than multiple replicates. While the analytical methods employed—including fluoride ion-selective electrodes and atomic absorption spectrometry—are well established for their accuracy, the lack of repeated measurements may introduce variability, potentially affecting the precision of the reported concentrations. Conducting multiple repetitions per sample would have strengthened the reliability of the findings by accounting for potential measurement inconsistencies. Future studies should consider incorporating triplicate or duplicate measurements, along with larger sample sizes and comprehensive data collection on WFPS characteristics, to enhance the robustness of the data and ensure greater reproducibility
To address these gaps, future studies would benefit from having study team members visit participants’ homes to collect water samples and obtain more accurate filter information. Future studies should be conducted on a larger scale and include options not covered in the present study, such as water pitcher filters. These filters may offer a better alternative to systems that aggressively remove all minerals from the water while remaining affordable for consumers. Additionally, regulatory bodies, such as the directors of regional water companies, should be informed about the importance of maintaining optimal fluoride and mineral levels in public water supplies and how the public perceives the safety of tap water. Such efforts can reduce the reliance on bottled water, minimize plastic waste, and improve public dental health. Furthermore, future studies should aim to assess the potential health impacts of reduced mineral concentrations in drinking water by incorporating clinical and dietary data. A follow-up study can explore the correlation between WFPS usage, mineral intake, and health outcomes to provide a more comprehensive understanding of the long-term effects of water filtration on public health.


 ,
, 


