Abstract
In the last 50 years, the metropolitan area of the capital city of San Luis Potosí has experienced, like other cities in the world, a rapid growth in urban settlements due to various causes. In this context, vertical housing developments, both residential and for living purposes, have been emerging successively in different parts of the metropolis, while at the same time a water deficit is increasing, from which it becomes insufficient to meet the demands for the coming years. Using several case studies with such characteristics, as well as other aspects like gentrification traits, and through a comparative qualitative analysis that incorporates empirical socioeconomic observations, along with processes in geospatial analysis, this article investigates the impact these types of urban developments have on the distribution of drinking water among the different sectors served by the municipal water utility in order to gain a clear understanding of water volumes accessible to the population of San Luis Potosí City, considering the looming impact of increasing traces of the gentrification phenomenon.
1. Introduction
Between the 1960s and 1970s, the capital city of San Luis Potosí experienced a significant population growth due to causes primarily related to the arrival of industries from other parts of Mexico and abroad. Consequently, in addition to the increase in population, this series of events turned San Luis Potosí into a commercial hub, which today is beginning to show social phenomena that have their roots in various factors, including an unequal distribution of water across different parts of the metropolitan area of San Luis Potosí, excessive and residential real estate development on the slopes of the “Sierra de San Miguelito” Flora and Fauna Protection Area, along with a reduction of 66% in the availability of housing for residential use (mainly targeted at working-class families) in the last 12 years [1]. The last point also means that the few homes built during this period are less affordable due to their high costs and present poor living conditions [2].
Water scarcity is a globally significant phenomenon that has gained considerable attention in recent decades. It will be a problem affecting the entire global population, which is why international organizations such as the United Nations have taken action through the so-called Sustainable Development Goals (SDGs) to ensure that every individual in the 21st century continues to have universal access to water [3].
Social issues such as gentrification have only recently been addressed within the framework of social research, largely due to the fact that it is a global phenomenon [4,5,6,7]. While it is not a problem that started in the 21st century [8], the importance of its consequences is highly visible in urban environments [9,10]. Metropolitan areas like the city of San Luis Potosí are just beginning to show signs of its emergence, which so far are only reflected in the characteristics of residential real estate projects located in clearly defined geographical areas that act as commercial hubs, peri-urban settlements [11], and even places that, decades ago, were ejidal territories [12,13]. With the evident growth of urban coverage, the population has also been increasing. By the year 2020, the metropolitan area of San Luis Potosí had a population of just over 1,200,000 inhabitants, of which 48.4% were women and 51.6% were men, distributed across about 351,100 households. Although the population had practically multiplied nearly 10 times since the beginning of the second half of the 20th century, it is estimated that there is a demographic growth slowdown occurring in the state capital within the coverage area of INTERAPAS, but it is projected to happen within the next 20 to 25 years [14].
In addition to all the above, the demand for basic public services such as street paving, public lighting, police surveillance, drainage, and piped potable water has been growing due to the natural increase in population. As a result, there is also a significant lag in human settlements near the outskirts of the urban area.
Furthermore, another factor contributing to water supply issues in San Luis Potosí City, which goes beyond technical problems, is the public policy that has become politicized, with the direct consequences falling on the water utility serving the metropolitan area of the Potosí capital: INTERAPAS. Covering a total of 352,074 domestic water connections for the population of the metropolitan area, which represent 94.56% of the users it serves [15], as a municipal-level government entity, its public policies over the last few decades have lacked social rigor—highly influenced by decisions of the current ruling political class—that could improve the water supply networks in most of the neighborhoods that make up the urban sprawl [16]. This has translated into low levels of public trust, which ultimately results in poor revenue collection by the institution, which, if collected properly, could be used to improve the current state of the water distribution networks.
As if that were not enough, the conditions of various soil deformations, such as geological risks, and issues of subsidence observed in the San Luis Potosí valley further complicate the situation. This is because there is no clear geographical reference for where faults or geological fractures have caused disruptions to the hydraulic infrastructure that supplies resources to the population, meaning INTERAPAS has not been able to address 100% of water leaks. It is necessary for the intermunicipal water utility to restructure its objectives and practices through a perspective that seriously considers the diverse sectors of the city’s population. The best approach is through a scientific perspective that combines insights from both engineering and social sciences. Therefore, this article will discuss a methodology that proposes an innovative hybrid model between these two perspectives, which at first glance seem to have so little in common [17,18,19,20].
The economic advantages of gentrification can be directed for the benefit of the rest of the city, as long as it is through carefully structured programs, such as redistributive economic policies, that retain the existing population and its social fabric. This can be achieved by improving housing with social programs focused on good urban planning and promoting small businesses [21]. This social phenomenon can also be understood essentially as residential gentrification, which is imposed on other populations within a free-market context, through the promotion of its new residents and improvements in urban infrastructure and amenities, as well as the quality of housing [22].
Although it has had a significant group of critics, some authors argue that gentrification is a tool that can improve the conditions of current residents through inclusive renewal efforts [23,24,25]. This, in turn, has helped direct attention to a set of socio-spatial changes in cities that highlight and denounce the effects of neoliberal urbanism [26], calling for a political stance in the interpretation of metropolitan areas [27], or that gentrification is an unintended consequence of urban transformations aimed at making cities more sustainable and ensuring affordable housing for all their residents [28]. At the same time, others argue that it should be conditioned by the capacity of authorities to address it, in order to protect vulnerable groups [29,30]. Therefore, local governments are responsible for recovering deteriorated spaces, rather than leaving the conditions of housing policies in the hands of the market, which only maximizes private profits without considering social impacts [31,32,33,34]. In contrast, in other contexts, such as in European cities, the role of government has been to favor gentrification through different modalities, applying ambiguous public policies that fail to specify their intended beneficiaries [35,36]. Regardless of its consequences, gentrification is a concept whose origins can be widely debated [37], and due to the historical context of each area, especially in Latin America, it is necessary to address more suitable terms [38]. However, it is important to highlight the effects that are present in most cases: it leads to unnecessary and indirect cultural displacements of the population [39] and benefits more privileged individuals while harming or excluding the most disadvantaged in terms of environmental-, climatic-, commercial-, and health-related issues [40].
There are several ways to understand the relationship between the phenomenon of gentrification and the use and distribution of water for domestic consumption in cities: urban sprawl typically requires more water consumption compared to high-density urban settlements [41]; the distribution of the population must be carefully planned from a spatial logic of the city to prevent shortages in the regions of the hydrological basins that make it up [42] so that decision-makers in urban management can make better use of all water sources [43].
For the above reasons, the importance of this study lies primarily in detecting how the phenomenon of gentrification begins to take shape, by accurately describing its traits and common characteristics, which must be distinguished from urbanization as it occurs in developing metropolises.
2. Methodology
How do these projects affect the distribution of water among the inhabitants of San Luis Potosí City, and what is the role of water utility in all of this? The following methodology is proposed to answer this question:
- I.
- Identify the areas or real estate projects that exhibit characteristics of gentrification.
- II.
- What are the urban characteristics of these projects, and why would they be framed within the phenomenon of gentrification?
- III.
- Create a table of qualitative–quantitative aspects that provides a clearer understanding of the phenomenon and its significance in the development of the metropolitan area of San Luis Potosí.
- IV.
- Analyze the relationship between areas with signs of gentrification and their impact on the distribution of potable water.
Boldrini and Malizia, in their 2014 study [44] point out that, from a neoliberal perspective [45], there are seven patterns for the generation of a gentrification process, listed by letters for the subsequent use of a formula of necessary conditions and absence:
- P: Proximity to the commercial and financial hubs of a city.
- I: Although they are private sector projects, they are provided with infrastructure services by the public network.
- H: They generally occur in areas associated with a well-established urban image or the historical memory of the city, which have their own identity due to patterns that are quickly identifiable by the local population.
- A: They occur in deteriorated areas that involve the degradation or devaluation of neighborhoods.
- C: A strong investment of capital, generally from the private sector, in a well-defined space by entrepreneurs.
- F: Changes in the functional use of buildings to implement new commercial functions in the area.
- D: Finally, a direct or indirect displacement of the local population by other social groups with greater purchasing power or cultural differences, and their progressive relocation.
All of these characteristics have been studied and defined through an exhaustive social investigation conducted by the authors of the article, using qualitative techniques typical of the social sciences for studying complex phenomena such as gentrification. Each of these characteristics is outlined in Table 1, where through Comparative Qualitative Analysis, it is determined whether the 12 projects studied (Figure 1) in this article exhibit traits of this particular social phenomenon.

Table 1.
Boolean matrix to identify the traits of the gentrification process in some of the case studies in San Luis Potosí and Soledad de Graciano Sánchez.
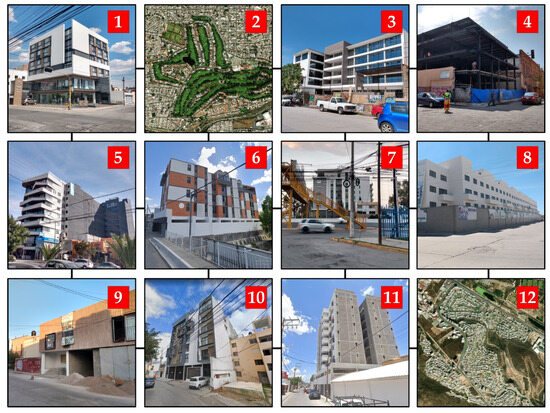
Figure 1.
Case studies in San Luis Potosí and Soledad de Graciano Sánchez.
As pointed out by Alonso Vázquez [46] and referencing Ragin [47], Qualitative Comparative Analysis “is a method that allows for comparisons between cases in a reduced N, fewer than a dozen or more—without reaching large numbers—in which binary comparison matrices are generated, meaning they reflect the absence or presence of conditions that are related to the outcome being investigated.” In other words, unlike the quantitative methods used in the exact sciences, which require hundreds or thousands of cases, this method is more useful when dealing with a small number of cases. Thus, the table is structured as follows:
It is notable that the columns with all “YES” values are four: Proximity to Commercial Hubs (P), Infrastructure Services from the Public Network (I), Private Capital Investment (C), and Changes in Functional Use (F). The equation that interprets these necessary conditions is
where “DevGentry” is the variable indicating the necessary conditions for the development of a gentrification process in San Luis Potosí capital, with these four characteristics allowing for a better understanding of phenomenon within the city, thus enabling decision-making in future residential real estate projects. However, another way to understand it is by summing the conditions of absence in the same table, meaning all the columns where there was no consensus to define all the case studies. These are the following:
where the variables Consolidated Urban Image or Places Associated with Historical Memory (H), Previously Deteriorated Areas (A), and Direct or Indirect Displacement of the Population due to New Construction (D), now marked with an apostrophe to indicate the absence of conditions, do not strictly occur in the metropolitan area of San Luis Potosí to trigger the development of a gentrification process.
DevGentry = P+I + C+F
DevGentry = H′ + A′ + D′
3. Analysis of Possible Causes of Inadequate Water Distribution
While it is clear which are the most significant case studies with gentrification traits, what is their impact on the distribution of potable water among the population of the metropolitan area of San Luis Potosí? This can be explained by several causes, such as their location in areas vulnerable to water leaks (due to geological faults or fractures), the current state of potable water networks, the location of wells operated by the intermunicipal agency that controls water distribution in the city (INTERAPAS), and the population density in the Basic Geo-statistical Areas (AGEB in Spanish).
According to the 2021 Urban Development Program of San Luis Potosí Population Center (the most recent version), there are approximately 20 geological faults and/or fractures due to subsidence within the capital (Figure 2), posing a high risk to San Luis Potosí population. The importance of locating these faults lies in the possibility of identifying areas with higher vulnerability to water leaks through the potable water supply networks. Several of these fractures are located at relatively shallow levels, so considering them within the geospatial analysis of real estate developments exhibiting gentrification traits, and their relationship to the distribution of this vital resource, is essential. It will provide a clearer perspective on the areas where significant leaks are more likely to occur due to the poor condition of the pipes. The city’s hydraulic systems and networks have already reached the end of their useful life, causing significant physical water losses [48].
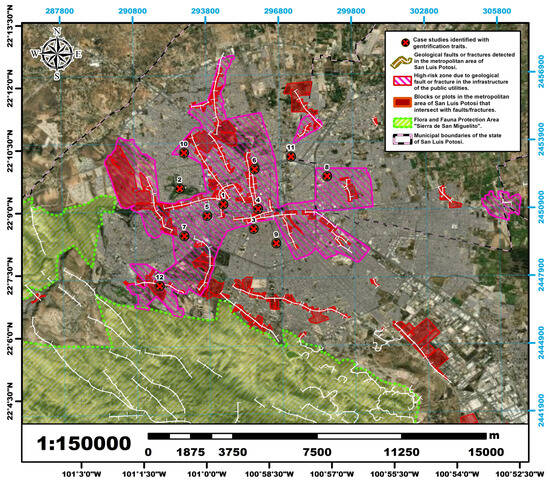
Figure 2.
Map of the metropolitan area of San Luis Potosí showing faults or fractures in the soil, as well as the areas where population is at risk due to them, according to the 2021 Urban Development Program of San Luis Potosí City.
In San Luis Potosí City, the agency responsible for water supply has granted permits that vary widely, from a few hundred cubic meters to several million per year. According to publicly available information from this agency, historical consumption data for each well has not been included, as they are not available. This lack of data is significant for the statistical analysis that was planned to better understand the relationship between historical water consumption and population growth in the Basic Geostatistical Areas.
Figure 3 shows the distribution of wells with public and private concessions based on the population density of the AGEBs where they are located. The population density of the city displays areas with high density (marked in red) alongside low-density zones (in blue), with very few areas of medium density. It is observed that wells tend to be located in high-population-density areas, and it is notable that much of the southern part of the metropolitan area of San Luis Potosí has no INTERAPAS concessions, except for one well near Park Tangamanga I and the Antonio Rocha Cordero Boulevard (Periférico Sur). Additionally, private concessions outnumber public ones by an approximate ratio of 4 to 1, and it is not always clear whether most of these private wells are still operational.
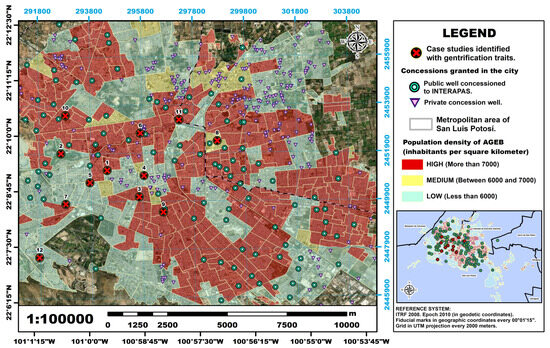
Figure 3.
Distribution of wells granted to INTERAPAS and their location in the AGEBs of San Luis Potosí City, with these areas classified by population density.
By comparing the 2021 INTERAPAS data with the information available on the CONAGUA website, a total of 133 concessions were recorded for that year, of which at least 100 are operational within the urban sprawl of San Luis Potosí City.
4. Results
Since the formal creation of INTERAPAS in 1996, as the public agency responsible for the integrated management of water in the metropolitan area of San Luis Potosí, technical parameters were established for the management of potable water, sewerage, sanitation, and related services, as well as economic aspects related to fees and tariffs. However, in the economic aspect, it was the State Government, through the State Congress, that was responsible for setting the costs without the support of experts or specialized knowledge on the subject [49].
Over the course of 27 years, an adequate proposal for sectorization of the city to allow for the efficient distribution of potable water to each home, while preventing the overloading of well services, has not been developed. Despite this, INTERAPAS has presented annual reports in which the administrative zones for user service and billing are organized into five areas: Centro-Sur, Poniente, Norte, Oriente, and Soledad de Graciano Sánchez. These zones are defined using streets and avenues with high traffic volumes. Based on this information, the five zones have been established to analyze water distribution, according to the corresponding Basic Geo-statistical Areas (AGEB), which can be observed in Figure 4.
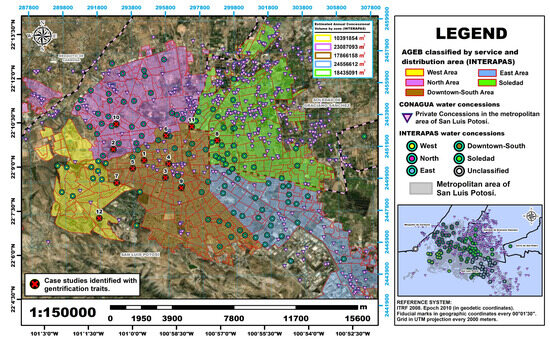
Figure 4.
INTERAPAS administrative zones, publicly and privately concessioned wells, and case studies with gentrification traits in the San Luis Potosí Metropolitan Area.
A total of 507 AGEBs are described in Figure 4, and their details are provided for each designated zone in the metropolitan area:
- Downtown-South: with a population of 294,215 inhabitants, 117 AGEBs, 19 public wells, and a total concessional volume of 17,866,158 cubic meters per year (19% of the city’s total volume). It has a population density of 7552 inhabitants per square km.
- West: with a population of 57,980 inhabitants, 34 AGEBs, 12 public wells, and a total concessional volume of 10,391,854 cubic meters per year (11% of the city’s total volume). It has a population density of 2921 inhabitants per square km.
- North: with a population of 258,725 inhabitants, 80 AGEBs, 28 public wells, and a total concessional volume of 23,087,093 cubic meters per year (24% of the city’s total volume). It has a population density of 7111 inhabitants per square km.
- East: with a population of 247,453 inhabitants, 126 AGEBs, 25 public wells, and a total concessional volume of 24,556,612 cubic meters per year (26% of the city’s total volume). It has a population density of 5335 inhabitants per square km.
- Soledad de Graciano Sánchez: with a population of 333,098 inhabitants, 135 AGEBs, 25 public wells, and a total concessional volume of 18,435,091 cubic meters per year (20% of the city’s total volume). It has a population density of 8288 inhabitants per square km.
The AGEBs of Escalerillas and the nearby rural colonies have not been included in this analysis because they are not connected to the municipal public network and receive water through tanker trucks. Although these tankers obtain water from public wells within the city (possibly from the well located west of Parque de Morales), a more detailed study is needed to thoroughly examine the situation in these areas in a future investigation.
Regarding the previously described zones, it is estimated that 1,191,471 inhabitants benefit from the public concessions, with a total of 94,336,808 cubic meters of water annually distributed among 109 wells (according to 2021 data) in San Luis Potosí capital. However, the actual volume extracted may be lower, as some wells do not operate every day or face technical issues that require maintenance. According to reports from the intermunicipal agency, the volume extracted in 2020 was approximately 89,700,000 cubic meters for the San Luis Potosí metropolitan area, Soledad de Graciano Sánchez, and Cerro de San Pedro.
Through an arithmetic operation, the amount of water granted per inhabitant per day can be calculated. The formula is expressed as follows:
L/Inhab./Day = ((Annual Volume) × 1000)/(Total Inhabitants) ÷ 365
The concessioned consumption for each zone is shown in Table 2 and will be compared to the total concessioned consumption of San Luis Potosí City, that is, 217 L per inhabitant per day. The following aspects are highlighted in the data analysis.
Table 2.
Concessional consumption vs. extracted volume by distribution zone according to INTERAPAS (2010–2020).
5. Discussion
It can be stated that the North and East zones are well-proportioned according to the calculated figure for the San Luis Potosí Metropolitan Area (ZMSLP), even slightly exceeding it. However, in the case of the East zone, it is important to consider that some of the wells also supply large industrial complexes and factories, which consume significant volumes of water annually, excluding the civilian population from these consumptions. Additionally, there are private concessions in the area that may reduce demand on public wells.
- The zone with the lowest water volume is Soledad de Graciano Sánchez, with 152 L per inhabitant per day. Only 14 L more, the Downtown-South zone registers 166 L per inhabitant per day. These figures are approximately 30% and 24% lower than the estimate for the total metropolitan area.
- Although the West zone represents only 5% of the population of the metropolitan area and 11% of public concessions, it has the highest volume of water granted per inhabitant per day, with 491 L, more than twice the average calculated for the entire city.
- Comparing water consumption between West and Soledad de Graciano Sánchez and Downtown-South, the per capita expenditure in West is three times higher. This means that the daily water consumption in neighborhoods in the West zone (such as Club de Golf La Loma, Villantigua, El Pedregal, Lomas 4ta. Sección) is three times higher than that of residents in neighborhoods such as Downtown, Julián Carrillo, San Sebastián, San Miguelito (Downtown), Satélite, Progreso, Nueva Progreso, Simón Díaz, 6 de Junio (Sur), Hogares Ferrocarrileros, San Francisco, and the Downtown of Soledad de Graciano Sánchez.
- Although the volumes granted do not necessarily reflect the actual volume of water delivered to the population (due to factors such as extracted volume, delivered volume, and leaks in the distribution network), these data provide a basis for understanding water consumption limits in the city and its different sectors. There are notable differences in social, economic, security, and public infrastructure conditions between the zones, highlighting the vast disparity between West and the rest of the administrative zones, as can be corroborated through empirical observations.
Although the AGEBs such as Escalerillas were not included in this analysis due to not being connected to the drinking water distribution network, journalistic documentation about the locality reveals that, in the first half of 2023, the San Luis Potosí City Council was sending between six and eight tanker trucks every two days to supply water primarily for domestic use. With each tanker having a maximum capacity of 10 cubic meters (10,000 L), this represents an effort to provide between 4800 and 6400 cubic meters during the mentioned period. This information can be verified with reports on the City Council’s social media, which reported a total of 41 days of tanker service between 3 March and 1 June of 2023, covering approximately half of the analyzed period.
In the 2021 San Luis Potosí Urban Development Program, the recharge zone of the aquifer supplying drinking water to the residents of the San Luis Potosí metropolitan area is defined. Approximately 84% of the water supply comes from underground sources. According to the CONAGUA report on the Average Annual Water Availability in the San Luis Potosí Aquifer (2411), published in December 2020, 96% of the extracted water comes from the deep aquifer, while only 4% comes from the shallow aquifer. Between 1972 and 1998, the shallow aquifer supplied 0.0 hectometers cubed (hm3) per year, compared to the 90.0 hm3 annually from the deep aquifer, whose extraction has progressively decreased due to the rapid growth of the San Luis Potosí metropolitan area.
As Cardona et al. point out in November 2006 [50], the deep aquifer experiences recharge periods that can last up to 5000 years, with variations depending on the areas analyzed, and they can even be longer. Therefore, it is crucial to define the spatial boundaries of the recharge area to prevent urbanization in these zones or, at the very least, to avoid real estate projects that could have an irreversible environmental impact.
Studies conducted in 2017 by researchers from the Autonomous University of Aguascalientes indicate that geological faults or fractures can act as discharge pathways for aquifers. Figure 5 shows significant geological fractures in the north, center, and south of the city, with some notable exceptions in the eastern part of Soledad de Graciano Sánchez. In some cases, these geological faults are visible on the urban surface, such as the fault that runs through the city from the Los Reyes neighborhood, passing through Industrial Aviación, El Sauzalito, and extending towards residential areas north of the urban sprawl.
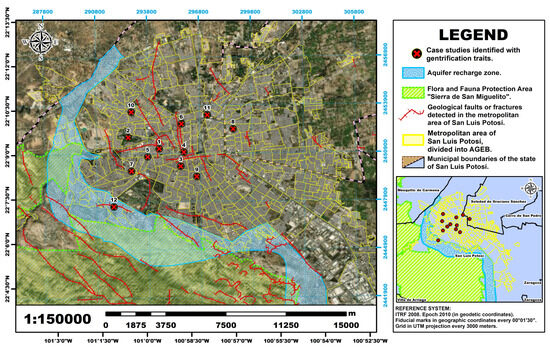
Figure 5.
Map describing possible recharge areas of the aquifer of San Luis Potosi City, and the most important faults or geological fractures.
Many of these fault lines or geological fractures have been hidden due to urban expansion, which has covered these areas with asphalt or buildings. However, some areas, such as the Sierra de San Miguelito, have remained relatively free from these disturbances. This is not the case in developments like Club de Golf La Loma or El Pedregal, where in the latter, there are large buildings, such as the Faculty of Science Building of the Universidad Autónoma de San Luis Potosí, which could see their integrity compromised, affecting not only the water and drainage pipes but also the internal structure of the buildings.
According to the Urban Development Program for the Population Center of San Luis Potosí, the recharge zone for the shallow aquifer is possibly located on the slopes of Sierra de San Miguelito. Although this aquifer represents only 4% of the water supply for domestic and residential use in the city, it is crucial that this area is preserved free from urban activities, as the shallow aquifer serves as a recharge source for the deep aquifer.
Therefore, the lower parts of the Sierra de San Miguelito are vital for both the recharge of the shallow aquifer and the ecological preservation of the region and, by extension, of the city itself [51]. This is due to two main reasons: first, because the geological faults in the area can act as channels that facilitate water infiltration into the underground [52]; and second, because the Sierra de San Miguelito is part of the Flora and Fauna Protection Area, declared in 2021 by the Federal Government, which further strengthens its ecological importance [53].
In addition to this issue, as previously pointed out, geological faults or fractures could facilitate the infiltration of water into underground aquifers. Given that these faults are located in a key zone for the recharge of the aquifer in the capital of San Luis Potosí, the implementation of residential real estate projects, as described in Table 1, could have a negative impact on the distribution of drinking water in the near future, endangering the stability of the city’s water resources. Eventually, this implies that social inequalities, rather than decreasing, will increase among the different sectors that make up the city [54,55,56,57].
In addition to the above, the unequal distribution of water is more evident and problematic in the southwestern part of the city, such as in Escalerillas [58], as it is located just a few thousand meters away from the high-value residential areas of the urban sprawl. In real terms, there is an urgent need for the water utility and municipal government authorities to urgently plan urban development, considering the water networks as a key pillar of such planning, assessing their current operational status, as well as the social conditions in areas that have not been properly provided with adequate drinking water distribution. From this perspective, the service billing system, which has shown persistent inefficiency across many administrations, should be improved. By extension, similar cities in Mexico, Latin America, and other parts of the world that share characteristics with the capital of San Luis Potosí could face a similar problem if the causes described in this article are dismissed or ignored.
Recently, the phenomenon of gentrification has been manifesting in various cities around the world, and particularly in our country, as a changing phenomenon that impacts the management and use of services, such as the distribution of water in this case.
6. Conclusions
The effects of the gentrification phenomenon are beginning to be reflected more and more in large cities and this phenomenon is not unrelated to recent impacts that are happening in various parts of the world. This is due on the one hand to the industrialization of cities, and on the other hand the aging of some cities and the desire to change their urban image, such as housing demands due to population growth, which involves finding new spaces for real estate developments or in many cases buying lots or old and abandoned houses, as well as to gain access to spaces in marginalized places. As well as the struggle for the purchase of land to change land use and convert it into new housing developments, which in perspective could be understood that the phenomenon of gentrification is not only associated with the displacement of social classes to build mostly vertical buildings in population centers, but to struggle of governments to address the problem of urban growth by taking advantage of space and not expanding cities, but to make them grow vertically.
However, one thing is the need for public utilities for urban development and another thing is to understand that the reflection of this phenomenon requires an increase in the use of necessary services and that sometimes demographics of cities no longer suffice with such services, as in the case of cities where it rains little per year and their water reserves are becoming scarce due to prolonged droughts, and with the water that is mostly supplied from deep wells with deficit supply, the management and distribution of water becomes a problem that is complex to solve.
This implies that detailed analyses of geographic zones and/or city distribution denominations that reflect considerable urban impacts should be detailed as an example for the understanding of their urban growth problems and the impacts reflected by the water supply problems in areas of the world that manifest them.
As pointed out by Cárdenas-Tristán and Galván-Medina [59], real estate development with gentrification traits impacts the use and distribution of drinking water, as demonstrated in their exploratory model that combines both qualitative and quantitative aspects. Therefore, in this analysis of residential developments such as Puerta de Piedra and El Pedregal, with the latter characterized by traits of gentrification, both are located in the southern part of San Luis Potosí City in an area that includes the recharge zone of the shallow aquifer, geological fractures and faults, areas vulnerable to risks for urban infrastructure, and the “Sierra de San Miguelito” Flora and Fauna Protection Area. The coincidence of these factors makes the area extremely vulnerable from both a hydrological and ecological perspective.
In addition to the previously mentioned factors, it is possible to refer to various statistics from national and international organizations to understand the complexity of the problems and deficiencies that give rise to the water consumption patterns reported in this research. In this context, the General Assembly of United Nations (UN) recognized, in 2010, the human right to access sufficient water to meet personal and domestic needs, establishing a range of between 50 and 100 L per person per day [60]; however, the same organization reports that the average daily consumption per person in Mexico is 366 L [61], which represents three times the minimum amount recommended as a human right. Other sources of information, such as the Survey on Household Drinking Water Consumption conducted by the National Water Commission (CONAGUA) in 2012, reported an average consumption of 182 L per person per day [62], a figure that corresponds approximately to half of the amount established by international agencies. The Building Regulations of San Luis Potosí Municipality (2009), in Chapter XXVI, Article 114, Section a, establishes that the minimum drinking water consumption in residential buildings must be 150 L per person per day [63]. Despite the disparities in the figures reported in all these reports and studies, the data reflects the daily realities faced by the citizens of a constantly growing city like San Luis Potosí: inequalities in water distribution arising from multifactorial phenomena. These causes include political decisions made by various government actors, disorganization in the information provided by the municipal authorities responsible for managing drinking water services, as well as the impact of demographic expansion and the increasing demand for housing. This complex interaction of factors underscores the urgent need for more efficient planning and management of water resources in the region.
As was constantly described in this paper, existing research that may point to the correlation between the phenomenon of gentrification and its impact on the use and distribution of drinking water in cities where the phenomenon has begun to take root is just beginning to manifest itself. Although the lack of water in the growing urban areas of the world is not solely due to the emergence of high-value real estate developments, this study aims to propose a perspective on how to address the problem, which could expand research lines not only in the fields of engineering, water management, and hydraulics, but also within the framework of social sciences and their impacts on urban development processes.
This challenge will continue to require various analysis processes, as it involves diverse issues related to the development of urban centers and the pursuit of their sustainability.
Author Contributions
Conceptualization A.C.-T. and S.A.G.-M.; methodology A.C.-T., S.A.G.-M., H.W. and O.R.-C.; software, A.C.-T., S.A.G.-M., H.W. and O.R.-C.; validation and formal analysis A.C.-T., S.A.G.-M., H.W., O.R.-C. and M.G.G.-M.; funding, A.C.-T., R.C.-A., O.R.-C. and M.G.G.-M.; writing—original draft preparation, A.C.-T. and S.A.G.-M.; writing—review and editing, all. All authors have read and agreed to the published version of the manuscript.
Funding
This work was supported by Mexican Council of Science and Technology (CONACYT) and by the department of geomatics engineering of the Universidad Autónoma de San Luis Potosí (UASLP).
Data Availability Statement
The original contributions presented in this study are included in the article. Further inquiries can be directed to the corresponding author.
Acknowledgments
The authors would like to thank the following institutions for providing information for this analysis: Comisión Nacional del Agua (CONAGUA); Organismo Intermunicipal de Agua Potable, Alcantarillado y Saneamianto (INTERAPAS); Instituto Nacional de Estadística y Geografía (INEGI) for providing hydrography and hydrology databases and basic geographic units (AGEB); and Environmental Systems Research Institute, Inc. (ESRI) for allowing the use of aerial and satellite imagery from their databases.
Conflicts of Interest
The authors declare no conflicts of interest. The funders were not involved in the project proposal, data capture, analysis, or writing of the manuscript.
Abbreviations
The following abbreviations are used in this manuscript:
| AGEB | Área Geostadística Básica |
| QCA | Qualitative Comparative Analysis |
| INTERAPAS | Organismo Intermunicipal de Agua Potable, Alcantarillado y Saneamiento |
| CONAGUA | Comisión Nacional del Agua |
| ZMSLP | San Luis Potosí Metropolitan Area |
| CONACyT | Consejo Nacional de Humanidades, Ciencias y Tecnologías |
References
- La Oferta de Vivienda Nueva en México se Redujo 66% en 12 Años: Tasvalúo. Available online: https://www.eleconomista.com.mx/econohabitat/La-oferta-de-vivienda-nueva-en-Mexico-se-redujo-66-en-12-anos-Tasvaluo-20221122-0094.html (accessed on 17 February 2025).
- “¿Se necesita Construir más Vivienda para Terminar con el Rezago Habitacional? La Mayor parte del Déficit Está en la Calidad de los Hogares”. Available online: https://www.eleconomista.com.mx/econohabitat/Se-necesita-construir-mas-vivienda-para-terminar-con-el-rezago-habitacional-La-mayor-parte-del-deficit-esta-en-la-calidad-de-los-hogares-20221101-0135.html (accessed on 17 February 2025).
- Organización de las Naciones Unidas. Informe de los Objetivos de Desarrollo Sostenible. 2023. Available online: https://unstats.un.org/sdgs/report/2023/The-Sustainable-Development-Goals-Report-2023_Spanish.pdf (accessed on 17 February 2025).
- Betancur, J.J. Gentrification in Latin America: Overview and Critical Analysis. Urban Stud. Res. 2014, 2014, 986961. [Google Scholar] [CrossRef]
- Hayes, M.; Zaban, H. Transnational gentrification: The crossroads of transnational mobility and urban research. Urban Stud. 2020, 57, 3009–3024. [Google Scholar] [CrossRef]
- Gould, K.; Lewis, T. Green Gentrification: Urban Sustainability and the Struggle for Environmental Justice, 1st ed.; Routledge: London, UK, 2016. [Google Scholar] [CrossRef]
- Frediani, J.; Tarducci, R.R.; Cortizo, D. Proceso de Gentrificación en Áreas Periféricas del Partido de La Plata, Argentina. Rev. Área Estud. Urbanos 2018, 9, 9–37. [Google Scholar]
- Janoschka, M.; Sequera, J.; Salinas, L. Gentrificación en España y América Latina: Un diálogo crítico. Int. J. Urban Reg. Res. 2014, 38, 1234–1265. [Google Scholar] [CrossRef]
- Hernández, M. La doble cara de la gentrificación. Entrevista a Silvio Schachter. Política Cult. 2018, 159–180. Available online: http://www.scielo.org.mx/scielo.php?script=sci_arttext&pid=S0188-77422018000100159 (accessed on 17 February 2025). [CrossRef]
- Sabatini, F.; Sarella-Robles, M.; Vásquez, H. Gentrificación sin expulsión, o la ciudad latinoamericana en una encrucijada histórica. Revista 2009, 180, 18–25. [Google Scholar] [CrossRef]
- Hernández, S. El periurbano, un espacio estratégico de oportunidad. Biblio3W 2016, XXI, 1–21. [Google Scholar]
- Ríos-Llamas, C.; Hernández-Vázquez, S. Ejidatarios frente al mercado de suelo: Urbanización y despojo en León y Guadalajara. Punto Cunorte 2022, 1, 15. [Google Scholar] [CrossRef]
- Haller, A.; Branca, D. La urbanización y la verticalidad de los vínculos rurales-urbanos en las montañas. Rev. Kawsaypacha Soc. Medio Ambiente 2022, 10, A-011. [Google Scholar] [CrossRef]
- INEGI. Panorama Sociodemográfico de San Luis Potosí. 2020. Available online: https://www.inegi.org.mx/contenidos/productos/prod_serv/contenidos/espanol/bvinegi/productos/nueva_estruc/702825197971.pdf (accessed on 17 February 2025).
- INTERAPAS. Informe Annual. 2023. Available online: https://interapas.mx/ (accessed on 17 February 2025).
- Naciones Unidas. Servicios Públicos Urbanos y Gestión Local en América Latina y el Caribe. Problemas, Metodologías y Políticas; Naciones Unidas y Cepal: Santiago, Chile, 2003. [Google Scholar]
- Kagan, J. The Three Cultures: Natural Sciences, Social Sciences and Humanities in the 21st Century; Cambridge University Press: Cambridge, UK, 2009. [Google Scholar] [CrossRef]
- Bunge, M. Las Ciencias Sociales en Discusión: Una Perspectiva Filosófica; Editorial Sudamerican: Buenos Aires, Argentina, 1999; ISBN 950071566X. [Google Scholar]
- Snow, C.P. The Two Cultures and the Scientific Revolution; Martino Fine Books: Eastford, CT, USA, 1959. [Google Scholar] [CrossRef]
- Castro, J.E. El estudio interdisciplinario de los conflictos por el agua en el medio urbano: Una contribución desde la sociología. Cuadernos Cendes 2007, 24, 21–46. [Google Scholar]
- ONU-Habitat. El Fenómeno de la Gentrificación. 2022. Available online: https://onu-habitat.org/index.php/el-fenomeno-de-la-gentrificacion (accessed on 17 February 2025).
- Parra, I.D. La gentrificación en la cambiante estructura socioespacial de la ciudad. Rev. Bibliográfica Geogr. Cienc. Soc. 2013, XVIII, 1030. Available online: https://www.ub.edu/geocrit/b3w-1030.htm (accessed on 17 February 2025).
- Karuri-Sebina, G.; Beckley, F. Gentrification in South Africa’s inner cities: Dignity takings requires restoration. Town Reg. Plan. 2023, 82, 4–17. [Google Scholar] [CrossRef]
- Anguelovski, I.; Connolly, J.J.T.; Pearsall, H.; Shokry, G.; Checker, M.; Maantay, J.; Gould, K.; Lewis, T.; Maroko, A.; Roberts, J.T. Why green “climate gentrification” threatens poor and vulnerable populations. Proc. Natl. Acad. Sci. USA 2019, 116, 26139–26143. [Google Scholar] [CrossRef]
- López-de-Obeso, J. Renovación Urbana y Gentrificación Controlada. Master’s Dissertation, School of Architecture, Housing and Urbanism, London, UK. Available online: https://jorgelopezdeobeso.com/wp-content/uploads/2012/05/renovacic3b3n-urbana-y-gentrificacic3b3n-controlada.pdf (accessed on 17 February 2025).
- Moore, R. Understanding “Gentrification” in Southeast and East Asia. Interdiscip. Stud. J. 2013, 13, 116–127. [Google Scholar]
- Hernández-Cordero, A.; Díaz-Parra, I. La gentrificación, un concepto trasatlántico: Diálogos entre España y México. Iztapalapa Rev. Cienc. Soc. Humanidades 2022, 43, 13–45. [Google Scholar] [CrossRef]
- Leino, H.; Wallin, A.; Laine, M. Eco-gentrification in a Welfare State: How Sustainable City Development Gradually Reduces Social Equity. Urban Aff. Rev. 2025, 61, 70–93. [Google Scholar] [CrossRef]
- Lu, S.; Rao, X.; Duan, P. The Rural Gentrification and Its Impacts in Traditional Villages—A Case Study of Xixinan Village, in China. Sustainability 2022, 14, 10077. [Google Scholar] [CrossRef]
- Gran-Castro, J.A. El impacto de la urbanización en la distribución socioespacial de la vulnerabilidad al cambio climático. Let. Verdes Rev. Latinoam. Estud. Socioambientales 2020, 27, 134–147. [Google Scholar] [CrossRef]
- Gentrificación: Ventajas y Desventajas. 2023. Available online: https://www.alcaldesdemexico.com/ciudadania/gentrificacion-ventajas-y-desventajas/ (accessed on 17 February 2025).
- Baumgartner, W.H. La gentrificación verde y el derecho a la naturaleza en la ciudad. Apropiación de la naturaleza en la producción capitalista del espacio urbano. Rev. Ciudad. Estados Política 2021, 8, 17–32. [Google Scholar] [CrossRef]
- Mendoza, F.R. La gentrificación en los estudios urbanos: Una exploración sobre la producción académica de las ciudades. Cad. Metrópole 2016, 18, 697–719. [Google Scholar] [CrossRef]
- Bedoya, E.B.; Rodríguez, A.I.; Grajales, J.F.V. ¿Gentrificación o reordenamiento criminal del territorio urbano? Caso Medellín (Colombia). Ratio Juris 2022, 17, 263–288. [Google Scholar] [CrossRef]
- Clerval, A.; Fleury, A. Políticas urbanas y gentrificación: Un análisis crítico a partir del caso de París. Estud. Soc. Contemp. 2015, 56–72. Available online: https://bdigital.uncuyo.edu.ar/objetos_digitales/7895/05-clerval-esc13-2016.pdf (accessed on 17 February 2025).
- Soto-Cortés, J. El crecimiento urbano de las ciudades: Enfoques desarrollista, autoritario, neoliberal y sustentable. Paradig. EconóMico 2017, 7, 127–149. [Google Scholar]
- Verlaan, T.; Hochstenbach, C. Gentrification through the ages. City 2022, 26, 439–449. [Google Scholar] [CrossRef]
- Garmany, J.; Richmond, M.A. Hygienisation, Gentrification, and Urban Displacement in Brazil. Antipode 2020, 52, 124–144. [Google Scholar] [CrossRef]
- Mitchell, B.; Franco, J. Shifting Neighborhoods: Gentrification and Cultural Displacement in American Cities; NCRC: Washington, DC, USA, 2019. [Google Scholar] [CrossRef]
- Cole, H.V.; Mehdipanah, R.; Gullón, P.; Triguero-Mas, M. Breaking Down and Building Up: Gentrification, Its drivers, and Urban Health Inequality. Curr. Environ. Health 2021, 8, 157–166. [Google Scholar] [CrossRef]
- Heidari, H.; Arabi, M.; Warziniack, T.; Sharvelle, S. Effects of Urban Development Patterns on Municipal Water Shortage. Front. Water 2021, 3, 694817. [Google Scholar] [CrossRef]
- Gharib, A.A.; Arabi, M.; Goemans, C.; Manning, D.T.; Maas, A. Integrated water management under different water rights institutions and population patterns: Methodology and application. Water Resour. Res. 2024, 60, e2024WR037196. [Google Scholar] [CrossRef]
- Richter, B.D.; Benoit, K.; Dugan, J.; Getacho, G.; LaRoe, N.; Moro, B.; Rynne, T.; Tahamtani, M.; Townsend, A. Decoupling Urban Water Use and Growth in Response to Water Scarcity. Water 2020, 12, 2868. [Google Scholar] [CrossRef]
- Boldrini, P.L.; Malizia, M. Procesos de gentrificación y contragentrificación: Los mercados de Abasto y del Norte en el Gran San Miguel de Tucumán (noroeste argentino). Revista INVI 2014, 29, 157–191. [Google Scholar] [CrossRef]
- Delgadillo-Polanco, V. Aburguesamiento de barrios centrales, un proceso en expansión y mutación. Econ. Soc. Territ. 2010, 10, 835–846. [Google Scholar] [CrossRef][Green Version]
- Alonso-Vázquez, H.R. ¿Por Qué Persiste la Corrupción Política en México? Estudio Comparado de los Ejecutivos Federales: 2000–2021. Ph.D. Dissertation, El Colegio de San Luis A.C., San Luis Potosí, Mexico, 2021. [Google Scholar]
- Ragin, C.C.; Rubinson, C. The Distinctiveness of Comparative Research; The SAGE Handbook of Comparative Politics: London, UK, 2009. [Google Scholar]
- INTERAPAS. Gestión del Agua en la Zona Metropolitana de San Luis Potosí, Cerro de San Pedro y Soledad de Graciano Sánchez. Available online: https://www.interapas.mx/files/gestion_agua/GESTION_DEL_AGUA_2013.pdf (accessed on 17 February 2025).
- González-Urriza, J. Historia de la Infraestructura Hidráulica en la Capital Potosina; Colección Tecnología y Ciencias Aplicadas (UASLP): San Luis Potosí, Mexico, 2017. [Google Scholar]
- Cardona-Benavides, A.; Martínez-Hernández, J.; Castro-Larragoitia, J.; Alcalde-Alderete, R. La Edad del Agua Subterránea que Abastece a la Región de San Luis Potosí; Revista Universitarios Potosinos: San Luis Potosí, Mexico, 2006. [Google Scholar]
- Aguirre-García, G.J.; Tristan, S.; Hernández-Martínez, R.; Lizardi-Jiménez, M.A. Riesgo de un acuífero urbano por el desarrollo industrial: Vulneración de derechos humanos. Rev. Col. Luis 2023, 13, 1–36. [Google Scholar] [CrossRef]
- CONACYT. ¿Qué Relación Tienen las Fallas Geológicas con la Recarga Acuífera? iAgua. 2017. Available online: https://www.iagua.es/noticias/mexico/conacyt/17/04/05/que-relacion-tienen-fallas-geologicas-recarga-acuifera (accessed on 17 February 2025).
- Gobierno de México. Sierra de San Miguelito. Available online: https://descubreanp.conanp.gob.mx/es/conanp/ANP?suri=156#:~:text=%C3%97-,%C3%81rea%20de%20Protecci%C3%B3n%20de%20Flora%20y%20Fauna,murci%C3%A9lago%20trompudo%20y%20el%20tlalcoyote (accessed on 17 February 2025).
- Álvarez-Rivadulla, M.J. Golden Ghettos: Gated Communities and Class Residential Segregation in Montevideo, Uruguay. Environ. Plan. A Econ. Space 2007, 39, 47–63. [Google Scholar] [CrossRef]
- Mérida-Martínez, Y.; Becerril-Tinoco, C.A. Crecimiento urbano y gestión del servicio de agua potable en la localidad de Copoya, de Tuxtla Gutiérrez, México. Estado Comunes Rev. Políticas Probl. Públicos 2024, 2, 101–118. [Google Scholar] [CrossRef]
- Hernández, G.M.G. De gentrificación a precarización. Discusión en torno al Centro Histórico de Zacatecas. Iztapalapa Rev. Cienc. Soc. Humanidades 2022, 93, 47–74. [Google Scholar] [CrossRef]
- Luna-Nemecio, J. Sustentabilidad versus emergencia ambiental: Los corredores urbano-industriales como factor de conflictos hídricos en el estado de Morelos, México. Rev. Univ. Soc. 2022, 14, 90–100. [Google Scholar]
- Robledo-Carmona, J.R. El Acceso al Agua de Uso Doméstico en las Áreas Periurbanas del Municipio de San Luis Potosí: El Caso de Escalerillas. Master’s Dissertation, El Colegio de San Luis A.C., San Luis Potosí, Mexico, 2013. [Google Scholar]
- Cárdenas-Tristán, A.; Galván-Medina, S.A.; Wu, H.; Reyes-Cardenas, O.; Cisneros-Almazán, R. Evaluation of water use impacts caused by real estate development with gentrification traits in the metropolitan area of San Luis Potosí. Innova Aerosp. Sci. Technol. 2024, 2, 1–10. [Google Scholar] [CrossRef]
- UN. Global Issues: Water. Available online: https://www.un.org/en/global-issues/water (accessed on 17 February 2025).
- Gobierno de México. Ahorro de Agua. Un Hábito de Todos los Días. Available online: https://www.gob.mx/profeco/documentos/ahorro-de-agua-un-habito-de-todos-los-dias?state=published (accessed on 17 February 2025).
- CONAGUA. Encuesta Sobre el Consumo de Agua Potable en los Hogares. Available online: https://www.cofemersimir.gob.mx/expediente/24861/mir/48251/anexo/6310573 (accessed on 17 February 2025).
- Honorable Ayuntamiento de San Luis Potosí. Reglamento de Construcciones del Municipio de San Luis Potosí. Available online: https://ordenjuridico.gob.mx/Estatal/SAN%20LUIS%20POTOSI/Municipios/San%20Luis%20Potosi/6Regconstrucciones.pdf (accessed on 17 February 2025).
Disclaimer/Publisher’s Note: The statements, opinions and data contained in all publications are solely those of the individual author(s) and contributor(s) and not of MDPI and/or the editor(s). MDPI and/or the editor(s) disclaim responsibility for any injury to people or property resulting from any ideas, methods, instructions or products referred to in the content. |
© 2025 by the authors. Licensee MDPI, Basel, Switzerland. This article is an open access article distributed under the terms and conditions of the Creative Commons Attribution (CC BY) license (https://creativecommons.org/licenses/by/4.0/).