Article

Ponding Water Quality of Rice Paddies Fertilized with Anaerobically Digested Liquid Pig Manure as Affected by Fly Ash and Zeolite

1
Department of Rural and Biosystems Engineering, Chonnam National University, Gwangju 61186, Republic of Korea
2
Division of Soil and Fertilizer, National Institute of Agricultural Sciences, Rural Development Administration, Wanju 55365, Republic of Korea
3
Gokseong Agricultural Technology Center, Gokseong 57538, Republic of Korea
*
Author to whom correspondence should be addressed.
These authors contributed equally to this work.
Water 2025, 17(8), 1189; https://doi.org/10.3390/w17081189
Submission received: 18 March 2025 / Revised: 11 April 2025 / Accepted: 14 April 2025 / Published: 15 April 2025
(This article belongs to the Special Issue Water Quality, Wastewater Treatment and Water Recycling)

Abstract

:
Anaerobically digested liquid pig manure (LPM) is enriched with nutrients and thus can be used as an alternative nutrient source and substitute for chemical fertilizer (CF) in rice (Oryza sativa L.) farming. However, there are concerns regarding the contamination of the surrounding water due to the discharge of ponding water containing dissolved organic carbon (DOC), nitrogen (N), and phosphorus (P) from rice paddies fertilized using LPM. This study investigated the effects of the co-application of fly ash (FA) and zeolite (Z) amendments (FAZ amendments) on the concentration of DOC, N, and P in the ponding water of rice paddies fertilized with LPM at two different rates (standard (LPMS) and double (LPMD) at 11 and 22 g N m−2, respectively). Rice was cultivated using four nutrient treatments, including no input, CF (11 g N m−2), LPMS, and LPMD, with or without FAZ amendments. When FAZ was not amended, LPMS and LPMD application increased the DOC concentration by 32% and 41%, respectively, compared to CF treatments (11 g N m−2), reflecting a high DOC concentration in LPM. The total N and P concentrations in the ponding water were lower in LPMS treatment (by 5 and 8%, respectively) but higher (by 94% and 47%, respectively) in LPMD treatment compared to CF treatments in the absence of FAZ, indicating a high potential for water pollution with a double LPM application rate. With a given nutrient treatment, FAZ amendments decreased DOC by 15–39%, supporting the immobilization of DOC by Z. FAZ consistently decreased the NH4+ concentration by 6–51% across the nutrient treatments, likely via the sorption of NH4+ onto the negatively charged sites of Z, but its effect on total N concentration was not consistent. Unexpectedly, total P concentration increased (by 77–167%) following the FAZ amendment. FAZ amendments tended to increase rice biomass and grain yield for LPM treatments, but these rice growth parameters were poor compared to CF regardless of FAZ amendment. Our results show that the application of LPM as a complete replacement for CF may hamper rice yield while increasing the likelihood of water pollution with DOC and P, although the co-application of FAZ may help to reduce rice yield loss and decrease DOC and NH4+ concentrations.

1. Introduction

Pig manure contains high levels of organic carbon (C) and nutrients, including nitrogen (N) and phosphorous (P); thus, the improper management of pig manure may cause water pollution due to the diffusion of the organic C and nutrients [1]. On industrialized pig farms, to minimize water pollution and enhance the recycling rate of pig manure, solid and liquid fractions of pig manure slurry are separated; the former is subject to compositing, and the latter undergoes further aerobic and/or anaerobic digestion to produce liquid pig manure (LPM) [2]. Compost enriched with organic C is a good soil amendment; meanwhile, LPM is either discharged or utilized as a nutrient source for crop cultivation [3]. Due to its large water volume and high nutrient concentrations, it is recommended to apply LPM to rice (Oryza sativa L.) paddies with irrigation water as a replacement for chemical fertilizers (CFs) [4,5,6]. However, there is a concern that the application of LPM may cause water pollution in the surrounding rice paddies by organic C and nutrients via the discharge of ponding water in rice paddies treated with LPM, particularly during the rainy season, due to overflow [7]. Therefore, to ensure the environmentally friendly utilization of LPM, it is necessary to reduce the mobility of dissolved organic C (DOC) and nutrients in ponding water after the application of LPM in paddy rice systems.
In this context, coal fly ash (FA) and zeolite (Z) can be used as sorbents for DOC and nutrients to control their mobility, as these amendments have an affinity for these substances [8]. Specifically, FA, which is a by-product of coal-fired power plants, has a high P immobilization capacity through the sorption of P onto the FA surface and the precipitation of P with calcium (Ca) contained in FA [9,10,11,12]. Meanwhile, Z, which is a porous hydrated alumino-silicate mineral with a high specific area and a high cation exchange capacity, has a high affinity for DOC and NH4+ [13,14]. Therefore, the co-application of FA and Z may reduce the mobility of DOC, N (specifically NH4+), and P, thereby minimizing the loss of these substances from LPM-treated rice paddies. The high immobilization of NH4+ by Z and of P by FA in chemically fertilized soils has been proven in our previous studies [8,15].
The nutrient concentrations of LPM depend on the LPM treatment processes used; for example, aerobic digestion produces low-nutrient LPM due to the enhanced removal of N and P under oxygen-rich conditions, whereas the concentrations of N and P in LPM produced using anaerobic digestion are relatively high due to the incomplete removal of nutrients [16,17]. Therefore, the quality of ponding water after LPM application may differ according to the type of LPM treatment used. In a previous study [3], we investigated the effects of the co-application of FA and Z on the nutrient availability of rice paddies fertilized with low-nutrient LPM produced through aerobic digestion. Recently, however, the preference for anaerobic over aerobic treatments has increased, as anaerobic digestion of pig manure has been reported to be more beneficial than aerobic treatments in terms of biogas production and agricultural nutrient recycling [18,19]. However, no study has been conducted on the effects of the co-application of FAZ on ponding water quality of rice paddies fertilized with anaerobically produced LPM containing high nutrients.
Therefore, this study investigated the effects of the co-application of FAZ on the concentrations of DOC, N, and P in ponding water in relation to the growth and nutrient uptake of rice plants in paddies fertilized with LPM at two different rates, compared to conventional chemical fertilization. We hypothesized that the co-application of FAZ would decrease the concentrations of DOC, N, and P in the ponding water of rice paddies fertilized with LPM and would improve the nutrient uptake and, thus, biomass accumulation in rice through the retention of nutrients in the soil.

2. Materials and Methods

2.1. Study Site and Soil Characteristics

The field experiment was conducted on an experimental paddy (126°53′ E, 35°10′ N) at Chonnam National University, Gwangju, Republic of Korea, under natural field conditions during the rice-growing season, from May to August 2020. The study area has a typical East Asian warm monsoon climate. The annual mean temperature and precipitation over the past three decades were 13.8 °C and 1391 mm, respectively. During the rice-growing experiment, the daily mean temperature was 24.6 °C and the precipitation was 203.1 mm.
The soil was classified as Inceptisol (coarse loamy, mixed, non-acidic, belonging to the mesic family of Fluvaquentic Endoaquepts), according to the USDA Soil Taxonomy [20]. Soil samples were analyzed for texture and cation exchange capacity (CEC), pH1:5, and electrical conductivity (EC1:5) at a 1-to-5 soil-to-water ratio, organic C, total N, inorganic N (NH4+ and NO3), total P, and available P, following the methods described by Lee et al. [3]. The soil texture was clay loam, comprising 32.0%, 31.2%, and 36.8% of clay, silt, and sand contents, respectively, and the CEC was 15.4 cmolc kg−1. The pH1:5 and EC1:5 were 5.8 and 0.05 dS m−1, respectively. The soil had 17.4 g C kg−1 of organic C, 0.60 g N kg−1 of total N, 6.2 mg N kg−1 of NH4+, 6.5 mg kg−1 of NO3, 0.65 g P kg−1 of total P, and 5.6 mg P kg−1 of available P (Bray #1).

2.2. Liquid Pig Manure

The LPM samples were provided by a local manure treatment factory. The LPM was processed via the anaerobic fermentation of the liquid fraction (<2 mm) of pig manure slurry. Briefly, liquid manure was introduced into a settlement tank to remove particulate matter under aerobic conditions for 7 days, and the supernatant fractions were transferred to anaerobic reaction tanks for the fermentation of the dissolved organic matter for 23 days. The temperature of the reaction tanks was between 45 and 60 °C.
The LPM was analyzed for pH, EC, and concentrations of N, P, and cations following the standard methods of the American Public Health Association, American Water Works Association, and Water Environment Federation [21]. Briefly, the pH and EC were measured using pH and EC meters (Orion 3-Star, Thermo Fisher Scientific Inc., Waltham, MA, USA). The concentration of DOC was measured using a TOC analyzer (Sievers 900, GE Analytical Instruments, Boulder, CO, USA), the total N was determined using the alkaline persulfate oxidation method, and the NH4+ and NO3 concentrations were determined using the indophenol method and vanadium reduction method, respectively. The concentrations of organic N were calculated as the difference between the total N and mineral N (NH4+ + NO3) concentrations. The concentration of total P was determined using the vanadate method after alkaline persulfate oxidation. The concentrations of cations and heavy metals were determined by employing an inductively coupled plasma–atomic emission spectroscopy (ICP-AES) instrument (Optima-7000DV, PerkinElmer, Boston, MA, USA). The pH and EC of LPM were as high as 9.3 and 19.3 dS m−1, respectively (Table 1). The N and P concentrations of LPM were 3.18 g N L−1 and 0.113 g P L−1, respectively. The N to P ratio of LPM was 28.1, which is much higher than the corresponding ratio (11/1.94 = 5.6) for the standard CF application for rice in South Korea. Therefore, chemical P fertilizer was supplemented to avoid P deficiency in the rice fertilized with LPM at the standard N rate. The chemical properties of the anaerobically digested LPM differed from the aerobically digested LPM [3]; for example, the EC and total N and P concentrations of the anaerobically digested LPM were higher than those (EC, 3.4 dS m−1; total N, 0.45 g N L−1; and total P, 0.013 g P L−1) of the aerobically digested LPM.

2.3. Fly Ash and Zeolite

The FA was collected from a coal power plant in Hadong, Gyeongsangnam-do, Korea. The Z (clinoptilolite) was purchased from Handu Trade (Gyeongju, Gyeongsangbuk-do, Korea). The physicochemical properties of FA and Z have been previously reported by Lim et al. [15]. The FA mainly consisted of silt-sized particles (75.4%), followed by sand (22.7%) and clay (1.9%). The elemental compositions of the amendments, determined using X-ray fluorescence analysis, were as follows: FA contained SiO2 (54.2%), Al2O3 (22.1%), Fe2O3 (8.8%), CaO (7.0%), MgO (2.5%), K2O (2.5%), and trace elements (2.9%), whereas Z contained SiO2 (73.7%), Al2O3 (14.4%), K2O (3.4%), CaO (2.5%), Na2O (2.3%), Fe2O3 (2.2%), and trace elements (1.5%). Notably, FA had a high pH1:5 (11.7) and EC1:5 (1.55 dS m−1), which were associated with a high content of CaO, whereas Z exhibited a high CEC (Table 2). The respective capacities of FA and Z to immobilize P and NH4+ were tested in our previous study using a batch experiment approach [15]. In the experiment, 1 g each of FA and Z was reacted with each 30 mL of NH4+ ((NH4)2SO4, 2000 mg N L−1) and H2PO4 (KH2PO4, 1000 mg P L−1), and the concentration of N and P in the subsequent aqueous fraction was analyzed to determine the degree of N and P immobilization. The results indicated that FA and Z immobilized P and NH4+ by 97.0% and 61.0%, respectively.

2.4. Plot Experiment Setting and Rice Cultivation

Twenty-four plots (plot size: 1 m × 1 m) were established in a randomized block design for four nutrient treatments and two soil amendment levels, and the experiments were conducted in triplicate. Each plot was confined by inserting plastic plates (sunlight) into the soil at a depth of 20 cm. Nutrient treatments included a control (no input), conventional CF at the standard dose (11 g N m−2, equivalent to 110 kg N ha−1), LPM at the standard N dose (LPMS), and LPM at double the standard N dose (LPMD). For CF treatment, N was applied via urea one day before rice transplantation, 29 days after transplanting (DAT) for the first top dressing, and 69 DAT for the second top dressing, at a 5:3:2 ratio. Fused tricalcium phosphate (Ca(PO4)3) (1.97 g P m−2) and KCl (5.56 g K m−2) were applied in full amounts at the basal fertilization. For LPM treatments, LPM was applied in the same manner as for CF, and fused phosphate was supplemented at the same dose as for CF to avoid P deficiency, resulting in the addition of P at 2.36 g P m−2 for LPMS treatment and at 2.75 g P m−2 for LPMD treatment (Table 3). Meanwhile, a higher amount of K was applied to LPM treatments than to the CF treatment due to a substantial content of K already present in LPM (Table 3). Amendments (FA and Z) were mixed at 5% (w/w) each (13 kg m−2 each; 26 kg m−2 in total) and applied to 20 cm deep soil on the same date as basal fertilization.
On 4 May 2020, 20-day-old rice (cv. Jeonnam 1) seedlings were transplanted (three seedlings per hill) to each experimental plot at a planting density of 30 cm × 15 cm. Rice was cultivated following conventional farming practices for 104 days. Specifically, the ponding water depth was maintained between 3 and 5 cm by irrigating, except during certain periods for fertilization and mid-season drainage. During the fertilization period, the ponding water depth was maintained at < 1 cm, and irrigation was stopped during the mid-season drainage period from 35 to 50 DAT. Rice was harvested from three plants per plot by cutting the plants 3 cm above the surface at 104 DAT. Root samples were also collected as much as possible, and rice plants were separated into roots, shoots, and grains. The biomass of the rice parts was determined after drying the samples at 60 °C until they demonstrated a constant weight. A portion (10 g) of rice plant samples was finely ground and the N concentration was analyzed using an elemental analyzer (FlashEA-1112, Thermo, Waltham, MA, USA) and the P concentration was analyzed using the colorimetric method, following digestion with HClO4, to calculate the amounts of N and P uptake by rice plants.

2.5. Sampling and Analyses of the Ponding Water

Ponding water samples were collected 18 times using a 25 mL pipette at 1, 3, 5, 7, 10, and 25 DAT after the basal fertilization (–1 DAT), at 29, 31, 33, 37, 41, and 56 DAT after the first top dressing, and at 69, 71, 73, 75, 80, and 94 DAT after the second top dressing. Immediately after collecting the water samples, the soil particles were removed by filtering them using Whatman 42 filter papers, and the pH and EC were measured. The pH of the water samples was adjusted to 2.0 using concentrated H2SO4 to protect them from microbial and chemical alteration, and the samples were frozen and stored until analysis. After collecting the final water samples at 94 DAT, all samples were analyzed for dissolved organic carbon (DOC), total N, and total P concentrations following the methods used for LPM analysis [21]. Additionally, the concentration of P was determined using the vanadate method before (for soluble P) and after (for total P) alkaline persulfate oxidation. The concentration of particulate P was determined by subtracting the soluble P concentration from the total P concentration.

2.6. Calculations and Statistical Analysis

The changes in the concentrations of DOC, N, and P in the ponding water and the rice biomass and grain yield in the LPM treatments, relative to the CF treatment, were calculated as the percentage difference between treatments using the following formula:
% Changes caused by LPM relative to CF = [(LPM-amended) − (CF treatment)] × 100/CF treatment
The changes caused by the FAZ application were also calculated as the percentage difference between FAZ-free and FAZ-amended treatments, using the formula below:
% Changes caused by FAZ relative to no FAZ = [(FAZ-amended) − (FAZ-free)] × 100/FAZ-free
The two LPM levels were regarded as different nutrient sources (i.e., four nutrient sources × two soil amendments) in the statistical analysis in order to explore the interaction effects between nutrient sources and FAZ amendment. A two-way analysis of variance (ANOVA) was performed using the general linear model of SPSS 27 (SPSS Inc., Chicago, IL, USA) to determine the significance (at α = 0.05) of the effects of nutrient sources and soil amendments on the ponding water quality and rice biomass parameters. The effects of the nutrient sources and soil amendments on the pH, EC, and N and P concentrations in ponding water were estimated using a repeated-measures ANOVA across 18 sampling times.

3. Results

3.1. Ponding Water Chemistry

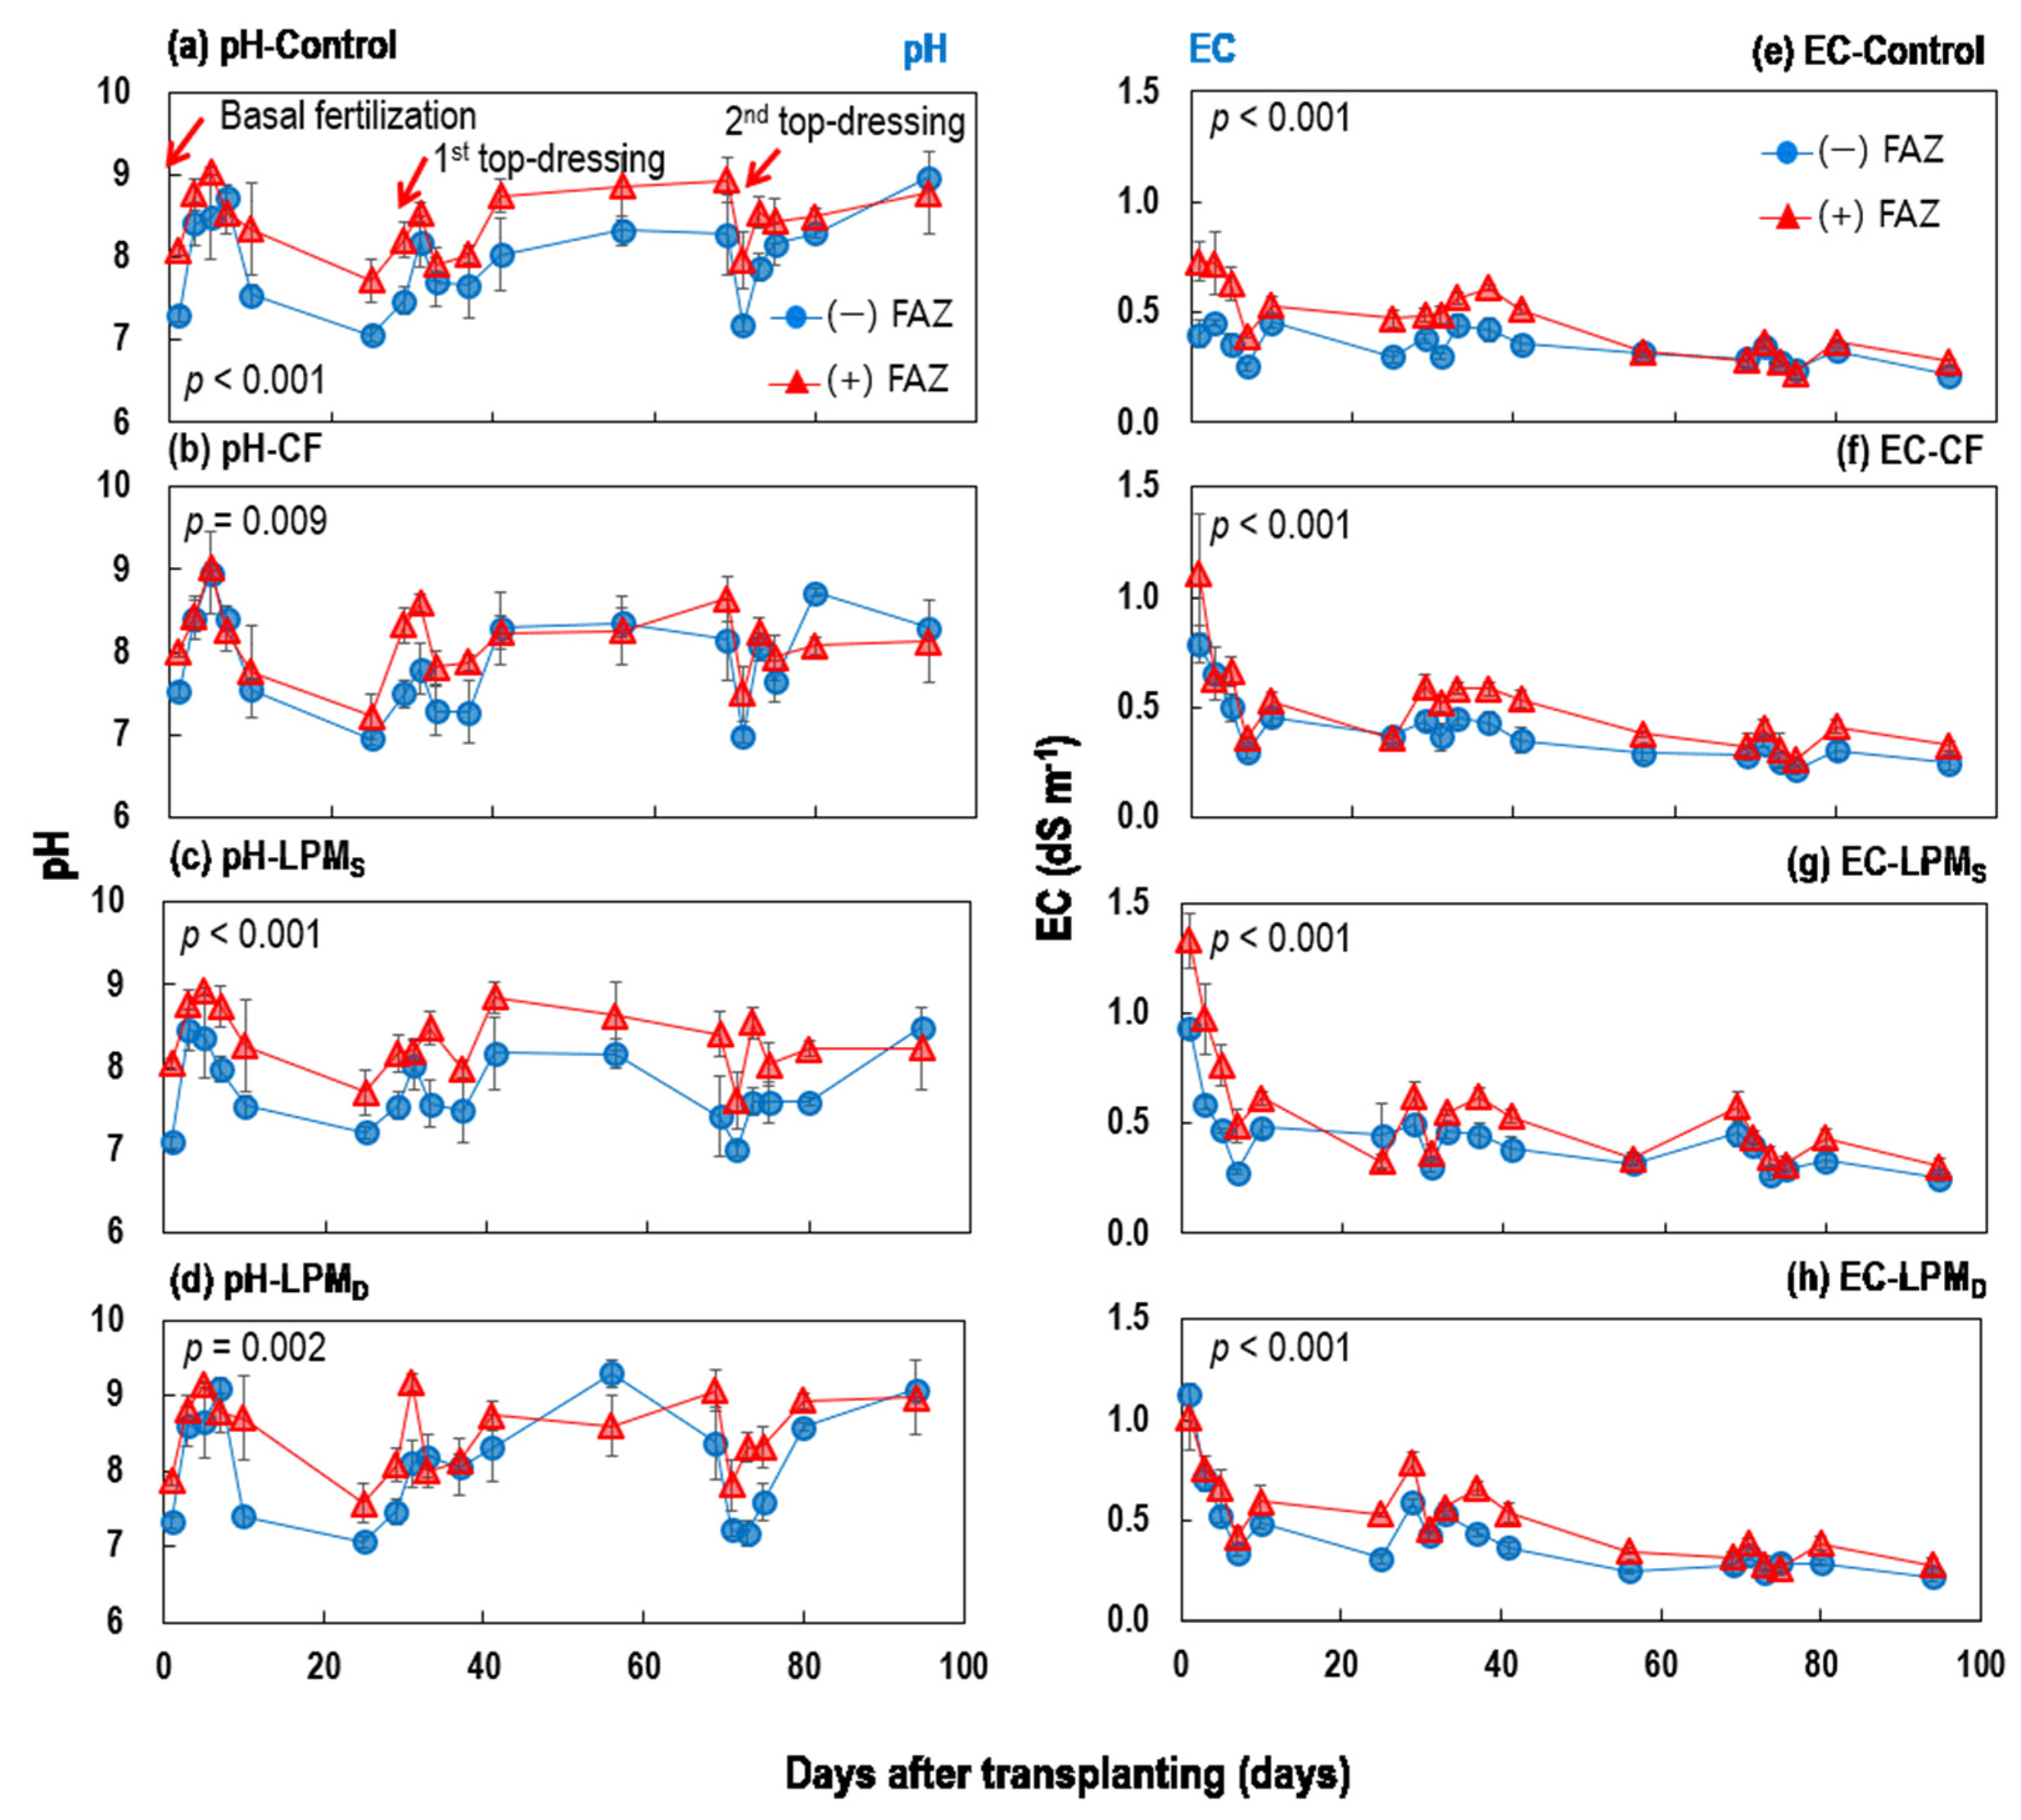
3.1.1. Temporal Changes in the pH and EC of Ponding Water

The pH of the ponding water, averaged over 1−94 DAT, ranged from 7.7 to 8.5 (Figure 1a–d). For a given nutrient treatment, FAZ amendment increased (p < 0.001) the pH of the ponding water by 0.2−0.6 units. There were sharp increases and subsequent decreases in the pH after basal fertilization and after the first top-dressing fertilization. The EC of the ponding water ranged from 0.3 to 0.6 dS m−1 over 1−94 DAT, showing a temporal decreasing pattern after the initial peak, with occasional increases after additional fertilization, regardless of nutrient treatments and FAZ application (Figure 1e−h). Comparing the nutrient treatments, LPM application led to higher (p < 0.001) EC than CF application and control. FAZ amendment further increased (p < 0.001) the EC by 0.08−0.13 dS m−1 when averaged over 1−94 DAT.

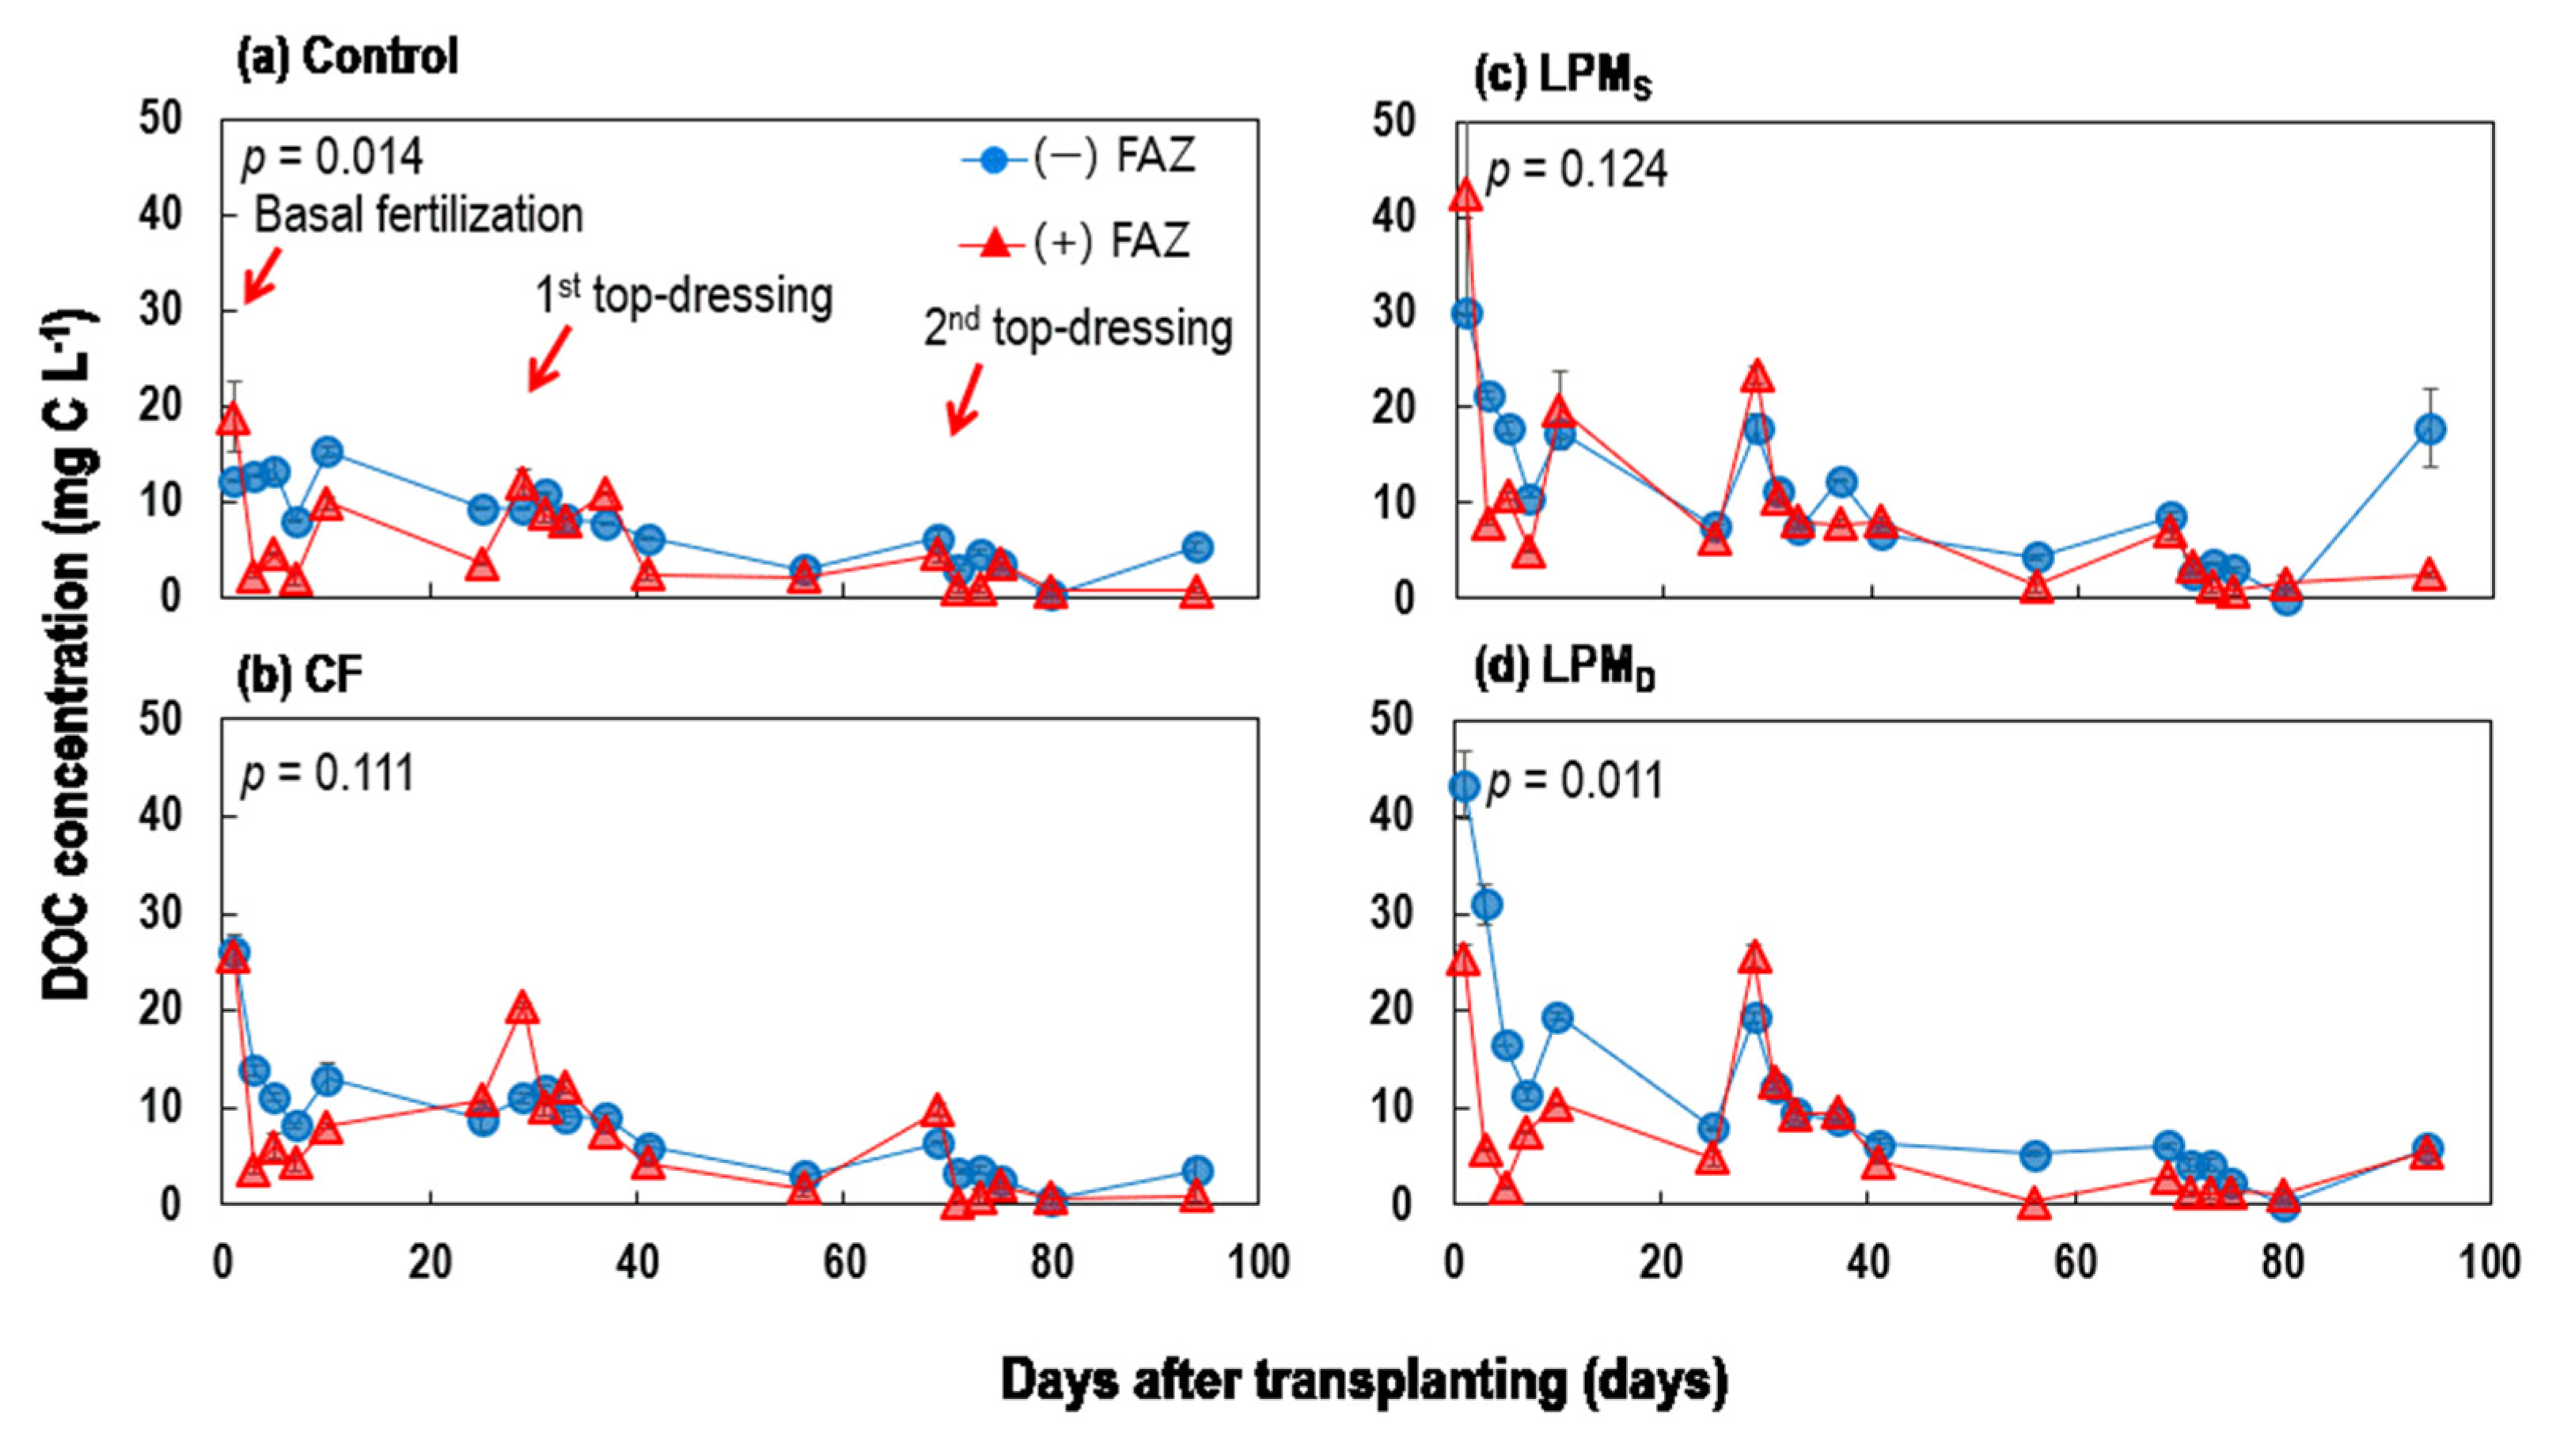
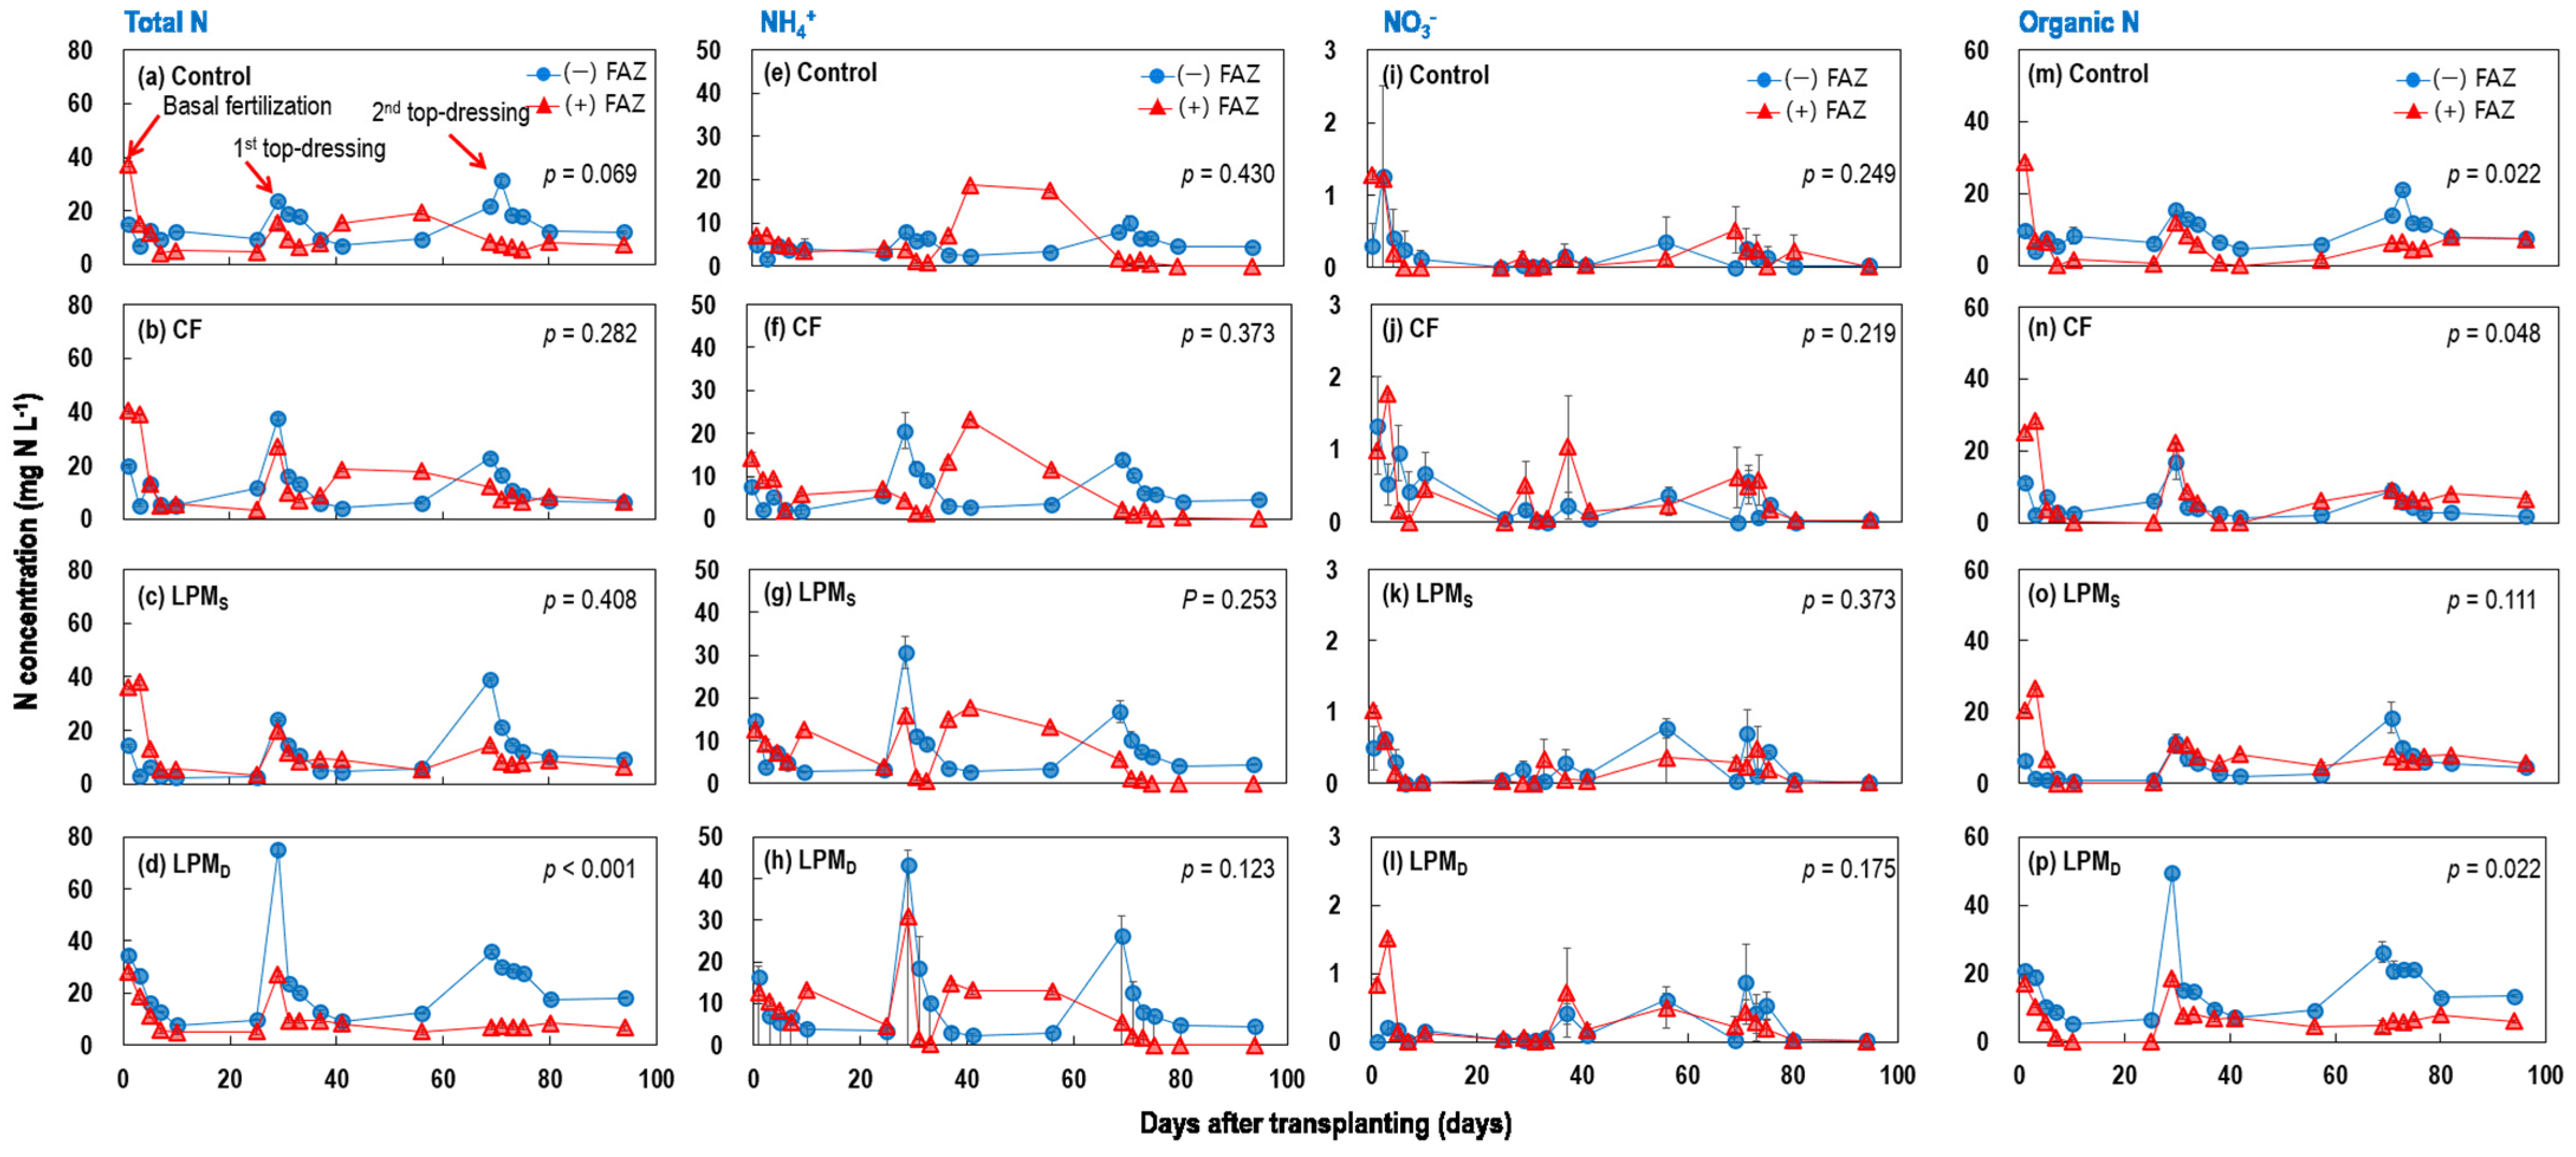
3.1.2. Temporal Changes in DOC, Total N, and Total P of Ponding Water

The concentration of DOC in the ponding water fluctuated across the rice-growing period. The DOC concentrations for all treatments increased immediately after the basal fertilization, the first top-dressing, and the second top-dressing, followed by decreases with time after the fertilization events (Figure 2).
The concentrations of total N (2.4–75.4 mg N L−1, Figure 3a–d) and total P (0.01–6.0 mg P L−1, Figure 4a–d) in the ponding water also fluctuated across the rice-growing period in a similar pattern to DOC: they peaked after fertilization, followed by a gradual decrease, particularly for LPM treatments. Interestingly, the total N and total P concentrations of the control (without nutrient inputs) exhibited a similar temporal pattern to those of the nutrient treatments (Figure 3a and Figure 4a). Overall, the concentration of NH4+ (Figure 3e–h), NO3 (Figure 3i–l), and organic-N (Figure 3m–p) also changed in a similar manner to that of total N. Interestingly, however, the NH4+ concentration during the mid-season drainage period increased under FAZ amendments. Total P (Figure 4a–d), soluble P (Figure 4e–h), and particulate P (Figure 4i–l) also showed temporal changes in a similar pattern to that of the N concentration, with the highest peaks after the first top dressing for LPM treatments in the presence of FAZ amendments.

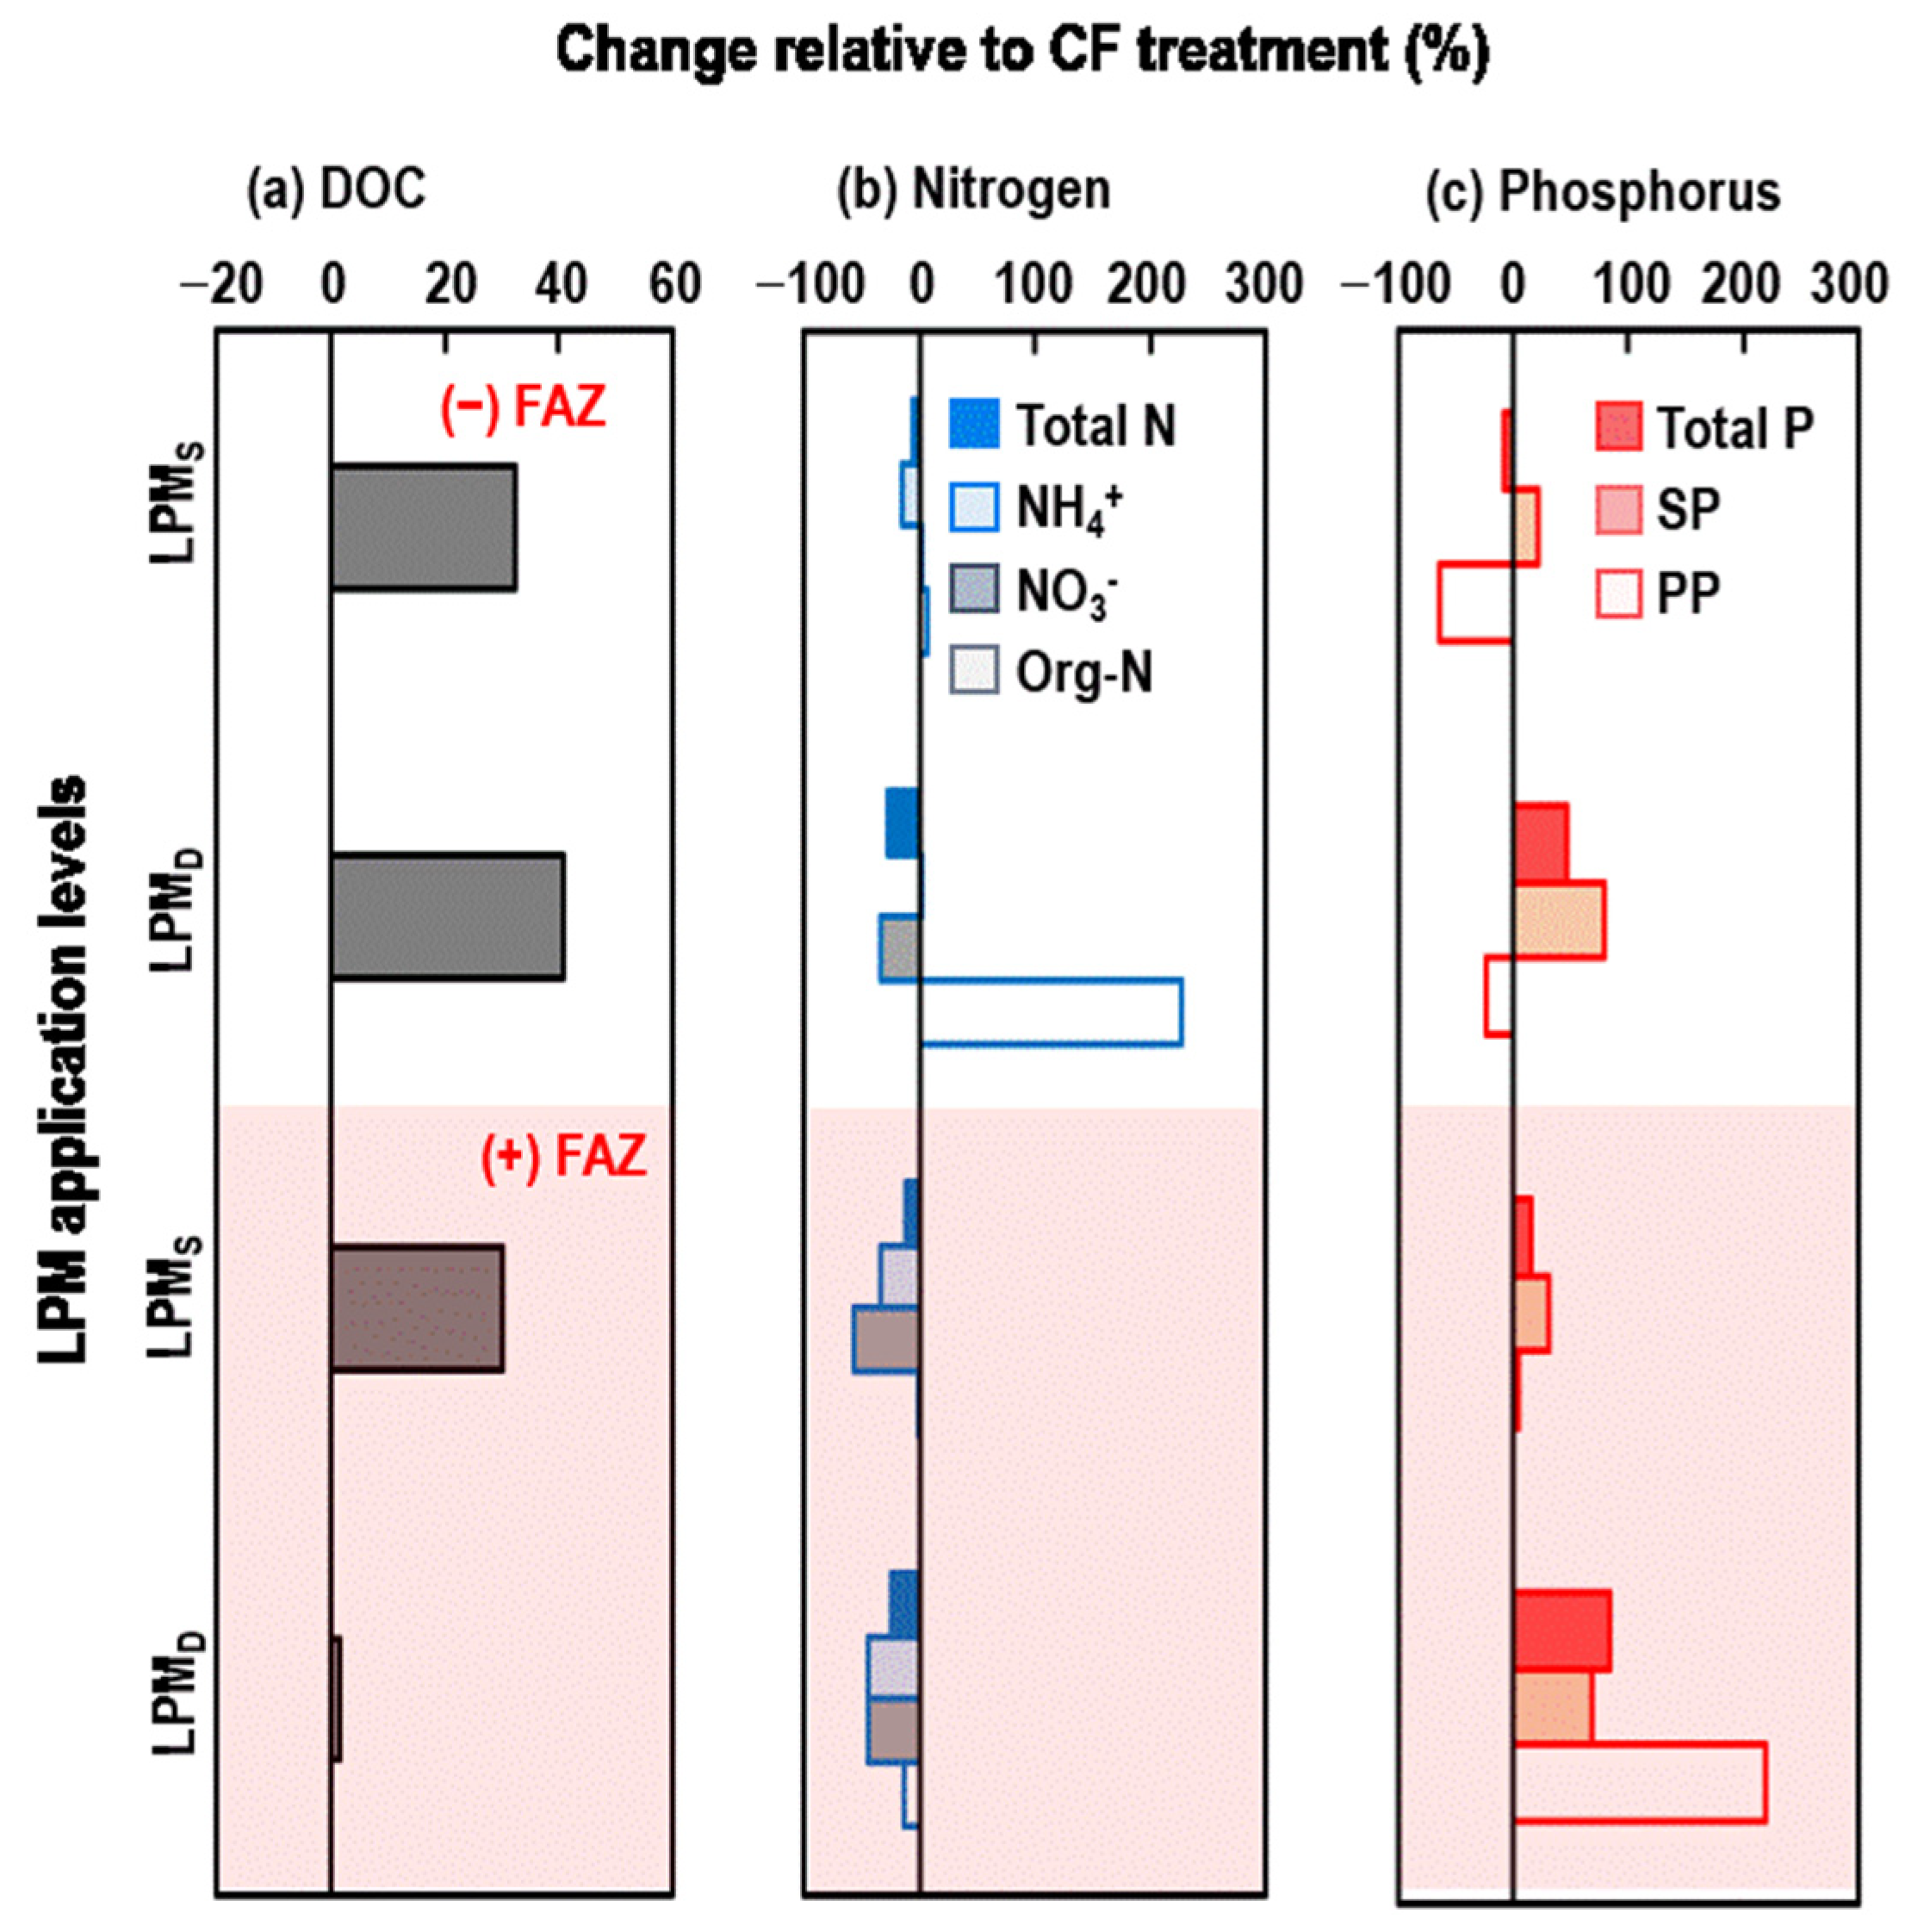
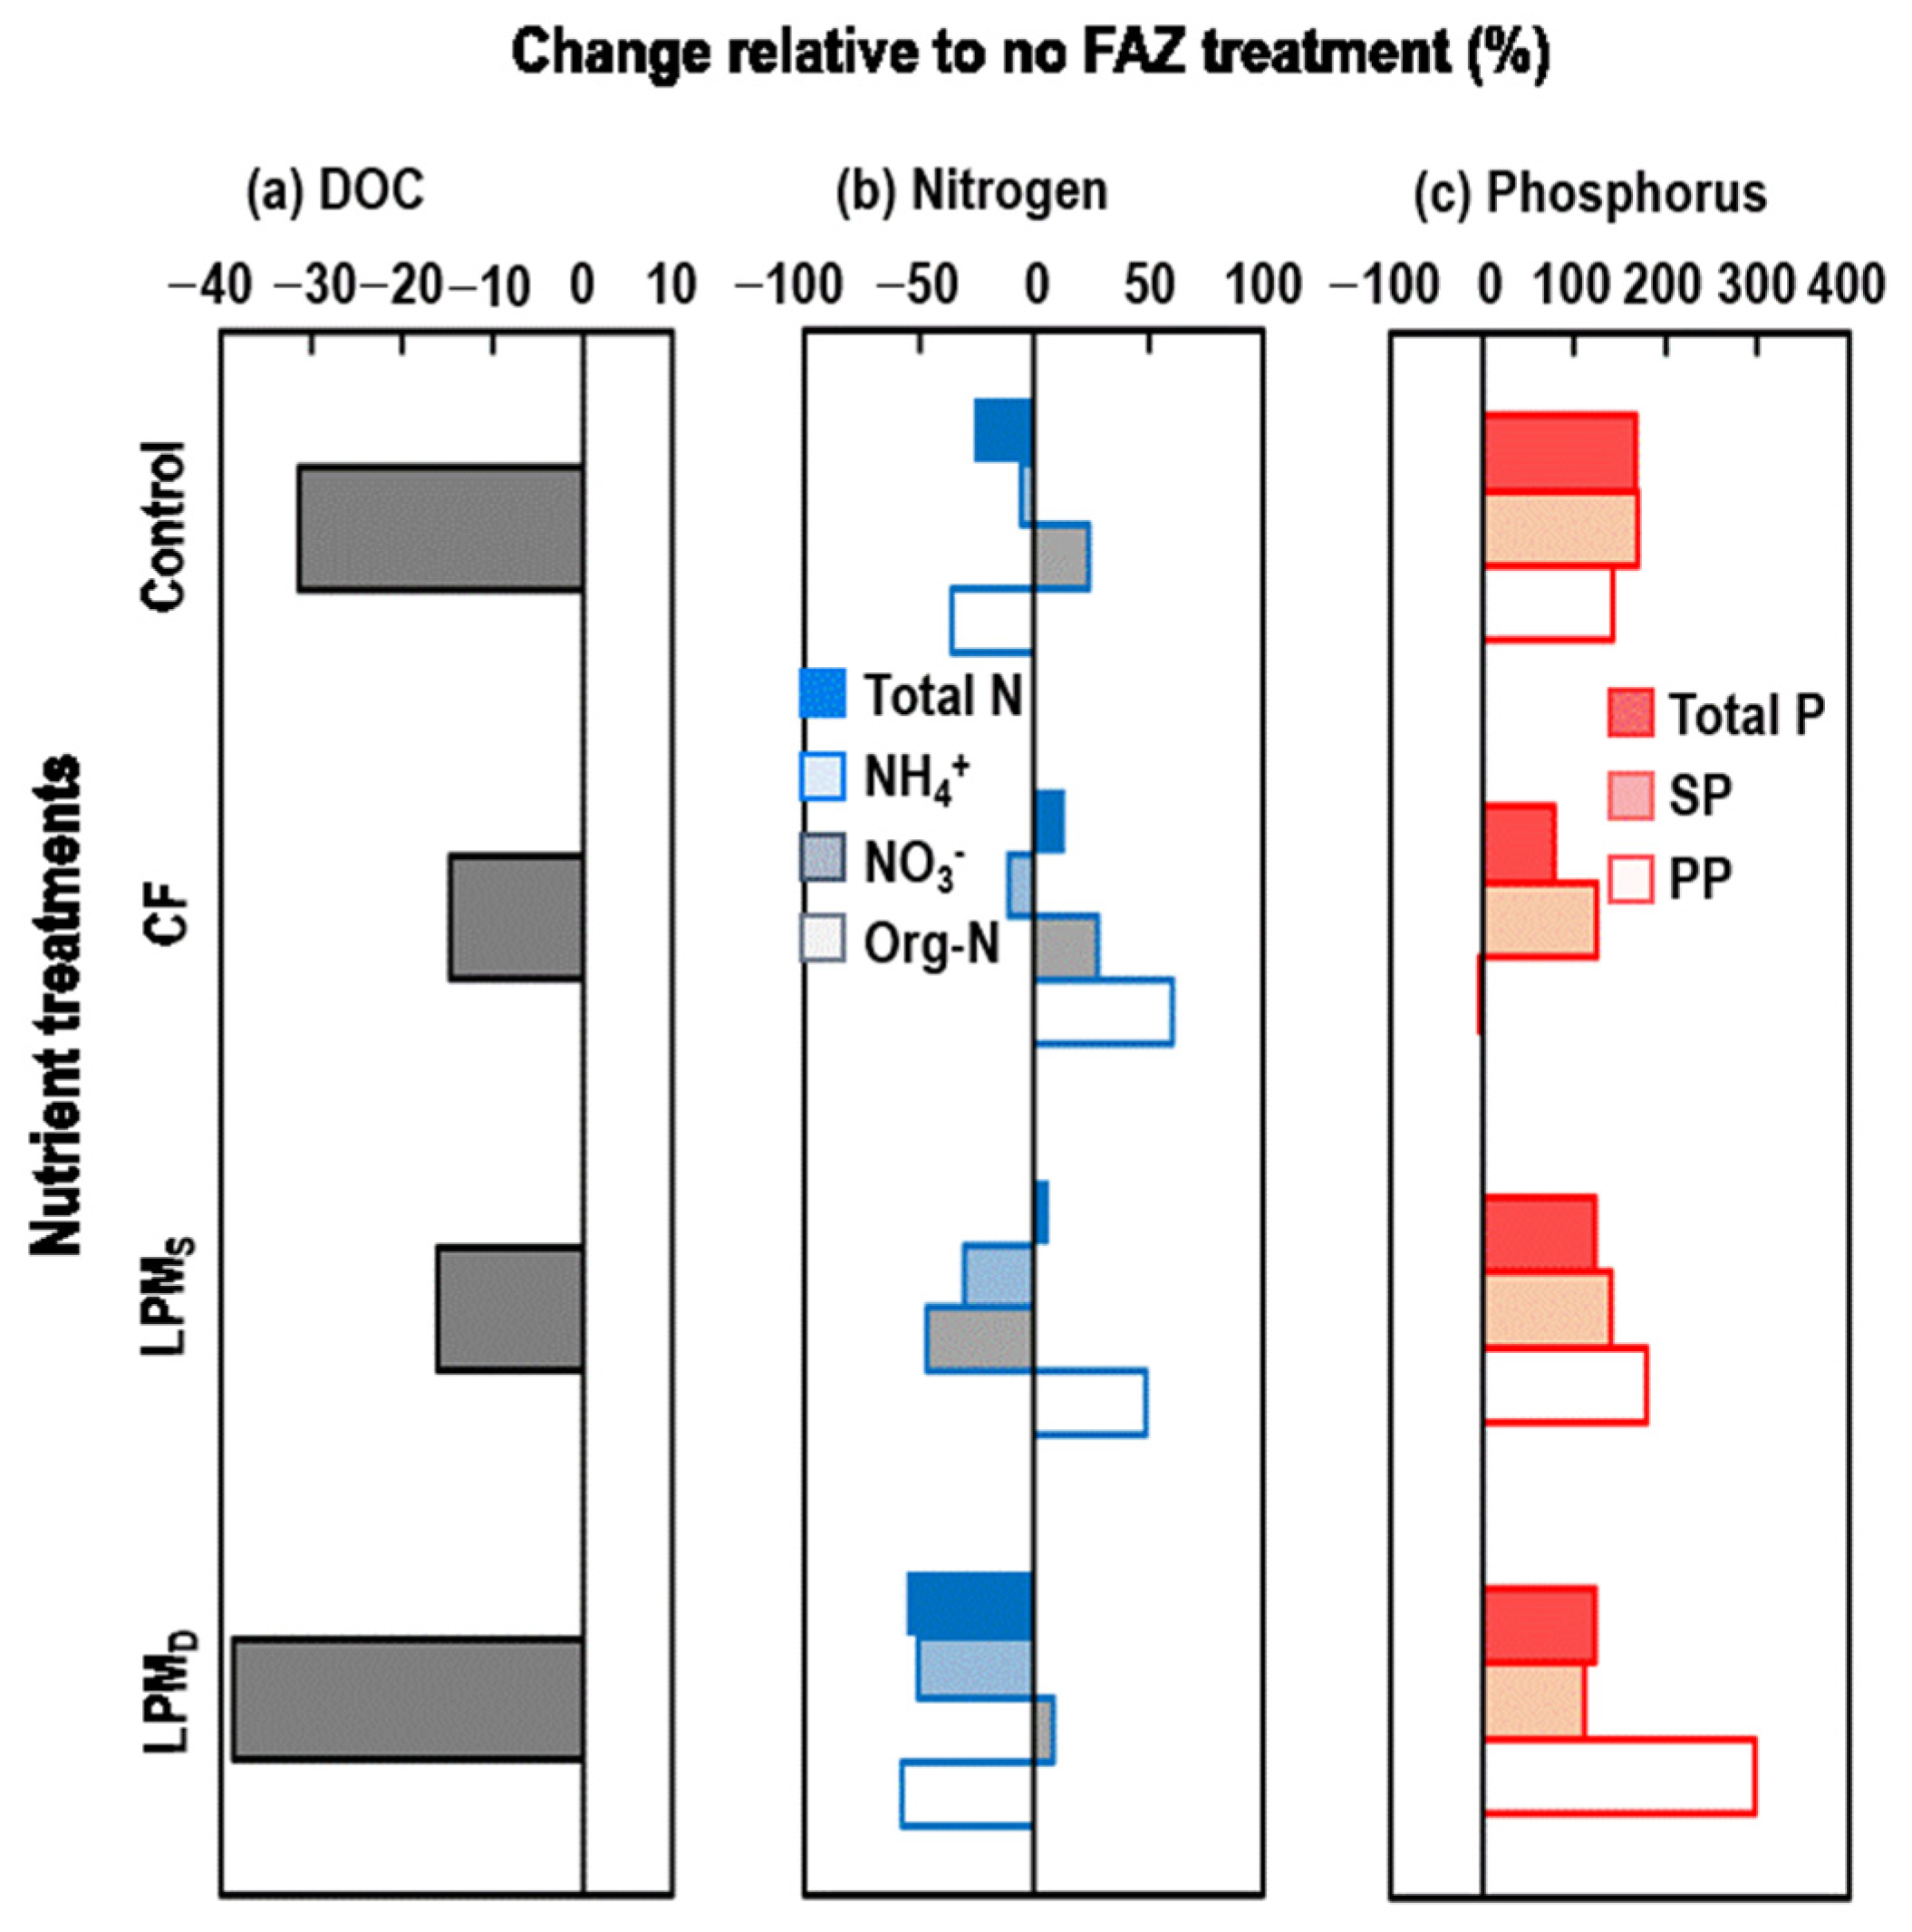
3.1.3. Changes in DOC, N, and P of Ponding Water Due to Different Nutrient Sources and FAZ Amendments

The average concentrations of DOC in the ponding water across the entire sampling period were affected (p < 0.001) by the nutrient sources and FAZ amendments (Table 4). In the absence of FAZ amendments, LPM application increased the DOC concentration by 44% for LPMS (11.1 mg C L−1) and 54% for LPMD (11.9 mg C L−1) compared to the control (7.7 mg C L−1). In the presence of FAZ amendments, LPM application increased the DOC concentration by 76% for LPMS (9.4 mg C L−1) and 37% for LPMD (7.3 mg C L−1) compared to the control (5.3 mg C L−1). Compared to the conventional CF, LPM application at the standard and double rates increased the DOC concentration in the ponding water by 32% and 41%, respectively, when FAZ was not amended (Figure 5a). Meanwhile, in the presence of FAZ amendments, the increments in DOC concentrations by LPMS and LPMD applications, compared to CF treatment, were lowered to 30% and 2%, respectively (Figure 5a). For LPM treatment, FAZ amendments consistently decreased the DOC concentration of LPM-treated soils across the rice-growing period by 16−39% on average (Figure 6a).
The average concentrations of total N (10.3–23.2 mg N L−1) in the ponding water across the entire rice-growing period were affected (p < 0.001) by the nutrient source, FAZ amendments, and their interactions (Table 4). Unexpectedly, in the absence of FAZ, total N concentrations of CF (12.0 mg N L−1) and LPMS (11.4 mg N L−1) treatments were lower than those of the control (14.8 mg N L−1), whereas that of LPMD treatment (23.2 mg N L−1) was higher than the control by 58%. Meanwhile, in the presence of FAZ amendments, total N concentrations increased in CF (25%) and LPMS (11%) treatments but decreased in LPMD treatment (5%) compared to the control (Table 4). Compared to CF treatment, the concentrations of total N, NH4+, and NO3, but not of organic N, in LPM treatments were lower than those of CF treatments, regardless of FAZ amendments (Figure 5b). The effects of FAZ amendments on N concentrations were not consistent across the nutrient treatments and among the N species. Interestingly, FAZ amendments consistently decreased the NH4+ concentration for all the nutrient treatments by 6–51%; these FAZ-induced decreases in N concentration were most evident for the LPMD treatment (Figure 6b). For the control, CF, and LPMS treatments, the effects of FAZ amendments on N concentrations were inconsistent among the N species.
The average concentrations of total P (0.10–0.72 mg P L−1), soluble P (0.08–0.56 mg P L−1), and particulate P (0.02–0.27 mg P L−1) in the ponding water across the entire (94-day) rice-growing period were also affected (p < 0.001) by FAZ application and the nutrient source (p = 0.014, p = 0.003, and < 0.001, respectively) (Table 4). Compared to the control (0.10 mg P L−1), in the absence of FAZ, the concentrations of total P in LPMS (0.21 mg P L−1) and LPMD (0.33 mg P L−1) treatments were higher than those of the control, which was mainly due to an increased soluble P concentration rather than an increased particulate P concentration (Table 4). The higher total P concentration of CF and LPM treatments than that of the control was also found in the presence of FAZ amendments (Table 4). Compared to the CF treatment, in the absence of FAZ amendments, the total P concentration was lower in the LPMS treatment by 8% but higher by 47% in the LPMD treatment (Table 4 and Figure 5c). However, the concentrations of total P consistently increased, more than that observed for CF treatment, for both standard and double LPM treatments in the presence of FAZ amendments by 16% and 83%, respectively (Figure 5c). Soluble P concentrations were also higher than those of CF, regardless of FAZ amendments. Unexpectedly, FAZ amendments consistently increased the total P (by 77–167%), soluble P (by 110–168%), and particulate P (by 143–297%, except for CF) (Table 4 and Figure 6c).

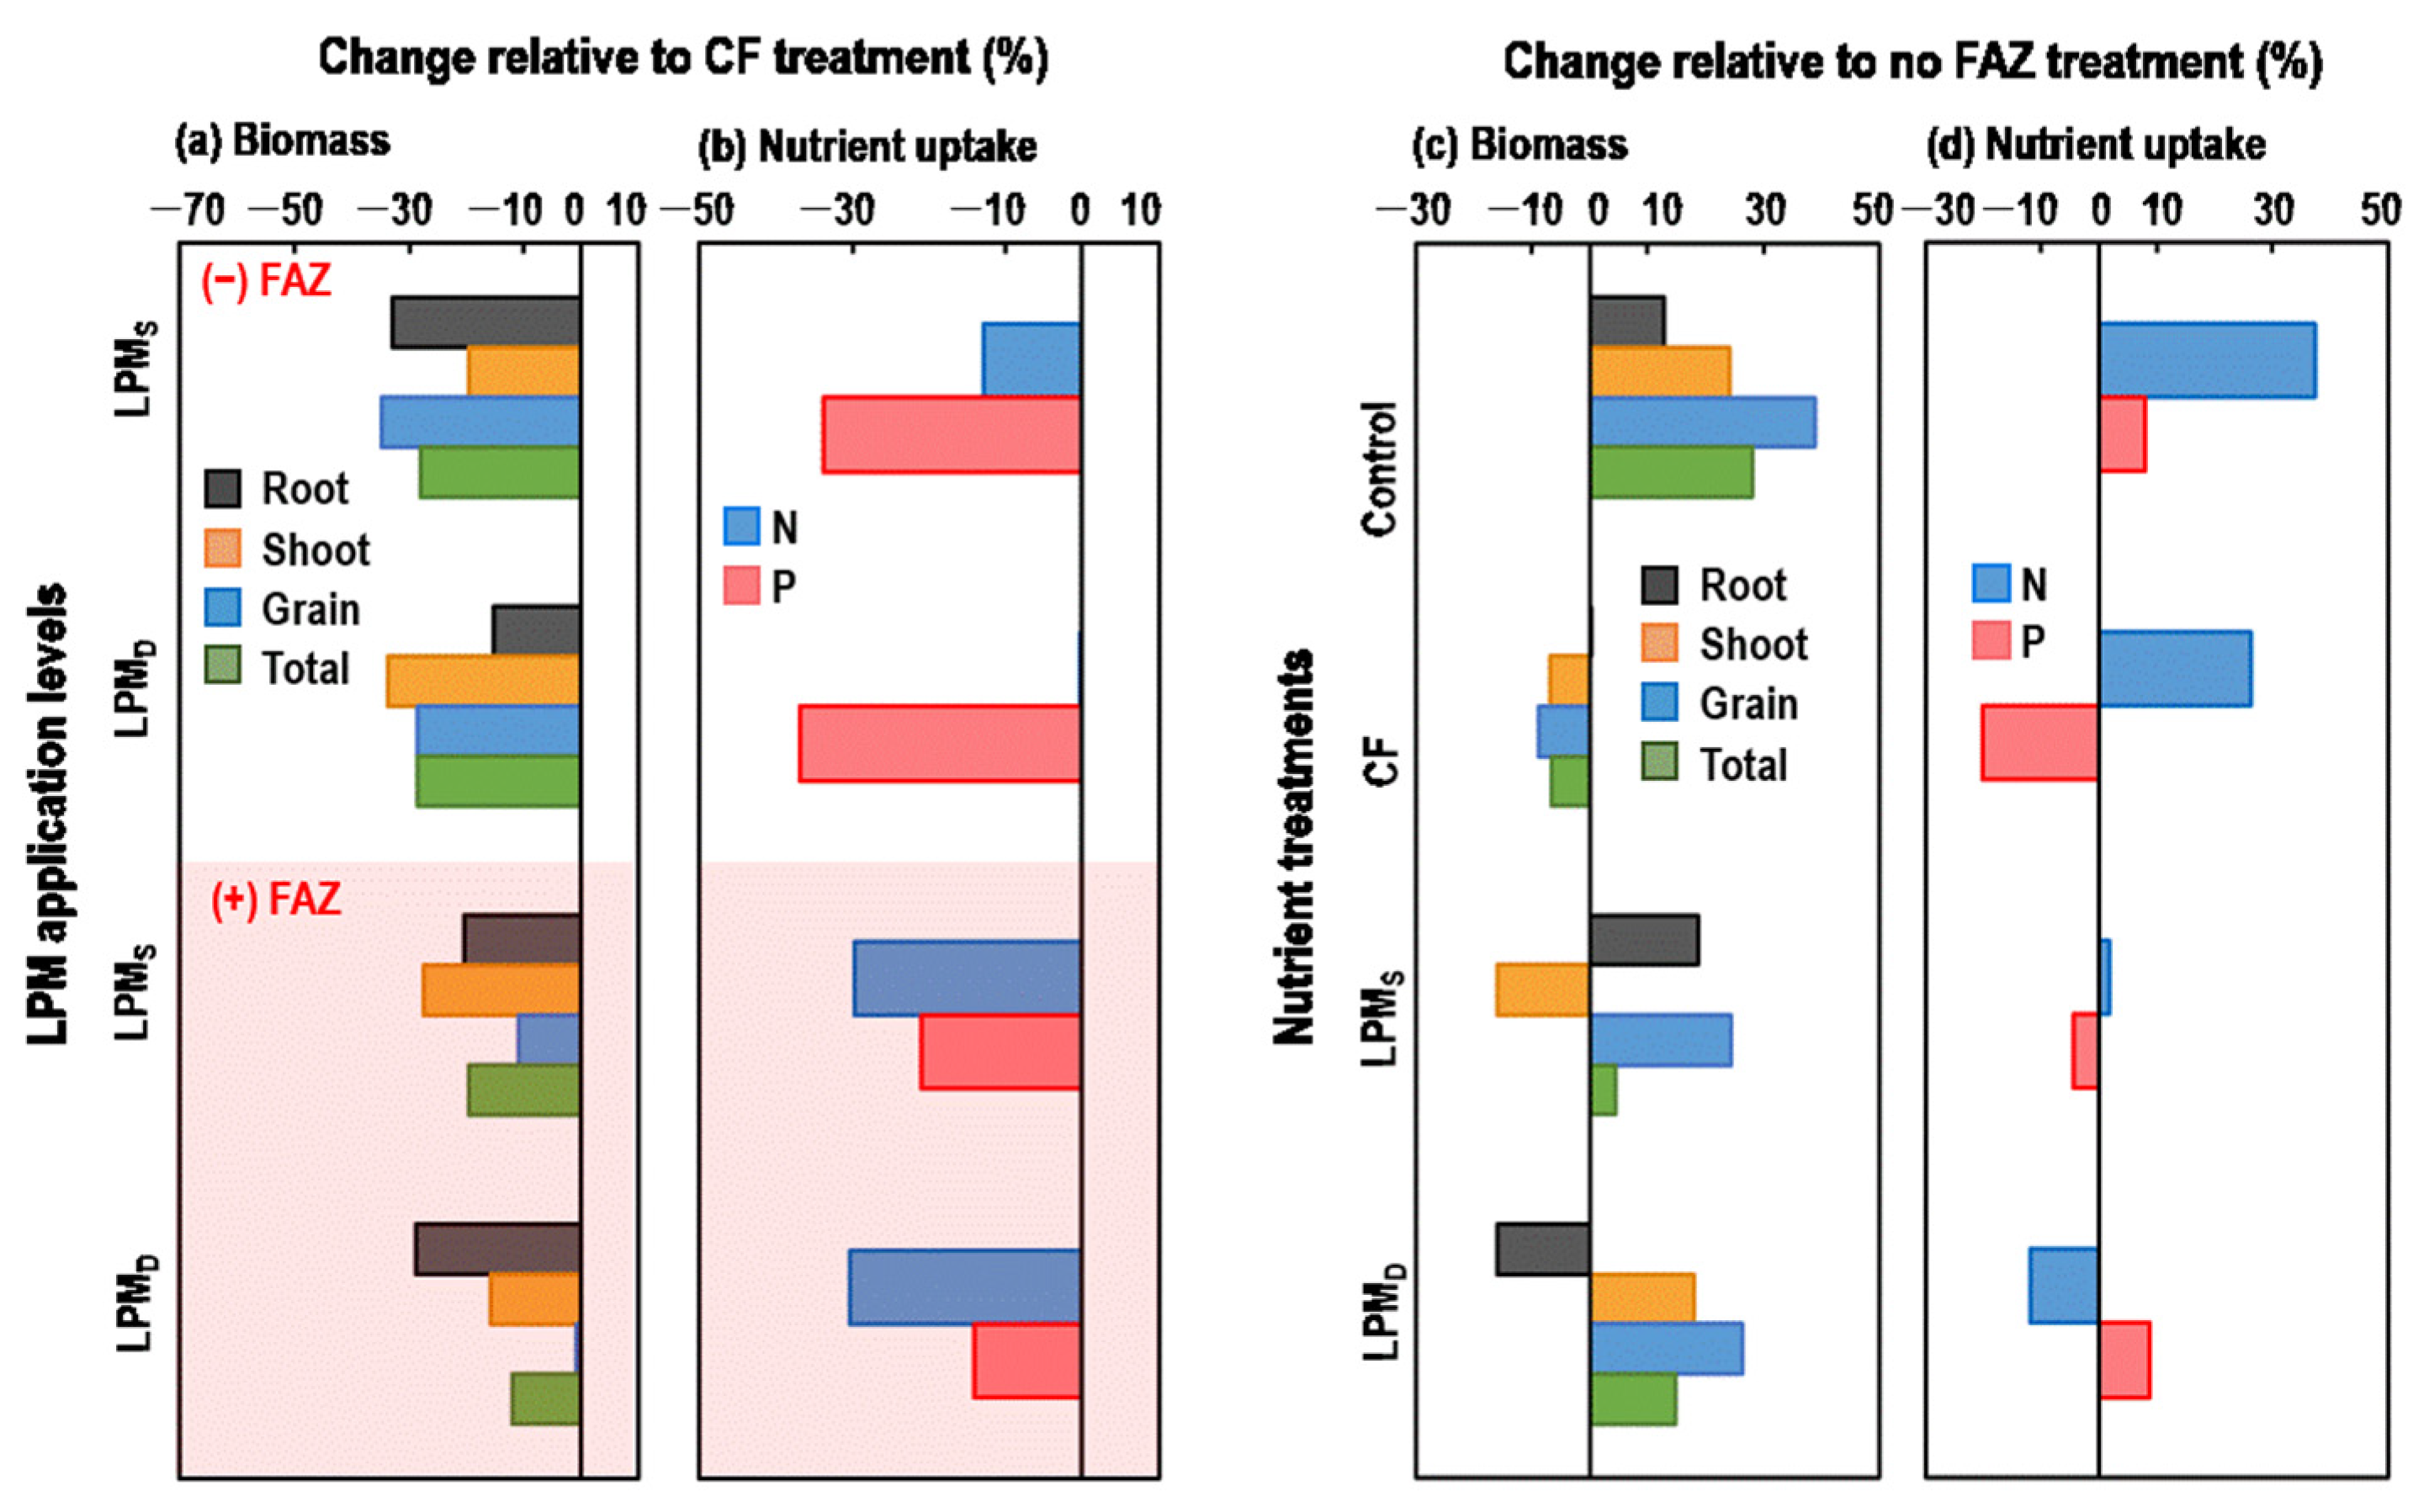
3.2. Rice Biomass and Nutrient Uptake

Rice biomass and grain yield increased by the application of CF and LPM treatments, regardless of FAZ amendments; however, FAZ did not affect rice biomass and grain yield, although an indication of increased rice biomass and grain yield due to FAZ was found for the control treatment (Table 5). In the absence of FAZ amendments, compared to CF, both rice biomass and grain yield were lower for LPMS treatment by 28% and 35% and for LPMD treatment by 28% and 29%, respectively (Figure 7a). When FAZ was applied, the reductions in rice biomass and grain yield following LPM treatments, relative to the CF treatment, were lowered to 20% and 11% for LPMS and 12% and 1% for LPMD. Although statistical significance was not detected, there was an indication that FAZ amendments increased the rice biomass and grain yield for LPM treatments but decreased them for CF treatments (Figure 7b).
The rice’s uptake of N and P also showed similar patterns to the rice biomass being affected by nutrient sources regardless of FAZ amendments (Table 5). Briefly, either CF or LPM increased N and P uptake compared to the control, and LPM application resulted in a lower N and P uptake than CF treatment, regardless of FAZ amendments. Although the effects of FAZ amendments on N and P uptake were not significant, there was an indication of increased N and P uptake for the control, increased N uptake and decreased P uptake for the CF, and decreased N uptake for the LPMD treatments (Figure 7b).

4. Discussion

4.1. FAZ Consistently Decreased DOC and NH4+ but Increased P in the Ponding Water

The increased pH and EC of ponding water by FAZ amendments (Figure 1) clearly reflect the alkaline properties of FA, which contains salts (Table 2). Although the concentrations of DOC and nutrients were affected by nutrient inputs (Table 4), the temporal pattern of the changes in DOC and nutrient concentrations—sharp increases at the fertilization time followed by gradual decreases, even for the control treatment without nutrient inputs—suggests that ponding water depth and thus, water volume also affected the concentrations of DOC and nutrients, as the water depth was maintained at a low level (<1 cm) at the fertilization time for all the treatments (Figure 2, Figure 3 and Figure 4). Among the DOC, N, and P concentrations, decreases in DOC concentration by FAZ amendments were the most apparent and consistent across nutrient treatments (Table 4 and Figure 6a). The decreased DOC concentration by FAZ amendments can be ascribed to the ability of Z to adsorb dissolved organic matter (DOM) onto its surface [22,23]. Since Z is a porous material with a high specific area, DOM may be directly adsorbed onto the electrostatically neutral sites of Z through van der Waals interactions [24]. In addition, even electrostatically negative DOM, such as humic substances, may also be adsorbed onto the negatively charged sites of Z when DOM forms complexes with cations [25].
The average NH4+ concentration consistently decreased by FAZ amendments for all nutrient treatments, including the LPM treatments (Table 4 and Figure 6b), agreeing with our hypothesis. The decreased NH4+ concentration can be ascribed to the highly negative sites on Z that can electrostatically adsorb positively charged NH4+ (Table 2) [8,15,26,27,28,29,30]. Despite this, the incident increase in NH4+ during the mid-season drainage period was not expected (Figure 3e–h). Although direct evidence is lacking, it could be postulated that NH4+ was quickly supplied to the ponding water in the FAZ-amended treatments through ammonification under less anaerobic conditions created by decreased water depth during the mid-season drainage period [31].
Although NH4+ concentration was consistently lowered by FAZ amendments for all nutrient treatments, decreases in total N concentration by FAZ amendments were only found for control and LPMD treatments (Table 4 and Figure 6b), partially disagreeing with our hypothesis. The trends in total N concentration by FAZ amendments coincided with those of organic N concentration (Figure 6b), as the high proportions of organic N to total N, ranging from 42 to 70% (Table 4), indicate that organic N is the predominant N species in ponding water. In this context, the decreases in DOC and organic N (and thus total N) concentrations for control and LPMD treatments with FAZ amendments might suggest that the immobilization of DOM by FAZ (more specifically by Z) should result in the decreased concentration of both DOC and organic N, resulting in a decreased total N concentration. However, for CF and LPMS treatments, although the DOC concentration decreased by FAZ application, this did not translate to a decrease in organic N (and thus total N) concentration (Table 4). In the present study, we were not able to explain the exact mechanisms of the increased organic N (and thus total N) concentrations by FAZ amendments in CF and LPMS treatments. In rice paddy soil, the concentrations of organic N, NH4+, and NO3 are controlled by many soil N processes, including ammonification, nitrification, immobilization, and remineralization, which are also affected by many biotic and abiotic factors [32]. For example, for the LPMS treatment, FAZ amendment increased the root biomass by 19% (Table 5 and Figure 7c); therefore, increased root biomass may lead to an increased organic N concentration via the stimulation of microbial growth [33]. In a similar fashion but in the opposite direction, the decreased organic N concentration by FAZ amendment in LPMD treatment also coincided with a decreased root biomass (Table 5 and Figure 7c). Despite the inconsistent effects of FAZ on the organic N (and thus total N) concentration of ponding water, our results show that FAZ amendment is effective in reducing the NH4+ concentration in ponding water fertilized with LPM.
The increased total P concentration in the ponding water by FAZ application (Table 4) does not support our hypotheses and disagrees with many studies that have previously reported decreased P concentrations by FA application in soilless conditions [34,35,36]. Because of the limited data available, elucidating the cause of the increased P concentration by the application of FAZ is challenging. Notwithstanding, the increase in total P concentration by FAZ application suggests that the inherent ability of FA to immobilize P in a soil environment was not performed effectively, unlike in soilless conditions. The solubility of P in rice paddy soil is highly affected by pH and associated changes in the redox potential (Eh) [32,37]. In acidic soils, the solubility of P is low due to its interaction with oxidized manganese (Mn4+) and iron (Fe3+), but the solubility of P increases with an increasing pH, which is associated with a decreased Eh. Under anaerobic conditions, like waterlogged rice paddies, P is dissociated from Fe and Mn as the solubility of reduced Fe and Mn is higher than that of oxidized Mn and Fe [38,39,40]. Therefore, our results suggest that, despite the ability of FA to immobilize P, FAZ application increases the solubility of P in waterlogged paddy soils by increasing the pH and thus decreasing Eh. Although FA can immobilize P through Ca-P association in the soil matrix [15], the increased P concentration in the ponding water implies that the magnitude of P release from initial soil-P, presented as Fe-P and Mn-P, might be greater than that of P immobilization via Ca-P mediated by FA, as also reported in experiments using aerobically digested LPM [3].

4.2. Rice Growth and Nutrient Uptake as Affected by FAZ Application

Although the effects of FAZ on rice biomass and grain yield were not statistically significant, the indication of increased rice biomass, including grain yield and nutrient uptake, in the control treatment and LPM treatments with FAZ application (Table 5 and Figure 5a), as supported by the post hoc analysis, suggests that FAZ improves the soil environment for rice growth, including the nutrient availability [41,42,43,44]. The application of FAZ increased the EC (Figure 1e–h), and thus, it may have been possible for this to cause salinity stress, as rice is sensitive to salinity stress [45,46]. However, in the present study, the ECs of the ponding water for all FAZ treatments were maintained in the range of 0.3–1.3 dS m−1, which was quite below the salinity threshold (3.0 dS m−1) of rice plants [45].
N and P uptake were not affected by FAZ amendments; however, there were indications of co-increased N and P uptake by FAZ in the control treatment, supporting increased rice biomass and grain yield through improved nutrient availability due to FAZ (Table 5). It has been previously reported that the application of Z alone increased the N uptake of rice by 0.5–3.6 g m−2 [47,48,49,50]. Furthermore, FA alone has also been reported to increase the uptake of N by rice plants, in particular, that of NH4+ rather than that of NO3, under waterlogged conditions through an improved soil environment [41,42]. The changes in N and P uptake by FAZ amendments were most evident for the CF treatment, wherein N uptake increased while P uptake decreased (Table 5). These changes in N and P uptake by FAZ amendments in the CF treatment coincided with the decreased N (particularly NH4+) and increased P concentrations in the ponding water by FAZ (Table 4). Specifically, the increased N uptake due to FAZ and the decreased NH4+ concentration in the ponding water suggest that NH4+ retention in the soil matrix by Z assisted the uptake of N by rice; meanwhile, the decreased P uptake due to FAZ and the increased P concentration in the ponding water imply that the dissolution of P through the changed soil pH and Eh did not successfully increase the available soil P, although the exact mechanisms of this are unclear. In a previous study [15], we found that FA decreased the P uptake by rice plants, likely because of the extremely high P sorption capacity of FA (>27,000 mg P kg−1) containing CaO [10] compared to that of the soil (<2000 mg P kg−1) [51]. Therefore, we propose that FAZ application may increase the P concentration of ponding water through the increased solubility of Fe-P and Mn-P, but, at the same time, it may immobilize P derived from fertilized P as Ca-P in the soil matrix mixed with FAZ.

5. Conclusions

The utilization of LPM as a nutrient source may help reduce chemical fertilizer use in large-scale rice production areas where the pig industry is also prevalent. To alleviate the potential risk of water pollution from using LPM, the co-application of FAZ can be considered as a feasible strategy. In the present study, FAZ amendments successfully decreased the concentration of DOC and NH4+ in ponding water of rice paddies fertilized with LPM, likely via sorption onto the surface of the Z. However, the concentrations of total N, NO3, and organic N were inconsistently affected by FAZ amendment due to the complexity of N processes in rice paddies. Unexpectedly, the concentrations of total P, soluble P, and particulate P in the ponding water all increased by FAZ amendments. Taking both FAZ-mediated changes in soil pH and the high Ca content of FA into consideration, we postulated that FAZ increased the dissolution of initial soil P associated with Fe and Mn into the ponding water, while it also immobilized the P added through nutrient application via Ca-P association in the soil matrix. The increased rice biomass, grain yield, and N and P uptake by FAZ amendments in the control treatment without nutrient inputs supported the positive effects of FAZ on the soil environment. However, for nutrient-added treatments, including CF and LPM, the effects of FAZ on rice growth and nutrient uptake were not consistent. Despite this, for CF treatments, the increased N uptake and decreased P uptake by rice plants, coupled with the decreased NH4+ and increased soluble P concentrations, suggested that FAZ amendment increased rice N uptake through the retention of NH4+ in the soil matrix while decreasing the rice’s P uptake by mobilizing soil Fe- and Mn-associated P into the ponding water and immobilizing the added P in the forms of Ca-P. Compared to the CF treatment, the LPM treatments increased the DOC and total P concentrations but decreased the total N concentrations in the ponding water; meanwhile, the rice biomass and grain yield were lower in LPM treatments, regardless of FAZ amendments. Therefore, it is suggested that LPM can replace CF as a nutrient source, but a full substitution of CF with LPM may hamper rice production and increase water pollution with DOC and P. Considering the nutrient recycling benefit and the reduction in CF consumption, however, it is necessary to develop an LPM-based fertilization strategy that reduces rice yield loss and water pollution. Although biochar was not tested in the present study, co-application of biochar may be an option for enabling the use of LPM in rice production with decreased water pollution concerns. In addition, the feasibility of FAZ needs to be further investigated using different rice cultivars under different soil conditions.

Author Contributions

Experiments and writing—initial draft, S.-I.L.; experiments, statistical analysis, and writing—initial draft, N.B.; data curation and experiments, S.-W.P., E.-S.S., J.L., and J.-H.H.; conceptualization, writing—review and editing, and supervision, W.-J.C. All authors have read and agreed to the published version of the manuscript.

Funding

This work was carried out with the support of the Cooperative Research Program of Agriculture Science and Technology Development (RS-2023-00230831), Rural Development Administration, Republic of Korea.

Data Availability Statement

All data sets that support the findings of this study are available in the tables and figures. Further inquiries should be directed to the corresponding author.

Conflicts of Interest

The authors declare no conflicts of interest.

Abbreviations

The following abbreviations are used in this manuscript:
LPMLiquid pig manure
FAFly ash
ZZeolite
FAZFly ash + zeolite
CFChemical fertilizer
NNitrogen
PPhosphorus
DOCDissolved organic carbon

References

  1. Jeong, Y.J.; Park, H.J.; Baek, N.; Seo, B.S.; Lee, K.S.; Kwak, J.H.; Choi, S.K.; Lee, S.M.; Yoon, K.S.; Lim, S.S.; et al. Assessment of sources variability of riverine particulate organic matter with land use and rainfall changes using a three-indicator (δ13C, δ15N, and C/N) Bayesian mixing model. Environ. Res. 2023, 216, 114653. [Google Scholar] [CrossRef] [PubMed]
  2. Prado, J.; Ribeiro, H.; Alvarenga, P.; Fangueiro, D. A step towards the production of manure based fertilizers: Disclosing the effects of animal species and slurry treatment on their nutrients content and availability. J. Clean. Prod. 2022, 337, 130369. [Google Scholar] [CrossRef]
  3. Lee, S.I.; Ham, J.H.; Baek, N.; Kim, H.Y.; Choi, W.J. Co-application of fly ash and zeolites increases N uptake but decreases P uptake and biomass of rice fertilized with fermented liquid manure. Soil Sci. Plant Nutr. 2025. [Google Scholar] [CrossRef]
  4. Kang, S.W.; Seo, D.C.; Kim, S.Y.; Cho, J.S. Utilization of liquid pig manure for resource cycling agriculture in rice-green manure crop rotation in South Korea. Environ. Monit. Assess. 2020, 192, 323. [Google Scholar] [CrossRef]
  5. Li, K.Z.; Inamura, T.; Umeda, M. Growth and Nitrogen Uptake of Paddy Rice as Influenced by Fermented Manure Liquid and Squeezed Manure Liquid. Soil Sci. Plant Nutr. 2003, 49, 463–467. [Google Scholar] [CrossRef]
  6. Zhang, J.; Cao, Y.; Liang, P.; Wu, S.; Leung, A.O.W.; Christie, P. Replacement of mineral fertilizers with anaerobically digested pig slurry in paddy fields: Assessment of plant growth and grain quality. Environ. Sci. Pollut. Res. 2017, 24, 8916–8923. [Google Scholar] [CrossRef]
  7. Qian, X.; Shen, G.; Wang, Z.; Zhang, X.; Hong, Z. Effect of swine liquid manure application in paddy field on water quality, soil fertility and crop yields. Paddy Water Environ. 2017, 16, 15–22. [Google Scholar] [CrossRef]
  8. Lee, D.S.; Lim, S.S.; Park, H.J.; Yang, H.I.; Park, S.I.; Kwak, J.H.; Choi, W.J. Fly ash and zeolite decrease metal uptake but do not improve rice growth in paddy soils contaminated with Cu and Zu. Environ. Int. 2019, 129, 551–564. [Google Scholar] [CrossRef]
  9. Basu, M.; Pande, M.; Bhadoria, P.B.S.; Mahapatra, S.C. Potential Fly-Ash Utilization in Agriculture: A Global Review. Prog. Nat. Sci. 2009, 19, 1173–1186. [Google Scholar] [CrossRef]
  10. Lee, S.I.; Lim, S.S.; Lee, K.S.; Park, W.K.; Shin, J.D.; Yoon, K.S.; Kim, H.Y.; Choi, W.J. Coal fly ash enhanced planted-floating bed performance in phosphorus-contaminated water treatment. Ecol. Eng. 2014, 73, 276–280. [Google Scholar] [CrossRef]
  11. Park, J.H.; Hwang, S.W.; Lee, S.L.; Lee, J.H.; Seo, D.C. Sorption behavior of phosphate by fly ash discharged from biomass thermal power plant. Appl. Biol. Chem. 2021, 64, 43. [Google Scholar] [CrossRef]
  12. Yamada, K.; Haraquchi, K.; Gacho, C.C.; Salinas, L.S.; Silverio, C.M.; Wongsiri, B.P. Removal of Phosphate from Aqueous Solution by Crystallization Using Coal Fly Ash. In Proceedings of the International Ash Utilization Symposium, Lexington, KY, USA, 22–24 October 2001. [Google Scholar]
  13. Englert, A.H.; Rubio, J. Characterization and Environmental Application of a Chilean Natural Zeolite. Int. J. Miner. Process. 2005, 75, 21–29. [Google Scholar] [CrossRef]
  14. Wang, S.; Peng, Y. Natural Zeolites as Effective Adsorbents in Water and Wastewater Treatment. Chem. Eng. J. 2010, 156, 11–24. [Google Scholar] [CrossRef]
  15. Lim, S.S.; Lee, D.S.; Kwak, J.H.; Park, H.J.; Kim, H.Y.; Choi, W.J. Fly ash and zeolite amendments increase soil nutrient retention but decrease paddy rice growth in a low fertility soils. J. Soils Sediments 2016, 16, 756–766. [Google Scholar] [CrossRef]
  16. Bortone, G. Integrated anaerobic/aerobic biological treatment for intensive swine production. Bioresour. Technol. 2009, 100, 5424–5430. [Google Scholar] [CrossRef]
  17. Chelme-Ayala, P.; El-Din, M.G.; Smith, R.; Code, K.R.; Leonard, J. Advanced treatment of liquid swine manure using physico-chemical treatment. J. Hazard. Mater. 2011, 186, 1632–1638. [Google Scholar] [CrossRef]
  18. Ji, A.; Guo, H.; Li, N.; Zhang, N.; Cheng, S.; Guan, J.; Li, H.; Hu, X.; Zhang, Z. Scaling sustainable pig manure treatment: Life cycle assessments for small to large piggeries in China. Sustain. Prod. Consum. 2024, 52, 166–178. [Google Scholar] [CrossRef]
  19. Sajjad, M.; Huang, Q.; Khan, S.; Nawab, J.; Khan, M.A.; Ali, A.; Ullah, R.; Kubar, A.A.; Guo, G.; Yaseen, M.; et al. Methods for the removal and recovery of nitrogen and phosphorus nutrients from animal waste: A critical review. Ecol. Front. 2024, 44, 2–14. [Google Scholar] [CrossRef]
  20. RDA (Rural Development Administration). Taxonomical Classifications of Korean Soils; RDA: Suwon, Republic of Korea, 2000.
  21. APHA-AWWA-WEF (American Public Health Association-American Water Work Association-Water Environment Federation). Standard Methods for the Examination of Water and Wastewater; American Public Health Association: Washington, DC, USA, 1998. [Google Scholar]
  22. Guo, J.; Xie, S.; Huang, Y.; Chen, M.; Wang, G. Effects and mechanisms of Cd remediation with zeolite in brown rice (Oryza sativa). Ecotoxicol. Environ. Saf. 2021, 226, 112813. [Google Scholar] [CrossRef]
  23. Ando, H.; Mihara, C.; KaKuda, K.; Wada, G. The Fate of Ammonium Nitrogen Applied to Flooded Rice as Affected by Zeolite Addition. Soil Sci. Plant Nutr. 1996, 42, 531–538. [Google Scholar] [CrossRef]
  24. Yang, X.; Zhong, H.; Zhang, W.; Liu, Y.; Sun, N.; Kuang, R.; Wang, C.; Zhan, A.; Zhang, J.; Tang, Q.; et al. Progress in Adsorptive Removal of Volatile Organic Compounds by Zeolites. Aerosol Air Qual. Res. 2023, 23, 220442. [Google Scholar] [CrossRef]
  25. Wang, C.; Guo, H.; Leng, S.; Yu, J.; Feng, K.; Cao, L.; Huang, J. Regulation of hydrophilicity/hydrophobicity of aluminosilicate zeolites: A review. Crit. Rev. Solid. State 2020, 46, 330–348. [Google Scholar] [CrossRef]
  26. Adam, M.R.; Othman, M.H.D.; Hubadilah, S.K.; Aziz, M.H.A.; Jamalludin, M.R. Application of natural zeolite clinoptilolite for the removal of ammonia in wastewater. Mater. Today-Proc. 2023. [Google Scholar] [CrossRef]
  27. Huang, Z.T.; Petrovic, A.M. Clinoptilolite Zeolite Influence on Nitrate leaching and Nitrogen Use Efficiency in simulated Sand Based Golf Greens. J. Environ. Qual. 1994, 23, 1190–1194. [Google Scholar] [CrossRef]
  28. Sepaskhah, A.R.; Yousefi, F. Effects of Zeolite Application on Nitrate and Ammonium Retention of a Loamy Soil under Saturated Conditions. Soil Res. 2007, 45, 368–373. [Google Scholar] [CrossRef]
  29. Sutherland, A.; Daroub, S.H.; Ognevich, I. Addition of Clinoptilolite Zeolite to a Simulated Sandy Medium to Reduce Nitrogen Leaching. Soil Crop Sci. Soc. Fla. 2004, 63, 88–91. [Google Scholar]
  30. Tarkalson, D.D.; Ippolito, J.A. Clinoptilolite Zeolite Influence on Inorganic Nitrogen in Silt Loam and Sandy Agricultural Soils. Soil Sci. 2010, 175, 357–362. [Google Scholar] [CrossRef]
  31. Fang, Y.; Qiu, J.; Li, X. Mechanisms of Irrigation Water Levels on Nitrogen Transformation and Microbial Activity in Paddy Fields. Water 2024, 16, 3021. [Google Scholar] [CrossRef]
  32. Park, H.J.; Lim, S.S.; Kwak, J.H.; Baek, W.J.; Yoon, K.S.; Choi, S.M.; Choi, W.J. Nitrogen inputs with different substrate quality modified pH, Eh, and N dynamics of a paddy soil incubated under waterlogged conditions. Commun. Soil Sci. Plant Anal. 2015, 46, 2234–2248. [Google Scholar] [CrossRef]
  33. Moore, J.A.; Sulman, B.N.; Mayes, M.A.; Patterson, C.M.; Classen, A.T. Plant roots stimulate the decomposition of complex, but not simple, soil carbon. Funct. Ecol. 2020, 34, 899–910. [Google Scholar] [CrossRef]
  34. Chen, J.; Kong, H.; Wu, D.; Chen, X.; Zhang, D.; Sun, Z. Phosphate immobilization from aqueous solution by fly ashes in relation to their composition. J. Hazard. Mater. 2007, 139, 293–300. [Google Scholar] [CrossRef]
  35. Li, Y.; Liu, C.; Luan, Z.; Peng, X.; Zhu, C.; Chen, Z.; Zhang, Z.; Fan, J.; Jia, Z. Phosphate removal from aqueous solutions using raw and activated red mud and fly ash. J. Hazard. Mater. 2006, 137, 374–383. [Google Scholar] [CrossRef] [PubMed]
  36. Lu, S.G.; Bai, S.Q.; Zhu, L.; Shan, H.D. Removal Mechanism of Phosphate from Aqueous Solution by Fly Ash. J. Hazard. Mater. 2009, 161, 95–101. [Google Scholar] [CrossRef] [PubMed]
  37. Husson, O. Redox potential (Eh) and pH as drivers of soil/plant/microorganism systems: A transdisciplinary overview pointing to integrative opportunities for agronomy. Plant Soil 2013, 362, 389–417. [Google Scholar] [CrossRef]
  38. Gu, S.; Gruau, G.; Dupas, R.; Petitjean, P.; Li, Q.; Pinay, G. Respective roles of Fe- oxyhydroxide dissolution, pH changes and sediment inputs in dissolved phosphorus release from wetland soils under anoxic conditions. Geoderma 2019, 338, 365–374. [Google Scholar] [CrossRef]
  39. Khan, I.; Fahad, S.; Wu, L.; Zhou, W.; Xu, P.; Sun, Z.; Salam, A.; Imran, M.; Jiang, M.; Kuzyakov, Y.; et al. Labile Organic Matter Intensifies Phosphorous Mobilization in Paddy Soils by Microbial Iron (III) Reduction. Geoderma 2019, 352, 185–196. [Google Scholar] [CrossRef]
  40. Zhang, S.; Yang, X.; Hsu, L.C.; Liu, Y.T.; Wang, S.L.; White, J.R.; Shaheen, S.M.; Chen, Q.; Rinklebe, J. Soil acidification enhances the mobilization of phosphorus under anoxic conditions in an agricultural soil: Investigating the potential for loss of phosphorus to water and the associated environmental risk. Sci. Total Environ. 2021, 793, 148531. [Google Scholar] [CrossRef]
  41. Lee, H.; Ha, H.S.; Lee, C.H.; Lee, Y.B.; Kim, P.J. Fly Ash Effect on Improving Soil Properties and Rice Productivity in Korean Paddy Soils. Bioresour. Technol. 2006, 97, 1490–1497. [Google Scholar] [CrossRef]
  42. Mishra, M.; Sahu, R.K.; Padhy, R.N. Growth, Yield and Elemental Status of Rice (Oryza sativa) Grown in Fly Ash Amended Soils. Ecotoxicology 2007, 16, 271–278. [Google Scholar] [CrossRef]
  43. Rautaray, S.K.; Ghosh, B.C.; Mittra, B.N. Effect of Fly Ash, Organic Wastes and Chemical Fertilizers on Yield, Nutrient Uptake, Heavy Metal Content and Residual Fertility in a Rice-Mustard Cropping Sequence under Acid Lateritic Soils. Bioresour. Technol. 2003, 90, 275–283. [Google Scholar] [CrossRef]
  44. Singh, L.P.; Siddiqui, Z.A. Effects of fly ash and Helminthosporium oryzae on growth and yield of three cultivars of rice. Bioresour. Technol. 2003, 86, 73–78. [Google Scholar] [CrossRef] [PubMed]
  45. Aref, F. Effect of saline irrigation water on yield and yield components of rice (Oryza sativa L.). Afr. J. Biotechnol. 2013, 12, 3503–3513. [Google Scholar] [CrossRef]
  46. Aref, F.; Rad, H.E. Physiological characterization of rice under salinity stress during vegetative and reproductive stages. Indian J. Sci. Technol. 2012, 5, 1–9. [Google Scholar] [CrossRef]
  47. Chen, T.; Xia, G.; Wu, Q.; Zheng, J.; Jin, Y.; Sun, D.; Wang, S.; Chi, D. The influence of zeolite amendment on yield performance, quality characteristics, and nitrogen use efficiency of paddy rice. Crop Sci. 2017, 57, 2777–2787. [Google Scholar] [CrossRef]
  48. Kavoosi, M. Effects of Zeolite Application on Rice Yield, Nitrogen Recovery, and Nitrogen Use Efficiency. Commun. Soil Sci. Plant Anal. 2007, 38, 69–76. [Google Scholar] [CrossRef]
  49. Sepaskhah, A.R.; Barzegar, M. Yield, water and nitrogen-use response of rice to zeolite and nitrogen fertilization in a semi-arid environment. Agric. Water Manag. 2010, 98, 38–44. [Google Scholar] [CrossRef]
  50. Villarreal-Núñez, J.E.; Barahona-Amores, L.A.; Castillo-Ortiz, O.A. Effect of zeolite on the nitrogen fertilizer efficiency in rice crop. Agron. Mesoam. 2015, 26, 315–321. [Google Scholar] [CrossRef]
  51. Kim, H.Y.; Lim, S.S.; Kwak, J.H.; Lee, S.I.; Lee, D.S.; Hao, X.; Yoon, K.S.; Choi, W.J. Soil and compost type affect phosphorus leaching from Inceptisol, Ultisol, and Andisol in a column experiment. Commun. Soil Sci. Plant Anal. 2007, 42, 2188–2199. [Google Scholar] [CrossRef]
Figure 1. Changes in the pH and electrical conductivity (EC) of the ponding water of rice paddies with different nutrient sources, as affected by the co-application of fly ash and zeolite (FAZ): (ad) pH and (eh) EC. Details of the nutrient treatment codes are provided in Table 3. (−) FAZ and (+) FAZ indicate without and with FAZ amendments, respectively. The values are the means of triplicate experiments, and the vertical bars are the standard errors of the means. The ANOVA p values for the effects of nutrient sources, FAZ, and their interactions on pH were 0.138, <0.001, and 0.615, respectively, and those for EC were 0.003, <0.001, and 0.730, respectively. The t-test p values for the effects of FAZ on pH and EC are depicted.
Water 17 01189 g001
Figure 2. Changes in the dissolved organic C concentration of the ponding water of paddies with different nutrient sources, as affected by the co-application of fly ash and zeolite (FAZ): (a) control, (b) CF, (c) LPMS, and (d) LPMD. Details of the nutrient treatment codes are provided in Table 3. (−) FAZ and (+) FAZ indicate without and with FAZ amendments, respectively. The values are the means of triplicate experiments, and the vertical bars are the standard errors of the means. The ANOVA results are provided in Table 4. The t-test p values for the effects of FAZ on the total N and P concentrations are depicted.
Water 17 01189 g002
Figure 3. Changes in the total N, NH4+, NO3, and organic N concentrations of the ponding water of paddies with different nutrient sources, as affected by the co-application of fly ash and zeolite (FAZ): (ad) total N, (eh) NH4+, (il) NO3, and (mp) organic N. Details of the nutrient treatment codes are provided in Table 3. The values are the means of triplicate experiments, and the vertical bars are the standard errors of the means. The ANOVA results are provided in Table 4. The t-test p values for the effects of FAZ on the total N and P concentrations are depicted.
Water 17 01189 g003
Figure 4. Changes in the total, soluble, and particulate P concentrations of the ponding water of paddies with different nutrient sources, as affected by the co-application of fly ash and zeolite (FAZ): (ad) total P, (eh) soluble P, and (il) particulate P. Details of the nutrient treatment codes are provided in Table 3. The values are the means of triplicate experiments, and the vertical bars are the standard errors of the means. The ANOVA results are provided in Table 4. The t-test p values for the effects of FAZ on the total N and P concentrations are depicted.
Water 17 01189 g004
Figure 5. Percentage changes in the DOC, N, and P concentrations of the ponding water of rice paddies treated with liquid pig manure (LPM) at the standard rate (LPMS) and at the double standard rate (LPMD) compared to chemical fertilization (CF): (a) DOC, (b) nitrogen (total N, NH4+, NO3, and organic N (Org-N)), and (c) phosphorus (total P, soluble P (SP), and particulate P (PP)). Details of the LPM treatment codes are provided in Table 3.
Water 17 01189 g005
Figure 6. Percentage changes in the DOC, N, and P concentrations of the ponding water of paddies with different nutrient sources, as affected by the co-application of fly ash and zeolite (FAZ): (a) DOC, (b) nitrogen (total N, NH4+, NO3, and organic N (Org-N)), and (c) phosphorus (total P, soluble P (SP), and particulate P (PP)). Details of the nutrient treatment codes are provided in Table 3.
Water 17 01189 g006
Figure 7. Changes in rice biomass (dry matter) and nutrient uptake as affected by different nutrient sources and the co-application of fly ash and zeolite (FAZ): (a,b) percentage changes in biomass and nutrient uptake of LPM treatments relative to CF and (c,d) percentage changes in biomass and nutrient uptake of different nutrient treatments by FAZ amendments. Details of the nutrient treatment codes are provided in Table 3.
Water 17 01189 g007
Table 1. Characteristics of the fermented liquid pig manure used in this study.
VariableValue
pH 9.3 (0.0)
EC (dS m−1)19.3 (0.0)
Total organic C (mg C L−1)1.73 (0.01)
Nitrogen (g N L−1)Total N, 3.18 (0.20); NH4+, 0.73 (0.02); NO3, 0.02 (0.00); organic N, 2.43 (0.19)
Total P (g P L−1)0.113 (0.01)
Cations (mg L−1)Ca, 37.4 (0.2); K, 2252.3 (8.4); Mg, 2.1 (0.0); Na, 410.3 (3.6)
Note(s): Values are the means of triplicate measurements with the standard errors in parentheses.
Table 2. Physicochemical properties of the soil and amendments used in this study.
VariableFly AshZeolite
pH (1:5)11.7 (0.1)6.9 (0.1)
EC1:5 (dS m−1)1.55 (0.02)0.17 (0.01)
T-C (g C kg−1)24.2 (0.1)0.29 (0.02)
T-N (g N kg−1)0.60 (0.01)0.07 (0.00)
T-P (g P kg−1)1.58 (0.01)0.11 (0.01)
Cation exchange capacity (cmolc kg−1)1.8 (0.0)107.0 (0.0)
Particle-size distribution (%)Clay1.8 (0.8)53.1 (0.8)
Silt75.4 (0.6)31.0 (0.7)
Sand1.9 (0.8)15.9 (0.0)
Specific surface area (m2 g−1)1.8 (0.1)53.2 (2.2)
Note(s): Values are the means of triplicate measurements with the standard errors in parentheses.
Table 3. Experimental settings for the different nutrient sources and soil amendments.
Treatment Code aNutrient Inputs (g m−2) bSoil Amendments (FAZ)
(kg m−2)
Nutrient SourceNP2O5K2O
ControlNo input0000
ControlFAZNo input00026
CFCF111.975.560
CFFAZCF111.975.5626
LPMSLPMS112.367.80
LPMS+FAZLPMS112.367.826
LPMDLPMD222.7515.60
LPMD+FAZLPMD222.7515.626
Note(s): a Control, no input; CF, chemical fertilizer; LPMS, fermented liquid pig manure (LPM) at the standard N level; and LPMD, LPM at double N level. b The amounts of P and K differed for the CF, LPMS, and LPMD treatments because of the P and K already present in LPM.
Table 4. The average concentrations of dissolved organic carbon (DOC), nitrogen, and phosphorus in the ponding water during 94 days of rice growth, as affected by the nutrient sources and fly ash and zeolite (FAZ) amendments.
Treatment
Code a
DOC
(mg C L−1)
Nitrogen (mg N L−1)Phosphorus (mg P L−1)
T–NNH4+NO3Organic NT–PSoluble PParticulate P
Control7.7 (0.3) b14.8 (0.4) e5.0 (0.7) cd0.20 (0.1) a9.6 (0.8) e0.10 (0.0) a0.08 (0.0) a0.02 (0.02) a
ControlFAZ5.3 (0.7) a10.9 (0.5) ab4.7 (0.2) bc0.24 (0.1) ab6.1 (0.5) bc0.27 (0.0) ab0.22 (0.0) ab0.06 (0.03) a
CF8.4 (0.6) bc12.0 (0.5) c6.7 (0.9) f0.32 (0.2) ab5.0 (1.0) a0.22 (0.1) ab0.15 (0.0) a0.09 (0.08) a
CFFAZ7.2 (0.6) b13.6 (0.4) d6.0 (0.5) ef0.41 (0.1) b8.0 (0.4) d0.39 (0.1) bcd0.33 (0.1) bc0.08 (0.04) a
LPMS11.1 (0.6) d11.4 (0.4) b5.7 (0.7) de0.32 (0.1) ab5.3 (0.9) ab0.21 (0.1) a0.18 (0.1) ab0.03 (0.02) a
LPMS+FAZ9.4 (1.5) cd12.1 (0.7) c4.0 (0.3) ab0.17 (0.1) a7.9 (0.5) d0.46 (0.1) cd0.43 (0.1) cd0.09 (0.05) a
LPMD11.9 (0.6) d23.2 (0.8) f6.8 (0.8) f0.21 (0.1) a16.3 (1.0) f0.33 (0.1) abc0.26 (0.1) abc0.07 (0.04) a
LPMD+FAZ7.3 (0.4) b10.3 (0.6) a3.3 (0.3) a0.22 (0.0) ab6.7 (0.6) c0.72 (0.1) d0.56 (0.2) d0.27 (0.21) b
EffectsProbability > F
Nutrient
source (N)
<0.001<0.001<0.0010.045<0.0010.0140.003<0.001
FAZ<0.001<0.001<0.0010.931<0.001<0.001<0.001<0.001
N × FAZ0.014<0.001<0.0010.205<0.0010.4060.5450.003
Note(s): a Details of the treatment codes are provided in Table 3. The values are the means of triplicate measurements with the standard errors in parentheses. Different lowercase letters indicate significant differences (p < 0.05) among the treatments.
Table 5. Changes in the rice plant biomass and uptake of nitrogen and phosphorus as affected by the nutrient sources and soil amendments (FAZ).
Treatment Code aDry Matter (g m −2)Nutrient Uptake (g m−2)
RootShootGrainTotalNP
Control125.8 (8.2) a277.8 (16.7) a287.5 (29.0) a691.0 (50.1) a2.8 (0.4) a3.1 (0.4) a
ControlFAZ141.9 (14.7) a344.9 (20.0) ab399.1 (17.3) ab885.9 (38.6) ab3.8 (0.2) ab3.4 (0.3) a
CF230.5 (19.1) b594.2 (55.2) c574.7 (35.4) b1399.4 (88.2) d5.8 (0.8) c6.3 (0.4) c
CFFAZ230.8 (13.1) b553.8 (23.3) c523.5 (81.8) ab1308.1 (83.6) cd7.3 (0.6) d5.0 (0.7) bc
LPMS154.7 (12.7) a478.3 (30.8) bc374.9 (28.0) ab1007.9 (32.0) abc5.1 (0.5) bc4.1 (0.3) ab
LPMS+FAZ183.6 (10.8) ab402.4 (14.4) ab466.1 (36.9) ab1052.1 (46.7) bc5.2 (0.4) bc4.0 (0.4) ab
LPMD195.3 (14.1) ab394.6 (14.5) ab410.6 (15.8) ab1000.4 (32.4) abc5.8 (0.6) c4.0 (0.2) ab
LPMD+FAZ164.3 (13.4) ab466.0 (25.2) bc519.1 (35.4) ab1149.3 (70.0) bcd5.1 (0.1) bc4.3 (0.6) ab
EffectsProbability > F
Nutrient source (N)0.003<0.0010.087<0.001<0.001<0.001
FAZ0.8150.8620.2400.3220.1750.507
N × FAZ0.5360.2730.6640.5290.1350.249
Note(s): a Details of the treatment codes are provided in Table 3. The values are the means of triplicate measurements with the standard errors in parentheses. Different lowercase letters indicate significant differences (p < 0.05) among the treatments.
Disclaimer/Publisher’s Note: The statements, opinions and data contained in all publications are solely those of the individual author(s) and contributor(s) and not of MDPI and/or the editor(s). MDPI and/or the editor(s) disclaim responsibility for any injury to people or property resulting from any ideas, methods, instructions or products referred to in the content.

