
Modeling the River Health and Environmental Scenario of the Decaying Saraswati River, West Bengal, India, Using Advanced Remote Sensing and GIS

 , , and
Abstract
1. Introduction
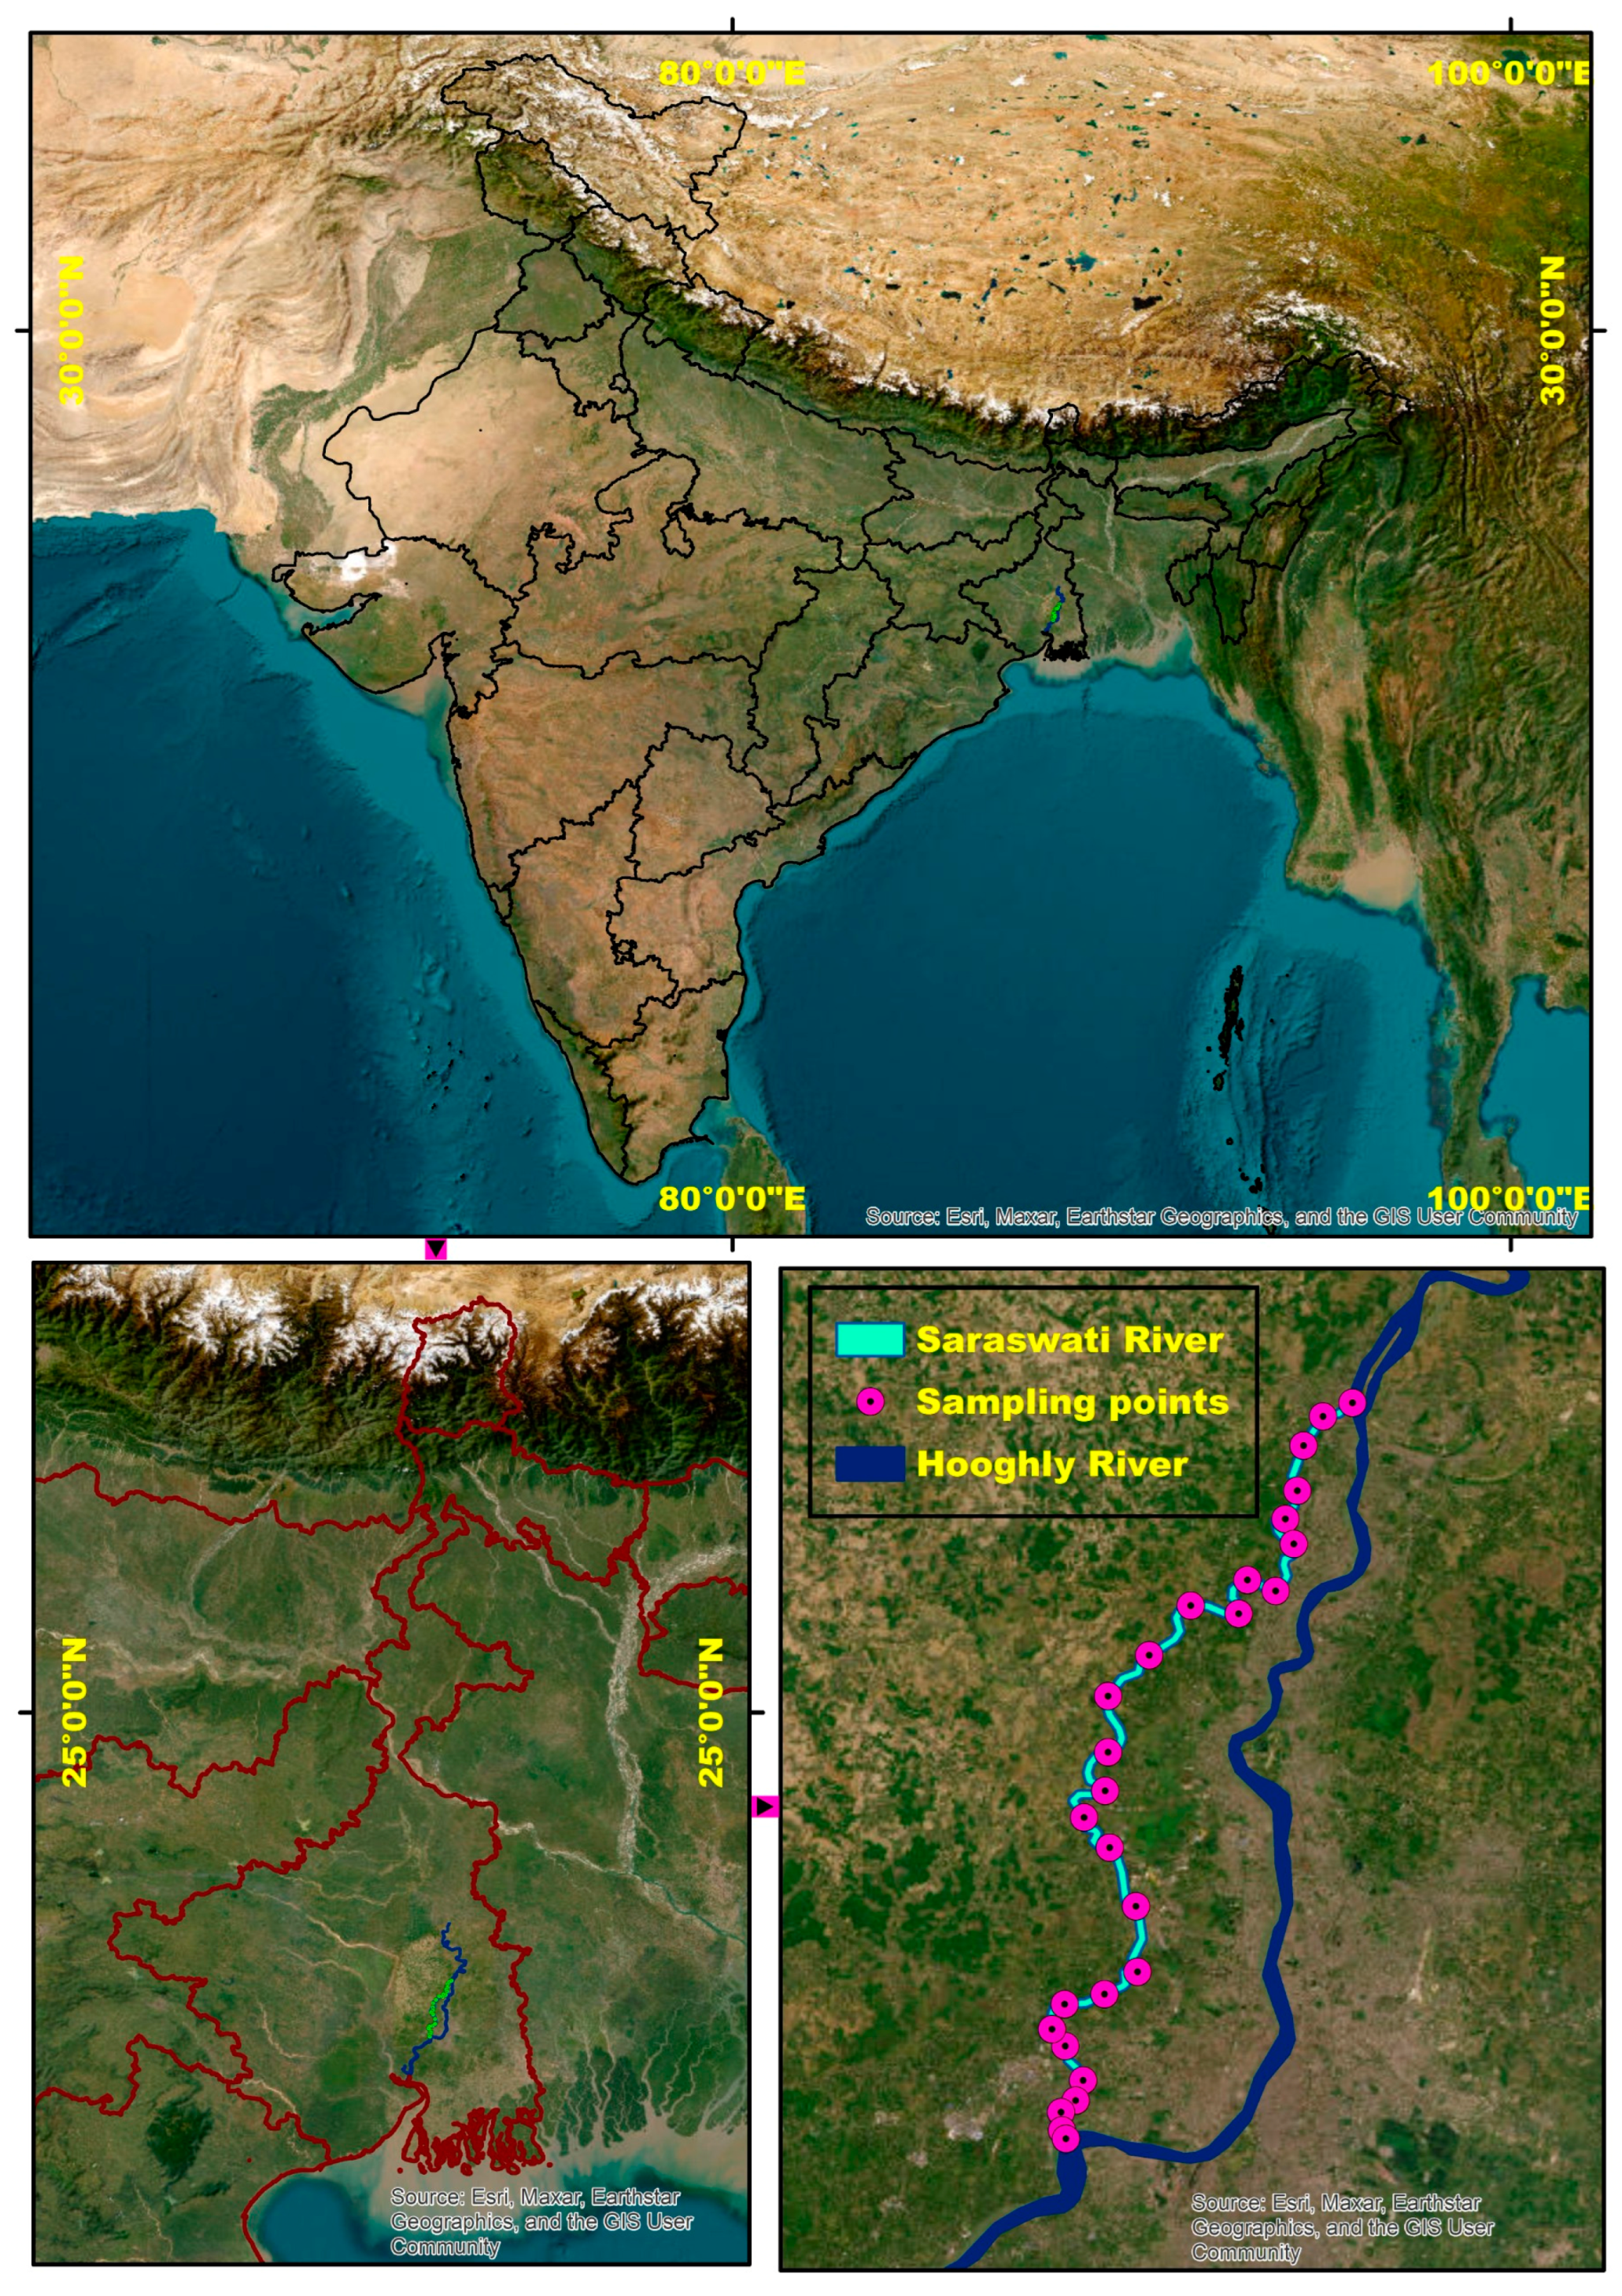
2. Study Area
3. Materials and Methods
3.1. Present Environmental Scenario Assessment of the River
3.2. WQI Using Google Earth Engine (GEE) and Advanced Remote Sensing
3.3. WQI Computation Using an Arithmetic Weighted Index
3.4. Methods Used for Validation
4. Results and Discussion
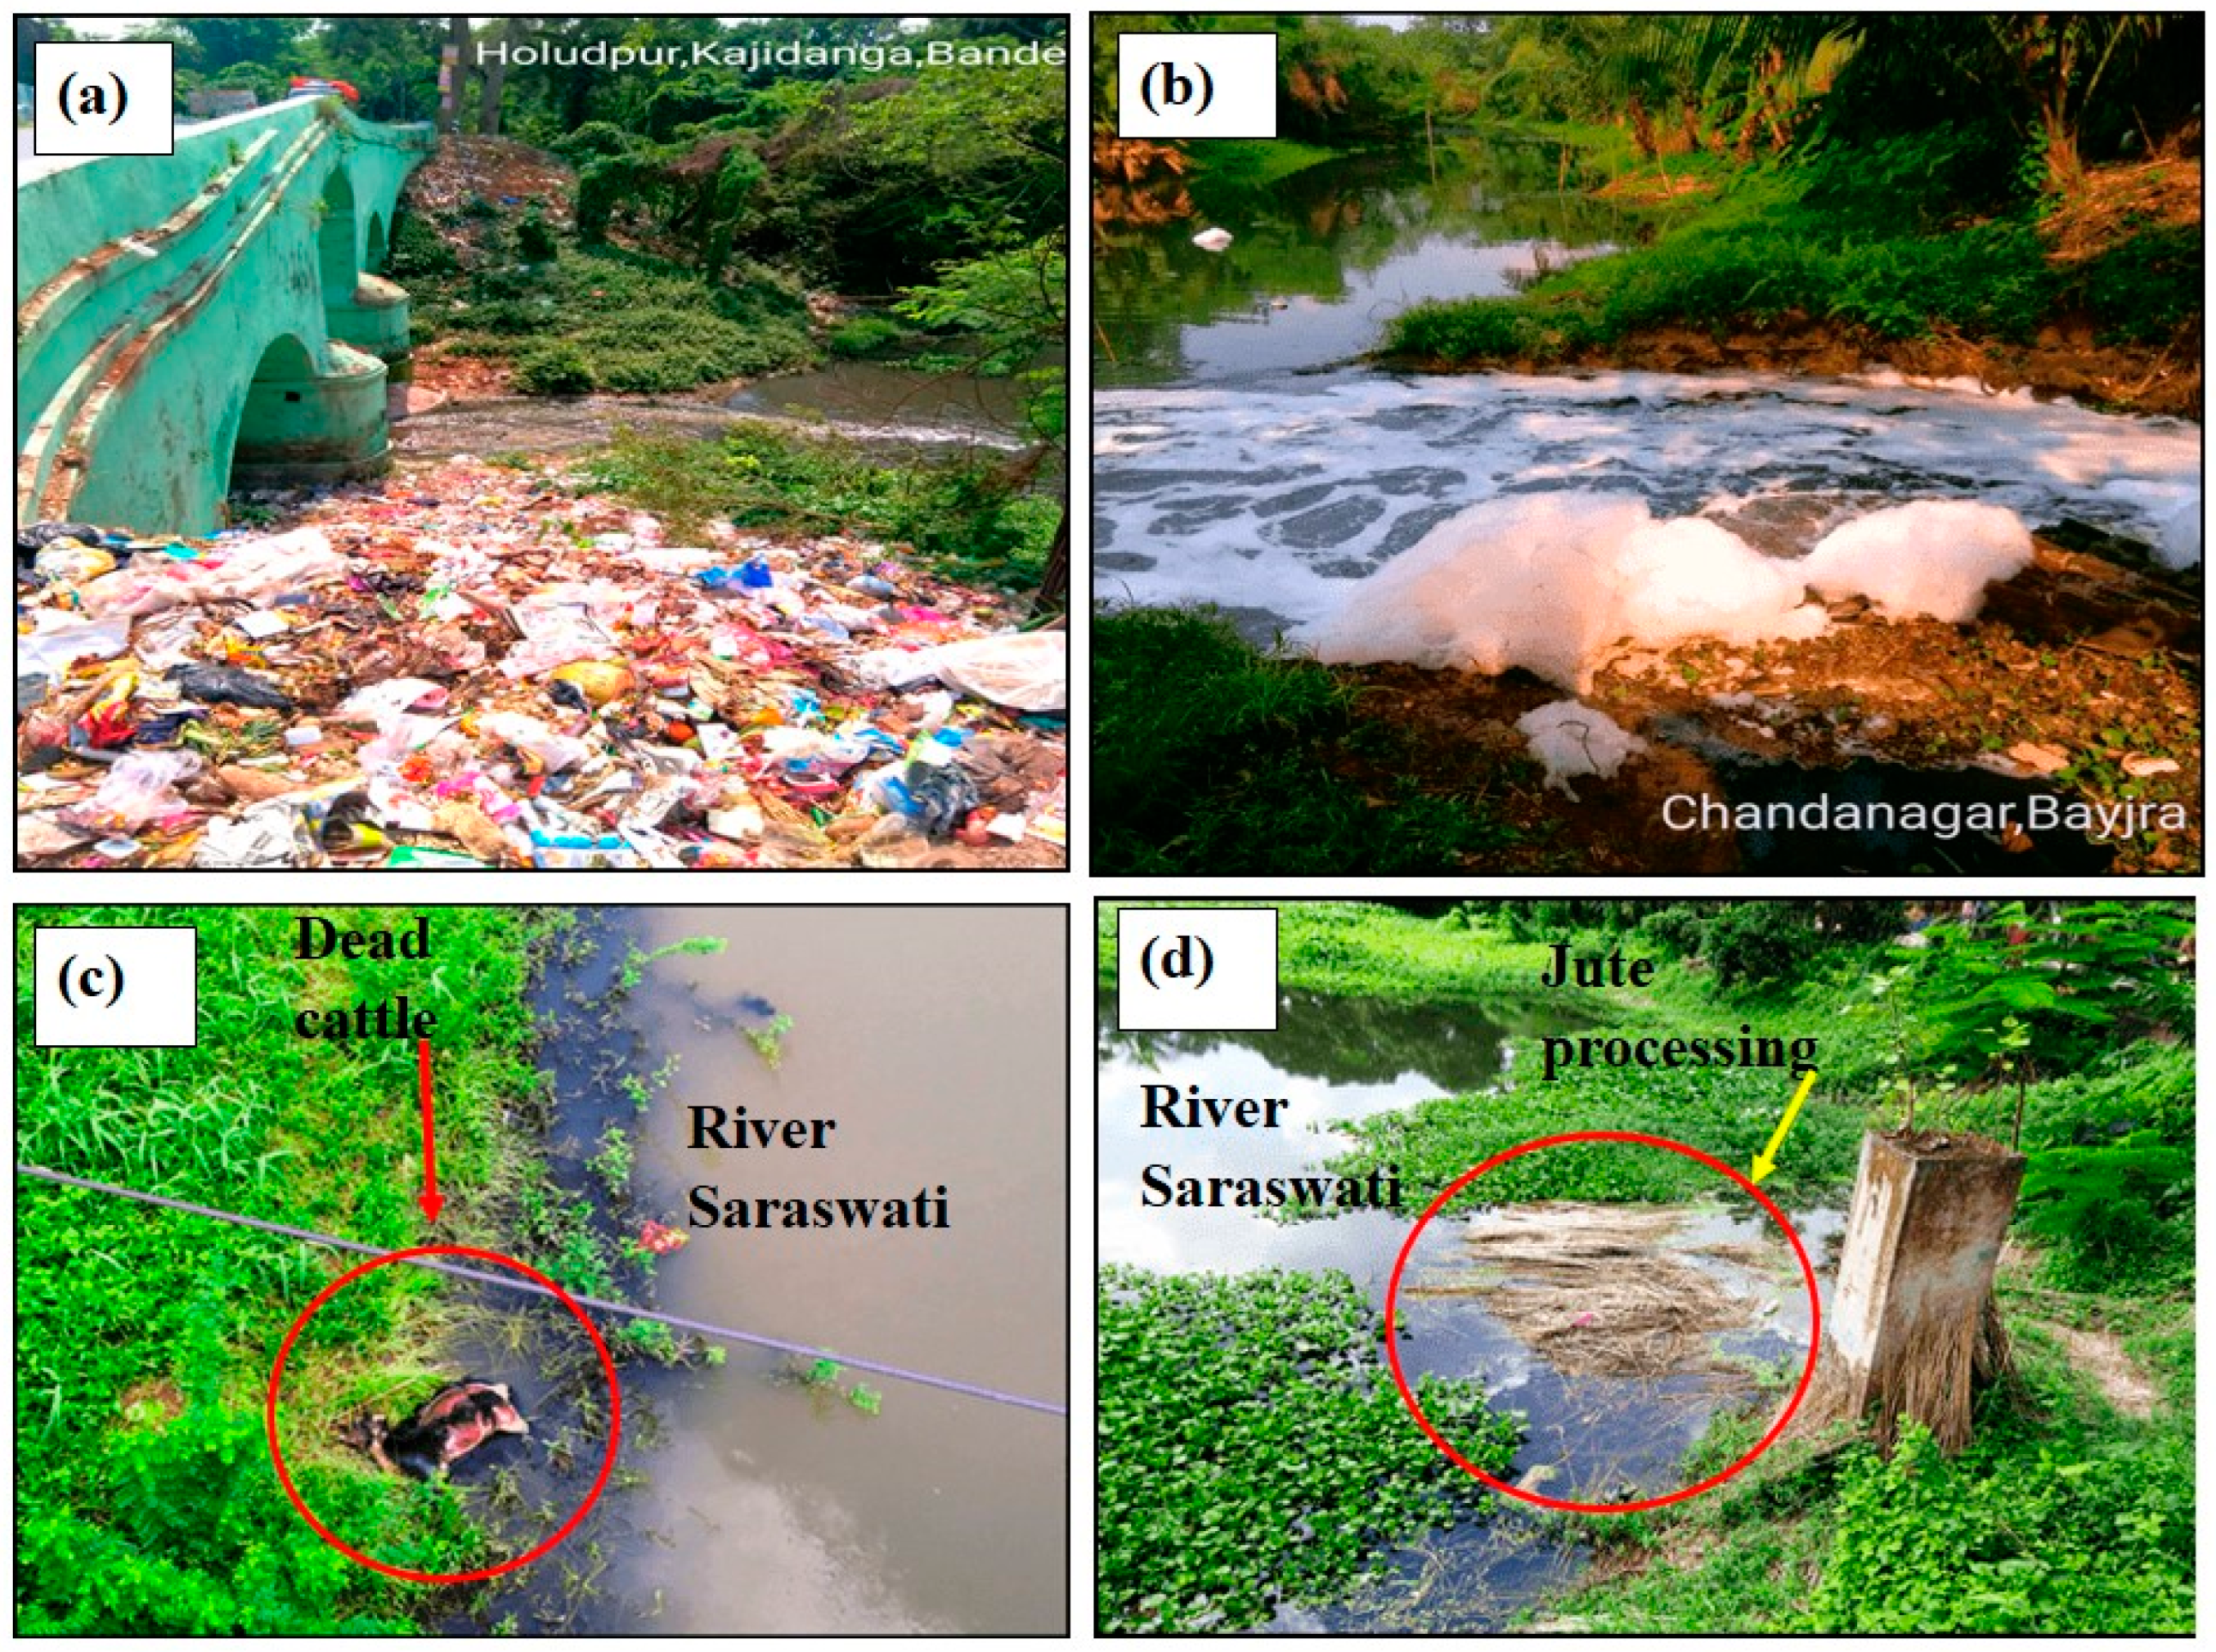
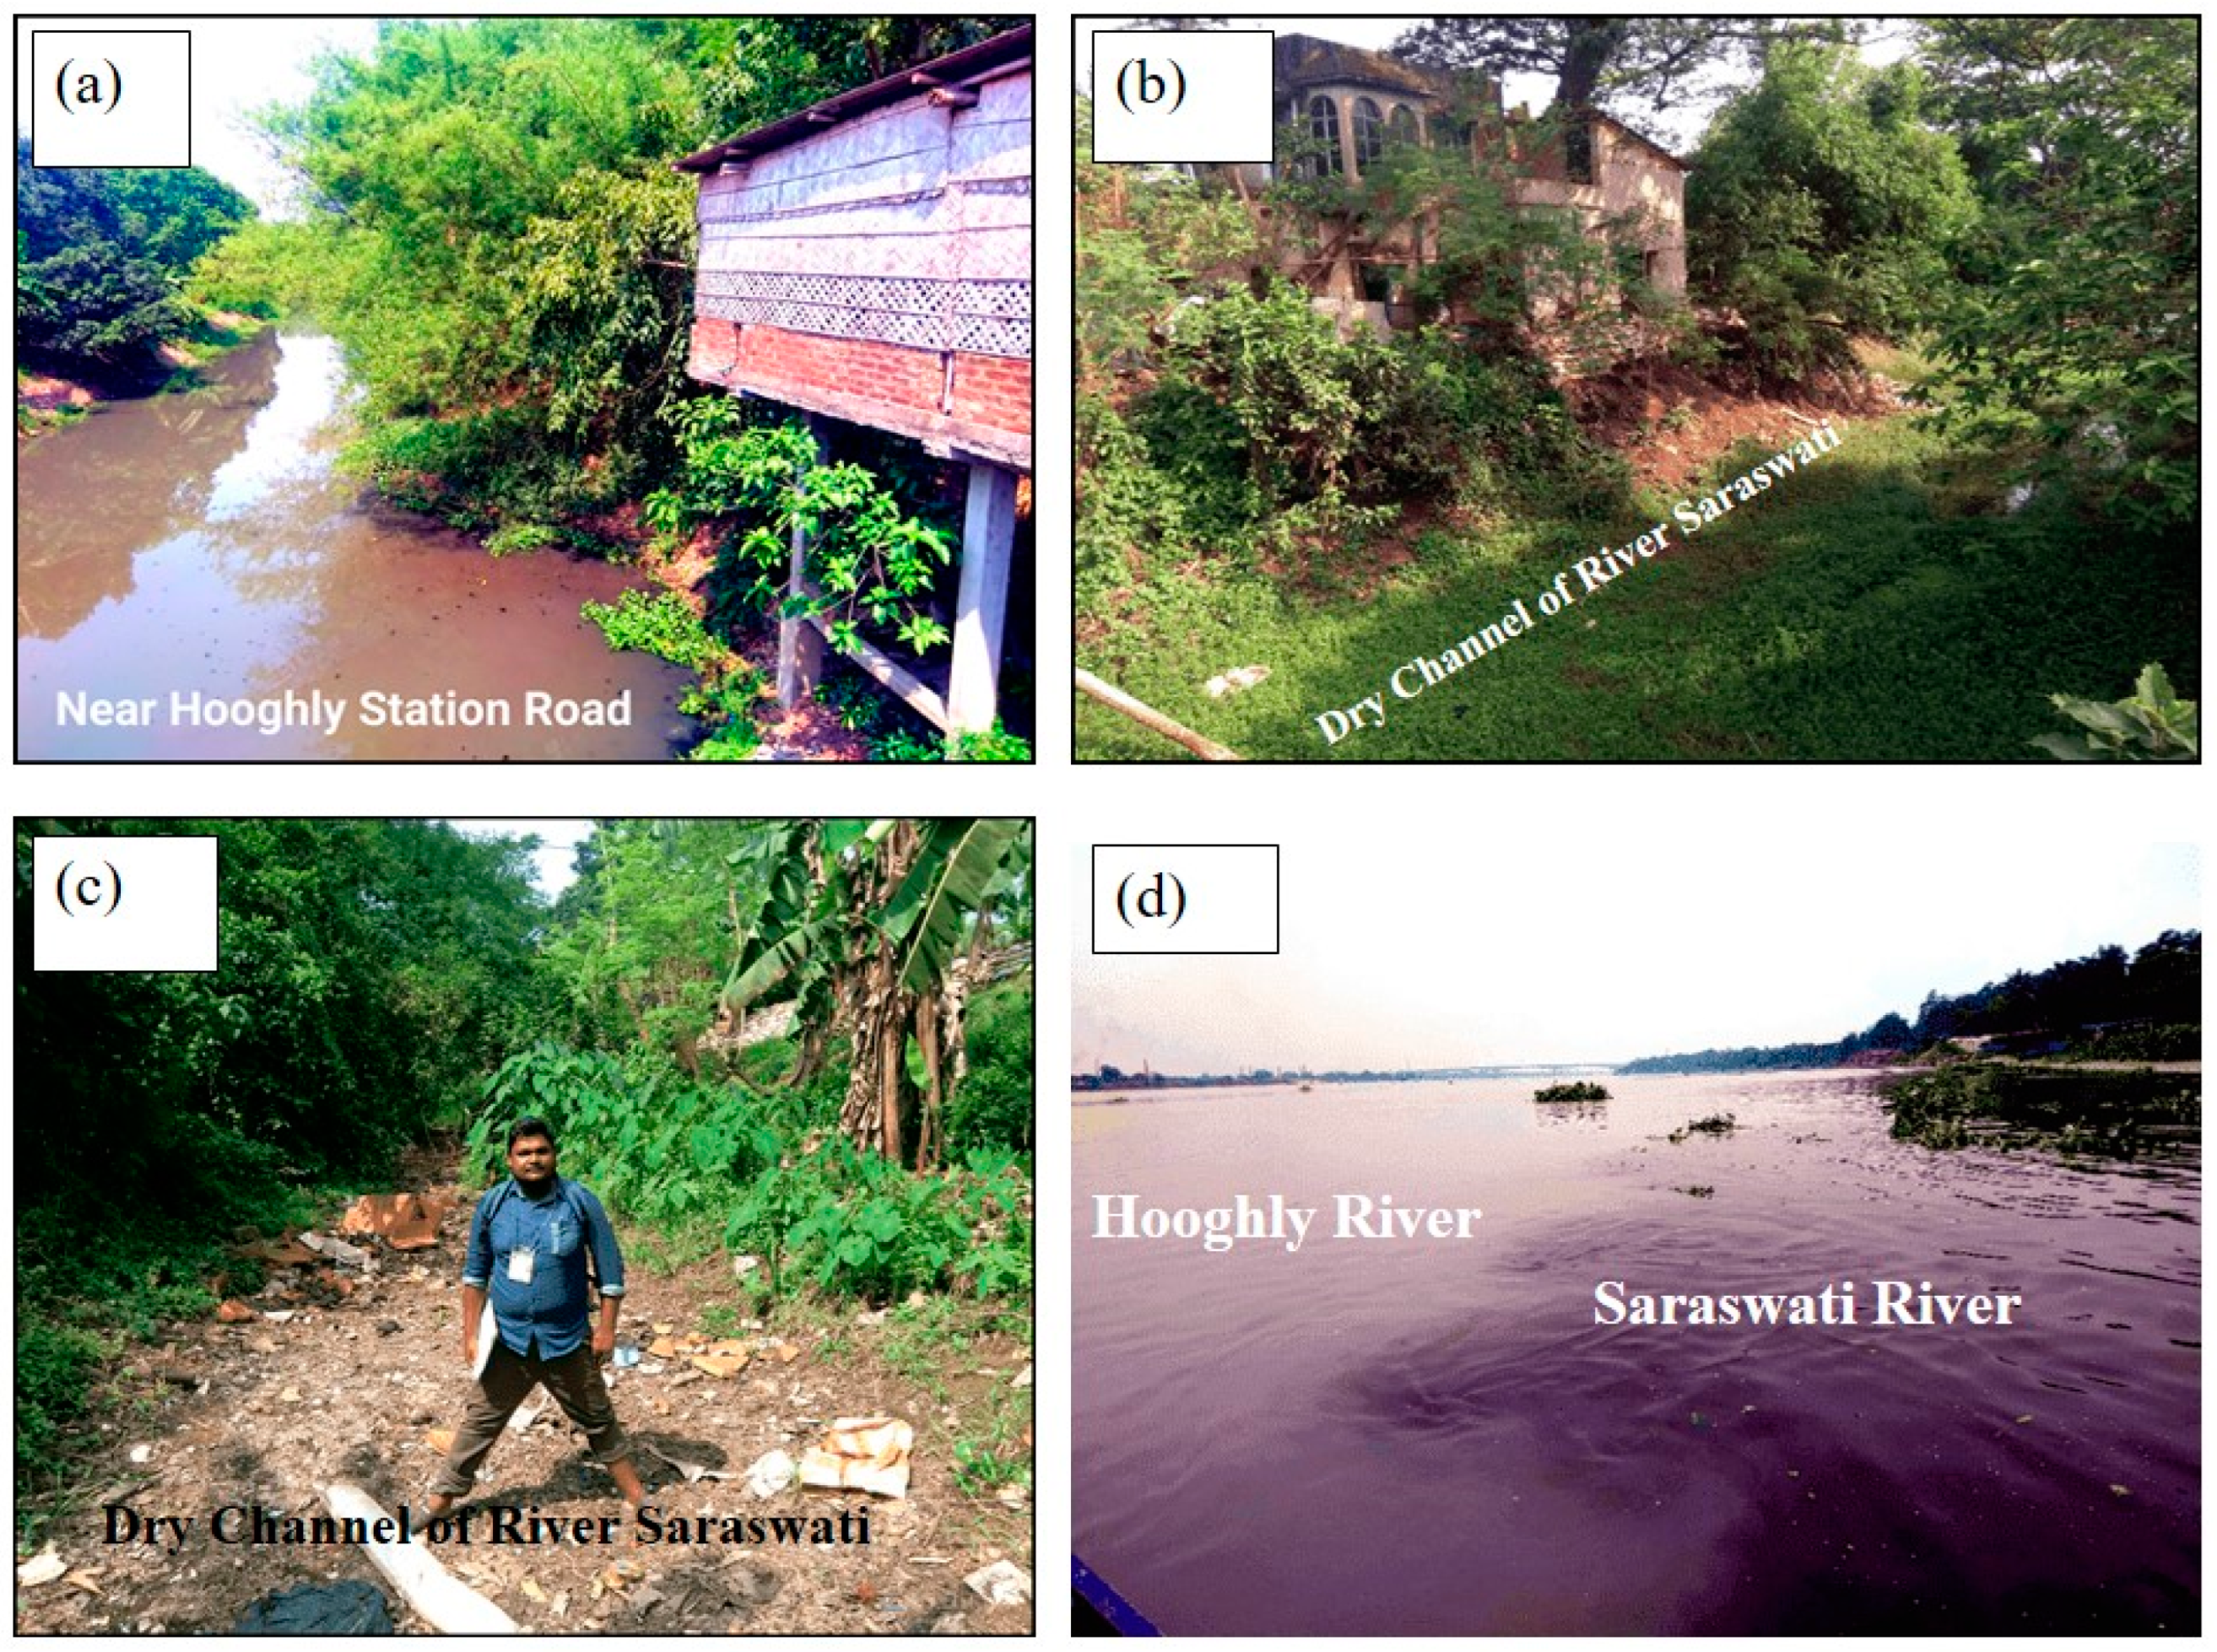
4.1. Anthropogenic and Environmental Factors Causing River Degradation
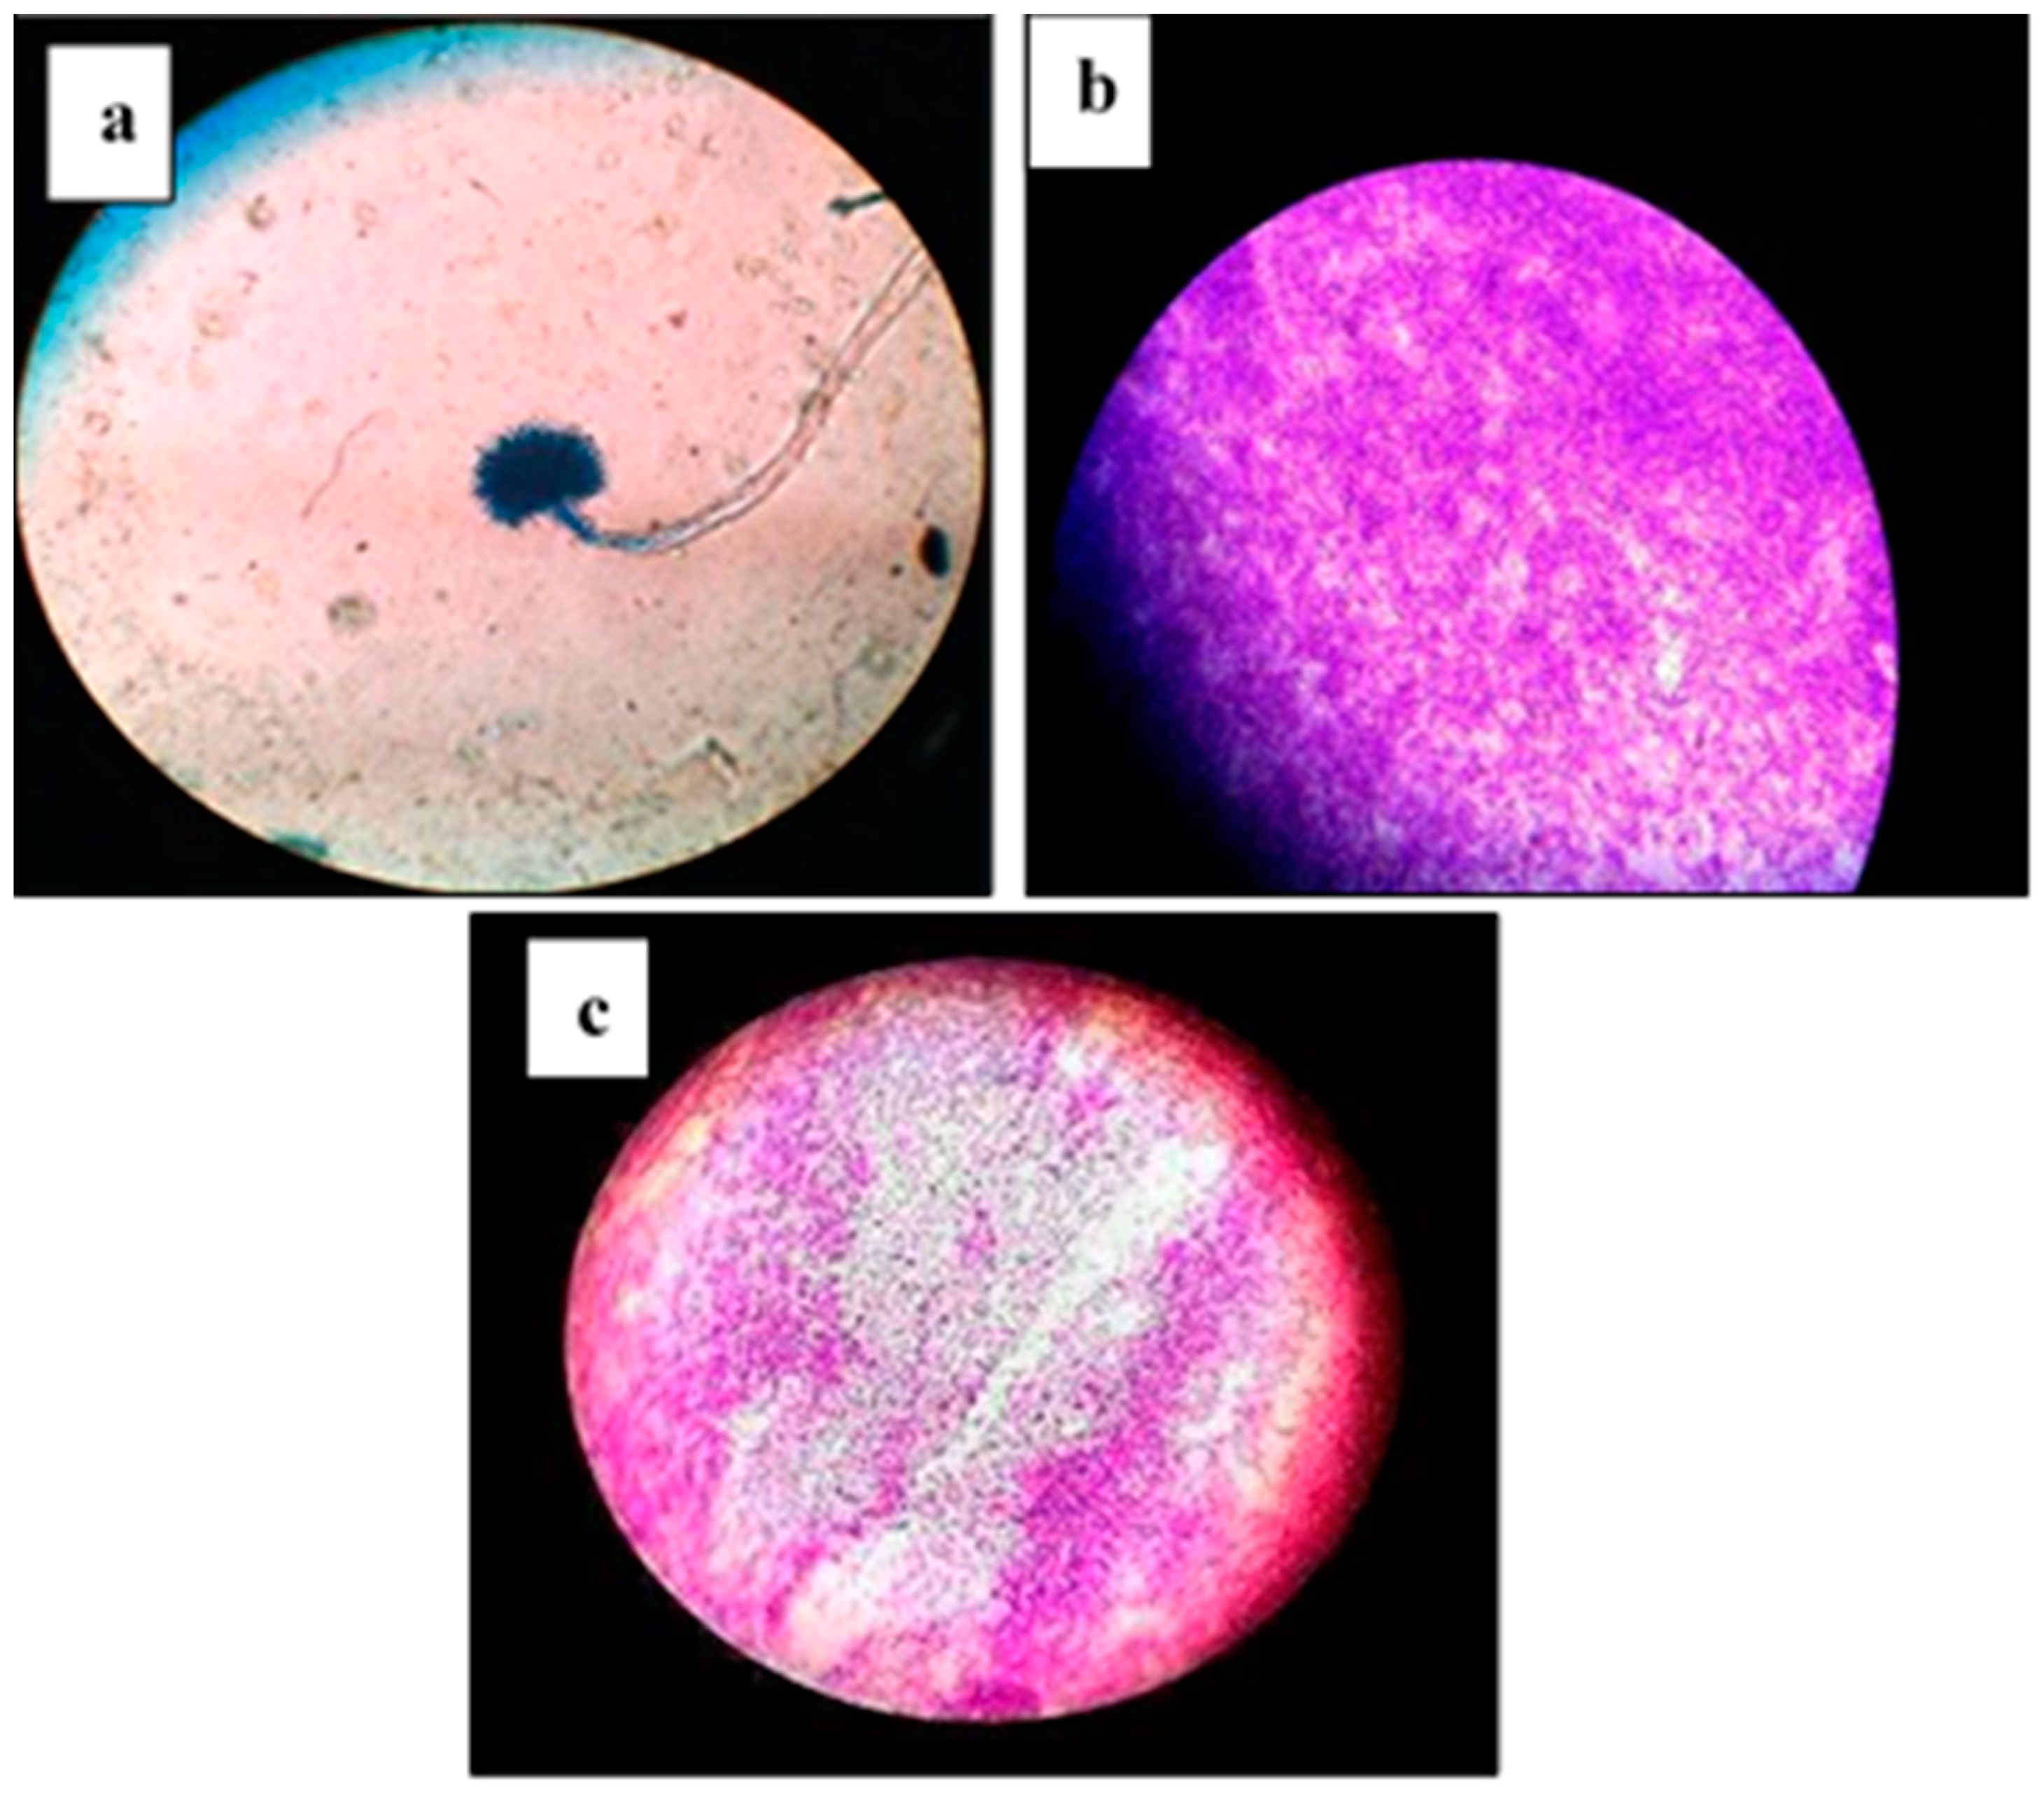
4.2. Microbial Properties Analysis of River Water
4.3. Electrolysis for Water Contamination Assessment
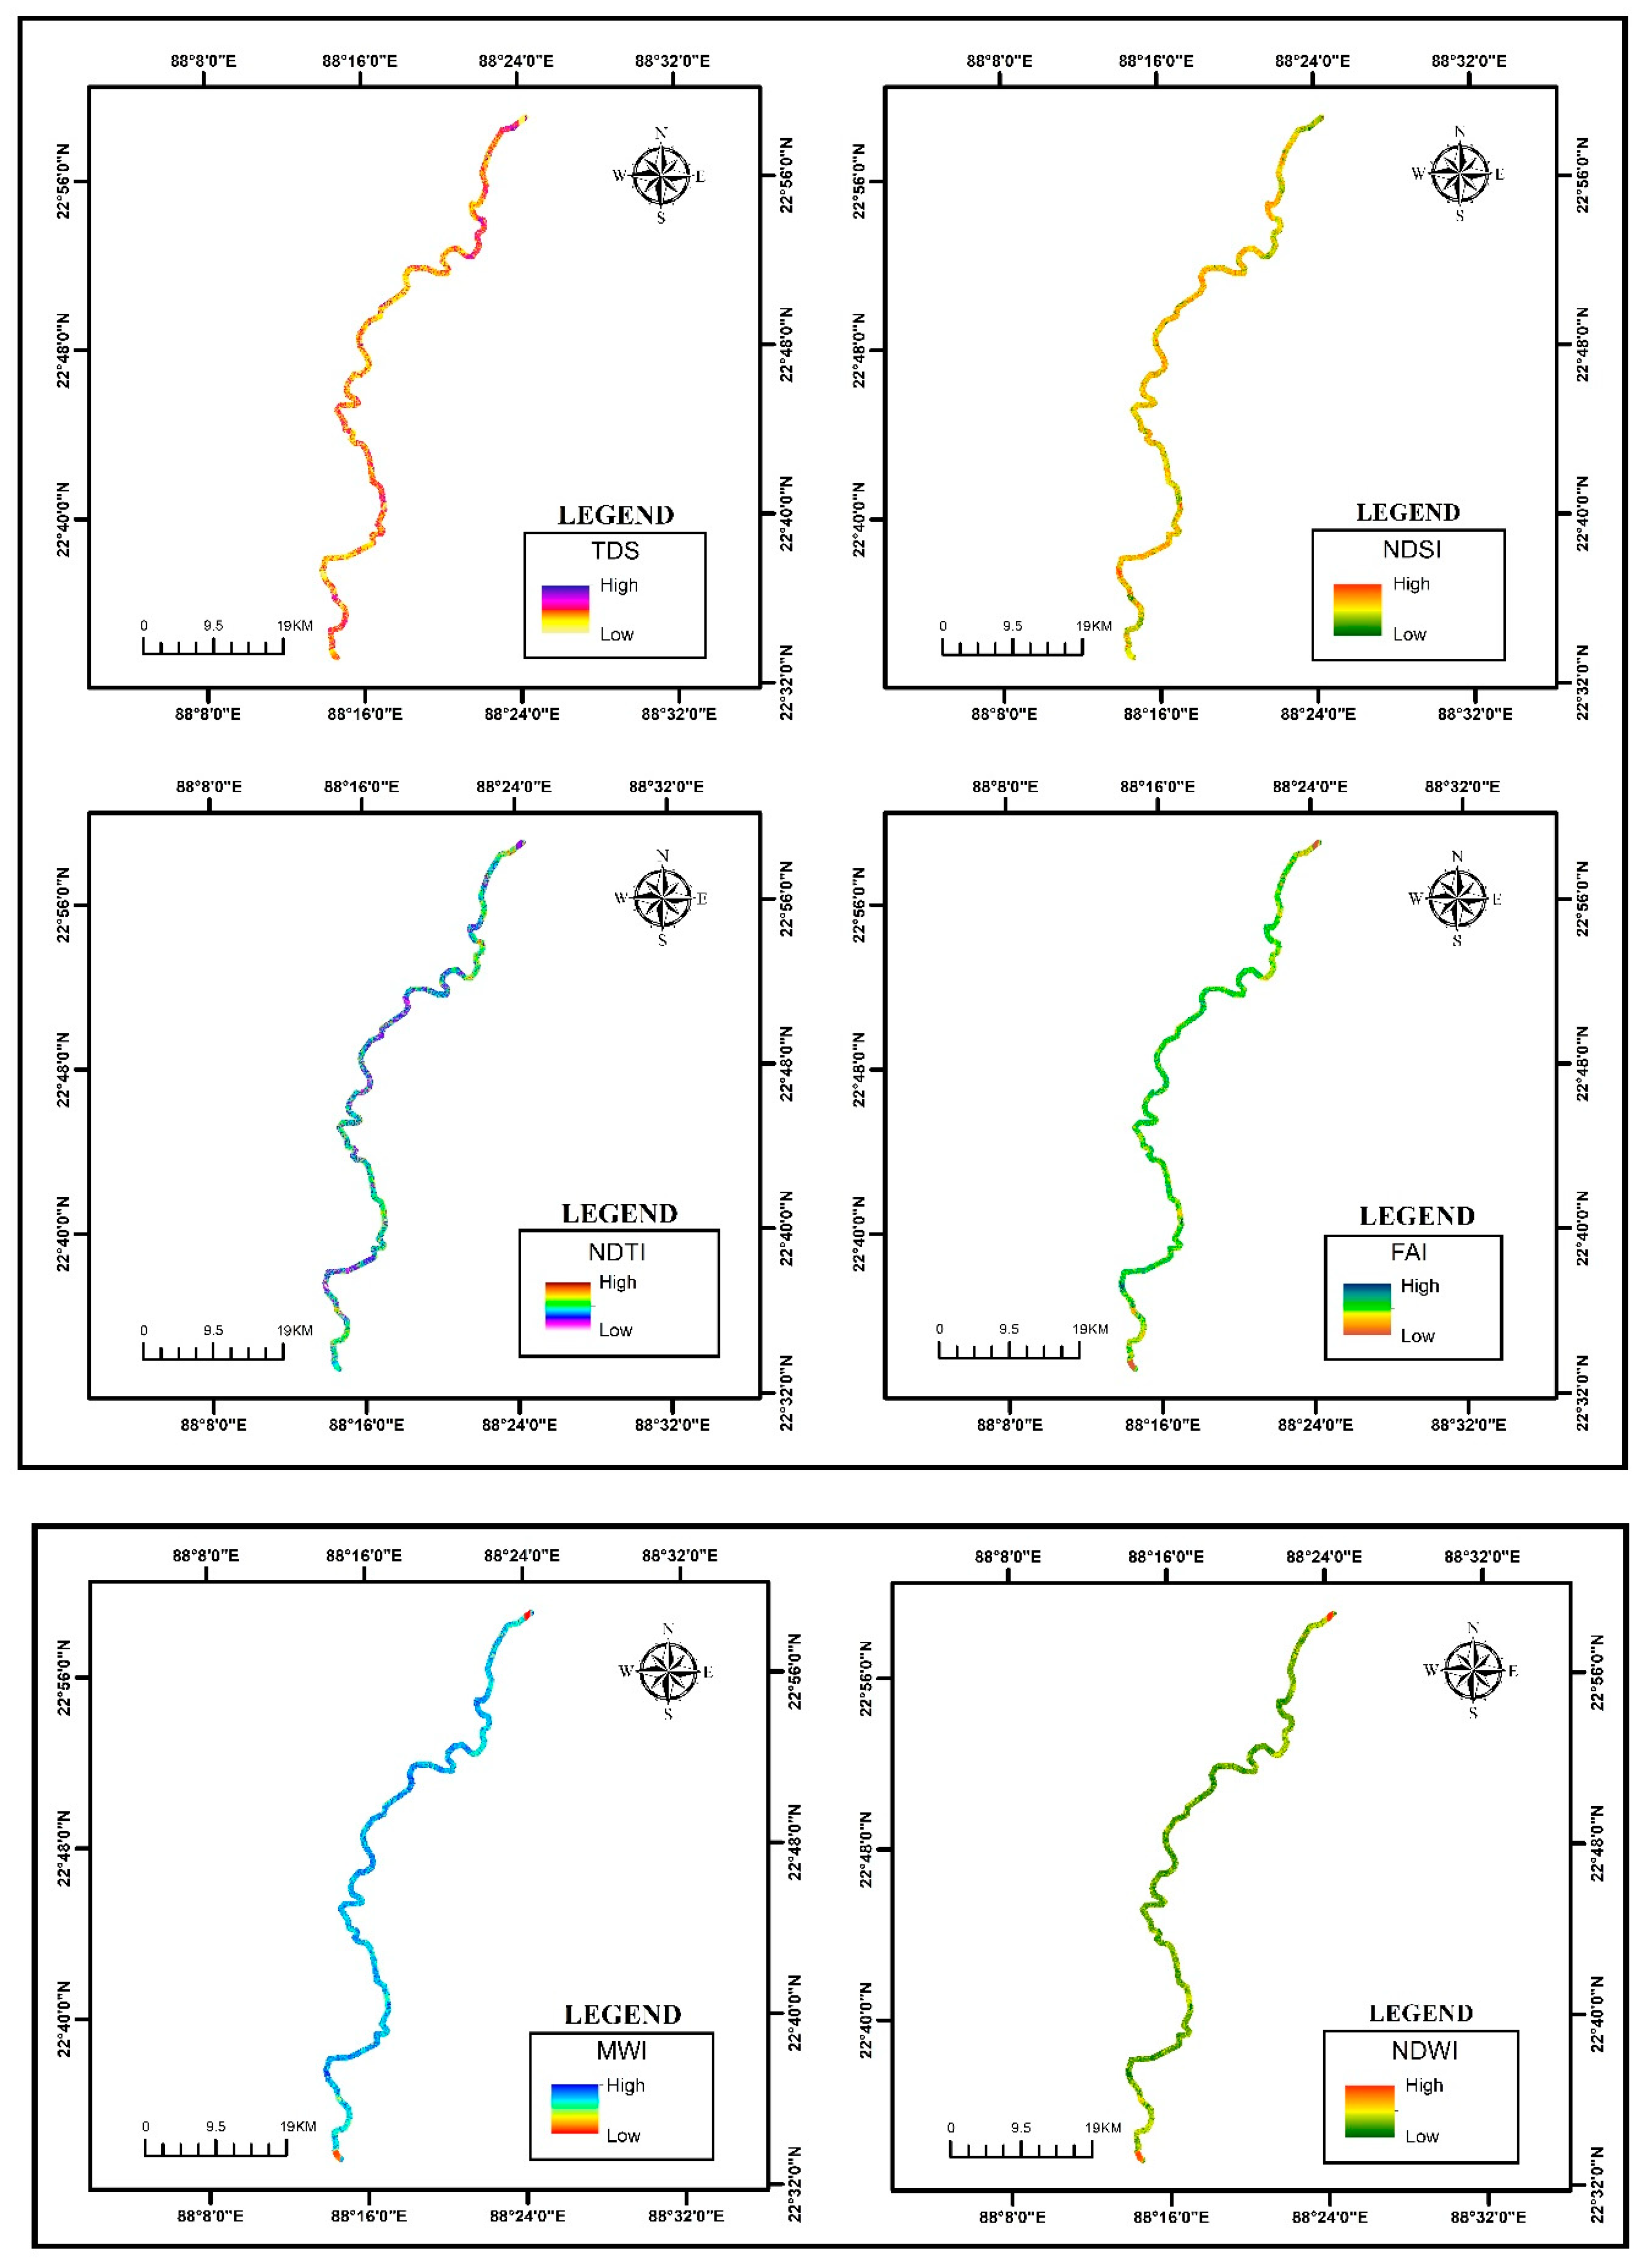
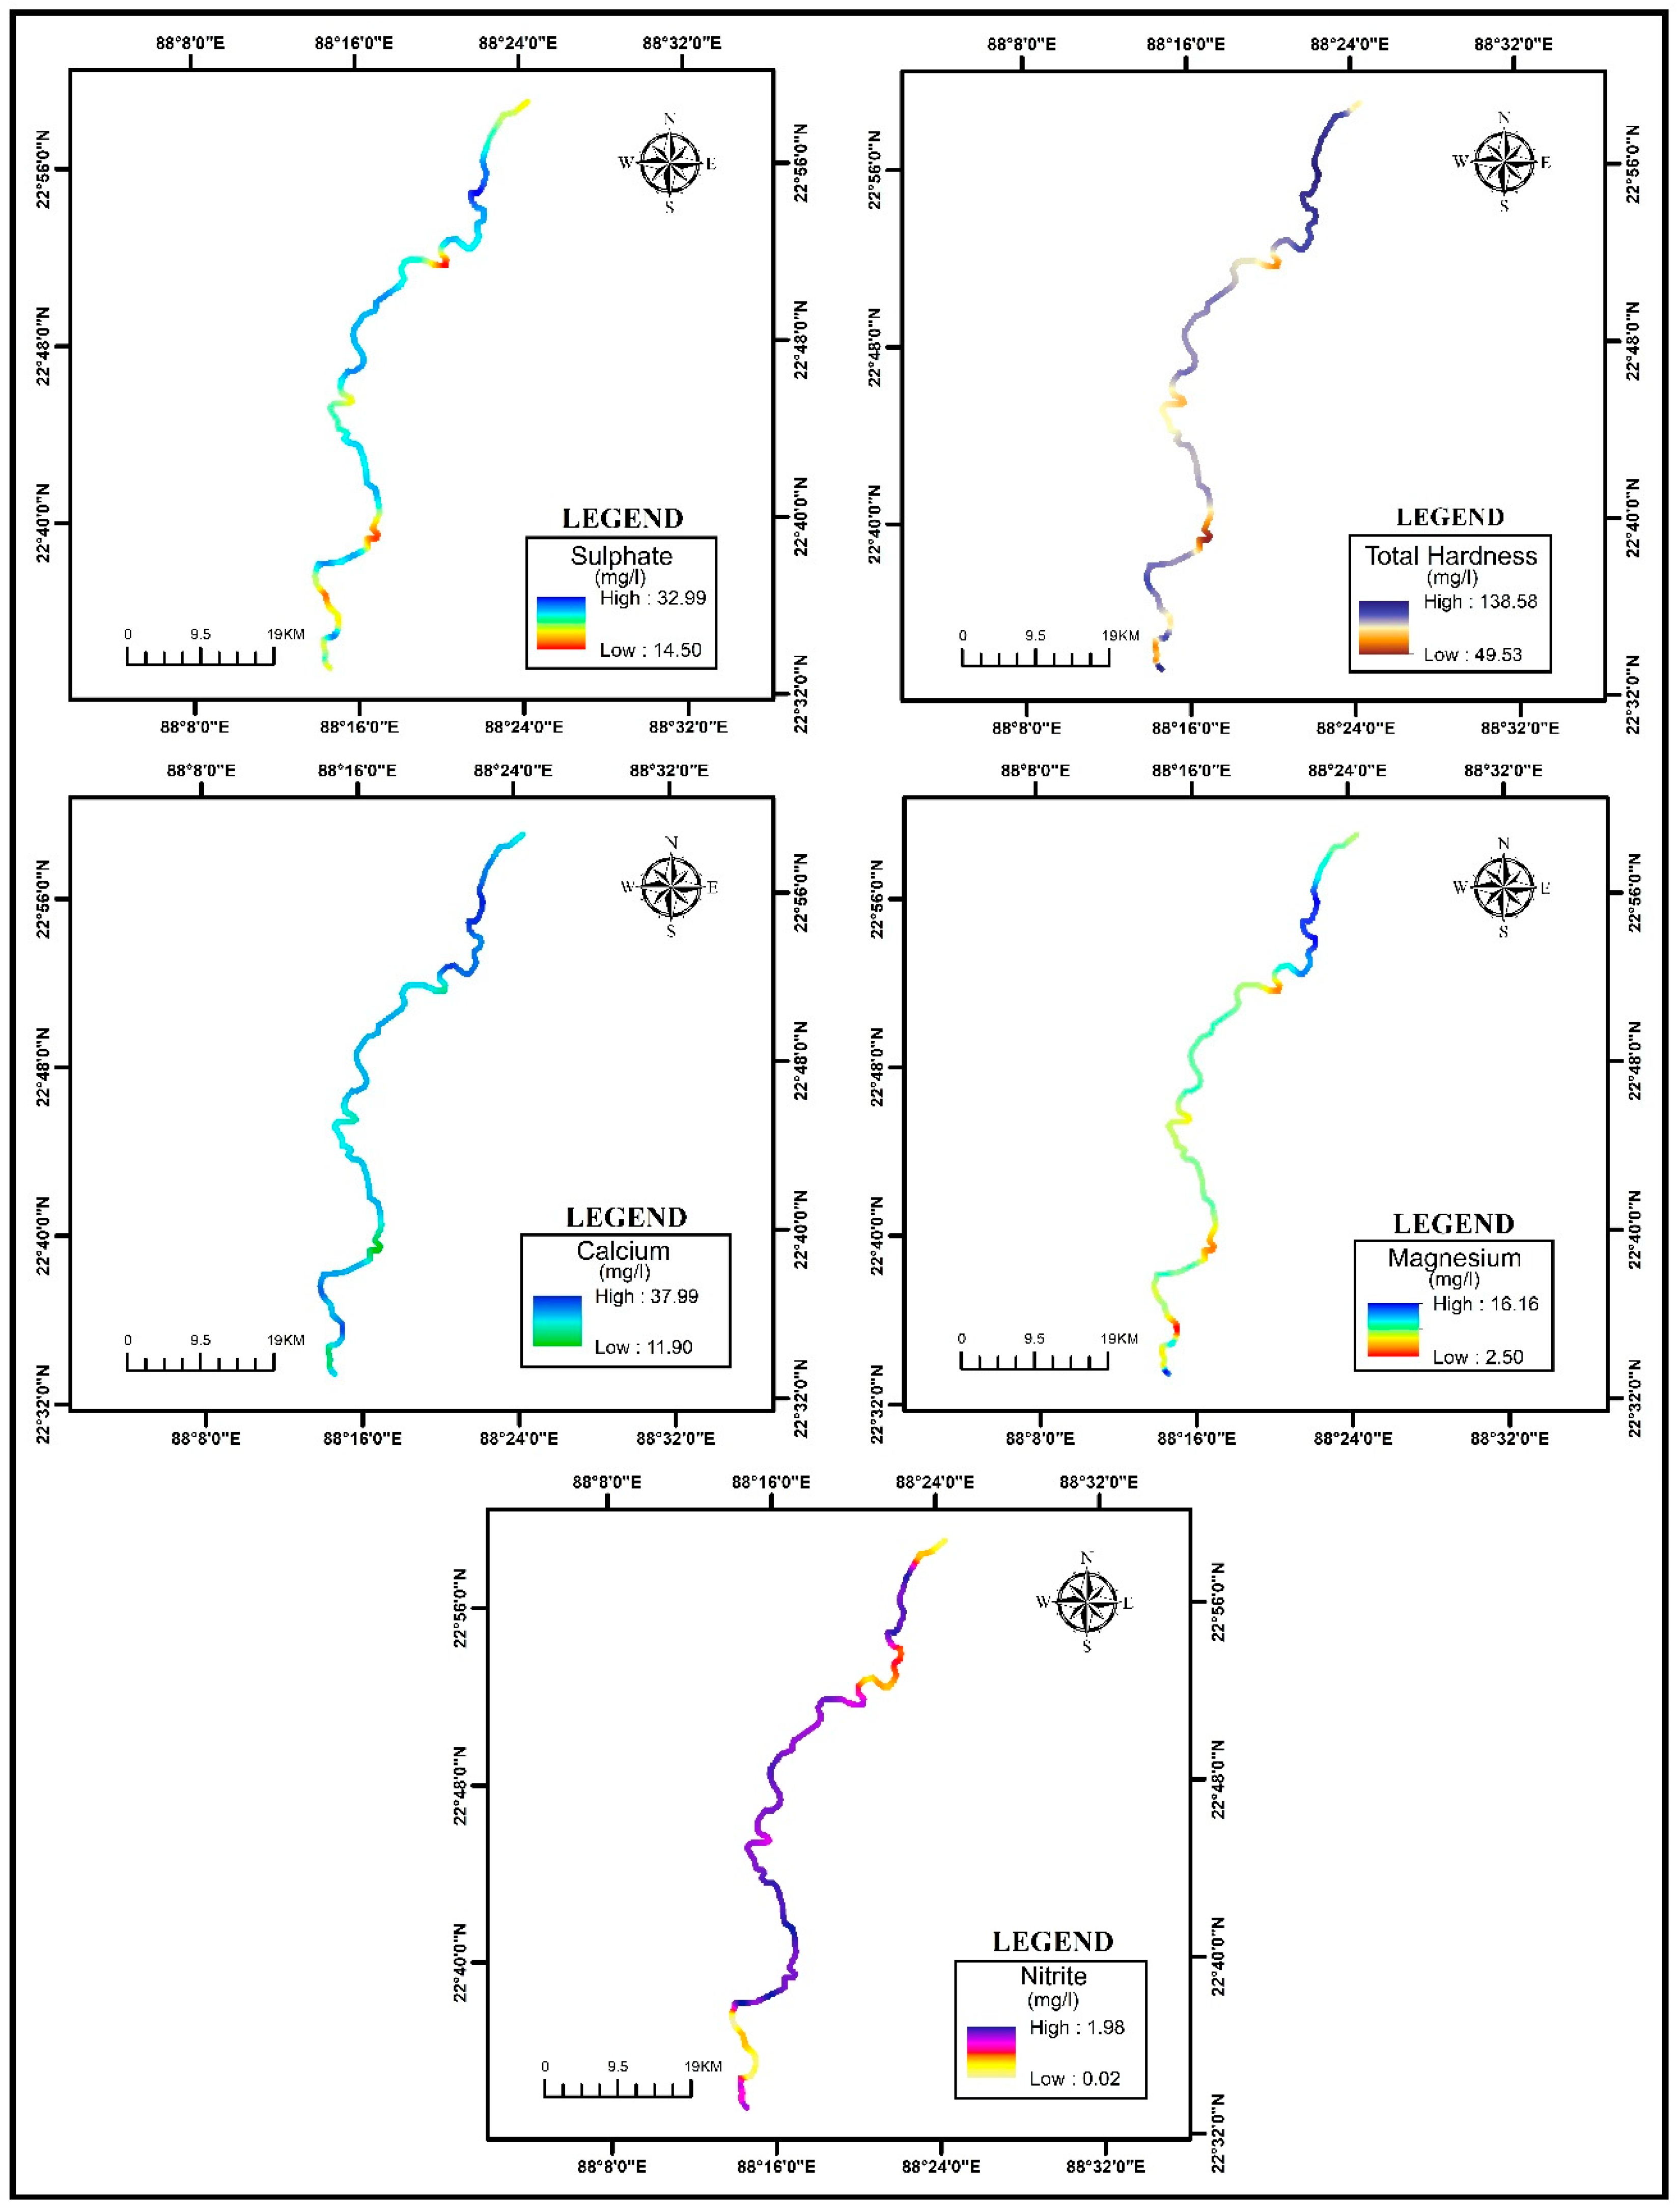
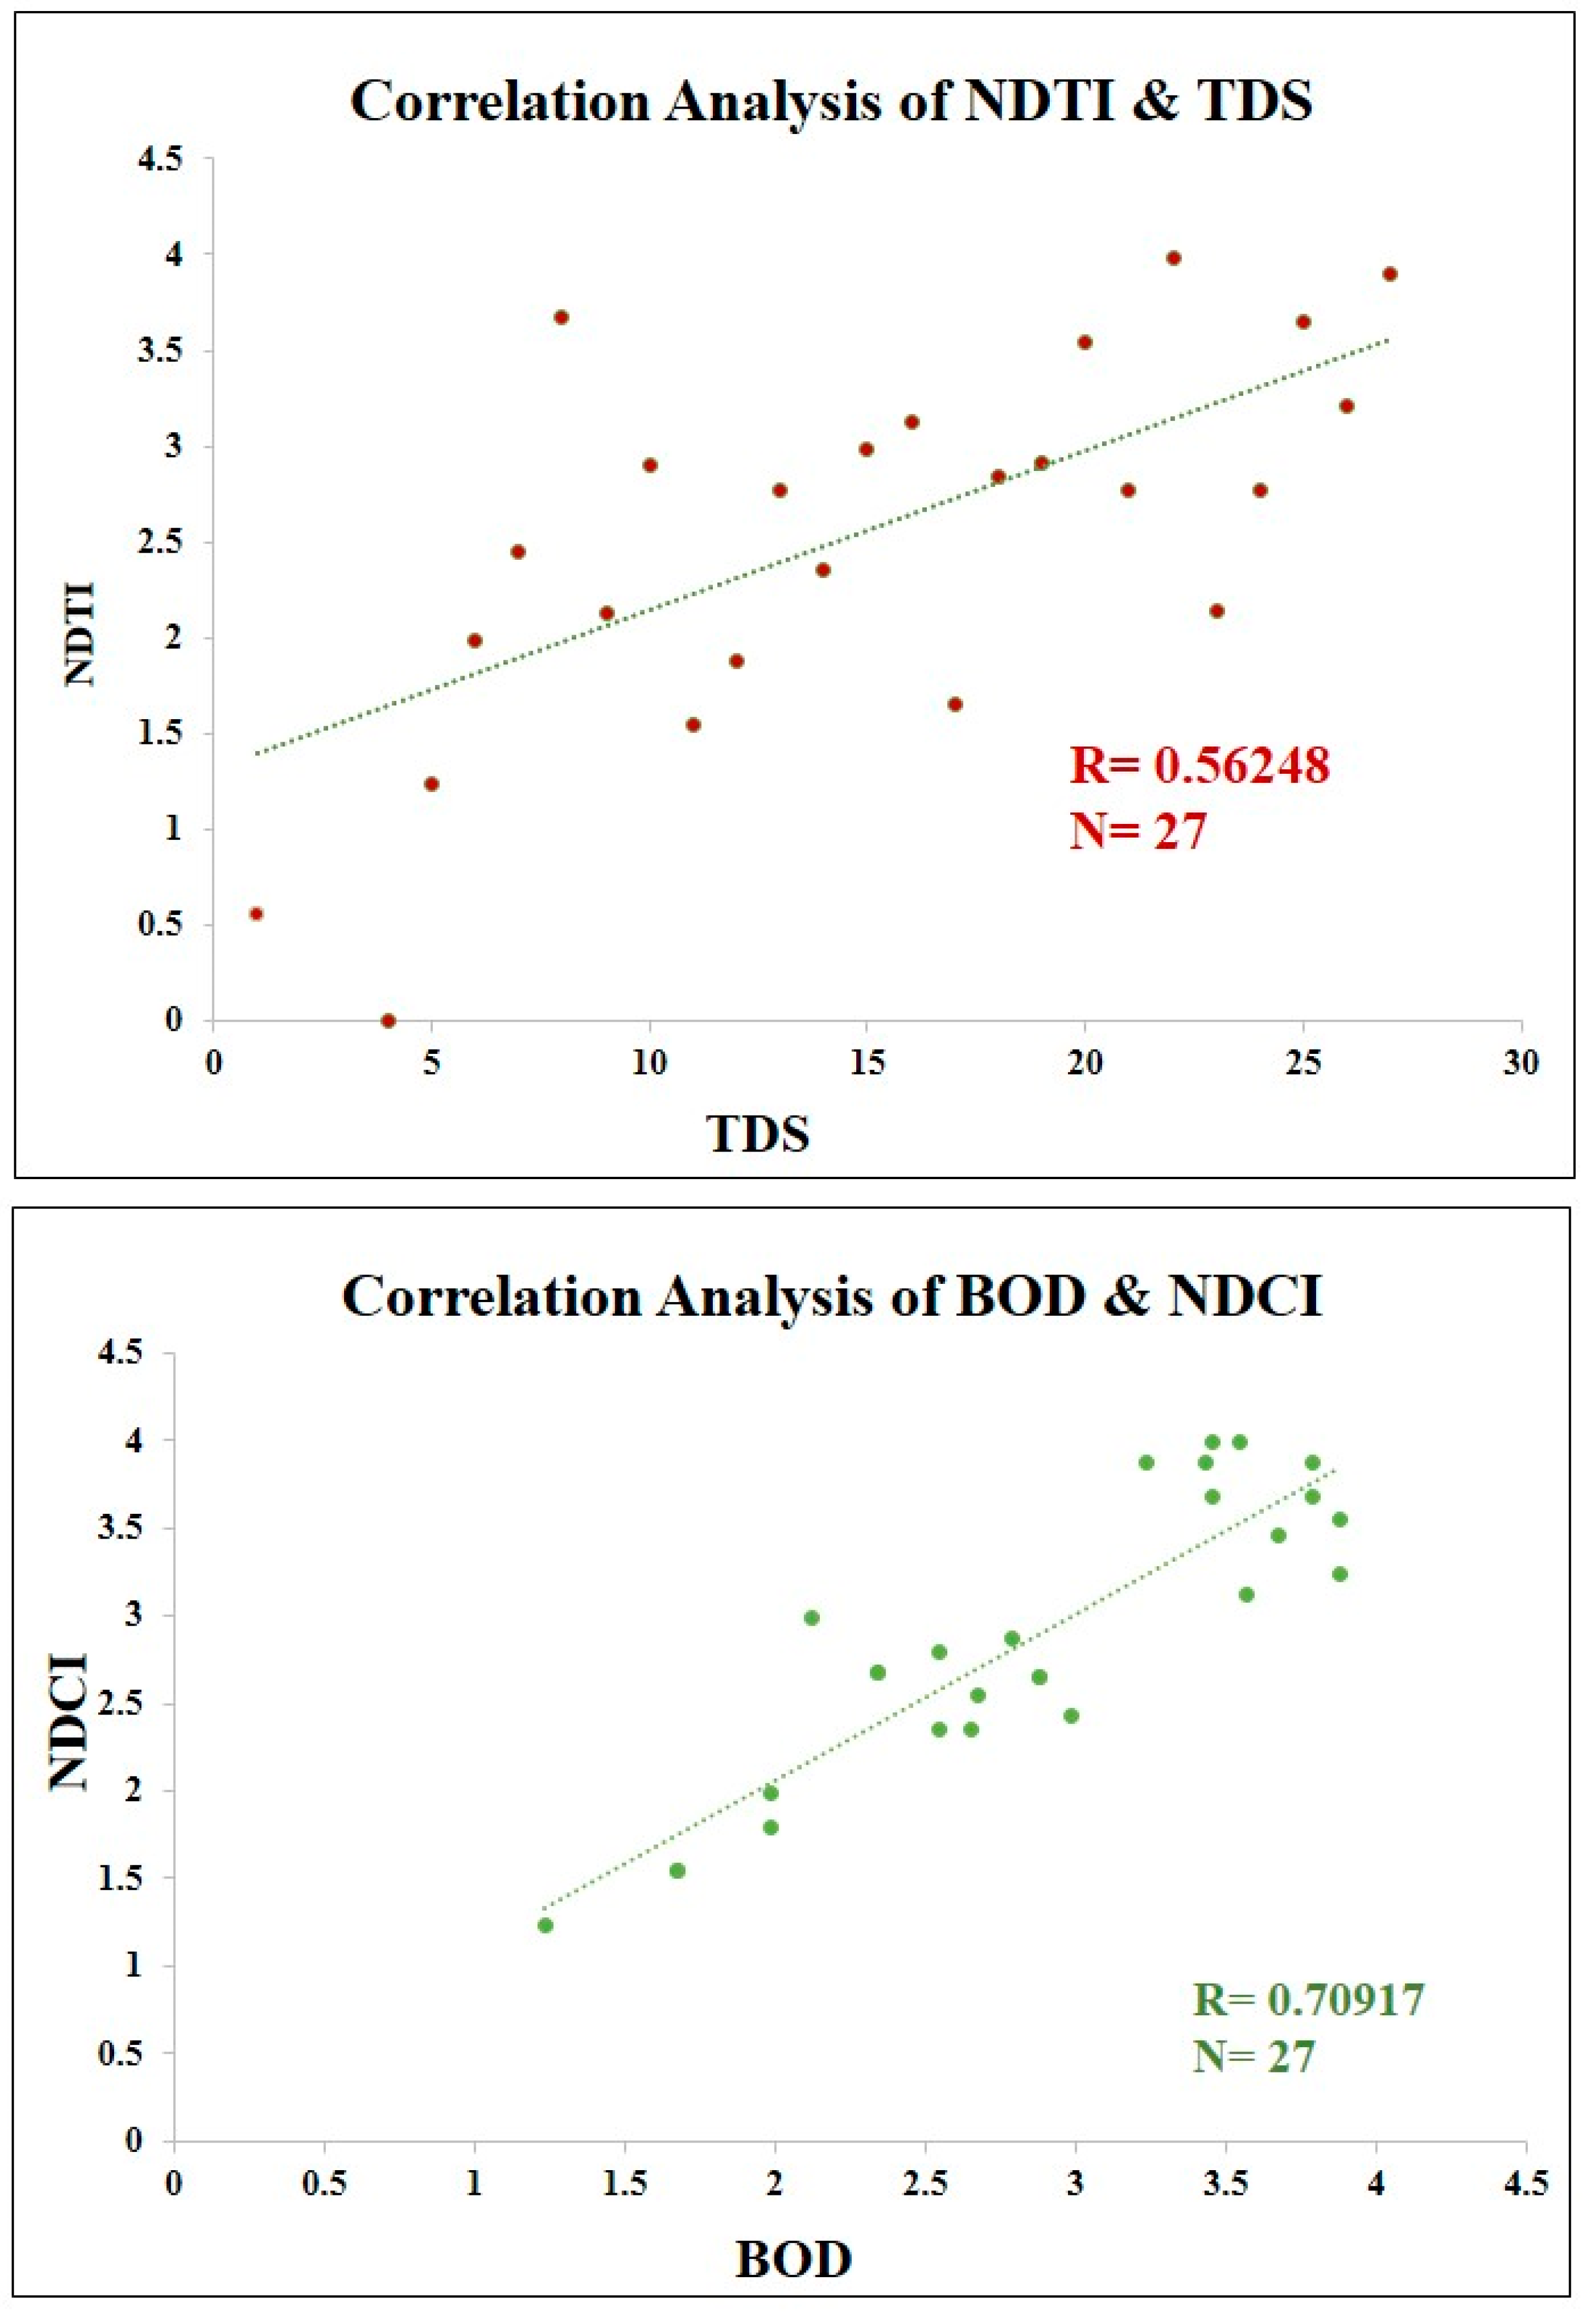
4.4. Water Quality Estimation Using Google Earth Engine (GEE) and Advanced Remote Sensing
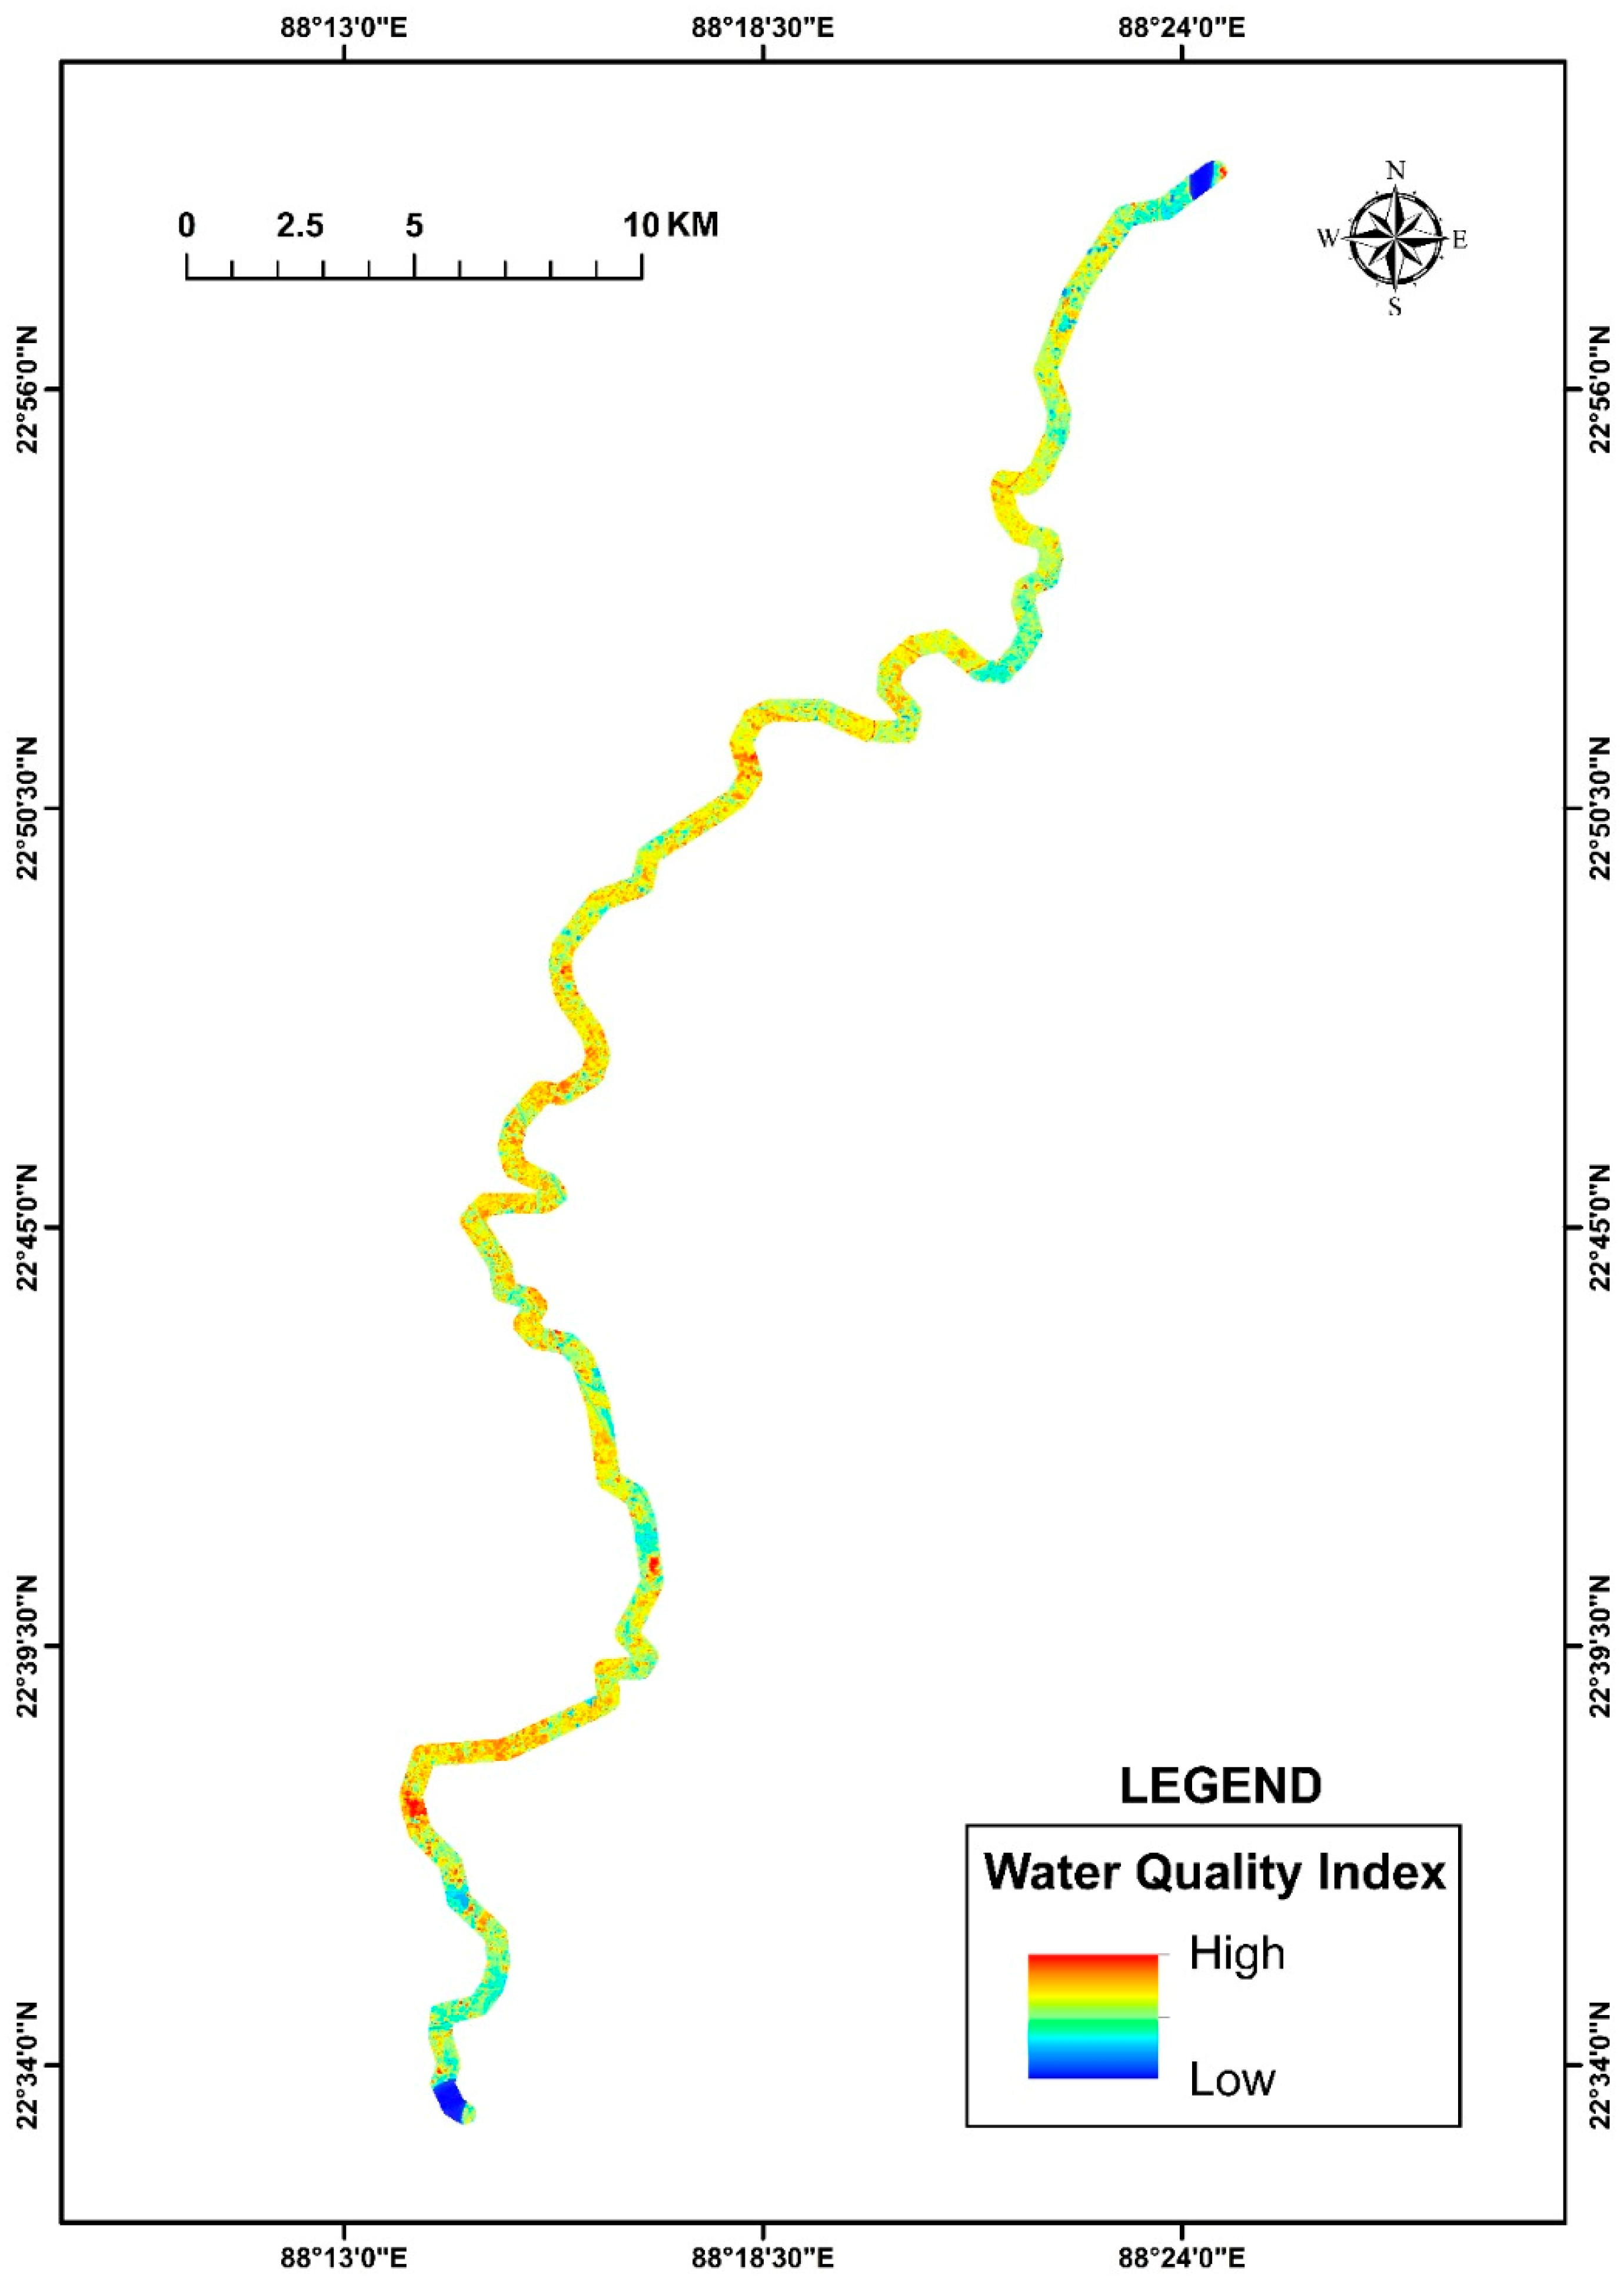
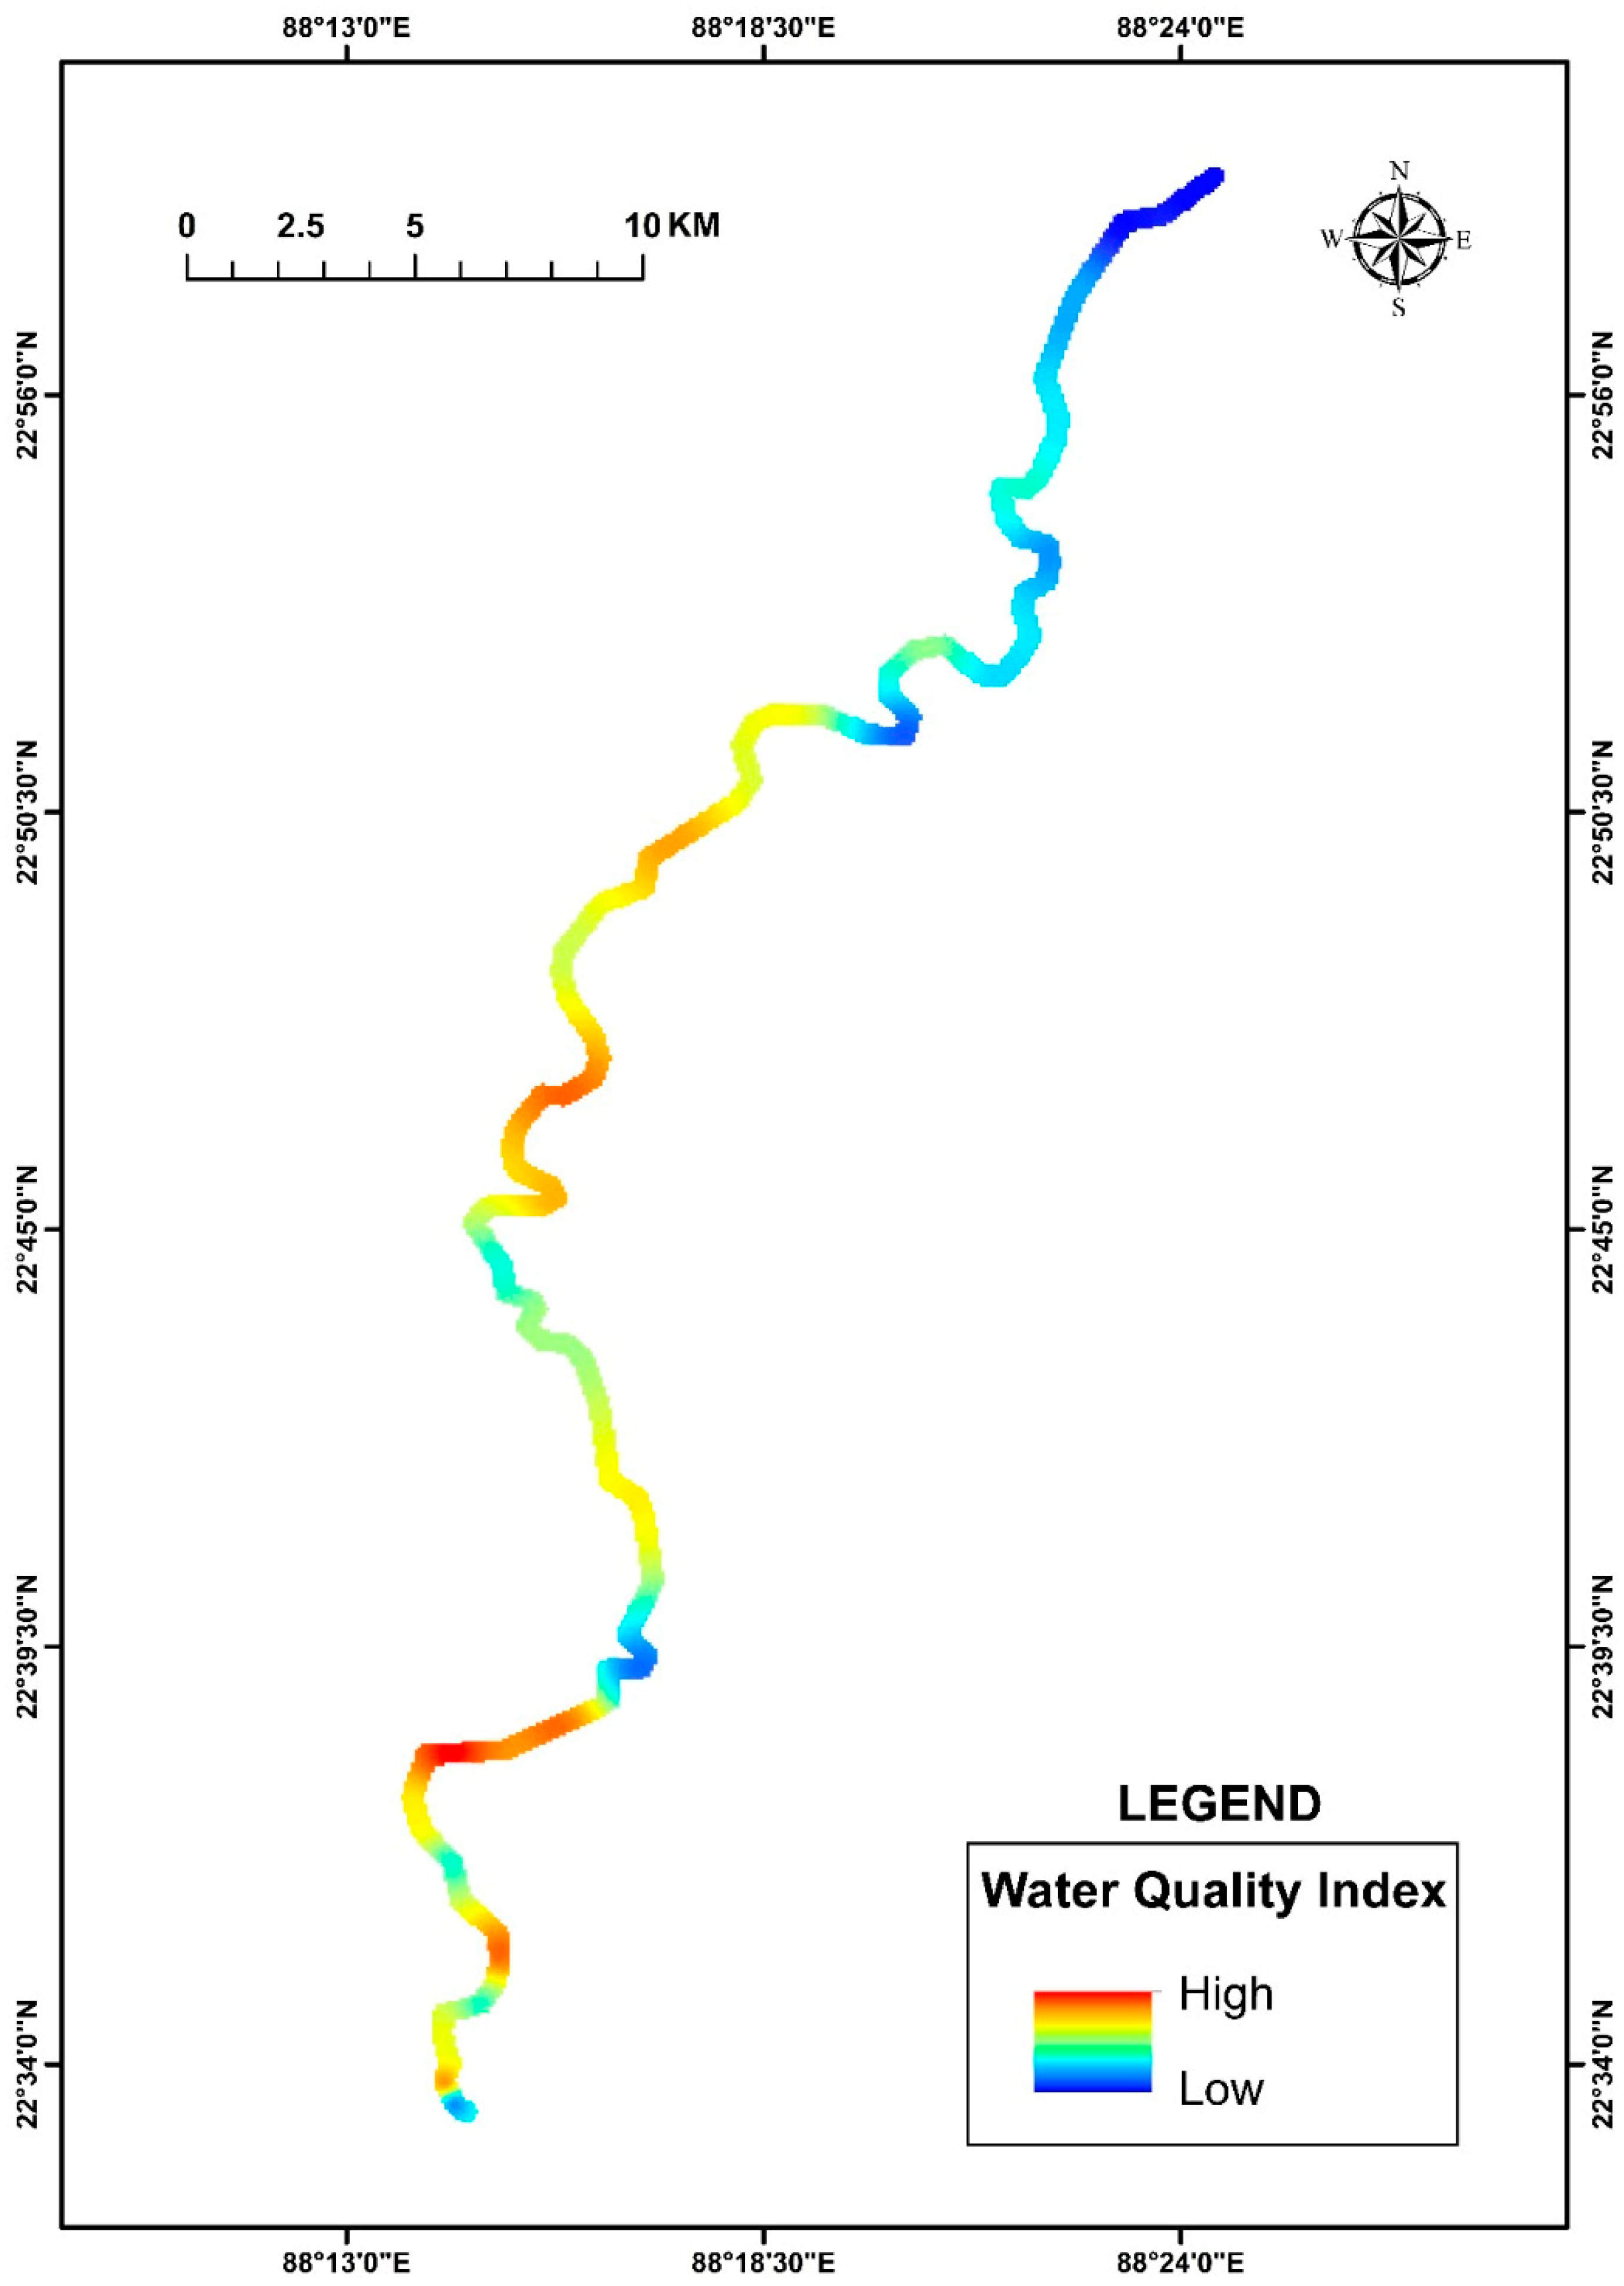
4.5. WQI Using Field Data and Arithmetic Weighted Index
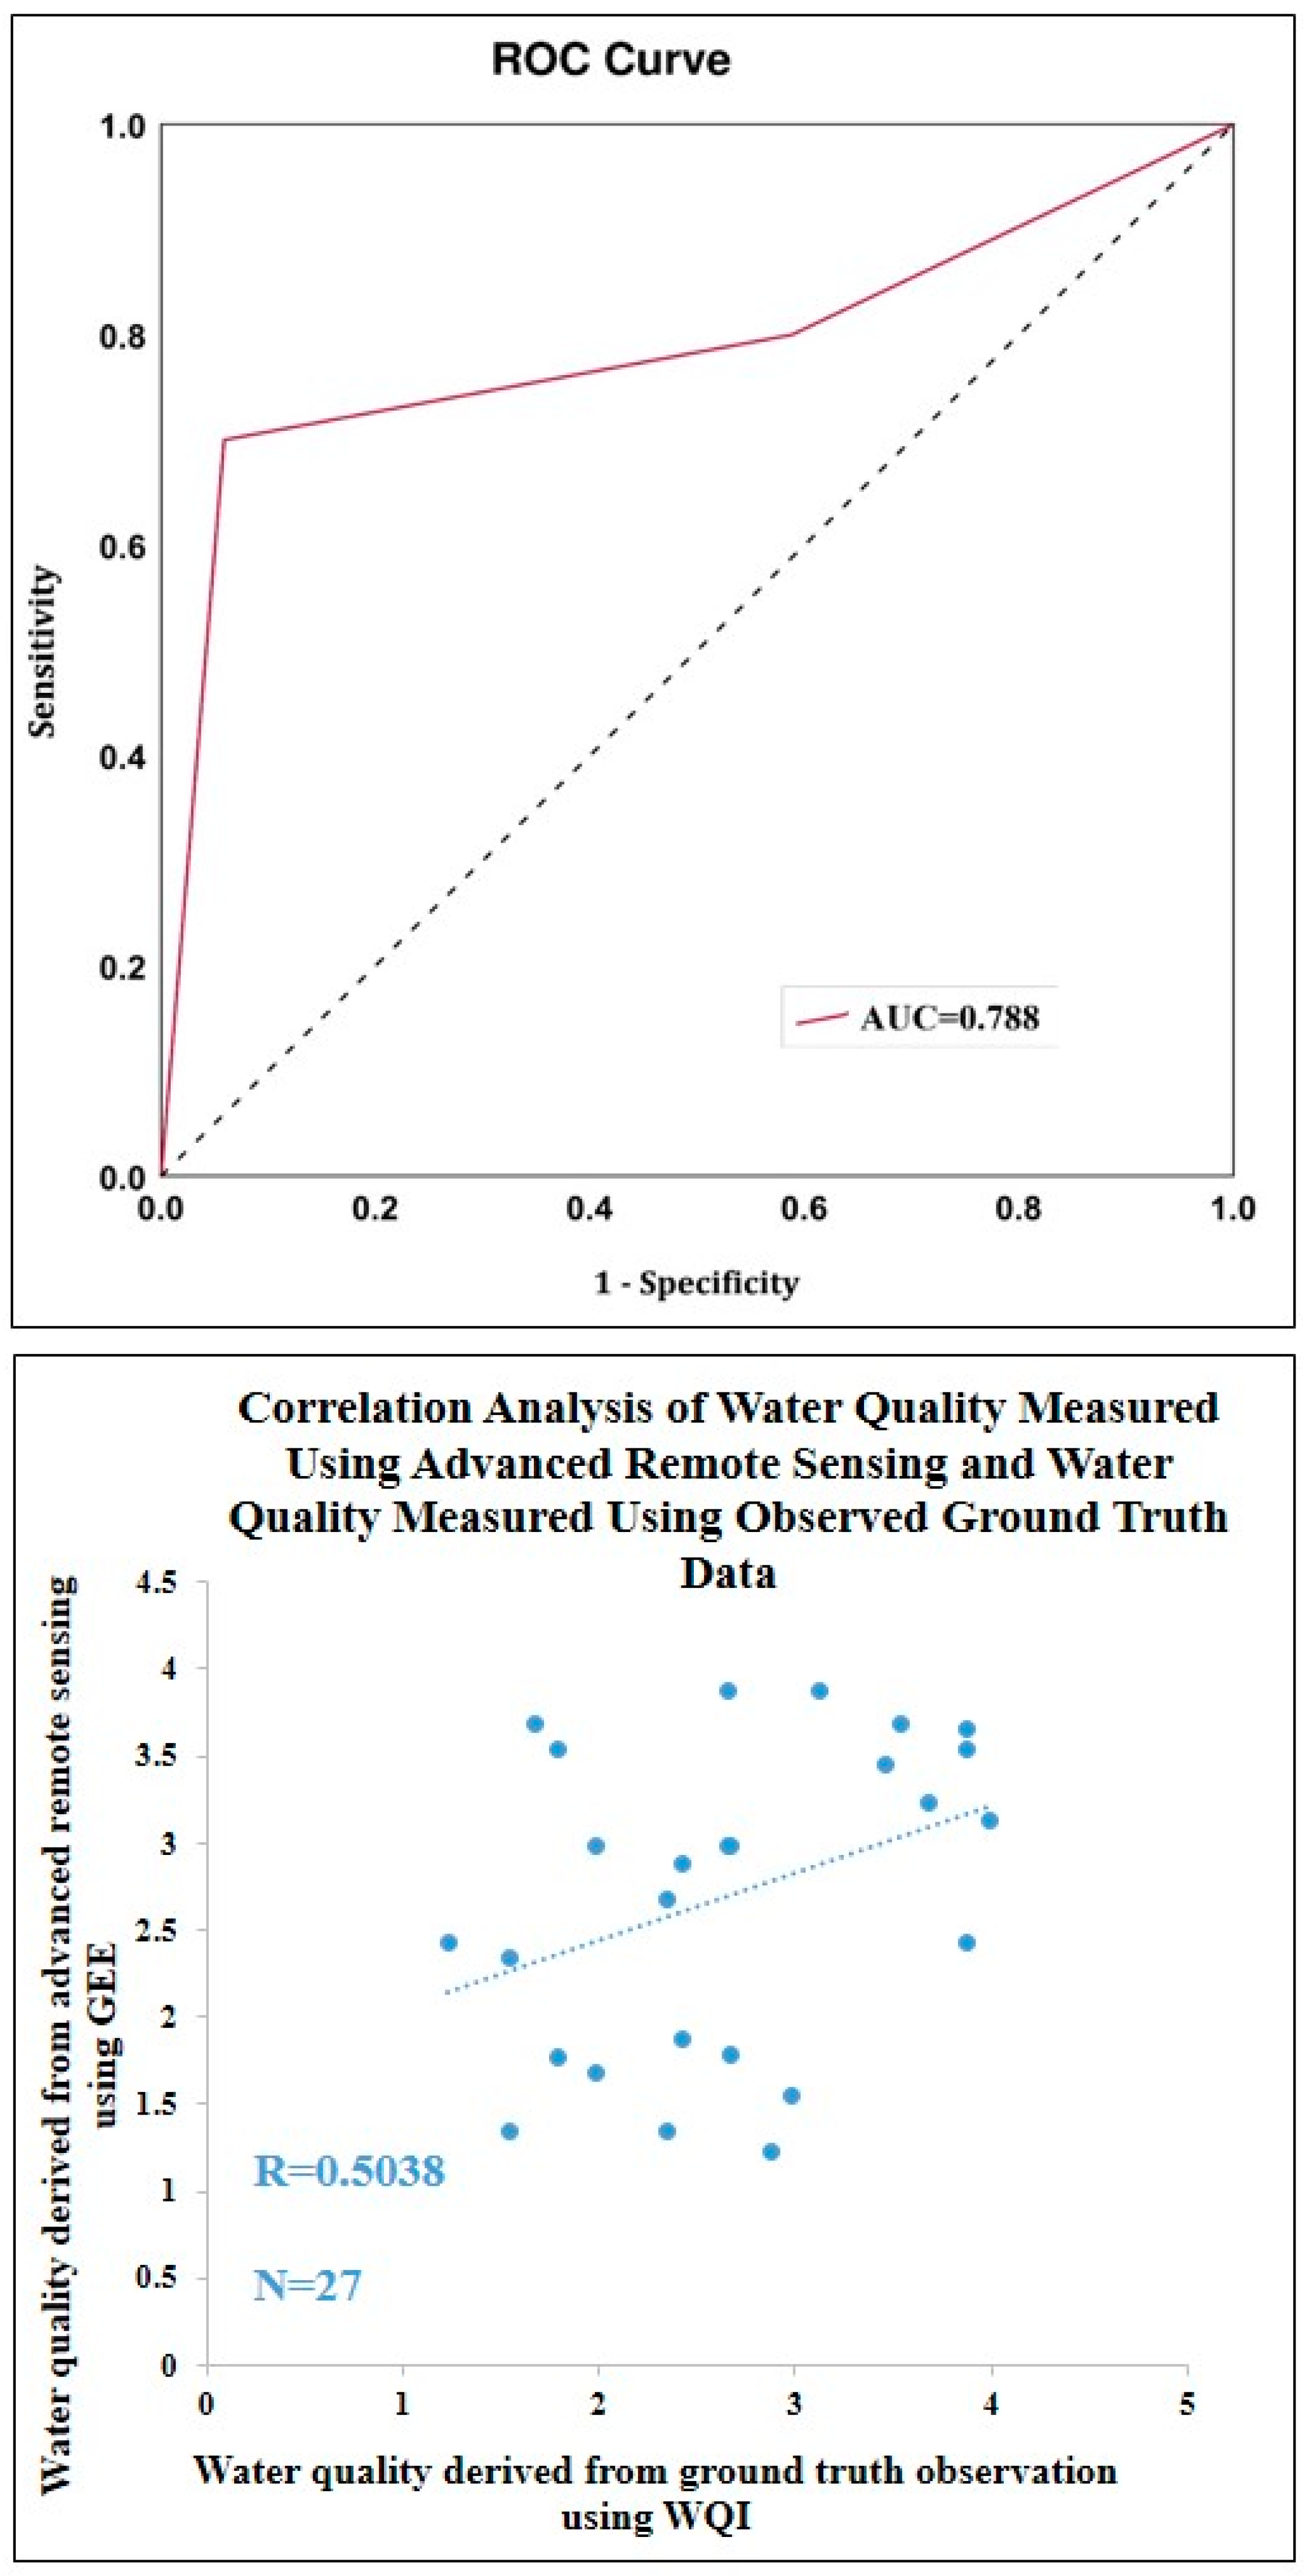
4.6. Validation
5. Conclusions
Author Contributions
Funding
Data Availability Statement
Acknowledgments
Conflicts of Interest
References
- Shil, S.; Singh, U.K.; Mehta, P. Water quality assessment of a tropical river using water quality index (WQI), multivariate statistical techniques and GIS. Appl. Water Sci. 2019, 9, 168. [Google Scholar] [CrossRef]
- Bera, A.; Das, S. Water resource management in semi-arid Purulia district of West Bengal, in the context of sustainable development goals. In Groundwater and Society; Springer: Cham, Switzerland, 2021; pp. 501–519. [Google Scholar] [CrossRef]
- Jarvie, H.P.; Whitton, B.A.; Neal, C. Nitrogen and phosphorus in east coast British rivers: Speciation, sources and biological significance. Sci. Total Environ. 1998, 210, 79–109. [Google Scholar] [CrossRef]
- Finnveden, G.; Hauschild, M.Z.; Ekvall, T.; Guinée, J.; Heijungs, R.; Hellweg, S.; Annette Koehler, A.; Pennington, D.; Suh, S. Recent developments in life cycle assessment. J. Environ. Manag. 2009, 91, 1–21. [Google Scholar] [CrossRef]
- Stoate, C.; Baldi, A.; Beja, P.; Boatman, N.D.; Herzon, I.; Van Doorn, A.; de Snoo, G.R.; Ramwell, C. Ecological impacts of early 21st century agricultural change in Europe—A review. J. Environ. Manag. 2009, 91, 22–46. [Google Scholar] [CrossRef]
- Khan, M.Y.A.; Gani, K.M.; Chakrapani, G.J. Assessment of surface water quality and its spatial variation. A case study of Ramganga River, Ganga Basin, India. Arab. J. Geosci. 2016, 9, 28. [Google Scholar] [CrossRef]
- Nasrabadi, T.; Ruegner, H.; Schwientek, M.; Bennett, J.; Fazel Valipour, S.; Grathwohl, P. Bulk metal concentrations versus total suspended solids in rivers: Time-invariant & catchment-specific relationships. PLoS ONE 2018, 13, e0191314. [Google Scholar] [CrossRef]
- Mahata, H.K.; Maiti, R. Evolution of Damodar Fan Delta in the Western Bengal Basin, West Bengal. J. Geol. Soc. India 2019, 93, 645–656. [Google Scholar] [CrossRef]
- Ghosh, S. The impact of the Damodar valley project on the environmental sustainability of the lower Damodar basin in West Bengal, Eastern India. OIDA Int. J. Sustain. Dev. 2014, 7, 47–54. [Google Scholar]
- Patra, D.; Bandyopadhyay, S. River and Environmental Movement. Indian Anthropol. 2019, 49, 57–73. [Google Scholar]
- Gregory, K.J. The human role in changing river channels. Geomorphology 2006, 79, 172–191. [Google Scholar] [CrossRef]
- Singh, A.; Vyas, V. A Review on remote sensing application in river ecosystem evaluation. Spat. Inf. Res. 2022, 30, 759–772. [Google Scholar] [CrossRef]
- Wang, X.; Yang, W. Water quality monitoring and evaluation using remote sensing techniques in China: A systematic review. Ecosyst. Health Sustain. 2019, 5, 47–56. [Google Scholar] [CrossRef]
- Dasi, A.; Vani, K.S.; Reddybathina, V.; Charpe, A.; Tadikonda, U.K. Estimation of Water Quality Parameters Using Water Indices and GEE. In Proceedings of the 2023 IEEE International Conference on Contemporary Computing and Communications (InC4), Bangalore, India, 21–22 April 2023; IEEE: New York, NY, USA, 2023; Volume 1, pp. 1–6. [Google Scholar] [CrossRef]
- Xiong, Y.; Xu, W.; Lu, N.; Huang, S.; Wu, C.; Wang, L.; Kou, W. Assessment of spatial–temporal changes of ecological environment quality based on RSEI and GEE: A case study in Erhai Lake Basin, Yunnan province, China. Ecol. Indic. 2021, 125, 107518. [Google Scholar] [CrossRef]
- Wang, C.; Jia, M.; Chen, N.; Wang, W. Long-term surface water dynamics analysis based on Landsat imagery and the Google Earth Engine platform: A case study in the middle Yangtze River Basin. Remote Sens. 2018, 10, 1635. [Google Scholar] [CrossRef]
- Subramani, T.; Someswari, P. Identification and Analysis of Pollution in Thirumani Muthar River Using Remote Sensing. Int. J. Eng. Res. Appl. 2014, 4, 198–207. [Google Scholar]
- Kaplan, G.; Yalcinkaya, F.; Altıok, E.; Pietrelli, A.; Nastro, R.A.; Lovecchio, N.; Tsipa, A. The role of remote sensing in the evolution of water pollution detection and monitoring: A comprehensive review. Phys. Chem. Earth Parts A B C 2024, 136, 103712. [Google Scholar] [CrossRef]
- Najafzadeh, M.; Basirian, S. Evaluation of river water quality index using remote sensing and artificial intelligence models. Remote Sens. 2023, 15, 2359. [Google Scholar] [CrossRef]
- Zhang, F.; Chan, N.W.; Liu, C.; Wang, X.; Shi, J.; Kung, H.T.; Cao, N. Water Quality Index (WQI) as a Potential Proxy for Remote Sensing Evaluation of Water Quality in Arid Areas. Water 2021, 13, 3250. [Google Scholar] [CrossRef]
- Hachoł, J.; Hämmerling, M.; Bondar-Nowakowska, E. Applying the Analytical Hierarchy Process (AHP) into the effects assessment of river training works. J. Water Land Dev. 2017, 35, 63–72. [Google Scholar] [CrossRef]
- Zhran, M.; Ghanem, K.; Tariq, A.; Alshehri, F.; Jin, S.; Das, J.; Mousa, A. Exploring a GIS-based analytic hierarchy process for spatial flood risk assessment in Egypt: A case study of the Damietta branch. Environ. Sci. Eur. 2024, 36, 184. [Google Scholar] [CrossRef]
- Dutta, A.; Banerjee, M.; Ray, R. Land capability assessment of Sali watershed for agricultural suitability using a multi-criteria-based decision-making approach. Environ. Monit. Assess. 2024, 196, 237. [Google Scholar] [CrossRef] [PubMed]
- Wei, W.; Guo, Z.; Xie, B.; Zhou, J.; Li, C. Spatiotemporal evolution of environment based on integrated remote sensing indexes in arid inland river basin in Northwest China. Environ. Sci. Pollut. Res. 2019, 26, 13062–13084. [Google Scholar] [CrossRef] [PubMed]
- Dutta, A.; Dutta, A.; Nandi, D.; Banerjee, M.; K Das, H.; Chandra, S. Physicochemical and Biological Properties of Land and Water Bodies Surrounding Major Dumpsites in Kolkata. Int. J. Civ. Environ. Agric. Eng. 2024, 6, 45–59. [Google Scholar] [CrossRef]
- Mondal, S.; Parveen, M.T.; Alam, A.; Rukhsana; Islam, N.; Calka, B.; Zhran, M. Future Site Suitability for Urban Waste Management in English Bazar and Old Malda Municipalities, West Bengal: A Geospatial and Machine Learning Approach. ISPRS Int. J. Geo-Inf. 2024, 13, 388. [Google Scholar] [CrossRef]
- Barman, J.; Ali, S.S.; Nongrem, T.; Biswas, B.; Rao, K.S.; Pramanik, M.; Zhran, M. Comparing the effectiveness of landslide susceptibility mapping by using the frequency ratio and hybrid MCDM models. Results Eng. 2024, 24, 103205. [Google Scholar] [CrossRef]
- Dutta, A.; Ray, R.; Banerjee, M. Multi-criteria-based decision making approach for soil erosion susceptibility modelling of Sali River Basin, Bankura, India. Environ. Dev. Sustain. 2024, 1–26. [Google Scholar] [CrossRef]
- Chakrabortty, R.; Kumar, A.; Mishuk, S.R.; Pramanik, M.; Avtar, R.; Manna, H.; Zhran, M. Assessment of urban environment quality using analytical hierarchical process and multi-dimensional decomposition analysis for Mumbai metropolitan region, India. Adv. Space Res. 2025, 75, 2792–2809. [Google Scholar] [CrossRef]
- Pramanik, S.; Biswas, J.K.; Kaviraj, A.; Saha, S. Assessment of the present state and future fate of River Saraswati, India: Water quality indices and forecast models as diagnostic and management tools. CLEAN–Soil Air Water 2023, 51, 2200321. [Google Scholar] [CrossRef]
- Kadave, P.T.; Bhor, M.B.; Bhor, A.B.; Bhosale, M.S. Physicochemical analysis of open well water Samples near Industrial Area of Niphad, Nashik District,(Maharashtra), India. J. Environ. Sci. Toxicol. Food Technol. 2012, 1, 01–04. [Google Scholar] [CrossRef]
- Dhar, I.; Biswas, S.; Mitra, A.; Pramanick, P.; Mitra, A. COVID-19 Lockdown phase: A boon for the River Ganga water quality along the city of Kolkata. NUJS J. Regul. Stud. 2020, 5, 53. [Google Scholar]
- Chakraborty, S.; Mitra, A.; Pramanick, P.; Zaman, S.; Mitra, A. Scanning the water quality of lower Gangetic delta during COVID-19 lockdown phase using Dissolved Oxygen (DO) as proxy. NUJS J. Regul. Stud. 2020, 69–74. [Google Scholar]
- Mukherjee, P.; Pramanick, P.; Zaman, S.; Mitra, A. Eco-restoration of River Ganga water quality during COVID-19 lockdown period using Total Coliform (TC) as proxy. NUJS J. Regul. Stud. Spec. Issue 2020, 75–82. [Google Scholar]
- Chowdhury, P.; Mukhopadhyay, B.P.; Nayak, S.; Bera, A. Hydro-chemical characterization of groundwater and evaluation of health risk assessment for fluoride contamination areas in the eastern blocks of Purulia district, India. Environ. Dev. Sustain. 2022, 24, 11320–11347. [Google Scholar] [CrossRef]
- Swami, P.K.; Tyagi, A. Describing water quality with aggregate index. J. Environ. Eng. 2000, 126, 451–455. [Google Scholar]
- Dwivedi, S.L.; Pathak, V. A preliminary assignment of water quality index to Mandakini River, Chitrakoot. Indian J. Environ. Prot. 2007, 27, 1036–1038. [Google Scholar]
- Mukherjee, D.; Dora, S.L.; Tiwary, R.K. Evaluation of water quality index for drinking purposes in the case of Damodar River, Jharkhand and West Bengal Region, India. J. Bioremediation Biodegrad. 2012, 3, 161. [Google Scholar] [CrossRef]
- Selvam, S.; Manimaran, G.; Sivasubramanian, P.; Balasubramanian, N.; Seshunarayana, T. GIS-based evaluation of water quality index of groundwater resources around Tuticorin coastal city, South India. Environ. Earth Sci. 2014, 71, 2847–2867. [Google Scholar] [CrossRef]
- Kanakiya, R.S.; Singh, S.K.; Sharma, J.N. Determining the water quality index of an urban water body Dal Lake, Kashmir, India. IOSR J. Environ. Sci. Toxicol. Food Technol. 2014, 8, 64–71. [Google Scholar]
- Hou, W.; Sun, S.; Wang, M.; Li, X.; Zhang, N.; Xin, X.; Jia, R. Assessing water quality of five typical reservoirs in lower reaches of Yellow River, China: Using a water quality index method. Ecol. Indic. 2016, 61, 309–316. [Google Scholar] [CrossRef]
- Rana, R.; Ganguly, R.; Gupta, A.K. Indexing method for assessment of pollution potential of leachate from non-engineered landfill sites and its effect on ground water quality. Environ. Monit. Assess. 2018, 190, 46. [Google Scholar] [CrossRef]
- Chakraborty, B.; Roy, S.; Bera, A.; Adhikary, P.P.; Bera, B.; Sengupta, D.; Bhunia, G.S.; Shit, P.K. Cleaning the river Damodar (India): Impact of COVID-19 lockdown on water quality and future rejuvenation strategies. Environ. Dev. Sustain. 2021, 23, 11975–11989. [Google Scholar] [CrossRef] [PubMed]
- Brown, R.M.; McClelland, N.I.; Deininger, R.A.; Tozer, R.G. A Water Quality Index: Do We Dare? Water Sew. Work. 1970, 117, 339–343. [Google Scholar]
- Madhloom, H.M.; Al-Ansari, N.; Laue, J.; Chabuk, A. Modeling spatial distribution of some contamination within the lower reaches of Diyala River using IDW interpolation. Sustainability 2017, 10, 22. [Google Scholar] [CrossRef]
- Kumar, S.; Sangeetha, B. Assessment of ground water quality in Madurai city by using geospatial techniques. Groundw. Sustain. Dev. 2020, 10, 100297. [Google Scholar] [CrossRef]
- Rudra, K. Rivers of the Ganga-Brahmaputra-Meghna Delta: A Fluvial Account of Bengal; Springer: Berlin/Heidelberg, Germany, 2018. [Google Scholar] [CrossRef]
- Panigrahi, A.K.; Pattnaik, S. Water pollution effects of river Saraswati and Kunti on livelihood: A case study of fishermen communities in Tribeni and Kuntighat, Hooghly, West Bengal. J. Fish. 2020, 8, 928–934. [Google Scholar] [CrossRef]
- Mandal, B. Decay of Saraswati River with special emphasis on its environmental issues Hooghly & Howrah district, West Bengal. Open Access Int. J. Sci. Eng. 2017, 2, 13–22. [Google Scholar]
- Chakraborty, B.; Roy, S.; Bera, A.; Adhikary, P.P.; Bera, B.; Sengupta, D.; Bhunia, G.S.; Shit, P.K. Eco-restoration of river water quality during COVID-19 lockdown in the industrial belt of eastern India. Environ. Sci. Pollut. Res. 2021, 28, 25514–25528. [Google Scholar] [CrossRef]
- Chakraborty, A.; Bera, A.; Mukherjee, A.; Basak, P.; Khan, I.; Mondal, A.; Roy, A.; Bhattacharyya, A.; Sen Gupta, S.; Roy, D.; et al. Changing bacterial profile of Sundarbans, the world heritage mangrove: Impact of anthropogenic interventions. World J. Microbiol. Biotechnol. 2015, 31, 593–610. [Google Scholar] [CrossRef]
- Woutersen, M.; Belkin, S.; Brouwer, B.; Van Wezel, A.P.; Heringa, M.B. Are luminescent bacteria suitable for online detection and monitoring of toxic compounds in drinking water and its sources? Anal. Bioanal. Chem. 2011, 400, 915–929. [Google Scholar] [CrossRef]


| Total Dissolved Solids (TDS) | Normalized Difference Salinity Index (NDSI) | Normalized Difference Turbidity Index (NDTI) | Floating Algae Index (FAI) | Normalized Difference Chlorophyll Index (NDCI) | Modified Normalized Difference Water Index (MNDWI) | Modified Water Index (MWI) | Normalized Difference Water Index (NDWI) | |
|---|---|---|---|---|---|---|---|---|
| 1 | 1 | 2 | 2 | 2 | 3 | 4 | 5 | |
| 1 | 1 | 1 | 2 | 2 | 3 | 4 | 6 | |
| 0.5 | 1 | 1 | 1 | 2 | 4 | 5 | 6 | |
| 0.5 | 0.5 | 1 | 1 | 1 | 2 | 3 | 5 | |
| 0.5 | 0.5 | 0.5 | 1 | 1 | 1 | 2 | 4 | |
| 0.333 | 0.333 | 0.25 | 0.5 | 1 | 1 | 1 | 2 | |
| 0.25 | 0.25 | 0.2 | 0.333 | 0.5 | 1 | 1 | 3 | |
| 0.2 | 0.166 | 0.166 | 0.2 | 0.25 | 0.5 | 0.333 | 1 | |
| AHP weights | 0.223 | 0.204 | 0.189 | 0.131 | 0.101 | 0.065 | 0.054 | 0.029 |
| Consistency Ratio (CR): 0.020 | ||||||||
| As per the Bureau of Indian Standards (BIS) Class ‘C’ (Drinking Water Source After Conventional Treatment) | |
|---|---|
| Value | |
| pH | 8.5 |
| DO (mg/mL | 4 |
| BOD (mg/mL) (5 days, 20 °C) | 3 |
| Total Coliform Organisms (MPN/100 mL) | 5000 |
| TDS (mg/L) | 1500 |
| Sulfates (mg/L) | 400 |
| Nitrates (as NO3) (mg/L) | 50 |
| Total Hardness (mg/L) | 200 |
| Calcium (mg/L) | 75 |
| Magnesium (mg/L) | 30 |
| EC (µS/cm) | 500 |
| Sample no. | Water Color after the Experiment | Discussion |
|---|---|---|
| 1 | Greenish yellow | From this experiment, it is clear that this sample was highly polluted with heavy metals (arsenic, mercury, lead, copper, and sodium), acids, and organic matter, but the level of pollution was lower than that in other samples. During the experiment, the sample temperature reached 42 °C, which also indicated that the water was contaminated. |
| 2 | Blueish | The sample was highly polluted with chemicals, fertilizers, pesticides, bacteria, and viruses. During the experiment, the sample temperature reached 52 °C, indicating sample impurities. |
| 3 | Greenish blue | The sample was highly polluted with chemicals, fertilizers, pesticides, heavy metals (arsenic, mercury, lead, copper, and sodium), bacteria, and viruses. During the experiment, the sample temperature reached 60 °C, indicating sample impurities. |
| 4 | Whiteish green | The sample was highly polluted with heavy metals (arsenic, mercury, lead, copper, sodium, zinc, and mercury) and with bacteria and viruses that are highly affected by inorganic substances. During the experiment, the sample temperature reached 75 °C, indicating that the sample was highly impure in nature. |
| 5 | Yellowish | The sample was highly contaminated by acids, fluoride, and other organic matter. During the experiment, the sample temperature reached 45 °C, which also indicated that the water was impure. |
| 6 | Blueish yellow | The sample was highly polluted with chemicals, fertilizers, pesticides, bacteria, and viruses; fluoride and acids were also present. During the experiment, the sample temperature reached 41 °C, which also indicated that the water was contaminated. |
| 7 | Blueish yellow | The sample was highly polluted with chemicals, fertilizers, pesticides, bacteria, and viruses; fluoride and acids were also present. During the experiment, the sample temperature reached 42 °C, which also indicated that the water was impure. |
| 8 | Greenish blue | The sample was highly polluted with chemicals, fertilizers, pesticides, heavy metals (arsenic, mercury, lead, copper, and sodium), bacteria, and viruses. During the experiment, the sample temperature reached 50 °C, indicating sample impurities. |
| Sample No. | pH | TDS (mg/mL) | EC (µS/cm) | DO (mg/mL) | BOD (mg/mL) | Total Coliforms (MPN/100 mL) | Sulfates (mg/L) | Total Hardness (mg/L) | Calcium (mg/L) | Magnesium (mg/L) | Nitrites (mg/L) | WQI |
|---|---|---|---|---|---|---|---|---|---|---|---|---|
| 1 | 7.8 | 188 | 376 | 3.4 | 3 | 990 | 20.8 | 90.9 | 25 | 9 | 0.38 | 86.42751 |
| 2 | 7.8 | 334 | 668 | 3.9 | 3 | 1050 | 22.65 | 123 | 28 | 10 | 0.68 | 90.93435 |
| 3 | 7.6 | 386 | 771 | 4 | 7 | 2000 | 25 | 129.7 | 32 | 11 | 1.9 | 148.8886 |
| 4 | 7.8 | 656 | 1313.00 | 4.9 | 8 | 2450 | 30.2 | 138.6 | 38 | 16 | 1.8 | 171.9309 |
| 5 | 7.8 | 425 | 808 | 4.8 | 10 | 2309 | 33 | 129 | 37 | 15.3 | 1.9 | 199.2705 |
| 6 | 8 | 450 | 880 | 4.5 | 6 | 2000 | 29 | 128 | 31 | 16 | 0.9 | 140.0327 |
| 7 | 7.8 | 202 | 456 | 4.2 | 8 | 1700 | 27 | 121 | 33 | 14 | 0.7 | 165.3216 |
| 8 | 7.6 | 350 | 638 | 4.3 | 12 | 600 | 28.5 | 110 | 36 | 11 | 0.6 | 222.5919 |
| 9 | 7.6 | 396 | 821 | 6.08 | 14.00 | 1243 | 25.90 | 97.11 | 25.90 | 9.09 | 1.73 | 265.0762 |
| 10 | 7.8 | 512 | 937 | 6.94 | 16.25 | 1418 | 29.54 | 110.78 | 29.54 | 10.37 | 1.60 | 304.8411 |
| 11 | 7.7 | 485 | 910 | 6.74 | 12.00 | 1377 | 28.69 | 107.58 | 28.69 | 10.07 | 1.80 | 242.2821 |
| 12 | 7.6 | 622 | 947 | 7.01 | 18.00 | 1434 | 29.88 | 112.03 | 29.88 | 10.48 | 1.70 | 330.1181 |
| 13 | 7.6 | 250 | 675 | 5.00 | 17.00 | 1022 | 21.29 | 79.84 | 21.29 | 7.47 | 1.42 | 298.7371 |
| 14 | 7.3 | 366 | 791 | 5.86 | 9.00 | 1197 | 24.94 | 93.52 | 24.94 | 8.75 | 1.67 | 191.2476 |
| 15 | 7.5 | 456 | 881 | 6.53 | 11.00 | 1334 | 27.79 | 104.22 | 27.79 | 9.75 | 1.86 | 225.8285 |
| 16 | 7.7 | 586 | 911 | 6.75 | 14.00 | 1379 | 28.73 | 107.73 | 28.73 | 10.08 | 1.92 | 270.9204 |
| 17 | 7.2 | 492 | 917 | 6.79 | 18.00 | 1388 | 28.92 | 108.44 | 28.92 | 10.15 | 1.93 | 327.5279 |
| 18 | 7.8 | 520 | 945 | 7 | 20.00 | 1430 | 29.79 | 111.72 | 29.79 | 10.45 | 1.99 | 358.9186 |
| 19 | 7.4 | 432 | 849 | 3.13 | 11 | 920 | 16.64 | 108.91 | 27.28 | 9.27 | 0.71 | 198.2169 |
| 20 | 7.5 | 440 | 857 | 3.1 | 16 | 920 | 22.65 | 118.82 | 33.73 | 8.11 | 0.02 | 269.5482 |
| 21 | 8 | 618 | 935 | 1.66 | 21 | 920 | 20.41 | 89.12 | 35.72 | 2.5 | 0.3 | 329.4884 |
| 22 | 7.3 | 680 | 897 | 1.88 | 12 | 2400 | 30.2 | 118.81 | 27.78 | 11.58 | 0.21 | 202.6836 |
| 23 | 7.1 | 604 | 921 | 3.9 | 14.75 | 2400 | 21.63 | 69.31 | 15.88 | 6.95 | 1.5 | 256.804 |
| 24 | 7.2 | 654 | 871 | 4.59 | 18 | 2400 | 25.1 | 69.31 | 15.88 | 6.95 | 1.3 | 308.909 |
| 25 | 7.6 | 540 | 957 | 4.29 | 6 | 2400 | 21.22 | 138.62 | 27.78 | 16.22 | 1.6 | 137.7026 |
| 26 | 7.3 | 538 | 955 | 3.9 | 5 | 1600 | 14.49 | 69.31 | 19.84 | 4.64 | 1.5 | 117.6808 |
| 27 | 7.4 | 558 | 975 | 2.93 | 6 | 920 | 15.51 | 49.51 | 11.9 | 4.64 | 1.7 | 124.1218 |
| Parameters: | pH | TDS (mg/mL) | EC (µS/cm) | DO (mg/mL) | BOD (mg/mL) | Total Coliforms (MPN/100 mL) | Sulfates (mg/L) | Total Hardness (mg/L) | Calcium (mg/L) | Magnesium (mg/L) | Nitrites (mg/L) | WQI |
| Max | 8.00 | 68.00 | 1313.00 | 7.01 | 21.00 | 2450.00 | 33.00 | 138.62 | 38.00 | 16.22 | 1.99 | 358.92 |
| Min | 7.10 | 188.00 | 376.00 | 1.66 | 3.00 | 600.00 | 14.49 | 49.51 | 11.90 | 2.50 | 0.02 | 86.43 |
| Mean | 7.59 | 471.85 | 846.74 | 4.74 | 11.70 | 1525.96 | 25.17 | 105.00 | 27.82 | 9.99 | 1.31 | 221.71 |
Disclaimer/Publisher’s Note: The statements, opinions and data contained in all publications are solely those of the individual author(s) and contributor(s) and not of MDPI and/or the editor(s). MDPI and/or the editor(s) disclaim responsibility for any injury to people or property resulting from any ideas, methods, instructions or products referred to in the content. |
© 2025 by the authors. Licensee MDPI, Basel, Switzerland. This article is an open access article distributed under the terms and conditions of the Creative Commons Attribution (CC BY) license (https://creativecommons.org/licenses/by/4.0/).
Share and Cite
Dutta, A.; Karmakar, S.; Das, S.; Banerjee, M.; Ray, R.; Hasher, F.F.B.; Mishra, V.N.; Zhran, M. Modeling the River Health and Environmental Scenario of the Decaying Saraswati River, West Bengal, India, Using Advanced Remote Sensing and GIS. Water 2025, 17, 965. https://doi.org/10.3390/w17070965
Dutta A, Karmakar S, Das S, Banerjee M, Ray R, Hasher FFB, Mishra VN, Zhran M. Modeling the River Health and Environmental Scenario of the Decaying Saraswati River, West Bengal, India, Using Advanced Remote Sensing and GIS. Water. 2025; 17(7):965. https://doi.org/10.3390/w17070965
Chicago/Turabian StyleDutta, Arkadeep, Samrat Karmakar, Soubhik Das, Manua Banerjee, Ratnadeep Ray, Fahdah Falah Ben Hasher, Varun Narayan Mishra, and Mohamed Zhran. 2025. "Modeling the River Health and Environmental Scenario of the Decaying Saraswati River, West Bengal, India, Using Advanced Remote Sensing and GIS" Water 17, no. 7: 965. https://doi.org/10.3390/w17070965
APA StyleDutta, A., Karmakar, S., Das, S., Banerjee, M., Ray, R., Hasher, F. F. B., Mishra, V. N., & Zhran, M. (2025). Modeling the River Health and Environmental Scenario of the Decaying Saraswati River, West Bengal, India, Using Advanced Remote Sensing and GIS. Water, 17(7), 965. https://doi.org/10.3390/w17070965