Abstract
High-altitude wetlands in the Ecuadorian Andes are key ecosystems for water regulation and biodiversity conservation but remain poorly monitored due to persistent cloud cover and complex terrain. This study aims to develop a multitemporal approach to map and monitor these wetlands under challenging environmental conditions. We integrated Sentinel-1 (SAR) and Sentinel-2 (multispectral) satellite imagery within the Google Earth Engine platform, applying a Random Forest classifier and soil moisture estimation through the Water Cloud Model. Results show that using only multispectral data underestimated wetland extent (18,919 ha in 2022; 4.7% of the area). In contrast, integrating radar and multispectral data enabled dynamic analysis, identifying 2023 as the peak year (28,972 ha; 7.2%), with the highest monthly coverage in April (6.7%). Soil moisture estimates showed stable monthly wetland extents (15.3–15.9%), with a maximum of 3065 ha in January–February, and demonstrated a strong link with cumulative rainfall patterns. This integrated approach offers a reliable method for high-resolution, seasonal wetland monitoring in cloud-prone mountain environments, supporting data-driven conservation and land management strategies.
1. Introduction
Mountain headwater ecosystems are vital for their hydrological services, supporting economic and social development downstream [1]. Andean páramos span over three million hectares across northern South America, from the Mérida range in Venezuela to the Huancabamba depression in Peru [1,2,3]. In Ecuador, they cover 1.52 million hectares, ranging from 3300 m.a.s.l. in the eastern cordillera to above 3500 m.a.s.l. in the western cordillera [4,5]. Páramos provide essential ecosystem services such as water supply, carbon storage, erosion control, and water regulation. Their hydrology relies on the capacity to store and release water, which depends on the watershed’s water balance of inputs, storage, and outputs [6]. El Distrito Metropolitano de Quito (DMQ) relies on water from the northern Ecuadorian Andes, with at least 85% of its water supply coming from páramos. In 2020, the Papallacta system captured 101.91 million m3, while the La Mica system contributed 47.88 million m3, together providing 53.63% of the DMQ’s water supply [7].
Although rainfall intensity in the paramo is usually low, the frequency of those events is high, with annual precipitation above 2000 mm [8]. Once precipitation reaches the soil, infiltration capacity redistributes water through surface and subsurface flows. This capacity ranges from 20 to 80 mm·hr−1, while precipitation intensity remains below 10 mm·hr−1 [1,9]. Consequently, paramo soils have a notable water storage capacity [10], enabling the formation of saturated land areas (wetlands) for significant periods of the year, with or without the presence of peat [11]. Wetland soils generally differ from mineral soils due to their high organic matter content (approximately 30–100%), low bulk density (0.09–0.68 g·cm−3), and high porosity (up to 98%), resulting in a significant volumetric water content [12].
According to the Water Protection Fund (FONAG for its acronym in Spanish), wetlands are characterized by floodable grasslands with the presence of cushions associated with bodies of water and areas susceptible to flooding. In Ecuador, efforts to classify and delineate wetlands primarily relied on the use of multispectral images, starting with Coverage and Use Map with an Ecosystem Approach [13]. This mapping defines the category “Bofedales Altoandino Paramuno”. Later, in 2013, the ecosystem classification system of Ecuador introduced the “Herbazal inundable de Páramo” ecosystem (HsSn04) [14,15], described as areas with cushion plants associated with water bodies and flood-prone zones, including peatlands and swamps. In 2022, FONAG developed the project “Generation of a Map of Ecosystems, Vegetation Cover, and Land Use of the Metropolitan District of Quito—DMQ at a scale of 1:10,000 and Reference Multitemporal Analysis with Existing Maps”, using 4287 multispectral images (Planet) from 2021 and 2022 with a spatial resolution of 2.5 m and generating a mosaic in such a way that the percentage of cloud cover is less than 8%; the project determined that the “Herbazal inundable del Páramo” (wetlands) accounts for 1.58% of the ecosystem surface area within the DMQ [15]. The Ministry of Environment, Water and Ecological Transition (MAATE) estimates that páramo wetlands represent approximately 1% of the total area. However, recent mapping using multitemporal remote sensing information and a combination of multisensor radar and multispectral imagery combined with a Digital Elevation Model (DEM) suggests this value is closer to 5–18% [5,16].
In the Ecuadorian context, wetland monitoring initiatives have predominantly relied on traditional methods such as field surveys or the occasional use of unmanned aerial vehicles (UAVs). While these approaches offer high spatial resolution, they face significant limitations in terms of spatial coverage, temporal frequency, and operational scalability [17]. In response to this scenario, remote sensing has emerged as a strategic alternative for the delineation and characterization of wetlands, utilizing both multispectral sensors (e.g., Landsat, Sentinel-2, PlanetScope) and synthetic aperture radar (SAR) technologies such as Sentinel-1 and ALOS PALSAR [17,18,19]. However, in high mountain environments like the Andes, these technologies face substantial technical challenges; multispectral sensors are limited by persistent cloud cover, while SAR data interpretation requires specific considerations related to terrain geometry and directional backscatter response [17].
The launch of the European Space Agency’s Copernicus Sentinel-1 (S1) satellite series in 2014 provides free access to high-temporal-resolution (approximately 6 days) and high-spatial-resolution (10 m) images [20]. Active microwave remote sensing (radar) has the advantage of providing 24 h observation capability under almost all weather conditions (except in the presence of convective systems) compared to multispectral images [21,22]. Wetlands are characterized by the presence of water, which can be found on the surface, beneath the vegetation canopy, or within the soil, rather than being associated with a specific type of vegetation cover. These features pose challenges for mapping when using multispectral data, radar backscatter information, or a combination of both [23]. While multispectral imagery has proven effective for mapping wetlands in low-elevation high-latitude regions, delineating high-altitude wetlands has required studies that incorporate both multispectral images and radar data from C-band [24] and L-band radar images [16,18,25].
In recent years, significant progress has been made in remote wetland monitoring through the integration of multispectral platforms and machine learning algorithms. The use of LiDAR data has enhanced the ability to capture the structural characteristics of vegetation, while SAR sensors have proven effective in detecting hydrological changes and variations in soil moisture [26,27]. Additionally, the implementation of classifiers such as Random Forest (RF), Support Vector Machines (SVMs), and deep neural networks has led to more robust classifications in spectrally heterogeneous environments like high-altitude vegetation mosaics [28]. However, many of these applications lack a systematic implementation in Andean regions, where multitemporal monitoring is essential to understand the ecological dynamics of these ecosystems.
Specifically in northern Ecuador, the literature reflects relevant efforts focused primarily on multispectral sensors. García et al. (2019) used Landsat 8 along with the CART algorithm to detect degradation processes in paramo soils, while Valencia et al. (2020) applied supervised classification with Landsat 7 to map land covers such as snow, rock, grassland, and wetlands for ecological purposes. Similarly, Valencia et al. (2022) proposed a hybrid approach based on UAVs, fieldwork, and satellite imagery to characterize high Andean wetlands. Hribljan et al. (2017) integrated multispectral and SAR data from multiple sources (Landsat TM, PALSAR, RADARSAT-1) to map peatlands and estimate carbon stocks. While these studies demonstrated the applicability of remote sensing, they did not incorporate a systematic temporal strategy capable of capturing seasonal and interannual variations in wetland extent and condition [16,17,29].
To address this gap, the present study proposes a comprehensive multitemporal approach based on Sentinel-1 (SAR) and Sentinel-2 (multispectral) image series, which allows overcoming the operational limitations imposed by cloud cover in high mountain regions. This integration facilitates the identification of phenological and hydrological dynamics throughout the year, providing a more accurate view of the spatiotemporal variability of wetlands. Collectively, these methodological elements strengthen the technical foundation for evidence-based management and conservation of high-altitude wetlands, directly addressing methodological gaps identified in previous studies.
Estimating Soil Surface Moisture (SSM) using Synthetic Aperture Radar (SAR) sensors relies on microwave backscatter measurements from the soil (σ°), which are closely related to the soil’s dielectric constant (ε) [30]. For dry soil, ε ≈ 6; for saturated soil, ε ≈ 30; and for liquid water, ε ≈ 80 [31]. The intensity of σ° depends on the object’s physical and electrical properties, wavelength (λ), polarization, radar incidence angle (θ), vegetation, and surface roughness [32]. However, retrieving SSM from radar signals is challenging, as multiple combinations of SSM, roughness, and vegetation can produce identical electromagnetic responses [22]. To address this complexity, various algorithms and methods have been proposed for SSM inversion, including (a) SSM retrieval using theoretical scattering models, (b) SSM retrieval via empirical scattering models, (c) Dielectric Mixing Models, (d) change detection approaches, and (e) SSM retrieval through polarimetric processes [22,31].
Semi-empirical backscatter models combine the complexity of theoretical models with the simplicity of empirical ones. They are based on physical principles and use simulated or experimental datasets to simplify theoretical models. Widely used semi-empirical models include those developed by Oh (1992), Shi (1997), and Dubois (1995), primarily designed for bare soil and sparsely vegetated surfaces [31]. The Water Cloud Model (WCM), developed by Attema and Ulaby (1978), effectively represents the σ° of vegetation cover and underlying soil [31,33]. The WCM assumes the vegetation cover consists of identical scattering elements distributed homogeneously, resembling a cloud of water particles. The observed backscatter coefficient (σ° obs) (m2/m2) is expressed as the sum of the vegetation backscatter coefficient (σ° veg) and the soil surface backscatter coefficient (σ° soil), adjusted by an extinction factor (τ2), which is the vegetation optical depth or VOD for radiation loss through vegetation [30,34]. The WCM facilitates the retrieval of bare soil backscatter [22,33], enabling wetland delineation based solely on SSM values and minimizing errors associated with vegetation cover. This approach was already applied to Sentinel-1 SAR images to retrieve either SSM and VOD at medium resolution (1 km) [35,36,37].
The application of the WCM to determine soil moisture in cropland and grassland areas has been extensively studied [38,39,40,41,42,43,44,45]. This information has proven valuable for improving crop yields. However, applying this technique to map wetlands in Andean páramos remains a research challenge. In this study, we assume that mapping bofedales (páramo wetlands) can be achieved through indirect soil moisture measurements. To test this hypothesis, we propose using radar images (C-band) at VH and VV polarizations and applying the Water Cloud Model (WCM). The primary objective of this research is to map wetlands (bofedales) within the FONAG/EPMAPS hydrological interest area, covering 401,531 hectares in the northern Ecuadorian Andes, across the provinces of Pichincha, Napo, and Cotopaxi. The study will use the results of FONAG’s analysis based on Planet multispectral imagery from 2022, a supervised classification using Sentinel-1 and Sentinel-2 data, and soil moisture measurements. These three data sources will be leveraged to establish the intra- and inter-annual variability of the wetland areas.
2. Materials and Methods
2.1. Study Area and Field Data
The study area is located in eastern South America, specifically in the northern Ecuadorian Andes, approximately at coordinates 0°13′12″ S/78°30′45″ W. The FONAG/EPMAPS hydrological interest area covers 401,531 hectares, as illustrated in Figure 1. The study area includes 11 meteorological stations collecting precipitation data from 1 January 2017 to 1 May 2024 with a monthly temporal resolution. Five of them are equipped with soil surface moisture stations, measuring volumetric soil water content (%) at a depth of 10 cm from 01/2019 to 05/2024 (https://sedc.fonag.org.ec/reportes/consultas_periodo (accessed on 17 June 2024)). Additionally, soil moisture data are available for the Jatunhuayco area from 1 January 2020 to 30 August 2022, as reported by Páez-Bimos et al. 2023 [3,46]. Information from the stations that characterize rainfall and SSM are detailed in Table 1.
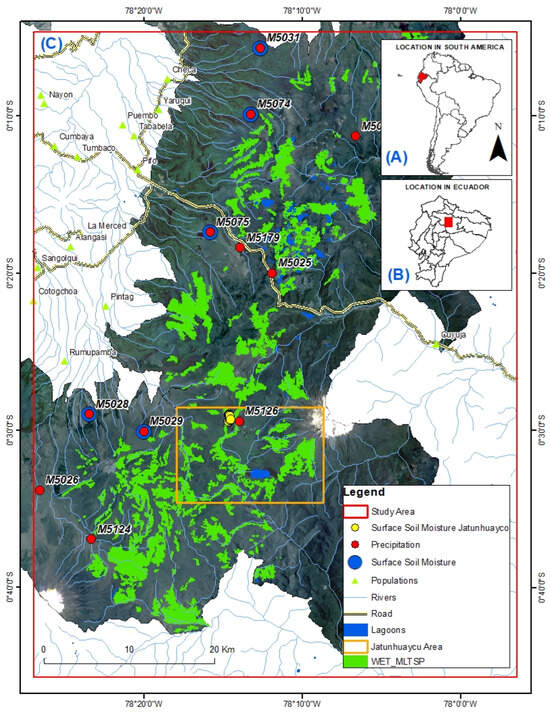
Figure 1.
Study Area. (A) Ecuador is located in eastern South America. (B) The FONAG/EPMAPS hydrological interest area (red polygon) is located in the northern Ecuadorian Andes. (C) Additionally, based on data availability of SSM data provided by Paez-Bimos, an area called the Jatunhuayco area (orange polygon) has been defined. Red points represent the 11 stations that characterize the precipitation, blue points represent the stations that have SSM measurements available, yellow points represent the SSM measurements in the Jatunhuayco area, and green polygons represent the wetlands identified by FONAG, 2022 through the Planet image (WET_MLTSP).

Table 1.
Localization and characteristics of the precipitation and surface soil moisture stations.
2.2. Multiespectral Wetlands (WET_MLTSP)
Mapping wetlands using multispectral images was developed by FONAG in 2022. The analysis was carried out using 4287 Planet images with a spatial resolution of 2.5 m, generating a mosaic with less than 8% cloud cover. Cloudy areas were corrected by replacing them with extracts from cloud-free images captured between April 2021 and April 2022. Subsequently, a general review of the mosaic was performed to verify the presence of displacements, gaps, or voids, ensure spatial logic between entities, and confirm that the mosaic was suitable for further processing [15]. The bands from the Planet mosaic used for identifying and validating spatial entities (land cover types) are detailed in Appendix A.
Additionally, the Normalized Difference Vegetation Index (NDVI) is considered, which allows the estimation of vegetation characteristics such as vigor and health (quantity, quality, and development) based on the measurement of radiation reflected by the red and near-infrared bands of vegetation in the area. The ecosystem classification was carried out using the unsupervised classification method, where a category is assigned to each pixel based on the spectral signature of the image (composed of different bands). The unsupervised classification was performed using ArcGIS Pro 2.9 with the wizard tool. The results of the WET_OPT mapping can be seen in Figure 1.
2.3. Satellite Data
Multitemporal Sentinel-1 and Sentinel-2 images from 1 January 2019 to 31 May 2024, available on GEE (https://developers.google.com/earth-engine/datasets/catalog/sentinel (accessed on 3 November 2024), were used in this study. Image processing, including cloud and shadow masking, NDVI, NDWI calculations, and spectral signature extraction, was conducted using the Google Earth Engine platform.
2.3.1. Sentinel-1
The Sentinel-1 satellite provides Level 1 GRD data in IW mode for ascending and descending orbits, with C-band frequency, approximately 6 cm wavelength, 10 m spatial resolution, and dual polarization VH and VV [33,36]. The preprocessing of Sentinel-1 images was carried out in GEE, available at: https://github.com/adugnag/gee_s1_ard (accessed on 3 November 2024).
2.3.2. Sentinel-2
The Sentinel-2 Earth observation mission consists of two satellites (Sentinel-2A and Sentinel-2B) with a temporal resolution of 5 days and spatial resolutions of 10, 20, and 60 m in the visible, near-infrared (NIR), and shortwave infrared (SWIR) spectra [25,47]. Clouds and cloud shadows were masked at the pixel level using the GEE Cloud Score + S2_HARMONIZED dataset, which assigns values of 0 and 1 to pixels based on surface visibility, where 0 represents unclear (occluded) pixels, and 1 represents clear (non-occluded) pixels. The procedure involves obtaining a collection of surface reflectance images (Sentinel-2) filtered by date and region of interest, adding the Cloud Score + S2 bands, and extracting a binary mask for each image. Finally, a reducer is applied to generate a clear composite [47,48]. For this study, the median was used as the compositing criterion. Table 2 shows the summary of the satellite information used in the study.

Table 2.
Summary of satellite information collected for this study.
2.4. Methodology
The methodology begins with wetlands identified by FONAG in 2022, referred to as WET_MLTSP. Subsequently, wetland mapping using radar (Sentinel-1) and multispectral (Sentinel-2) imagery, known as WET_RADAR, is carried out in Google Earth Engine with the RF. The classification process incorporates various bands, including slope, topographic index, VH, VV, VH_VV_ratio, incidence angle, NDVI, and NDWI. Additionally, wetland mapping based on SSM measurements, termed WET_SSM, involves calibrating the WCM model. Once the calibration constants are determined, the mapping is implemented in Google Earth Engine. Finally, data from the three mapping approaches (WET_MLTSP, WET_RADAR, and WET_SSM) are used to analyze wetland area variations on both an annual and monthly scale. Figure 2 shows a graphical summary of the methodology.
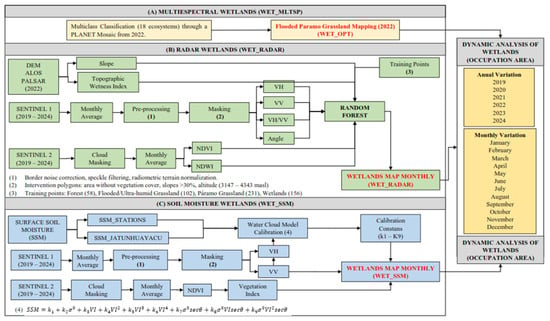
Figure 2.
Methodology for dynamic mapping wetlands (A) WET_ OPT developed by FONAG, 2022. (B) WET_RADAR uses radar (Sentinel-1) and multispectral (Sentinel-2) information and a RF in GEE. (C) WET_MLTSP uses SSM data from the stations and the Jatunhuayco area to calibrate WCM, and the mapping is executed in GEE.
2.4.1. Radar Wetlands (WET_RADAR)
Masking Sentinel-1 Images
Once the preprocessed Sentinel-1 image is obtained, masking is applied, considering intervention areas, bare soil, water bodies, slopes greater than 30%, and altitudes below 3147 m.a.s.l. and above 4343 m.a.s.l. The intervention polygons were selected from the classification developed by FONAG in 2022. Specifically, the following ecosystems were chosen: Intervention Areas, Natural Water Bodies, and Areas without Vegetation Cover.
According to the definition of the “Flooded Grassland of the Páramo”, wetlands are located in areas with altitudes between 3300 and 4500 m.a.s.l. Based on the multispectral classification by FONAG in 2022, wetlands are found in areas with altitudes ranging from 3147 m.a.s.l. to 5650 m.a.s.l. Figure 3A shows the histogram of elevations at which the WET_MLTSP polygons are located. Based on the established criteria, it was determined that, although the definition of Flooded Grasslands of the Páramo states that wetlands are located at maximum altitudes of 4500 m.a.s.l., the cumulative distribution analysis revealed that the polygons are situated in areas up to 5600 m.a.s.l. In this study, the lower limit for determining wetlands is set at 3147 m.a.s.l., while the upper limit corresponds to the 95% percentile of cumulative distribution observations, which is 4343 m.a.s.l.

Figure 3.
(A) Elevation histogram (m.a.s.l) of wetlands identified by multispectral image. The maximum altitude value recorded in the multispectral wetlands corresponds to 5650 m.a.s.l, while the mode corresponds to 4056 m.a.s.l. The value that covers 95% of the observations is 4343 m.a.s.l. (B) Slope histogram (%) of wetlands identified by multispectral image. The maximum slope value recorded in the multispectral wetlands corresponds to 73%, while the mode corresponds to 4%. The value that covers 95% of the observations is 25%.
The slope masking considers that convex contours and steep slopes promote the accumulation of surface runoff, subsurface flow, and groundwater in the lower slope positions. The foot of the slope (footslope) represents the transition between the backslope and flatter zones, with typical slopes ranging from 5° to 15°. The toeslope, being the lowest and nearly flat area, features slopes of <5° [49,50,51]. Multispectral classifications determined that wetlands are found in areas with slopes ranging from 0% to 73% (Figure 3B). For this study, the slope was determined by including 95% of the observations conducted by FONAG. Thus, slopes <25% were established as the masking criterion.
Topographic Wetness Index (TWI)
The Topographic Wetness Index (TWI) is a model used to predict the spatial distribution of soil moisture and is calculated using the following equation [52]:
where represents the drainage area per unit contour length (contributing area), which corresponds to the amount of water that can accumulate at a specific point on the terrain, and β is the local terrain slope expressed in radians. In this research, the TWI was calculated using a 12.5 m DEM and the GEE platform. The calculation of (drainage area) was determined by combining flow direction analysis and flow accumulation, while β was directly derived from the DEM.
Multispectral Spectral Indices
The characterization of soil water saturation considers the Normalized Difference Water Index (NDWI), expressed as
where NIR and GREEN represent spectral reflectance values from multispectral images, acquired in the near-infrared and green bands of the electromagnetic spectrum [53]. On the other hand, the characterization of hydrophilic plant species growing in wetlands considers the Normalized Difference Vegetation Index (NDVI), expressed as
where NIR and RED represent the reflectance values of the near-infrared and red bands of the electromagnetic spectrum [54].
Wetland Classification
Previous studies have determined that RF and SVM are the most suitable algorithms for wetland classifications. However, RF is much easier to implement and is robust against noise and overfitting [55]. In this study, the RF algorithm was used, a non-parametric supervised machine learning algorithm that employs a random ensemble of decision trees. This algorithm has proven effective for classifications involving large amounts of satellite image data, primarily because it can distinguish between different land cover classes [23]. The bands used in the classification are shown in Table 3.

Table 3.
Bands used in classification of WET_RADAR.
Training points for the RF were established based on the multispectral classification from FONAG, 2022. Specifically, 547 points were considered, distributed in different ecosystems as follows: Wetlands (Herbazal inundable del páramo) with 156 points, Páramo Grassland with 231 points, Humid/Ultra-Humid Grassland with 102 points, and Forest with 58 points. Appendix B shows the description of the training points. The RF model was configured with 100 decision trees (numberOfTrees = 100), providing a balance between accuracy and computational efficiency. The sampling fraction (baggingFraction) was set to 0.7, meaning that each tree was trained using a random 70% subset of the training dataset. The splitting criterion used was Gini impurity, which is the default setting in the RF implementation of Google Earth Engine (GEE). All other parameters were kept at their default values, following standard practices in similar remote sensing applications.
2.4.2. Soil Moisture Wetlands (WET_SSM)
SAR cannot be directly used to estimate soil moisture (SSM) because the relationship between backscatter (σ°) and SSM is inconsistent and influenced by topographic conditions and vegetation structure [56]. In this study, to preliminarily determine the relationships between SSM and σ° (VH, VV), a Principal Component Analysis (PCA) was conducted. Subsequently, semi-empirical models were applied to estimate SSM (Water Cloud Model). Finally, the GEE platform was used to develop SSM maps and delineate wetlands.
Principal Component Analysis (PCA)
An exploratory Principal Component Analysis (PCA) was conducted, which is a multivariate technique that transforms intercorrelated variables into sets of new linearly orthogonal variables with maximum variance, called principal components [57]. This analysis was performed to preliminarily establish potential correlations between SSM data and VH and VV polarizations. In the PCA graphs, two axes (x, y) are represented, showing combinations of the original variables that explain the greatest variance in the data (dimensions). Vectors are plotted along the axes to represent the variables; the longer the vector, the greater the contribution of that variable to the principal component. The angles between vectors indicate the correlation between variables; angles less than 90° represent a strong positive correlation, orthogonal angles (90°) indicate little to no correlation, and angles of 180° represent negative correlations.
Water Cloud Model (WCM)
The construction of the Water Cloud Model (WCM) for SSM estimation is based on the criteria established by [58]. They replaced the quadratic expression of vegetation water content (Mv) and soil backscatter (σ° soil) in the WCM equations. Additionally, the term exp(−2B.Mv.secθ) was expanded using the Taylor approximation, enabling the development of a semi-empirical model for soil moisture estimation, expressed as [58].
where SSM is volumetric soil moisture (cm3/cm3), σ° is the backscatter coefficient (VH or VV) expressed in dB, derived from Sentinel-1 SAR data, VI is the spectral index obtained from multispectral imagery, θ is the incidence angle, and k1–k9 are the constants obtained using a best-fit regression method.
The relationship between soil surface moisture (SSM), vegetation indices, and backscatter is complex, presenting challenges for classical regression methods when calibrating the Water Cloud Model (WCM). Machine learning techniques address such complexities, including nonlinearity and data heterogeneity [59]. In this study, the Linear Regression (LR) method was used, which can be divided into simple and multiple linear regression. The loss (or cost) function quantifies the difference between the values predicted by the model and the actual values of the dependent variable (in this case, SSM). The general form of the multiple linear regression equation is as follows:
where y is the predicted value (in this case, the estimated SSM), x1, x2, …, xn−1 are the independent variables (e.g., VV, VI, VI2, etc.), k1 is the intercept (constant term), and k2, k3, …, kn are the regression coefficients for each variable. The loss function (cost/utility) is expressed as
where yᵢ is the actual soil moisture value, yₑ is the estimated value from the model, and m is the total number of observations. The linear regression algorithm seeks to determine the optimal constants (k1–kn) that minimize the loss function, traditionally using the least squares method [43]. To ensure robust results, 70% of soil moisture data was used for WCM training, while the remaining 30% was used for validation.
In the context of machine learning, linear regression functions as a fundamental supervised learning algorithm that models the relationship between a set of input variables and a continuous target variable. In this study, multiple linear regression was applied using variables derived from remote sensing data, such as the VV backscatter coefficient, vegetation index (VI), and incidence angle (θ), along with nonlinear interactions and polynomial terms (e.g., VI2, VI3, VV·VI·sec(θ)) as input features. This multivariate model was implemented using Python’s Scikit-learn library, which automatically adjusts the regression coefficients by minimizing the residual errors between observed and estimated SSM values. The resulting model captures the functional behavior of the Water Cloud Model (WCM) and provides interpretable coefficients for each contributing variable, enabling reliable estimation of surface soil moisture under varying vegetation and backscatter conditions from Sentinel-1 polarizations (VH or VV). Additionally, the validation of soil moisture inversion results was evaluated using the following statistical metrics:
where is soil moisture data measured in the field, is soil moisture estimated using data inversion and WCM, and are standard deviations of measured and estimated soil moisture.
3. Results
3.1. Precipitation Results
The Ecuadorian Andes experience variable precipitation over relatively short distances due to their latitude, topography, and the influence of air masses from the Pacific Basin and the Amazon. The study area has 11 stations that collect precipitation data, with records consisting of monthly values from 1 January 2017 to 1 May 2024. The results of the precipitation analysis are shown in Table 4 and Figure 4.

Table 4.
Monthly precipitation analysis (January 2017–May 2024) for the 11 meteorological stations of the study area.

Figure 4.
Monthly precipitation for the study area. (A) Pacific Basin. (B) Amazon Basin.
The results of the monthly precipitation across the study area indicate that March has the highest precipitation index, with 131 mm/month, while September records the lowest precipitation values at 62 mm/month. Additionally, the rainy season begins in November and extends through May, while the period with the lowest precipitation indices occurs between June and October.
The monthly analysis has established that two precipitation regimes are observed in the study area (Figure 4). The first regime, characterized by the seven stations located on the Pacific Basin (M5031, M5074, M5075, M5028, M5029, M5026, and M5124), registers high precipitation indices in March and November, while August corresponds to the month with the lowest precipitation indices. The second precipitation regime corresponds to the four stations located on the Amazon Basin (M5021, M5179, M5025, M5126). These stations register high precipitation indices during the June–July period, while precipitation values decrease in February and October. The analysis at each of the stations in the study area is shown in Figure 5.
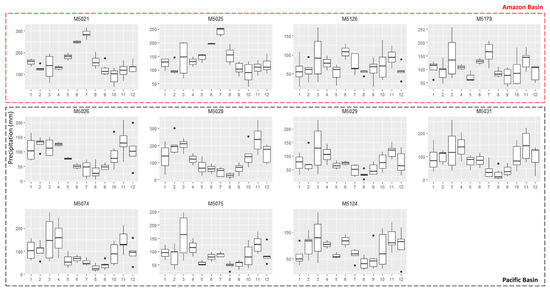
Figure 5.
Monthly precipitation analysis (January 2017–May 2024), x-axis expressed in months and y-axis expressed in mm. Stations located on the Pacific Basin (M5031, M5074, M5075, M5028, M5029, M5026, and M5124). Stations located on the Amazon Basin (M5021, M5179, M5025, and M5126).
3.2. Wetlands Multispectral (WET_MLTSP)
The results of wetland mapping using Planet imagery from 2022, conducted by FONAG, determined that wetlands, defined as Andean Páramo Floodable Grasslands, cover 18,919 hectares. Given that the study area spans 401,531 hectares, this represents an occupancy percentage of 4.7% within the study area. It is important to note that, as the mapping was carried out for a single year (2022), a dynamic analysis could not be performed.
3.3. Wetlands Radar (WET_RADAR)
The classification included variables derived from Sentinel-1 (VH, VV, VV/VH ratio, and incidence angle), Sentinel-2 (NDVI and NDWI), as well as topographic variables such as slope and the Topographic Wetness Index (TWI). The variable importance analysis revealed that the polarimetric bands VH and VV had the greatest influence on model performance, followed by NDWI and NDVI, highlighting the importance of spectral information related to soil moisture and vegetation in land cover differentiation. The VV/VH ratio, incidence angle, and topographic variables (slope and TWI) also contributed significantly, although to a lesser extent. This distribution of importance suggests that the classification benefited from a combination of radar, multispectral, and topographic data, particularly emphasizing the ability of radar to discriminate moisture-related classes such as wetlands and humid grasslands.
To assess classification performance, a confusion matrix was constructed, and standard accuracy metrics were calculated, including overall accuracy (OA) and the Kappa coefficient. The classification achieved an overall accuracy of 76.9% and a Kappa coefficient of 0.678, indicating substantial agreement between predicted and observed classes. The confusion matrix showed good overall performance in identifying humid grassland and forest classes, with some misclassification between wetlands and Humid/Ultra-Humid Grassland, which is expected given their ecological and spectral similarity. The confusion matrix is presented in Table 5.

Table 5.
Confusion matrix.
The validation of the wetland classification was complemented by fieldwork conducted at 87 verification polygons, selected through stratified sampling based on factors such as accessibility, road availability, terrain slope, and the presence of private properties. This sampling strategy aimed to maximize spatial coverage within the study area, ensuring the inclusion of various altitudinal zones, vegetation cover types, and climatic conditions (Pacific and Amazonian Basin), in order to adequately capture the heterogeneity of páramo ecosystems.
During the validation campaign, two reference categories were used (“wetland” and “non-wetland”), defined based on the multispectral cartography produced by FONAG (2022) and the radar-based classification generated in this study. Validation polygons were selected independently from the training dataset to avoid bias and ensure the objectivity of the accuracy assessment process. Although logistical limitations associated with high mountain terrain imposed access constraints, strategies were implemented to ensure a wide and balanced geographical distribution of validation sites. As a result, the accuracy metrics obtained are based on a spatially representative sample, which strengthens the methodological robustness and supports the validity of the classification results in a geographically complex context. The overall results are presented in Table 6.

Table 6.
Wetland validation criteria.
The validation results have established that the percentage of agreement between the FONAG multispectral classifications (2022) and those of WET_RADAR is 19.5%, while newly identified wetlands account for 60.9%. The discarded multispectral information (DISCARDED_ MULTISPECTRAL) corresponds to 14.9%. It is important to highlight that when considering the categories RADAR (53 points), Discarded_ multi-spectral (17 points), CORRECTED (3 points), and DISCARDED_MULTISPECTRAL (13 points), the total percentage is 98.8%, indicating that RADAR classifications exhibit a high correlation with field observations.
The NOT_IDENTIFIED category (1 point), corresponding to VAL_P55, represents 1.1%, which accounts for a wetland determined during in situ visits to have narrow and elongated characteristics. The wetland’s width does not exceed 10 m, suggesting that it may not be identified due to the spatial resolution of Sentinel-1 and Sentinel-2.
The general analysis of wetland mapping using radar information (WET_RADAR) shows that the month of April, between the years 2019 and 2024, has the largest wetland coverage, totaling 27,041 ha. Additionally, it has been determined that 7040 ha of wetlands were identified by both WET_MLTSP and WET_RADAR, while 20,001 ha correspond to new information exclusively identified by WET_RADAR. On the other hand, 11,879 ha of wetlands previously identified through multispectral information (WET_MLTSP) have been discarded. Table 7 and Figure 6 provide details of the analysis, showing the comparison between the new and discarded information.

Table 7.
Comparison of identified, generated, and discarded areas.
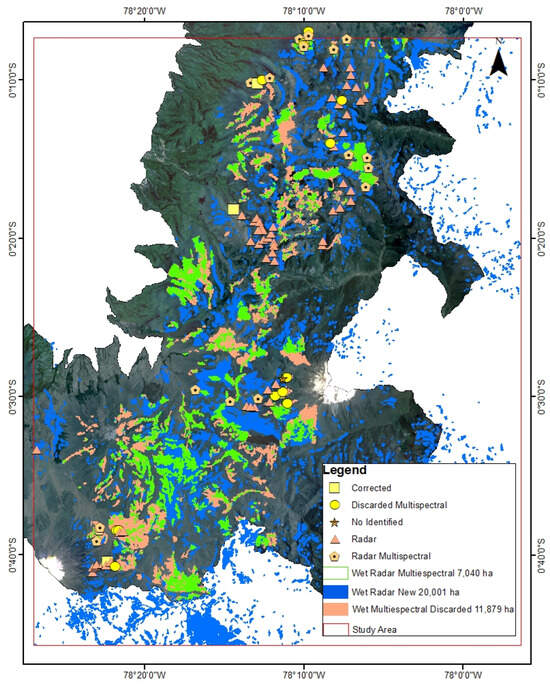
Figure 6.
Mapping validated. The green polygons represent the wetlands identified by WET_MLTSP, and the blue areas correspond to the new wetlands identified exclusively by WET_RADAR, while the red areas correspond to those discarded through radar image mapping. Finally, the field validation points are also displayed.
Dynamic analysis of the wetlands has determined that the month with the largest wetland area is April, with 27,041 ha (6.7%), while the month with the smallest area is October, with 23,906 ha (6.0%). This indicates a difference of 3135 ha, an area considered as temporary wetlands. Specifically, in April, the largest wetland area is recorded (27,041 ha). Despite the average precipitation regime decreasing by 17 mm, this phenomenon is presumed to occur because the months preceding April (October to April) register high precipitation values. In other words, the wetlands remain saturated, and despite the 17 mm decrease between March and April, the wetland area increases.
During the May–September period, the smallest wetland areas are recorded. Notably, in August, there is an increase in wetland area, even though average precipitation indices decrease. This phenomenon can be explained by the fact that July reports the highest precipitation in the Amazon basin, with 182 mm. Thus, despite the reduction in precipitation, the rainfall in the Amazon basin increases the wetland occupancy values. Table 8 and Figure 7 show the results of dynamic mapping.

Table 8.
Results of dynamic mapping of wetlands with WET_RADAR.
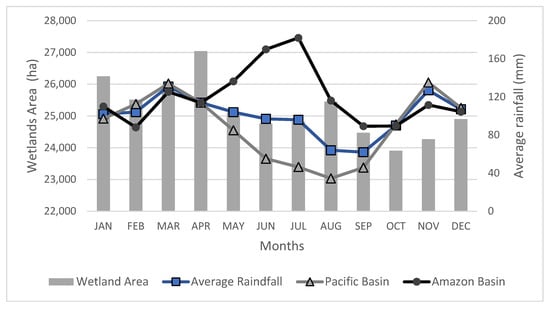
Figure 7.
Monthly dynamic analysis of wetlands and precipitation patterns: average values in blue, mean precipitation pattern for the pacific basin (green triangle), and amazon basin (black dots).
After the validated wetland areas were delineated, their slope distribution was analyzed. The slope histogram is shown in Figure 8. Based on radar-derived data, the maximum slope within the wetland areas was 19%, while the most frequent value (mode) corresponded to areas with a 3% slope. Notably, 95% of wetland observations were located in areas with slopes equal to or less than 9%. When comparing these results with those obtained from the multispectral-based mapping (Figure 3B), a significant improvement is evident: the slope threshold covering 95% of observations was reduced from 25% (multispectral) to 9% (radar). This substantial reduction highlights the enhanced precision of the radar-based wetland delineation, particularly in excluding overestimated areas in steeper terrain, and represents a meaningful advancement in high-altitude wetland mapping.
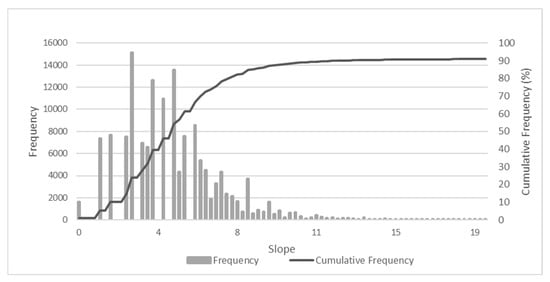
Figure 8.
Histogram of slopes in wetlands WET_RADAR. The slope that covers 95% of the observations is 9%.
The wetland mapping has shown that using only multispectral images can underestimate the extent and location of wetlands. In this regard, Slagter et al. (2020) identified that multispectral images have limitations for wetland mapping due to climatic conditions, natural light, and cloud cover, which hinder the detection of information beneath the vegetation canopy or clouds [23]. However, using only Sentinel-1 radar images may also result in relatively low classification accuracies, as some wetlands may experience sub-canopy flooding, presenting surface water (e.g., ponds). This condition alters the backscatter response, as several studies agree that stagnant water reduces the backscatter signal by providing a reflective surface [23,56].
In this study, radar and multispectral information were combined. Sentinel-1 data provided insights beneath the vegetation canopy, while Sentinel-2 data were used to describe vegetation (via NDVI) and water presence (via NDWI). It has been established that combining Sentinel-1 and Sentinel-2 leads to more accurate classifications compared to using these systems independently.
The Ecuadorian Ministry of the Environment, Water, and Ecological Transition (MAATE) estimates that wetlands represent approximately 1% of the national territory. However, recent mapping using multitemporal remote sensing techniques estimates this value to range between 5% and 18% [5,16]. Mapping conducted by FONAG in 2022 determined a wetland occupation percentage of 4.7%. The results of this study revealed a minimum occupation percentage of approximately 6% (24,262 ha) in October and November, with the maximum percentage of 6.7% (27,041 ha) occurring in April.
Regarding wetland location (topographic variables), the literature indicates that wetlands are typically found in areas where water accumulates, such as near foot slopes and toe slopes. This is because contiguous convex contours and steep slopes promote the accumulation of surface runoff, subsurface flow, and groundwater in the lower positions of slopes [49,50,51]. On the other hand, Zhou et al. (2022) applied a slope filter of up to 8% for soil moisture models [36]. According to FONAG’s 2022 multispectral classifications, wetlands are located in areas with slopes ranging from 0% to 73%, with 95% of observations falling within a 30% slope. The results of this study established that the slope with the highest data frequency is 2.56%, while the slope encompassing 95% of observations is 9.13%.
3.4. Wetlands Surface Soil Moisture (WET_SSM)
3.4.1. Principal Component Analysis (PCA)
The analysis of the relationship between Soil Surface Moisture (SSM) and backscatter was conducted preliminarily through a Principal Component Analysis (PCA) using the factorextra library in R Studio Version 2024.04.0+735. This tool enables the examination of multivariate datasets to identify structure and relationships. The analysis involved performing a PCA on the variables Surface Soil Moisture (SSM), VH and VV polarizations, and the incidence angle of Sentinel-1 images. The PCA analysis considers vectors where angles between vectors less than 90° indicate a high positive correlation, orthogonal angles (90°) indicate little to no correlation between variables, and angles of 180° represent negative correlations. Due to the data acquisition methodology, the dataset was divided into two groups first includes SSM measurements from meteorological stations M5028, M5029, M5031, M5074, and M5075, and the second comprises SSM data collected at eight points within the Jatunhuayco area, provided by [3,46].
The results show that, in the evaluated meteorological stations, the PCA revealed a weak correlation between radar variables and SSM (with an average R < 0.52). In contrast, the analysis conducted specifically for the Jatunhuayco area exhibited a markedly different behavior, even without prior normalization (Figure 9). In the Jatunhuayco area, the VV and VH vectors formed acute angles with the SSM vector, indicating a significant positive correlation, particularly with the VV polarization. This relationship was confirmed statistically by the results reported in Table 9, where the soil moisture estimation for Jatunhuayco reached a correlation coefficient of R = 0.79, with MAE = 1.39 and RMSE = 1.82—substantially better than the results from the meteorological stations, which showed errors exceeding 6.5 in MAE and 8.6 in RMSE.
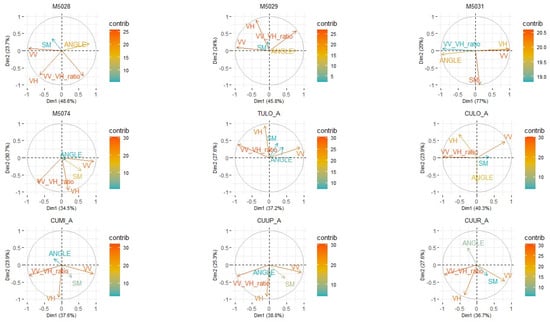
Figure 9.
Principal Component Analysis at meteorological stations and of the Jatunhuayco area. The results show very poor correlations between the stations and the VH and VV polarizations, while the data from the Jatunhuayco area show strong positive correlations.

Table 9.
SSM estimation results: Jatunhuayco stations and area.
This difference in data behavior can be partially explained by the heterogeneity of the data sources. Soil moisture data used for the meteorological stations were provided by FONAG, whereas the data corresponding to the Jatunhuayco area implemented a locally adapted methodology with higher spatial resolution and field validation. This disparity in data origin and quality can directly influence the variance explained by the PCA and the relationships among variables. Therefore, maintaining methodological consistency, specifically, applying PCA without normalization, for both the stations and the Jatunhuayco area was considered appropriate. Thus, the low variance explained by first component in the stations cannot be attributed solely to the lack of normalization, but rather to differences in resolution, accuracy, and methodology between both datasets. Consequently, the decision to forego normalization at this stage is justified, prioritizing direct physical interpretation and analytical consistency. As a future perspective, the application of controlled normalization and complementary testing under homogeneous conditions is proposed to assess its comparative effect.
Based on these preliminary results, a study area around the Jatunhuayco area has been delineated to map wetlands using SSM measurements.
3.4.2. Surface Soil Moisture (SSM) Estimates
As described in the methodological section, the estimation of surface soil moisture (SSM) considers the correlation between soil moisture (measured in situ) and the backscatter values (VH, VV) from Sentinel-1 through the application of the Water Cloud Model. The results obtained are presented in Table 9 and Figure 10.
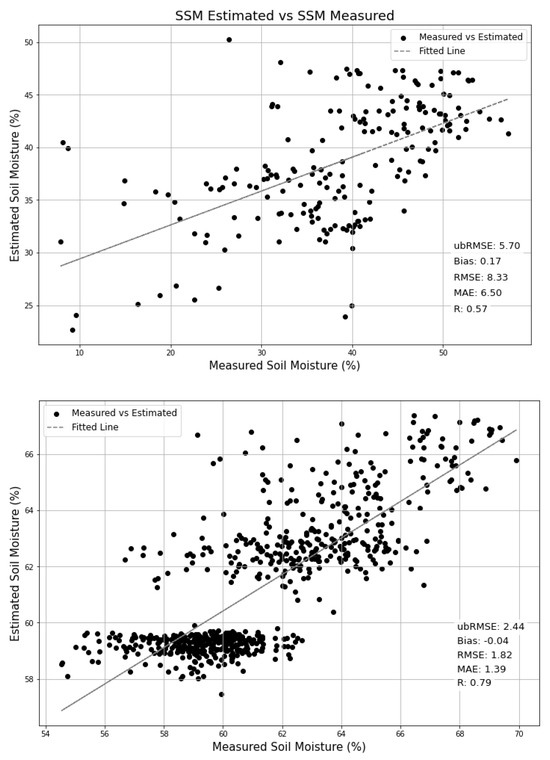
Figure 10.
SSM Estimation at station. The best correlation between SSM and VH and VV polarizations corresponds to the data from the Jatunhuycu area, with R = 0.79, MAE = 1.29, RMSE = 1.82, Bias = −0.04.
The estimates of surface soil moisture (SSM) at the stations, when considering independent databases (by stations), determined that correlations are stronger when using vertical polarization (VV), with station M5031 showing the best R value of 0.82. Considering the mean absolute error (MAE), it was determined that although VV polarization shows lower average errors, M5075 stands out as the most accurate station, with MAE = 2.85 for VH. The analysis of the Root Mean Square Error (RMSE) shows that M5075 has the lowest RMSE, indicating a more stable performance, while stations M5031 and M5028 show greater dispersions. Specifically, station M5031 (which showed the best R value) has an RMSE of 7.04 for VH and 5.82 for VV, affecting the reliability established with R = 0.82. The bias characterized through BIAS shows relatively low coefficients, with station M5028 standing out for its significant bias in both combinations. On the other hand, when considering the entire database from the stations, it has been determined that VH polarization shows better R values, reaching 0.57. However, the MAE and RMSE values are relatively high, with values >6.5 and >8.3, respectively.
The determination of correlation statistics in the Jatunhyaco area indicates that R = 0.79, suggesting a strong positive correlation between the estimates and in situ SSM measurements. MAE = 1.39 and RMSE = 1.82 values indicate that the estimates deviate from the actual value by an average of 1.39 to 1.82 units. Additionally, BIAS = −0.04 implies that the estimates are very slightly underestimated (−0.04 units) compared to the actual SSM values. Finally, the unbiased Root Mean Square Error (ubRMSE) equals 2.44, meaning that, excluding the bias, the average prediction error could be up to 2.44 units.
When comparing the results from the Jatunhuayco area with those from the meteorological stations, it is evident that the SSM estimates in Jatunhuayco exhibit superior performance. Below, a scatter plot is presented showing Observed SSM versus Estimated SSM based on the validation dataset of the Water Cloud Model (WCM), which includes 582 data points (Figure 11). It is important to note that, due to data availability, time series graphs were not generated. This is because the WCM calibration was performed using a general database that aggregates all SSM observations for the Jatunhuayco catchment. This approach was adopted after determining that using a unified dataset yielded the most accurate WCM calibration results.

Figure 11.
Observed SSM versus Estimated SSM based on the validation dataset of the Water Cloud Model (WCM).
Considering the results obtained with VV polarizations, the WCM adjustment constants are K1 = 1314.85, K2 = 2.11 × 10⁻¹, K3 = −8.34 × 10³, K4 = 2.10 × 10⁴, K5 = −2.37 × 10⁴, K6 = 1.01 × 10⁴, K7 = 4.02 × 100, K8 = −1.39 × 101, and K9 = 1.17 × 101. Based on the results obtained, it has been determined that the data located in the Jatunuhaycu area show a strong correlation for wetland mapping. Therefore, the following sections analyze the wetlands located in the Jatunuhaycu area.
3.4.3. WET_SSM
Once the WCM calibration constants were obtained, the surface soil moisture (SSM) was estimated on the GEE platform, resulting in an SSM map derived from Sentinel-1 VV polarizations. Figure 12 shows that the SSM values range from 58.39% to 1725%. It is important to note that concentrations exceeding 100% are considered oversaturated pixels, which lack a physical representation of moisture content. However, it can be observed that wetlands are adequately delineated within the SSM range of 78% to 221.79%. This indicates that wetland mapping is sensitive to SSM and could serve as a valuable delineation tool. For wetland mapping, pixels with an SSM greater than 78% are extracted.
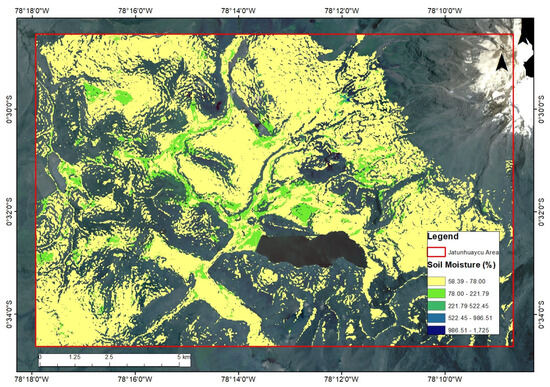
Figure 12.
Soil surface moisture with WCM. The SSM values range from 58.39% to 1725%. concentrations exceeding 100% are considered oversaturated pixels, which lack a physical representation of moisture content.
Upon conducting a visual inspection of the obtained results, it can be observed that the wetlands determined by SSM are nested within the wetlands identified by HUM_RADAR (Figure 13).
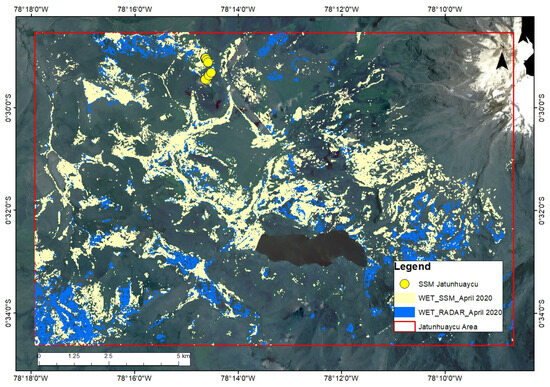
Figure 13.
Wetland mapping through SSM. SSM-determined wetlands are located within radar-determined wetlands, but nevertheless adequately represent the spatial arrangement.
Table 10 presents the area analysis of the wetlands identified by HUM_RADAR and HUM_SSM. The study area (Jatunhuayco) corresponds to 19,301 ha.

Table 10.
Dynamic analysis of wetlands through HUM_SSM.
On average, the area occupied by HUM_RADAR corresponds to 4289 ha, while HUM_SSM accounts for 3013 ha. Additionally, it has been established that the monthly behavior of HUM_SSM is relatively stable, as the difference between the months with the largest and smallest areas is 107 ha. In contrast, for HUM_RADAR, this value is 735 ha.
The results show that HUM_SSM outcomes are sensitive to the location of wetlands, as the wetlands identified by HUM_RADAR and HUM_SSM have been visually identified. However, the extent is underestimated by approximately 1276 ha. This suggests that the HUM_RADAR classification corresponds to areas with ideal characteristics to be wetlands (topographic and vegetative), whereas the SSM classification is based on indirect measurements of soil surface moisture (SSM).
4. Discussion
This study highlights the effectiveness of integrating multitemporal, multispectral, and radar satellite data for mapping and monitoring high-altitude wetlands in the northern Ecuadorian Andes. The implementation of a Random Forest classifier combining Sentinel-1, Sentinel-2, and topographic variables within the GEE platform enabled the identification of 20,001 ha of previously unmapped wetlands and the exclusion of 11,879 ha of misclassified areas. The use of multitemporal SAR data, with the ability to penetrate vegetation cover, enhanced the characterization of soil surface moisture (SSM) dynamics, ultimately improving wetland mapping accuracy [16]. These characteristics have also been reported in previous SAR-based studies focused on peatland mapping in flat terrains [16,18,55,60,61] which emphasize the complementary roles of multispectral data for vegetation characterization and SAR data for detecting saturated or inundated areas [23,55,62].
The confusion matrix analysis revealed some misclassification between wetlands and forests—an issue also documented in earlier studies, which attribute this to the limited ability of Sentinel-1 C-band sensors to distinguish between dense highland forests and vegetated wetlands [23,55].
The proposed methodology successfully captured temporal variability in wetland extent, driven by both monthly and annual hydrological fluctuations. While using only multispectral imagery underestimated wetland coverage (18,919 ha; 4.7% of the study area), the fusion of radar and multispectral data allowed for a more precise and dynamic assessment, identifying 2023 as the peak year in terms of wetland extent (28,972 ha; 7.2%), with April showing the highest monthly coverage (27,041 ha; 6.7%)—a result linked to cumulative rainfall in the preceding months. Additionally, 3152 ha were identified as seasonal wetlands that emerged during periods of high precipitation. These findings support the hypothesis that wetlands play a significant role in water regulation [6,11,63]. In this regard, studies conducted in southern Peru (Vilcanota-Urubamba) reported that seasonal wetland variability can reach up to 16.9% [11]; in the present study, this variability was estimated at 11.65% (3152 ha), highlighting differences in seasonal water storage. However, further research is needed to better understand the influence of local geology (e.g., layering of permeable and impermeable strata), glacial melt contributions, and other surface and subsurface water inputs on wetland dynamics.
Wetlands in this region are typically found in geomorphological settings such as floodplains, valley bottoms, and flat surfaces [49,50,51]. The present study confirms that most wetlands are located in areas with slopes ranging between 2.56% and 9.13%, which represents a significant improvement over previous reports such as FONAG (2022), which suggested wetland occurrence on slopes of up to 30%. Importantly, this improvement was achieved while still identifying 20,001 ha of new wetlands, despite applying a stricter slope constraint. Prior studies have shown that coastal wetlands often develop in areas with very low slopes (<1.5%), while high-altitude wetlands tend to occur on slopes below 4% [64].
Soil moisture estimates obtained using the Water Cloud Model (WCM) provided complementary evidence to support the analysis. Wetland extent based on SSM remained relatively stable throughout the year (ranging from 15.3% to 15.9%), which is relevant considering that the WCM has been traditionally used for estimating SSM and crop biomass [38,39,40,41,42,43,44,45]. Although few studies have directly applied the WCM for wetland mapping, the results of this research suggest that such an integration can serve as a useful tool. Nevertheless, significant limitations remain, particularly due to the lack of extensive field data needed for robust validation of model outputs.
Despite these contributions, several limitations must be acknowledged. First, field validation was based on 87 polygons, which, while spatially distributed, were constrained by access, terrain, and land ownership. Second, the absence of field data across all temporal scenes limited the capacity for validating monthly classifications. Third, the WCM assumes simplified scattering conditions that may not fully capture complex soil–vegetation interactions typical of high-altitude environments. Finally, reliance on freely available satellite imagery constrains spatial resolution, particularly in narrow or fragmented wetland areas.
Future research should focus on developing wetland classification schemes based on dominant vegetation cover. In the northern Andes of Ecuador, wetlands are typically dominated by cushion plants, grasses, or rushes [16], each of which influences key ecological processes, such as carbon sequestration, ecosystem productivity, nutrient cycling, and water regulation. Sentinel-1 has also shown promising capabilities for mapping vegetation types within wetlands [23], highlighting its potential for supporting such classification efforts.
5. Conclusions
This study demonstrates that integrating multitemporal Sentinel-1 and Sentinel-2 satellite imagery with Random Forest classification in Google Earth Engine enables accurate and dynamic mapping of high-altitude wetlands in the Northern Ecuadorian Andes. The approach allowed the identification of 20,001 ha of new wetlands and the exclusion of 11,879 ha of misclassified areas. The use of radar data enhanced detection in saturated and vegetated zones, improving spatial accuracy and seasonal analysis.
The results showed that wetland extent is influenced by cumulative rainfall, with April being the month of highest coverage (6.7%). Additionally, 3152 ha were identified as temporary wetlands, confirming seasonal hydrological variability. The Water Cloud Model (WCM) provided stable SSM estimates throughout the year, supporting the integration of radar-based soil moisture into wetland monitoring workflows.
The findings highlight the potential of combining radar, multispectral, and topographic data for scalable, high-resolution wetland mapping in cloud-prone, mountainous regions. This methodology contributes valuable tools for wetland conservation planning and supports better understanding of hydrological regulation in paramo ecosystems.
Author Contributions
Conceptualization, L.B. and F.F.; methodology, L.H.; software, L.H. and R.G.; validation, B.L. and P.F.; formal analysis, L.B. and F.F.; investigation, L.H.; writing—original draft preparation, L.H. and L.B. and F.F.; writing—review and editing, X.Z.-R. and S.P.-B. All authors have read and agreed to the published version of the manuscript.
Funding
This research was funded by CNES TOSCA grant number WHYGHGS (SWOT Science team).
Data Availability Statement
Data will be made available on request.
Acknowledgments
We express our gratitude to the Estación Científica Agua—Páramo (ECAP) for the FONAG-AB-001-2024 agreement, which provided the logistical support necessary for the development of this research. We gratefully acknowledge the contribution of soil moisture data from the Jatunhuyaco watershed, provided by the project “Linking Global Change with Soil and Water Conservation in the High Andes” (ParamoSus). This project was funded by the Belgian Development Cooperation Program and ARES-CCD, and implemented through a collaboration between the Université Catholique de Louvain, Escuela Politécnica Nacional, Universidad de Cuenca, Fondo para la Protección del Agua (FONAG), and Empresa Pública Municipal de Agua Potable y Saneamiento de Quito (EPMAPS).
Conflicts of Interest
The authors declare no conflict of interest.
Abbreviations
| SSM | Superficial Soil Moisture |
| WCM | Water Cloud Model |
| GEE | Google Earth Engine |
| HUM_OPT | Wetlands identified using multispectral information |
| HUM_RADAR | Wetlands identified using radar information |
| HUM_SSM | Wetlands identified using superficial soil moisture |
| NDVI | Normalized Difference Vegetation Index |
| NDWI | Normalized Difference Water Index |
| SAR | Synthetic Aperture Radar |
| VV | Vertical Transmit, Vertical Receive (Vertical–Vertical Polarization) |
| VH | Vertical Transmit, Horizontal Receive (Vertical–Horizontal Polarization) |
| MNT | Digital Elevation Model |
| EPMAPS | Metropolitan Public Water and Sanitation Company |
| FONAG | Water Protection Fund |
| MAATE | Ministry of the Environment, Water, and Ecological Transition (Ecuador) |
| MDT | Digital Terrain Model |
| RF | Random Forest |
| TWI | Topographic Wetness Index |
Appendix A

Table A1.
Appendix A shows bands used in multispectral classification (WET_MLTSP).
Table A1.
Appendix A shows bands used in multispectral classification (WET_MLTSP).
| Bands | Identified Entities | Observation |
|---|---|---|
| 4,2,3 | Grasslands, Crops, Infrastructure, Other Lands (Bare Soil) | Differentiation of grasslands and shrubs |
| 3,2,1 | Evergreen Forest, Evergreen Shrubs | Differentiation of forests, height, and shadows that may generate noise |
| 1,2,4 | Snow, Lahars, Sand Fields, Infrastructure, Urban Centers, Herbaceous Wetlands | Identification of various herbaceous wetland or ultra-humid páramo types |
| 1,2,4 B: −20% C: +20% | Shrub Vegetation | Delimitation of shrub vegetation in steep areas of the urban zone |
| 1,2,4 B: −20% C: +20% | Infrastructure | Greenhouses for flowers, Poultry farms |
| 421 B: −32% C: +48% | Semi-dry Forest and Shrubland | Differentiation of dry vegetation and introduced crops |
| 1,3,2 B: −12% C: +50% | Other Lands | Areas in the process of erosion |
| 421 B: −32% C: +48% | Pastures | Differentiation of grazing areas within forests |
| 132 B: −10% C: +50% | Forest Crops | Delimitation of Forest and Sugarcane Crops |
| 421 B: −32% C: +48% | Forest Plantations | Dark brown tones and the geometric form of plantations |
Notes: B: Brightness, C: Contrast.
Appendix B

Table A2.
Appendix B shows the description of the ecosystems considered for the training points of the Random Forest in WET RADAR. A total of 58 points are considered in Forests, 102 in Humid Grassland/Ultra-humid Grass land, 231 in Páramo Grassland, and 156 in Floodable Páramo Grassland (wetlands).
| Ecosystem | Description | Photographic Record |
|---|---|---|
| Forest (58 points) | Evergreen forests distributed between 3200 and 4100 m.a.s.l., with trees ranging from 5 to 8 m in height, featuring twisted and branched trunks covered in bryophytes, lichens, and epiphytes. This ecosystem forms patches in the páramo, located in areas with low wind exposure and steep slopes. It consists of a few tree species from genera such as Polylepis, Buddleja, or Gynoxys. Shrubs and herbs form compact structures. | 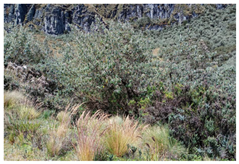 |
| Humid Grassland/Ultra-humid Grassland (102 points) | Grasslands scattered in the highest areas of the Andes, above 4200 m.a.s.l. Grasses, prostrate plants, cushion plants, and small, scattered shrubs are common. The landscape shows areas of bare soil. Bryophytes are almost absent in this ecosystem | 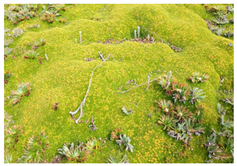 |
| Ultra-humid páramos are located between 4400 and 4900 m.a.s.l. on steep and rugged slopes covered by glacial deposits and geliturbated soils. These are characterized by a significant presence of bryophytes and a high diversity of species with restricted distributions. The most represented families are Asteraceae and Poaceae. | 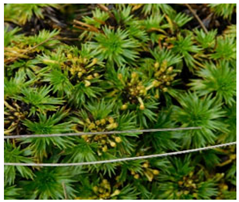 | |
| Páramo Grassland (231 points) | Dense grasslands dominated by grasses, located between 3400 and 4300 m.a.s.l., reaching up to 1 m in height. The dominant genera are Calamagrostis, Agrostis, Festuca, and Stipa. In areas with human intervention, such as burning or grazing, grasslands are shorter, and creeping species are scarce. | 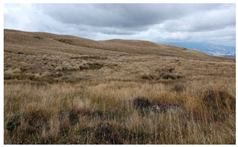 |
| Floodable Páramo Grassland (156 points) | Floodable grasslands with the presence of cushion plants, associated with water bodies and flood-prone areas, found between 3300 and 4500 m.a.s.l. Two types can be distinguished: peat bogs and marshes. Areas dominated by Sphagnum magellanica are common. | 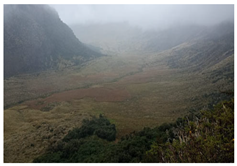 |
References
- Mosquera, G.M.; Hofstede, R.; Bremer, L.L.; Asbjornsen, H.; Carabajo-Hidalgo, A.; Célleri, R.; Crespo, P.; Esquivel-Hernández, G.; Feyen, J.; Manosalvas, R.; et al. Frontiers in páramo water resources research: A multidisciplinary assessment. Sci. Total Environ. 2023, 892, 164373. [Google Scholar] [CrossRef] [PubMed]
- Lazo, P.X.; Mosquera, G.M.; McDonnell, J.J.; Crespo, P. The role of vegetation, soils, and precipitation on water storage and hydrological services in Andean Páramo catchments. J. Hydrol. 2019, 572, 805–819. [Google Scholar] [CrossRef]
- Páez-Bimos, S.; Villacís, M.; Morales, O.; Calispa, M.; Molina, A.; Salgado, S.; de Bievre, B.; Delmelle, P.; Muñoz, T.; Vanacker, V. Vegetation effects on soil pore structure and hydraulic properties in volcanic ash soils of the high Andes. Hydrol. Process. 2022, 36, e14678. [Google Scholar] [CrossRef]
- Fallis, A. Flora del Páramo del Cajas; Don Bosco Printing Press: Makati City, Philippines, 2013; Volume 53, No. 9; Available online: http://dspace.uazuay.edu.ec/handle/datos/8786 (accessed on 3 May 2024).
- Hofstede, R. Los Páramos del Ecuador: Pasado, Presente y Futuro; USFQ Press: Quito, Ecuador, 2023. [Google Scholar] [CrossRef]
- McNamara, J.P.; Tetzlaff, D.; Bishop, K.; Soulsby, C.; Seyfried, M.; Peters, N.E.; Aulenbach, B.T.; Hooper, R. Storage as a Metric of Catchment Comparison. Hydrol. Process. 2011, 25, 3364–3371. [Google Scholar] [CrossRef]
- EPMAPS. Memoria de Sostenibilidad; EPMAPS: Quito, Ecuador, 2020.
- Brück, S.A.; Torres, B.D.M.; de Lourdes Teixeira de Moraes Polizeli, M. The Ecuadorian paramo in danger: What we know and what might be learned from northern wetlands. Glob. Ecol. Conserv. 2023, 47, e02639. [Google Scholar] [CrossRef]
- Mosquera, G.M.; Marín, F.; Stern, M.; Bonnesoeur, V.; Ochoa-Tocachi, B.F.; Román-Dañobeytia, F.; Crespo, P. Progress in understanding the hydrology of high-elevation Andean grasslands under changing land use. Sci. Total Environ. 2022, 804, 150112. [Google Scholar] [CrossRef]
- Berrones, G.; Crespo, P.; Ochoa-Sánchez, A.; Wilcox, B.P.; Célleri, R. Importance of Fog and Cloud Water Contributions to Soil Moisture in the Andean Páramo. Hydrology 2022, 9, 54. [Google Scholar] [CrossRef]
- Ross, A.C.; Mendoza, M.M.; Drenkhan, F.; Montoya, N.; Baiker, J.R.; Mackay, J.D.; Hannah, D.M.; Buytaert, W. Seasonal water storage and release dynamics of bofedal wetlands in the Central Andes. Hydrol. Process. 2023, 37, e14940. [Google Scholar] [CrossRef]
- Asmuß, T.; Bechtold, M.; Tiemeyer, B. On the Potential of Sentinel-1 for High Resolution Monitoring of Water Table Dynamics in Grasslands on Organic Soils. Remote Sens. 2019, 11, 1659. [Google Scholar] [CrossRef]
- MAE. Sistemas Ecológicos y Caracterización Florística de Los Páramos en el Ecuador; MAE: Quito, Ecuador, 2011. [Google Scholar]
- Bott, R. Sistema de clasificación de los ecosistemas de Ecuador Co. Igarss 2014, 2014, 143–145. [Google Scholar]
- FONAG. Pugllohuma Fuente de Agua para Quito; FONAG: Quito, Ecuador, 2022. [Google Scholar]
- Hribljan, J.A.; Suarez, E.; Bourgeau-Chavez, L.; Endres, S.; Lilleskov, E.A.; Chimbolema, S.; Wayson, C.; Serocki, E.; Chimner, R.A. Multidate, multisensor remote sensing reveals high density of carbon-rich mountain peatlands in the páramo of Ecuador. Glob. Change Biol. 2017, 23, 5412–5425. [Google Scholar] [CrossRef] [PubMed]
- Valencia, E.; Changoluisa, I.; Palma, K.; Cruz, P.; Valencia, D.; Ayala, P.; Hidalgo, V.; Quisi, D.; Jara, N.; Puga, D. Wetland monitoring technification for the Ecuadorian Andean region based on a multi-agent framework. Heliyon 2022, 8, e09054. [Google Scholar] [CrossRef] [PubMed]
- Bourgeau-Chavez, L.L.; Endres, S.; Powell, R.; Battaglia, M.J.; Benscoter, B.; Turetsky, M.; Kasischke, E.S.; Banda, E. Mapping boreal peatland ecosystem types from multitemporal radar and optical satellite imagery. Can. J. For. Res. 2017, 47, 545–559. [Google Scholar] [CrossRef]
- Rodriguez-Galiano, V.F.; Chica-Olmo, M.; Abarca-Hernandez, F.; Atkinson, P.M.; Jeganathan, C. Random Forest classification of Mediterranean land cover using multi-seasonal imagery and multi-seasonal texture. Remote Sens. Environ. 2012, 121, 93–107. [Google Scholar] [CrossRef]
- Torres, R.; Snoeij, P.; Geudtner, D.; Bibby, D.; Davidson, M.; Attema, E.; Potin, P.; Rommen, B.; Floury, N.; Brown, M.; et al. GMES Sentinel-1 mission. Remote Sens. Environ. 2012, 120, 9–24. [Google Scholar] [CrossRef]
- Ygorra, B.; Frappart, F.; Wigneron, J.P.; Moisy, C.; Catry, T.; Baup, F.; Hamunyela, E.; Riazanoff, S. Monitoring loss of tropical forest cover from Sentinel-1 time-series: A CuSum-based approach. Int. J. Appl. Earth Obs. Geoinf. 2021, 103, 102532. [Google Scholar] [CrossRef]
- Wang, L.; Gao, Y. Soil Moisture Retrieval from Sentinel-1 and Sentinel-2 Data Using Ensemble Learning over Vegetated Fields. IEEE J. Sel. Top. Appl. Earth Obs. Remote Sens. 2023, 16, 1802–1814. [Google Scholar] [CrossRef]
- Slagter, B.; Tsendbazar, N.-E.; Vollrath, A.; Reiche, J. Mapping wetland characteristics using temporally dense Sentinel-1 and Sentinel-2 data: A case study in the St. Lucia wetlands, South Africa. Int. J. Appl. Earth Obs. Geoinf. 2020, 86, 102009. [Google Scholar] [CrossRef]
- García, E.; Lleellish, M.A. Cartografiado de bofedales usando imágenes de satellite Landsat en una cuenca altoandina del Perú. Rev. Teledeteccion 2012, 38, 92–108. [Google Scholar]
- Chimner, R.A.; Bourgeau-Chavez, L.; Grelik, S.; Hribljan, J.A.; Clarke, A.M.P.; Polk, M.H.; Lilleskov, E.A.; Fuentealba, B. Mapping Mountain Peatlands and Wet Meadows Using Multi-Date, Multi-Sensor Remote Sensing in the Cordillera Blanca, Peru. Wetlands 2019, 39, 1057–1067. [Google Scholar] [CrossRef]
- White, L.; Brisco, B.; Dabboor, M.; Schmitt, A.; Pratt, A. A Collection of SAR Methodologies for Monitoring Wetlands. Remote Sens. 2015, 7, 7615–7645. [Google Scholar] [CrossRef]
- Araya-López, R.A.; Lopatin, J.; Fassnacht, F.E.; Hernández, H.J. Monitoring Andean high altitude wetlands in central Chile with seasonal optical data: A comparison between Worldview-2 and Sentinel-2 imagery. ISPRS J. Photogramm. Remote Sens. 2018, 145, 213–224. [Google Scholar] [CrossRef]
- Aaron, E.; Maxwell, T.A.W.; Fang, F. Implementation of machine-learning classification in remote sensing: An applied review. Int. J. Remote Sens. 2018, 39, 2784–2817. [Google Scholar] [CrossRef]
- García Lino, M.C.; Pfanzelt, S.; Domic, A.I.; Hensen, I.; Schittek, K.; Meneses, R.I.; Bader, M.Y. Carbon dynamics in high-Andean tropical cushion peatlands: A review of geographic patterns and potential drivers. Ecol. Monogr. 2024, 94, e1614. [Google Scholar] [CrossRef]
- Dobson, M.C.; Ulaby, F. Microwave Backscatter Dependence on Surface Roughness, Soil Moisture, and Soil Texture: Part III—Soil Tension. IEEE Trans. Geosci. Remote Sens. 1981, GE-19, 51–61. [Google Scholar] [CrossRef]
- Barrett, B.W.; Dwyer, E.; Whelan, P. Remote Sensing Soil Moisture Retrieval from Active Spaceborne Microwave Observations: An Evaluation of Current Techniques. Remote Sens 2009, 1, 210–242. [Google Scholar] [CrossRef]
- Ulaby, F.; Allen, C.T.; Fung, A.K. Method for Retrieving the True Backscattering Coefficient From Measurements With a Real Antenna. Dig.-Int. Geosci. Remote Sens. Symp. 1982, 2, 308–313. [Google Scholar] [CrossRef]
- Dabrowska-Zielinska, K.; Inoue, Y.; Kowalik, W.; Gruszczynska, M. Inferring the effect of plant and soil variables on C- and L-band SAR backscatter over agricultural fields, based on model analysis. Adv. Space Res. 2007, 39, 139–148. [Google Scholar] [CrossRef]
- Frappart, F.; Wigneron, J.-P.; Li, X.; Liu, X.; Al-Yaari, A.; Fan, L.; Wang, M.; Moisy, C.; Le Masson, E.; Aoulad Lafkih, Z.; et al. Global Monitoring of the Vegetation Dynamics from the Vegetation Optical Depth (VOD): A Review. Remote Sens. 2020, 12, 2915. [Google Scholar] [CrossRef]
- El Hajj, M.; Baghdadi, N.; Wigneron, J.-P.; Zribi, M.; Albergel, C.; Calvet, J.-C.; Fayad, I. First Vegetation Optical Depth Mapping from Sentinel-1 C-band SAR Data over Crop Fields. Remote Sens. 2019, 11, 2769. [Google Scholar] [CrossRef]
- Zhou, Z.; Fan, L.; De Lannoy, G.; Liu, X.; Peng, J.; Bai, X.; Frappart, F.; Baghdadi, N.; Xing, Z.; Li, X.; et al. Retrieval of High-Resolution Vegetation Optical Depth from Sentinel-1 Data over a Grassland Region in the Heihe River Basin. Remote Sens. 2022, 14, 5468. [Google Scholar] [CrossRef]
- Li, Y.; Zhang, F. Surface Soil Moisture Retrieval Using the Improved Water-Cloud Model Based on Sentinel-1A and Sentinel-2 Data. In Environmental Governance, Ecological Remediation and Sustainable Development; Han, D., Bashir, M.J.K., Eds.; Springer Natur: Cham, Switzerland, 2024; pp. 283–294. [Google Scholar]
- Cui, J.; Wang, Y.; Wu, Y.; Li, Z.; Li, H.; Miao, B.; Wang, Y.; Jia, C.; Liang, C. Soil Moisture Inversion in Grassland Ecosystem Using Remote Sensing Considering Different Grazing Intensities and Growing Seasons. Sustainability 2023, 15, 6515. [Google Scholar] [CrossRef]
- Hosseini, M.; McNairn, H. Using multi-polarization C- and L-band synthetic aperture radar to estimate biomass and soil moisture of wheat fields. Int. J. Appl. Earth Obs. Geoinf. 2017, 58, 50–64. [Google Scholar] [CrossRef]
- Kanmani, K.; Vasanthi, P.; Pari, P.; Ahamed, N.S.S. Estimation of Soil Moisture for Different Crops Using SAR Polarimetric Data. Civ. Eng. J. 2023, 9, 1402–1411. [Google Scholar] [CrossRef]
- Luo, D.; Wen, X.; Li, S. An improved method for estimating soil moisture over cropland using SAR and optical data. Earth Sci. Inform. 2023, 16, 1909–1916. [Google Scholar] [CrossRef]
- Moreau, S.; Le Toan, T. Biomass quantification of Andean wetland forages using ERS satellite SAR data for optimizing livestock management. Remote Sens. Environ. 2003, 84, 477–492. [Google Scholar] [CrossRef]
- Muhuri, A.; Goïta, K.; Magagi, R.; Wang, H. Soil Moisture Retrieval During Crop Growth Cycle Using Satellite SAR Time-Series. IEEE J. Sel. Top. Appl. Earth Obs. Remote Sens. 2023, 16, 9302–9319. [Google Scholar] [CrossRef]
- Paloscia, S.; Pettinato, S.; Santi, E.; Notarnicola, C.; Pasolli, L.; Reppucci, A. Soil moisture mapping using Sentinel-1 images: Algorithm and preliminary validation. Remote Sens. Environ. 2013, 134, 234–248. [Google Scholar] [CrossRef]
- Srivastava, H.S.; Sivasankar, T.; Gavali, M.D.; Patel, P. Soil moisture estimation underneath crop cover using high incidence angle C-band Sentinel-1 SAR data. Kuwait J. Sci. 2024, 51, 100101. [Google Scholar] [CrossRef]
- Páez-Bimos, S.; Molina, A.; Calispa, M.; Delmelle, P.; Lahuatte, B.; Villacís, M.; Muñoz, T.; Vanacker, V. Soil–vegetation–water interactions controlling solute flow and chemical weathering in volcanic ash soils of the high Andes. Hydrol. Earth Syst. Sci. 2023, 27, 1507–1529. [Google Scholar] [CrossRef]
- Wen, L.; Mason, T.; Powell, M.; Ling, J.; Ryan, S.; Bernich, A.; Gufu, G. Improved Wetland Mapping of a Highly Fragmented Agricultural Landscape Using Land Surface Phenological Features. Remote Sens. 2024, 16, 1786. [Google Scholar] [CrossRef]
- Pasquarella, V.J.; Brown, C.F.; Czerwinski, W.; Rucklidge, W.J. Comprehensive quality assessment of optical satellite imagery using weakly supervised video learning. In Proceedings of the 2023 IEEE/CVF Conference on Computer Vision and Pattern Recognition Workshops (CVPRW), Vancouver, BC, Canada, 17–24 June 2023; Volume 2023-June, pp. 2125–2135. [Google Scholar] [CrossRef]
- Jackson, C.R.; Thompson, J.A.; Kolka, R.K. Wetland Soils, Hydrology, and Geomorphology. In Ecology of Freshwater and Estuarine Wetlands; University of California Press: Berkeley, CA, USA, 2015; pp. 2–7. [Google Scholar]
- Richter, J.L.; Burras, C.L. Chapter 11—Human-Impacted Catenas in North-Central Iowa, United States: Ramifications for Soil Mapping. In Soil Mapping and Process Modeling for Sustainable Land Use Management; Pereira, P., Brevik, E.C., Muñoz-Rojas, M., Miller, B.A., Eds.; Elsevier: Amsterdam, The Netherlands, 2017; pp. 335–363. [Google Scholar] [CrossRef]
- Stei, E.D.; Mattson, M.; Fetscher, A.E.; Halama, K.J. Influence of geologic setting on slope wetland hydrodynamics. Wetlands 2004, 24, 244–260. [Google Scholar] [CrossRef]
- Hjerdt, K.N.; McDonnell, J.J.; Seibert, J.; Rodhe, A. A new topographic index to quantify downslope controls on local drainage. Water Resour. Res. 2004, 40, W05602. [Google Scholar] [CrossRef]
- Gao, B. NDWI—A normalized difference water index for remote sensing of vegetation liquid water from space. Remote Sens. Environ. 1996, 58, 257–266. [Google Scholar] [CrossRef]
- Tucker, C.J. Red and photographic infrared linear combinations for monitoring vegetation. Remote Sens. Environ. 1979, 8, 127–150. [Google Scholar] [CrossRef]
- Mahdianpari, M.; Salehi, B.; Mohammadimanesh, F.; Homayouni, S.; Gill, E. The First Wetland Inventory Map of Newfoundland at a Spatial Resolution of 10 m Using Sentinel-1 and Sentinel-2 Data on the Google Earth Engine Cloud Computing Platform. Remote Sens. 2019, 11, 43. [Google Scholar] [CrossRef]
- Lees, K.J.; Artz, R.R.E.; Chandler, D.; Aspinall, T.; Boulton, C.A.; Buxton, J.; Cowie, N.R.; Lenton, T.M. Using remote sensing to assess peatland resilience by estimating soil surface moisture and drought recovery. Sci. Total Environ. 2021, 761, 143312. [Google Scholar] [CrossRef]
- Liu, Z.; Li, P.; Yang, J. Soil Moisture Retrieval and Spatiotemporal Pattern Analysis Using Sentinel-1 Data of Dahra, Senegal. Remote Sens. 2017, 9, 1197. [Google Scholar] [CrossRef]
- Bao, Y.; Lin, L.; Wu, S.; Kwal Deng, K.A.; Petropoulos, G.P. Surface soil moisture retrievals over partially vegetated areas from the synergy of Sentinel-1 and Landsat 8 data using a modified water-cloud model. Int. J. Appl. Earth Obs. Geoinf. 2018, 72, 76–85. [Google Scholar] [CrossRef]
- Liu, Q.; Wu, Z.; Cui, N.; Jin, X.; Zhu, S.; Jiang, S.; Zhao, L.; Gong, D. Estimation of Soil Moisture Using Multi-Source Remote Sensing and Machine Learning Algorithms in Farming Land of Northern China. Remote Sens. 2023, 15, 4214. [Google Scholar] [CrossRef]
- Grenier, M.; Demers, A.-M.; Labrecque, S.; Benoit, M.; Fournier, R.A.; Drolet, B. An object-based method to map wetland using RADARSAT-1 and Landsat ETM images: Test case on two sites in Quebec, Canada. Can. J. Remote Sens. 2007, 33, S28–S45. [Google Scholar] [CrossRef]
- Touzi, R.; Deschamps, A.; Rother, G. Wetland characterization using polarimetric RADARSAT-2 capability. Can. J. Remote Sens. 2007, 33, S56–S67. [Google Scholar] [CrossRef]
- Li, J.; Chen, W. A rule-based method for mapping Canada’s wetlands using optical, radar and DEM data. Int. J. Remote Sens. 2005, 26, 5051–5069. [Google Scholar] [CrossRef]
- Buytaert, W.; Beven, K. Models as multiple working hypotheses: Hydrological simulation of tropical alpine wetlands. Hydrol. Process. 2011, 25, 1784–1799. [Google Scholar] [CrossRef]
- Salinas, J.B.G.; Eggerth, M.K.P.; Miller, M.E.; Meza, R.R.B.; Chacaltana, J.T.A.; Acuña, J.R.; Barroso, G.F. Wetland Mapping with Multitemporal Sentinel Radar Remote Sensing in the Southeast Region of Brazil. Int. Arch. Photogramm. Remote Sens. Spat. Inf. Sci. 2020, XLII-3/W12-2020, 237–242. [Google Scholar] [CrossRef]
Disclaimer/Publisher’s Note: The statements, opinions and data contained in all publications are solely those of the individual author(s) and contributor(s) and not of MDPI and/or the editor(s). MDPI and/or the editor(s) disclaim responsibility for any injury to people or property resulting from any ideas, methods, instructions or products referred to in the content. |
© 2025 by the authors. Licensee MDPI, Basel, Switzerland. This article is an open access article distributed under the terms and conditions of the Creative Commons Attribution (CC BY) license (https://creativecommons.org/licenses/by/4.0/).