Article

How Will the Heavy Metal Risk Change Under Continuous Changing Hydrological Regimes and Salinity?

1
School of Hydraulic and Civil Engineering, Ludong University, Yantai 264025, China
2
Key Laboratory of Ecological Restoration and Conservation of Coastal Wetlands in Universities of Shandong, The Institute for Advanced Study of Coastal Ecology, Ludong University, Yantai 264025, China
3
School of Ecology, Resources and Environment, Dezhou University, Dezhou 253023, China
4
College of Ecology and Environment, Southwest Forestry University, Kunming 650224, China
*
Authors to whom correspondence should be addressed.
Water 2025, 17(7), 1038; https://doi.org/10.3390/w17071038
Submission received: 31 January 2025 / Revised: 26 March 2025 / Accepted: 27 March 2025 / Published: 31 March 2025

Abstract

:
The concentration and speciation of heavy metals in the intertidal zone play an irreplaceable role in protecting biodiversity. However, it could be changed by the constantly changing hydrological regimes and salinity. To identify the change and mechanisms of these phenomena, an incubation experiment was conducted under three hydrological regimes (no flooding, periodic flooding, and long-term flooding) and five salinities (0‰, 5‰, 10‰, 20‰, and 30‰). The concentration and speciation of Cd, Cr, Cu, Pb, and Zn in sediment cores collected at the first, third, fifth, seventh, and ninth week were detected. The results indicated that as the incubation time increased, the concentrations of Cr, Cu, and Pb decreased while the concentrations of Cd and Zn increased. The primary speciation for Cd was acid-soluble fraction, whereas the residual fraction was the dominant form for Cr, Cu, Pb, and Zn. The acid-soluble fraction of Cd was lowest in freshwater conditions. The oxidizable fraction of Cd generally increased under long-term flooding and was higher than that under no-flooding or periodic-flooding conditions. The speciation of Cr under freshwater and 5‰ salinity conditions was similar but distinctly different from that under other salinity levels. Cu was easily combined with organic matter, and the oxidizable fraction of Cu was the predominant form, aside from the residual fraction. The residual fraction of Pb observably increased in the ninth week. The general linear model revealed that hydrological regimes, salt conditions, and incubation time had an obvious influence on metal speciation. Throughout the incubation experiment, Cd posed a higher risk (ranging from 21.91% to 71.91%) and should be closely monitored. The risks associated with Cr and Zn also increased during the incubation period.

1. Introduction

The intertidal zone, a dynamic intersection zone between the ocean and land, exhibits heightened susceptibility to various pollutants [1,2]. With the rapid development of industry, agricultural reclamation, hydraulic engineering construction, fishery resources, and so on, increasing number of pollutants enter and accumulate in the intertidal zone [3,4,5,6,7]. Heavy metals, with the character of toxicity, persistence, bioaccumulation, and non-degradability, have been documented at concentrations exceeding regional background levels in global intertidal sediments [8,9,10,11]. Moreover, heavy metals could accumulate and amplify through the food chain and influence ecology directly.
Normally, the risk caused by metals is not only related to the total metal concentration, but more depending on their fraction in the soil, especially the bioavailable fractions [12]. In recent years, the European Community Bureau of Reference has developed a three-step sequential extraction procedure, and modified methods were developed based on it [13]. Four metal speciation, including acid-soluble fraction, reducible fraction, oxidizable fraction, and residual fraction, were extracted through these methods. Acid-soluble fraction is bioavailable and poses serious environmental risks [14,15]. Residual fraction is considered as stable phases and has lower risks to ecology. In the intertidal zone, a myriad of environmental factors, including hydrological regimes, salinity, emission sources, redox potential, etc., could affect the heavy metal speciation in sediment [13,16].
Due to the intensified tidal influence, hydrological regimes and salinity dynamics in the intertidal zone exhibit frequent fluctuations, characterized by periodic flooding-exposure cycles and salinization-leaching processes [17,18]. Under climate change, seawater intrusion exacerbates low-tide flooding and amplifies high-tide intensity [19,20]. Additional factors—including storm surges, droughts, floods, regulation of water and sediment discharge from the Yellow River, and dam construction—further alter intertidal hydrological conditions and salinity patterns [21].
The fluctuating hydrological regimes and salinity deeply affect the physicochemical properties of sediment in the intertidal zone. For example, flooding could decrease the redox potential (Eh), which is closely related to metal speciation [22,23]. Low Eh could lead to reductive dissolution of heavy metals bound to Fe/Mn oxides [24]. Organic matter decomposition rates are suppressed under prolonged flooding, weakening the stabilization of organo-metal complexes. In the Yangtze River estuary’s intertidal sediments, reducible fraction of Cr, Cu, Zn, and Pb decreased, and the acid-soluble fraction increased under flooding [23]. In addition, the time of flooding and exposure obviously affected the metal speciation. The short-time flooding increased the mobility of metal, whereas long-time flooding could lead to metal redeposition in the form of sulfide [25]. The salinity decided the number of cations, such as sodium and potassium, and influenced the competition between these cations and metal ions. Then, the metal speciation, decided mobility, and bioavailability of metal changed accordingly [19]. The ecological risk derived from metals to ocean, land, and human beings will change dramatically with wildly fluctuating hydrological regimes and salinity in the intertidal zone [15,26]. However, little attention has been given to the behavior of heavy metal total concentration and speciation in tidal flat sediments under continuous influence of water and salinity.
In this study, the sediment from the tidal flat of Yellow River Delta National Nature Reserve was selected as samples, and incubation experiments in the laboratory under three hydrological regimes, five salinity, and five incubation times were conducted. The tidal flat of Yellow River Delta provides habitat, reproduction, and migration for wildlife and plays a very important role in ecology. The aim of this study was (1) to identify how total metal concentration changes under different hydrological regimes, salinity, and time; (2) to clarify the influence of hydrological regimes, salinity, and time on metal speciation; and (3) to estimate the risk caused by metal after change of hydrological regimes and salinity.

2. Materials and Methods
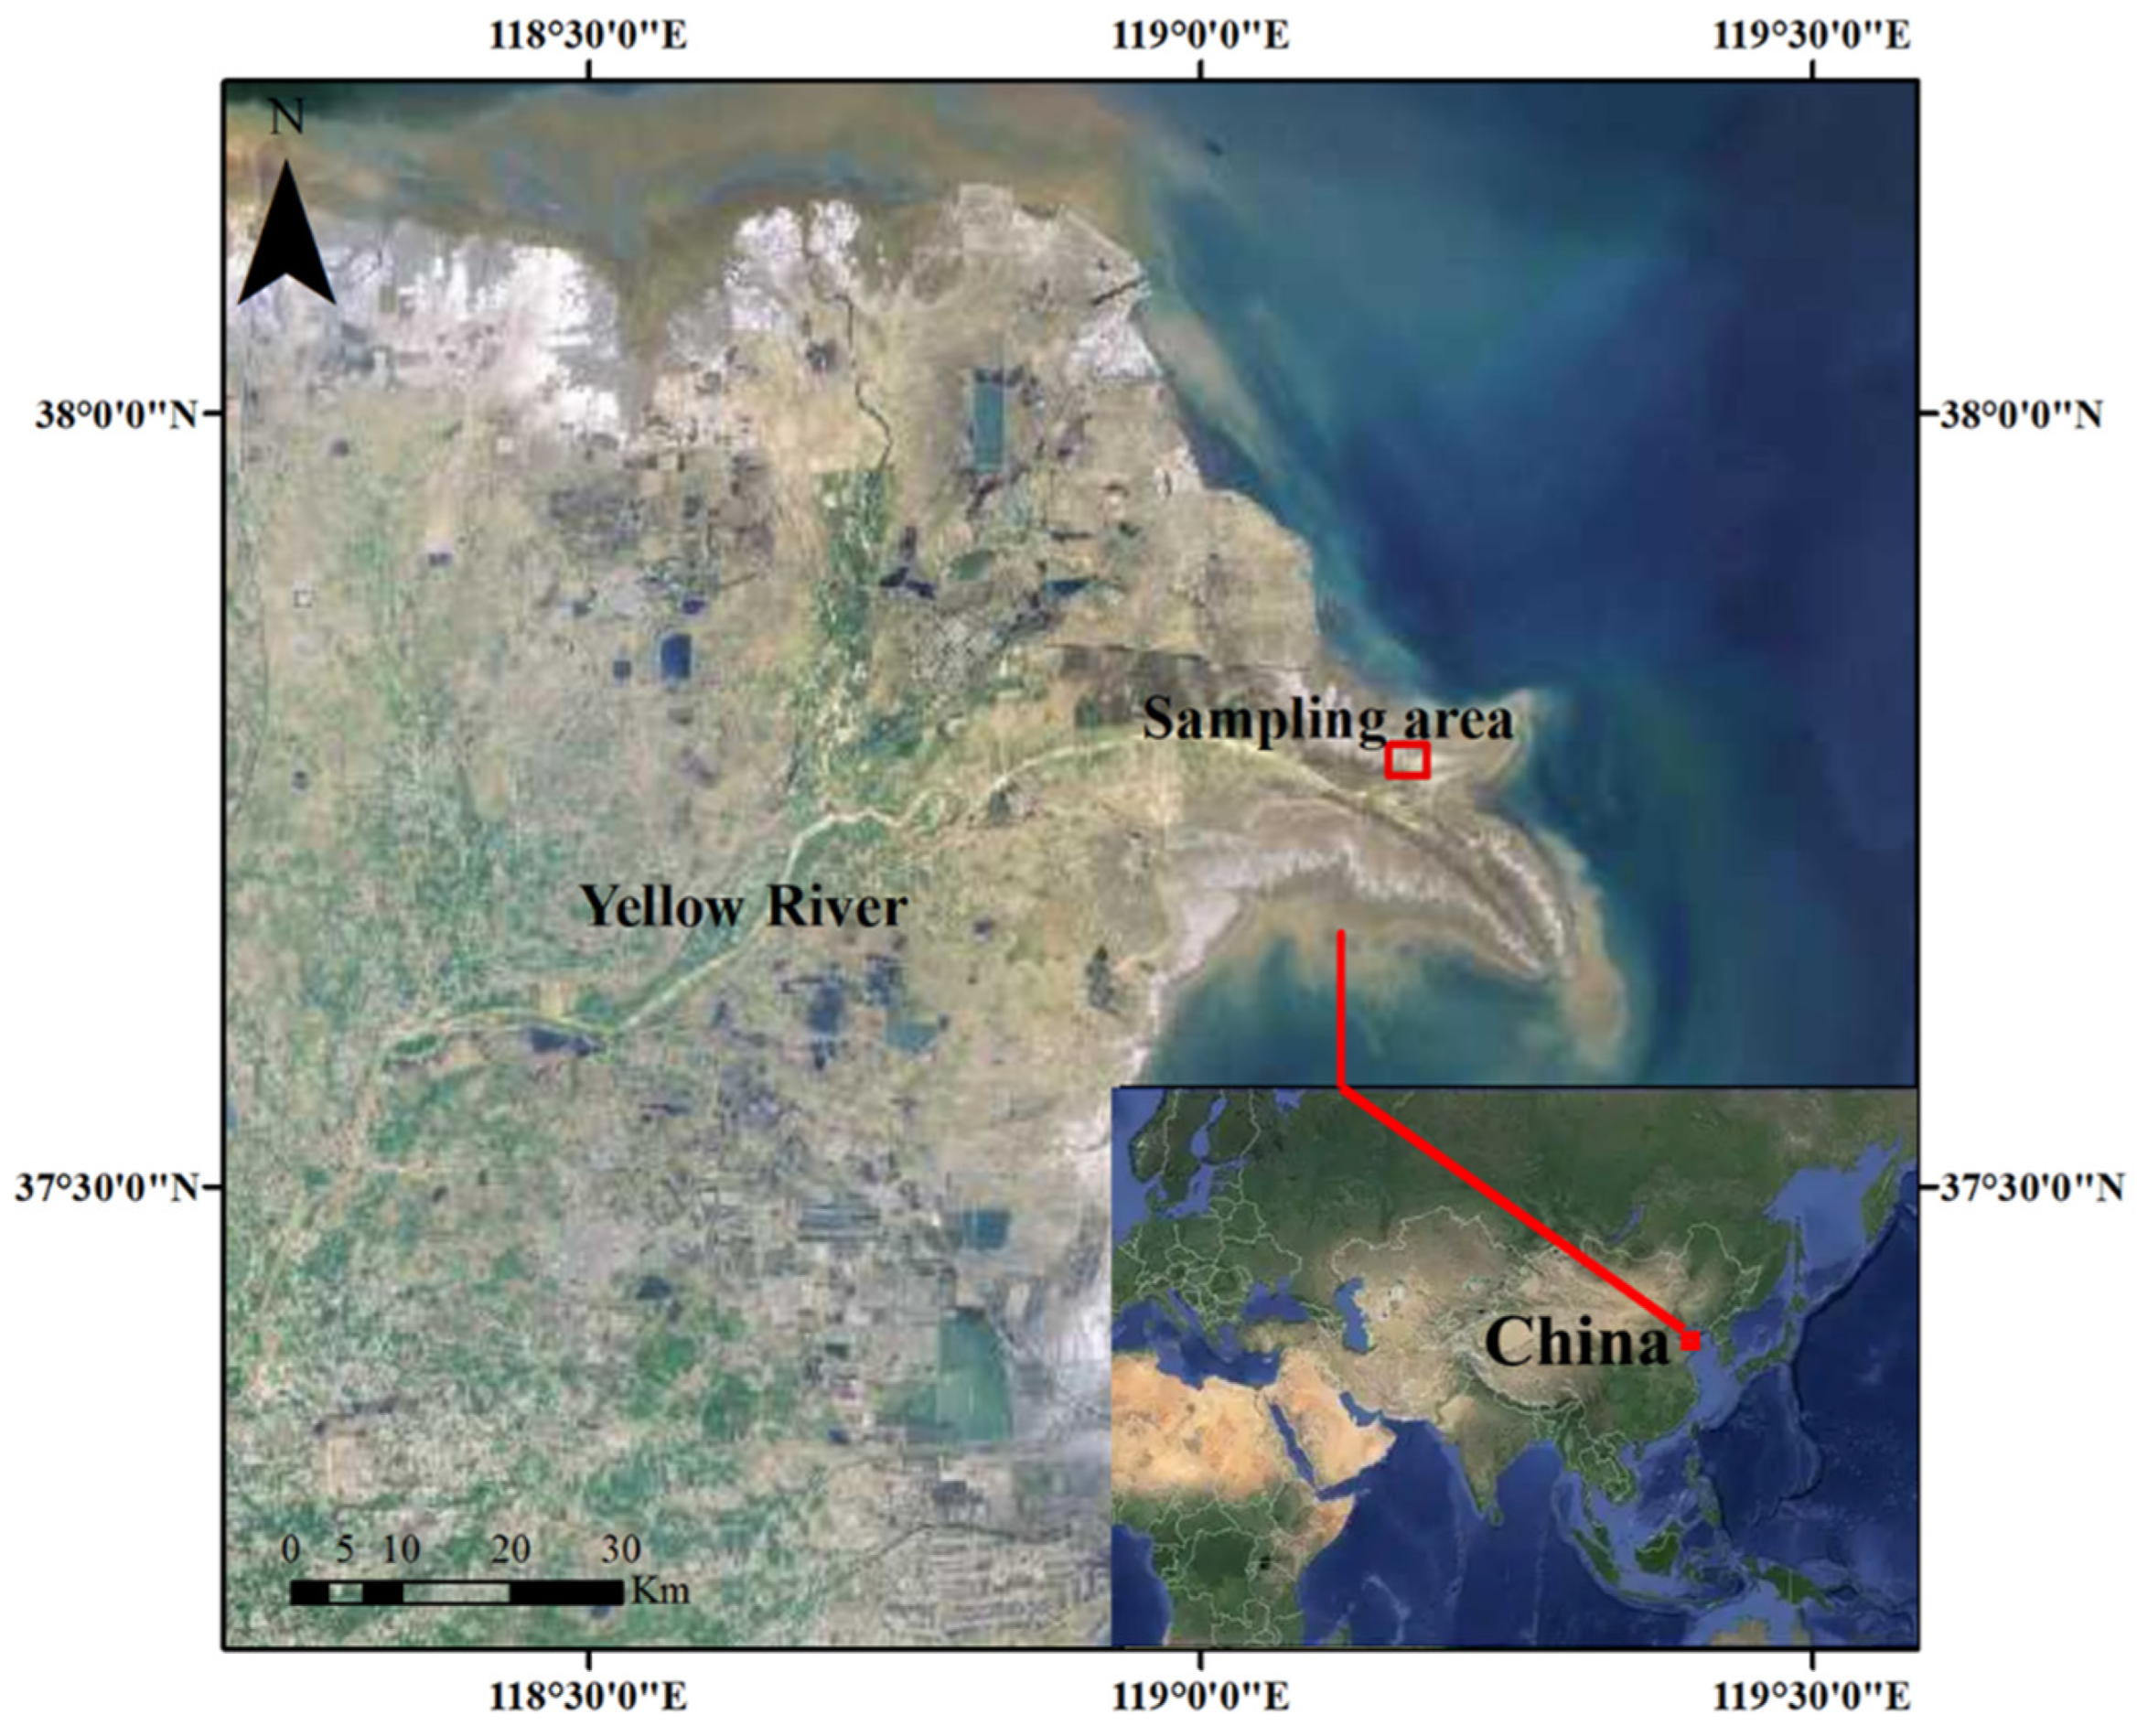
2.1. Sampling

The region, mainly covered with Phragmites communis, was chosen as the sampling area, which is located in the tidal flat of Yellow River Delta National Nature Reserve, China (Figure 1). The Yellow River Delta is located at the mouth of the Yellow River estuary and in Eastern China on the coast of the Bohai Sea. It has a warm-temperate and continental monsoon climate with distinct seasons. Fluvisols is a typical soil type in this region, originating from the sediment and the parent materials of loess soil [27,28]. A total of 30 replicate sediment cores (15 cm high, 15 cm diameter) were collected by using PVC pipes (20 cm high, 15 cm diameter). Then, the sediment cores and PVC pipes were sealed together and transported to the laboratory without damaging the soil structure of sediment. Two sediment cores were used as original samples; the others were used for incubation experiments.

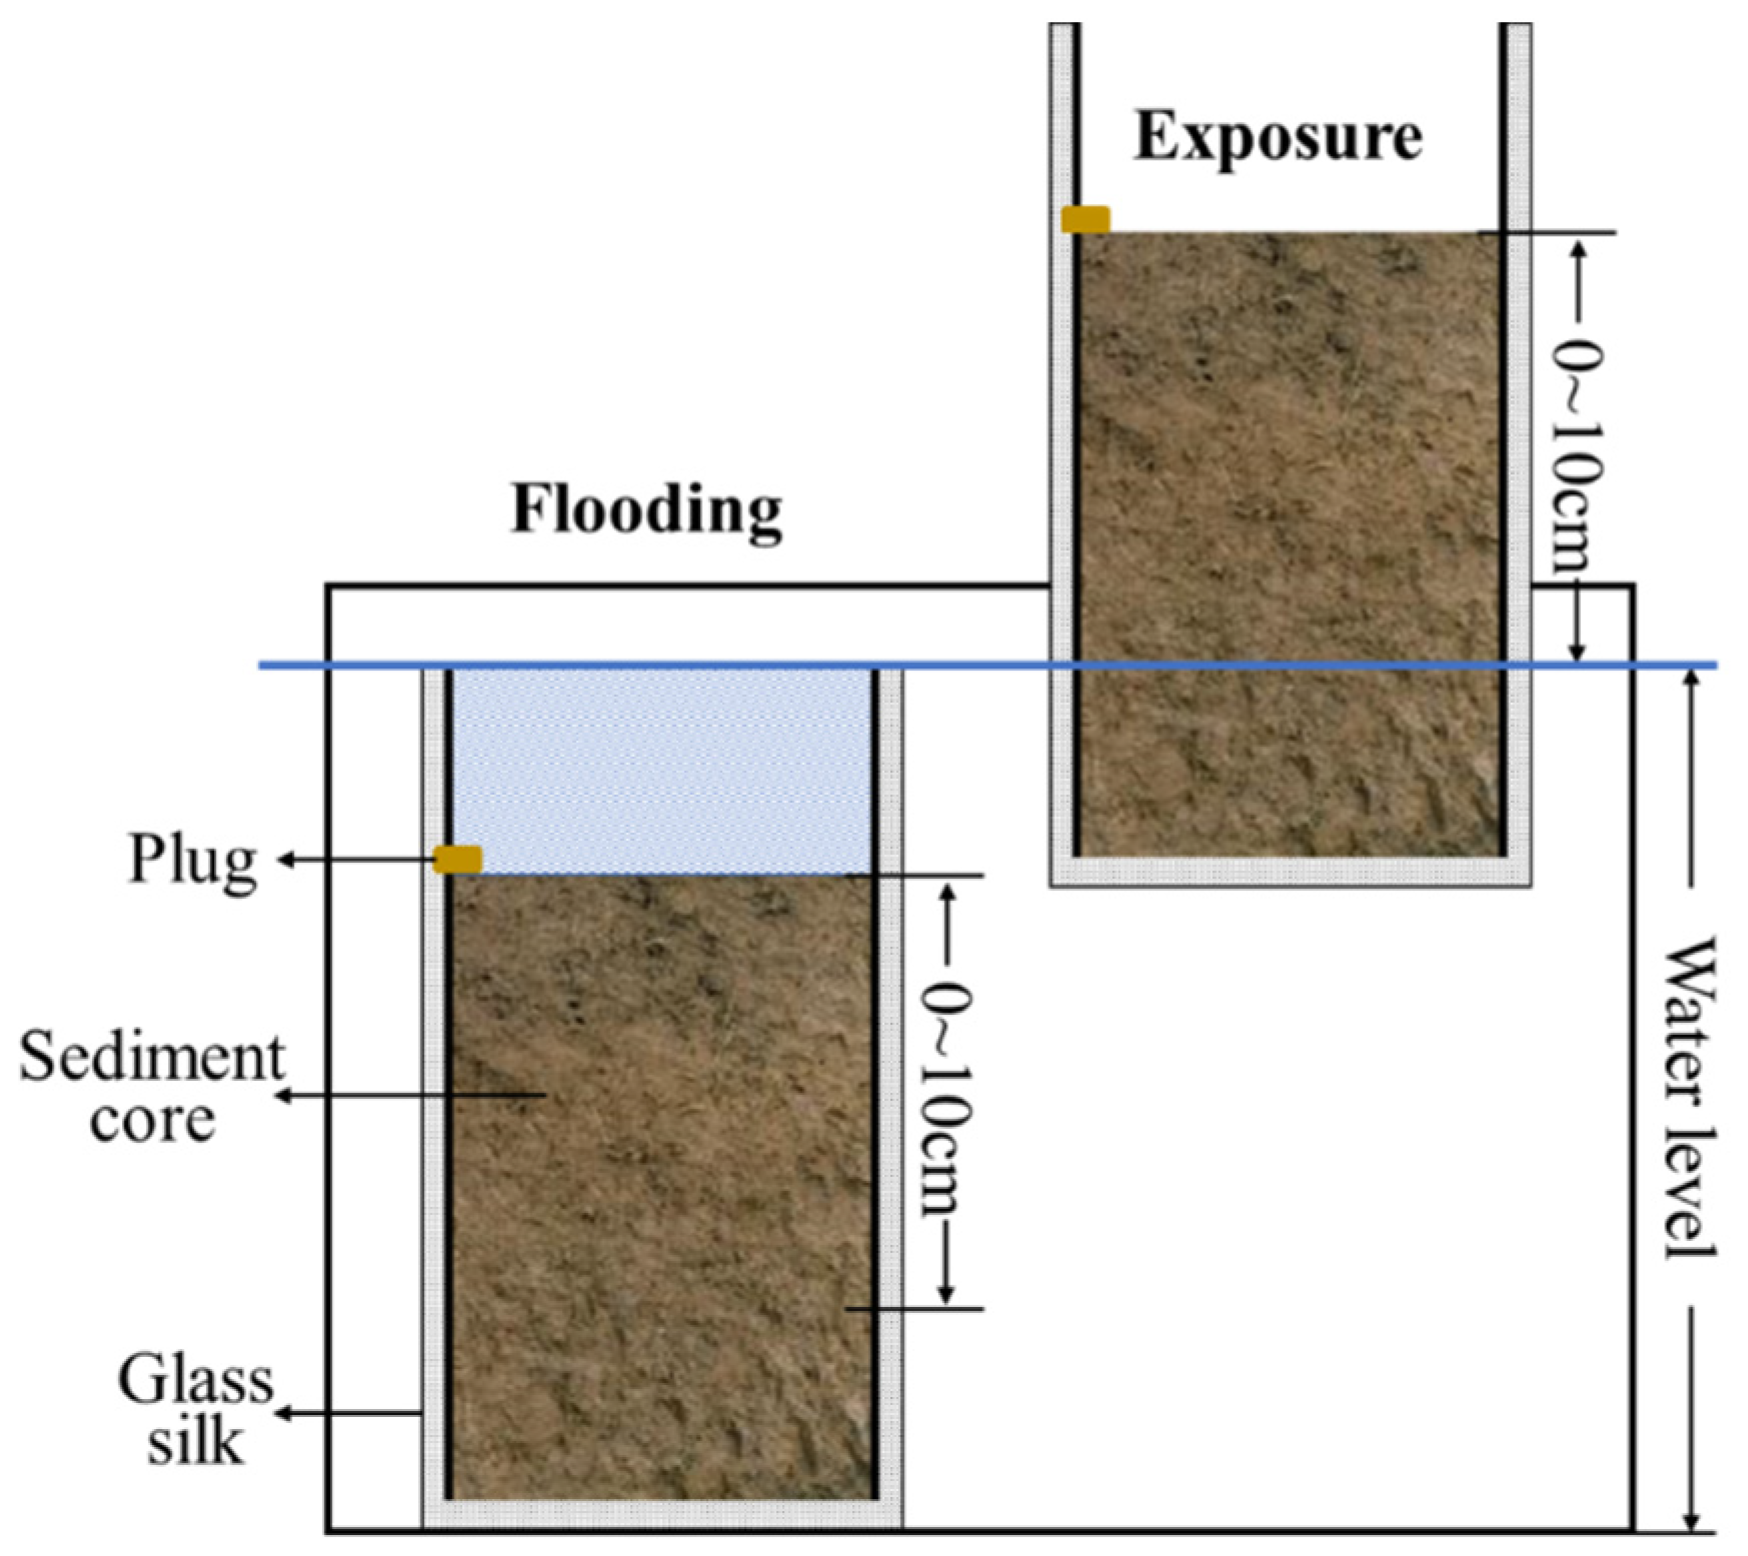
2.2. Incubation Experiment

Three hydrological regimes and five salt conditions were set for the incubation experiment considering the situation of the tidal flat, as shown in Table 1. No flooding (N): keeping the bottom 5 cm of sediment cores in water. Periodic flooding (P): alternating 12 h flooding and 12 h emergence. The sediment cores were repeatedly put down (totally below the water level) and raised (bottom 10 cm of sediment cores in water) in a larger PVC box on a 12 h cycle to simulate an alternating hydrological regime, as shown in Figure 2. Long-term flooding (L): keeping permanently flooded and the sediment cores totally below the water level. Considering the salinity of river and seawater, 0‰ (S0), 5‰ (S5), 10‰ (S10), 20‰ (S20), and 30‰ (S30) were set as the salt conditions in the incubation experiment. Solutions of the desired salinity were prepared by dissolving NaCl in deionized water. Every two replicate sediment cores were put into one PVC box (60 cm length, 20 cm width, 23 cm depth). The water level in PVC boxes for N, P, and L were 5 cm, 20 cm, and 20 cm, respectively. A total of 14 PVC boxes were used to achieve the 14 combinations of hydrological regimes and salt conditions.
Table 1. The condition of hydrological regimes and salt.
Hydrological RegimesSalt
0‰5‰10‰20‰30‰
No floodingNS0NS5NS10NS20-
Periodic floodingPS0PS5PS10PS20PS30
Long-term floodingLS0LS5LS10LS20LS30
The incubation experiment was carried out for nine weeks. Given the stronger tidal influence on topsoil, approximately 10 g of sediment was collected from the 0–10 cm depth of each core at the end of the first week (20 September 2019), third week (7 October 2019), fifth week (19 October 2019), seventh week (3 November 2019), and ninth week (17 November 2019). We kept the sediment undamaged when we sampled it in the process of the incubation experiment.

2.3. Analytical Method

The modified BCR (European Community Bureau of Reference) three-step extraction procedure was used to analyze metal fraction (acid-soluble fraction (F1), reducible fraction (F2), oxidizable fraction (F3), and residual fraction (F4)). The total and individual fraction concentrations of Cd, Cr, Cu, Pb, and Zn for original sediment cores and incubation sediment cores were determined using ICP-MS (Agilent Technologies 7700 Series inductively coupled plasma mass spectrometry, CA, USA). The full details of the laboratory analysis process used in this study are reported in our previous study [13].
To avoid possible contamination, all reagents used in this study were of analytical grade. Deionized water was used for washing and solution preparation. Quality assurance and quality control testing were conducted by using duplicate analyses and the standard reference sample (GBW07436). The average concentration difference between replicate samples was within 5% variability. The recovery rate ranged from 80% to 120%.

2.4. Risk Assessment Code

The risk assessment code (RAC), which is based on a metal fraction, could be used to evaluate the mobility, availability, and risk of heavy metals. RAC is the ratio of metals in acid-soluble fractions to metals in all fractions. The acid-soluble fraction is the most available fraction and presents a high ecological risk. According to RAC, the environmental risks of metals are classified as: No risk, RAC < 1%; Low risk, RAC 1–10%; Medium risk, RAC 11–30%; High risk, RAC 31–50%; and Very high risk, RAC ˃ 50%.

2.5. Statistical Analysis of Data

Descriptive statistical analyses were performed using Microsoft Excel 2010, origin 2017, and SPSS 22. Table 1, Table 2 and Table 3 were analyzed by Microsoft Excel 2010, and Table 4 was calculated by general linear model (GLM) in SPSS 22 and Microsoft Excel 2010. GLM was used to determine the individual effect of hydrological regimes, salinity, and time on metal fraction and the interaction effect between hydrological regimes and salinity. ArcGIS 10.0 was used for spatial calculations and to create Figure 1. Figure 2 was graphed by Microsoft PowerPoint 2010. Figures 3 and 4 were drawn through origin 2017.

3. Results

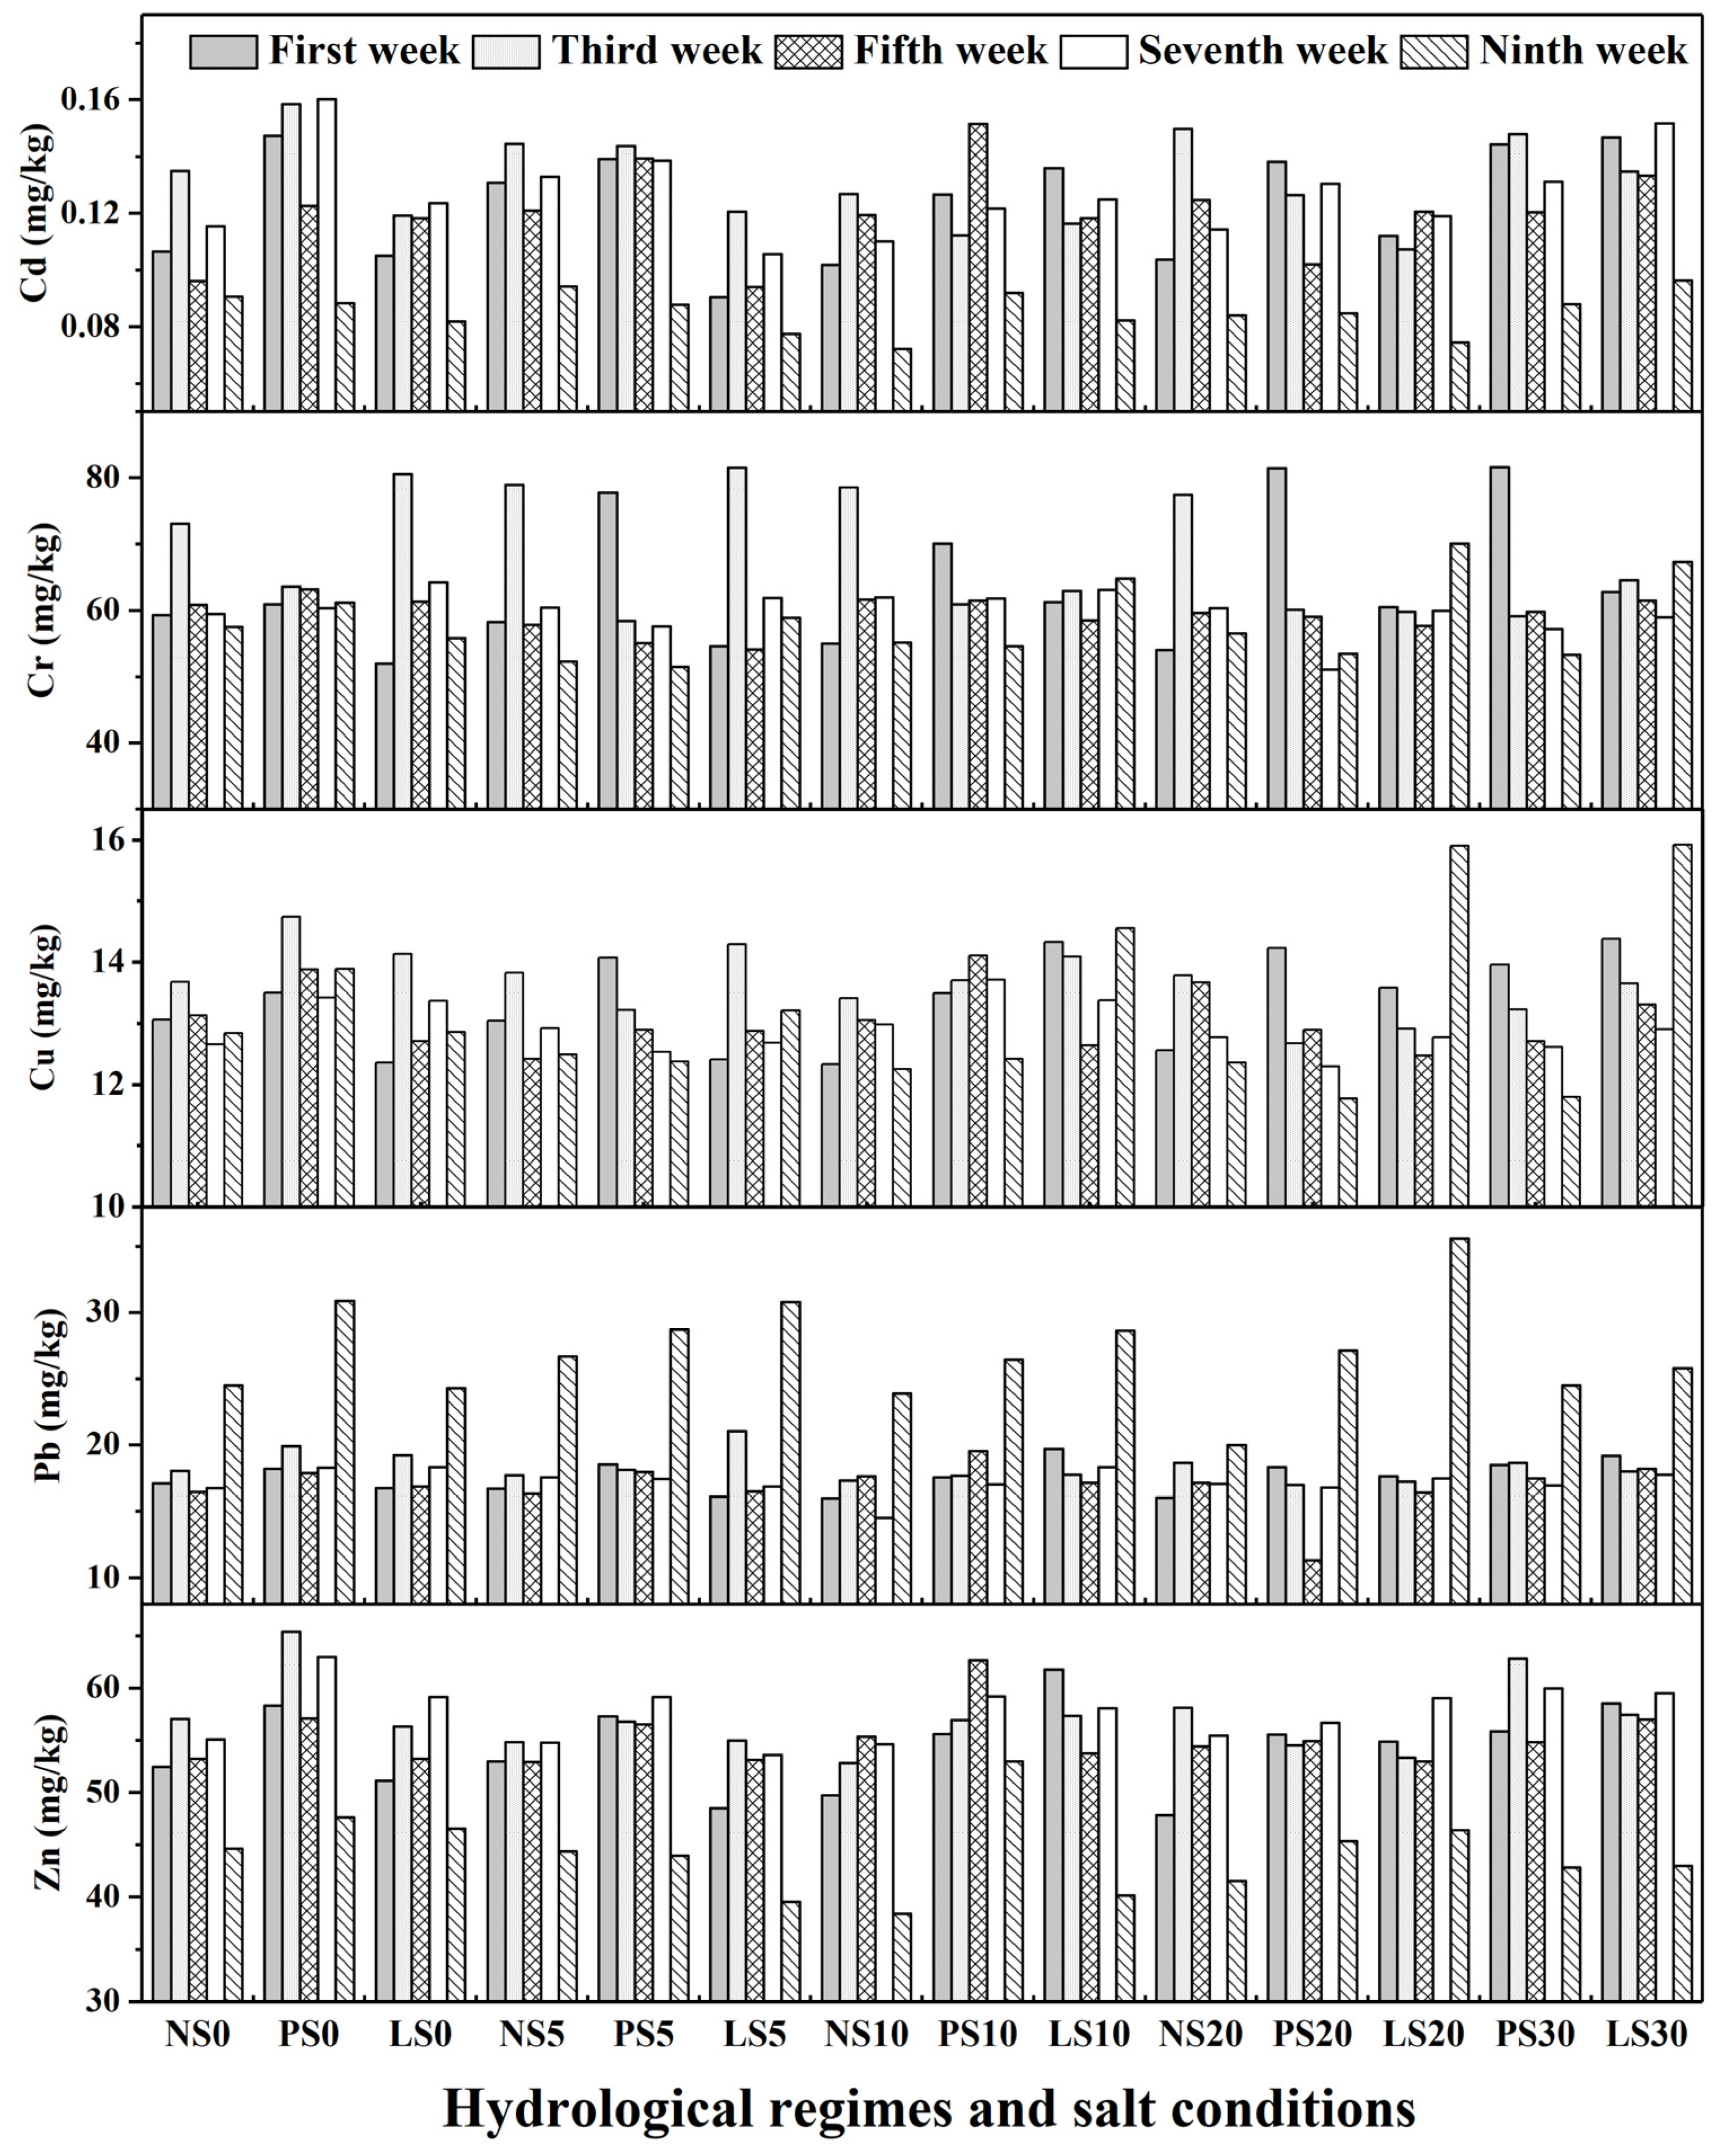
3.1. Heavy Metal Concentrations

The mean concentrations of Cd, Cr, Cu, Pb, and Zn in the original sediment are 0.08, 67.36, 16.20, 26.30, and 47.37 mg/kg. After the incubation experiment, the contents of heavy metal changed significantly, as shown in Table 2 and Figure 3. With the increased time of the incubation experiment under different hydrological regimes and salt conditions, the content of Cr, Cu, and Pb decreased with time, whereas the concentration of Cd and Zn increased. During the whole incubation experiment, the concentration of Pb exhibited the greatest temporal variation, followed by Cd. An obvious difference existed between the metal concentration in the ninth week with that in other weeks, except Cu, which implies that incubation time has an influence on metal concentration. The concentration of Cd and Zn in the ninth week was obviously lower than that in other weeks, but Pb concentration was highest in the ninth week among all the weeks.
Table 2. The concentration of metals in sediment after incubation experiment.
MeanCd (mg/kg)Cr (mg/kg)Cu (mg/kg)Pb (mg/kg)Zn (mg/kg)
Original samples0.0867.3616.2026.3047.37
First week0.1263.5613.3817.5954.33
Third week0.1368.5613.6718.3257.06
Fifth week0.1259.4213.0516.9355.15
Seventh week0.1359.8912.9317.2357.68
Ninth week0.0958.0413.1926.9944.12
For no-flooding treatment (NS0, NS5, NS10, and NS20), metal concentration increased in the third week and then decreased in the fifth week in each salinity, except Pb and Zn in NS10. The concentrations of Cr and Cu in the third week were totally higher than that in other weeks under NS0, NS5, NS10, and NS20. With the increase in salinity, the concentrations of Cd increased first, then decreased, and then increased in each week. Under salinity of 5‰ and 20‰, the Cd content was higher than that in other salinity. No obvious changes in Pb and Zn concentration were identified between different salinity under no-flooding treatment.
For periodic flooding (PS0, PS5, PS10, PS20, and PS30), the concentration of Cd in the fifth week and ninth week was increased first and then decreased with the increase of salinity, and the highest Cd concentration occurred in 10‰ salinity. The trend of Cd content in other weeks was just the opposite, and the lowest Cd concentration occurred in 10‰. Cr and Cu exhibited similar trends with the increase of salinity, which increased first, then decreased, then increased, and then decreased for the first week. Cr and Cu in other weeks showed the opposite trend with that in the first week. In addition, Cr concentration in the first week was totally higher than that in other weeks, declaring that Cr concentration reduced with the increase of incubation time. With the increase of salinity, except 30‰, the metal concentration decreased for Pb in the third week, Pb in the seventh week, Zn in the first week, Zn in the third week, and Zn in the seventh week. This phenomenon indicated there existed different influencing mechanisms on metal concentration under high salinity and low salinity.
For long-term flooding (LS0, LS5, LS10, LS20, and LS30), the highest Cd concentration occurred in the salinity of 30‰ in each week. For the first week, fifth week, and seventh week, the lowest Cd concentration occurred in the salinity of 5‰. Except 20‰, with the increase of salinity, Cr concentration increased in the first week and ninth week. The concentration of Cu in the ninth week increased with the rise of salinity. In the first week, fifth week, and seventh week, Pb concentration was lowest in 5‰, and the highest Pb concentration occurred in the ninth week under the salinity of 20‰. There are similar trends for Cd (in the first week, fifth week, seventh week, and ninth week), Cr (in the fifth week), Pb (in the fifth week and seventh week), and Zn (in the first week, third week, and fifth week) that the concentrations were decreased first, then increased, then decreased, and then increased with the rise of salinity.
Under the salinity of 0‰, metal concentrations in PS0 were higher than that in NS0 and LS0, except Cd in the ninth week and Cr in the third week and seventh week. This implies that there existed higher ecological risk under the hydrological regimes of periodic flooding for soil. In general, the concentration of Cd and Zn in PS5 was higher than that in NS5 and LS5. In the first week, fifth week, and seventh week, Pb concentration in PS5 was higher than that in NS5 and LS5. The sequence of Pb concentration in the first week, third week, seventh week, and ninth week was as shown: LS10 > PS10 > NS10. The concentration of Zn in PS10 was highest for the fifth week, seventh week, and ninth week. Under the condition of LS10, the concentration of Zn increased with the passage of incubation time. On the whole, metal concentration under PS20 was higher than that under NS20 and LS20 in the first week and then decreased with the increase in incubation time. For the highest salinity, all metal concentrations under long-term flooding (LS30) were higher than that under periodic flooding (PS30).

3.2. Heavy Metal Speciation

Heavy metal speciation in the original sediment indicated that residual fraction (66.39–88.81%) was the dominant binding form for Cr, Cu, Pb, and Zn. Among the other three fractions, Cr, Cu, and Zn were mainly in F3 (10.14%, 23.47%, and 17.67%), and Pb was mainly in F2 (23.47%). For Cd, the proportion of F1 (62.59%) was the highest, followed by F4 (16.72%), F2 (15.68%), and F3 (5.01%).
After the incubation experiment, the speciation of heavy metals changed significantly, as shown in Table 3. Under different hydrological regimes, salt conditions, and incubation times, heavy metal speciation showed different distribution patterns, and the detailed information is described as follows. The mean metal speciation values for the same hydrological regimes or same salt conditions revealed similar distribution characteristics for metal speciation. Cd was predominantly present in the F1 (mean value 54.38%), followed by F4 (mean value 25.58%), which was totally different from other metals. The speciation of Cr, Cu, and Zn was sorted by F4 > F3 > F2 > F1, which was similar to the original sediment. After incubation, F1 and F2 of Cu were twice as high as that in the original sediment, which fluctuated obviously. For Pb, the speciation was followed by F4 > F2 > F3 > F1.

3.2.1. Three Hydrological Regimes

The F1 and F2 of Cd under the three hydrological regimes decreased and followed the order: P > L > N. In the condition of no flooding, the ratio of F3 and F4 was higher than that in periodic flooding and long-term flooding. F4 of Cd increased significantly under the three hydrological regimes. On the whole, the mobility and bioavailability of Cd in sediment under the three hydrological regimes reduced through incubation.
After incubation, F1, F2, and F3 of Cr were increased. But there was little difference between the three hydrological regimes for F1 of Cr. F2 and F3 of Cr under the three hydrological regimes followed the order: N > L > P. F4 was the dominant fraction for Cr, accounting for more than 80%. F4 of Cr decreased after incubation and was highest under periodic flooding.
The dominating chemical form for Cu was F4 and then F3, which were in agreement with the previous studies that Cu was easily combined with organic matter. F1, F2, F3, and F4 of Cu under the three hydrological regimes were totally different, which followed the order: L > N >P, N > L > P, N > P >L, and P > L > N. The most obvious reduction of F4 occurred in the sediment under no flooding conditions.
F1, F2, and F3 of Pb increased significantly, compared with the original sediment. Little difference between periodic flooding and long-term flooding was revealed for F1 of Pb, which implies the way of flooding has little effect on F1. The F2, F3, and F4 of Pb in the sediment under no flooding were in the middle of that under periodic flooding and long-term flooding.
Compared to the original sediment, the speciation of Zn changed obviously, especially for F3 of Zn. The speciation of Zn in the incubation sediments was followed by F4 > F3 > F2 > F1, as shown in Table 3. For F1, F2, and F3, the speciation of Zn was sorted by N > P > L. However, the difference among the three hydrological regimes was not significant.

3.2.2. Five Salt Conditions

For Cd, the ratio of F1 under 0‰ was totally lower than that under saltwater. This implied that salinity affected the behavior of Cd. Normally, Cd ions would bind to sulfur, and then the acid-soluble fraction decreased, which explained why F1 decreased after all the incubation experiments. However, the competition between cations in saltwater and Cd ions led to less Cd ions turning to CdS or other Cd minerals. Highest F2 occurred in the salinity of 30‰. The residual fraction in the incubation sediment was totally higher than that in the original sediment, which was highest under salinity of 10‰.
Among all the incubation experiments, the lowest F1 ratio and the highest F2, F3 ratio occurred in the sediment under the salt condition of 0‰. The four speciation of Cd under 0‰ and 5‰ were similar, which were totally different from that under 10‰, 20‰, and 30‰. This indicated that salinity has influence on the speciation of Cr, especially the higher salinity (10‰, 20‰, and 30‰), which was higher than sediment salinity. Aforementioned, the speciation of Cr was closely related to physicochemical properties of the original sediment, such as salinity.
Significant divergence in the speciation of Cu between 30‰ and other salinity appeared after incubation. The lowest F1, F2 and the highest F4 appeared in the sediment under 30‰, the highest salinity.
The lowest F1 and highest F4 occurred in the sediment under 5‰ (close to the salinity of sediment), suggesting that the mobility was lower after incubation. Among all the incubation experiments, the highest F2 ratio and the lowest F3 ratio appeared in the sediment under the salt condition of 0‰.
Under the highest salinity of 30‰, the migration of Zn was strongest due to the highest F1, F2, and F3 of Zn. The speciation of Zn in 30‰ was totally different from that under other salinity, which confirmed that different salinity has diverse effects on Zn.

3.2.3. Different Incubation Time

With the increase of incubation time, the proportion of each metal speciation tended toward the proportion of metal speciation in the original sediment generally. By the time of the first sampling, F1, F2, and F3 of Cd and Zn in soil decreased significantly. F4 of Cd and Zn was highest in the first week (42.79%) and then decreased with incubation time, which was totally different from other fractions of Cd. However, F4 of Cr, Cu, and Pb decreased in the first sampling and then fluctuated to the status of the original sediment. F1 of Cr, Cu, and Pb in sediment increased at the first week, implying higher ecological risk. This phenomenon indicated that at the beginning of incubation, the speciation of different metals changed differently and significantly.
In addition, F1 of Cd, Cu, Pb, and Zn exhibited similar trends with the increase of incubation time, under LS0 and PS0, which was similar to the results of paddy soil. The possible reason was that Cd, Cu, Pb, and Zn are chalcophile elements, and similar properties of acid-soluble fractions were presented under flooding. The variation trend with incubation time for F2 of Cd, Pb, and Zn was the same under LS0 and PS0.

3.3. GLM

The relationship of metal speciation, hydrological regimes, salinity, and incubation time was analyzed through GLM, and the results are shown in Table 4. According to the GLM, incubation time had a significant effect on four fractions of Cd, Cr, Cu, Pb, and Zn (p < 0.001). This phenomenon confirmed that metal speciation exhibited a significant correlation with the time of flooding or drying.
Hydrological regime had significant effect on F1 of Cu, Pb, and Zn (p < 0.001), which implied there may exist similar mechanisms for these metals under the same hydrological regime. For F2, the hydrological regime was significantly correlated with Cd and Cu at the 0.01 level. There was obvious correlation between the hydrological regime and F3 of Cd (p < 0.001), Cr (p < 0.005), and Cu (p < 0.001). The residual fraction of Cr and Cu was related to the hydrological regime at the 0.01 level. A clear correlation appeared between F4 of Zn and hydrological regime (p < 0.005). A positive correlation was also found between salt and F1 of Cu (p < 0.001), Pb (p < 0.005), and Zn (p < 0.005). The interaction effect of hydrological regime and salinity on metal speciation was also exhibited, such as F1 of Cu (p < 0.001) and Pb (p < 0.005) and F2 of Cd (p < 0.005).

3.4. RAC

The RAC for original sediment and the sediment after incubation was calculated; the results are shown in Figure 4. After the incubation experiment, the RAC of Cd ranged from 21.91% to 71.91%, with a mean value of 54.24%. Except for Cd sampled in the fifth week under NS0 and NS20, the risk of Cd under other conditions was high risk or very high risk. The mean RAC of Cd in the first week was 45.71%, which was lower than that in the original sediment (62.59%) obviously. In the following incubation experiment, the risk of Cd fluctuated and tended toward that in original sediment.
Table 4. Difference test results of general linear model (GLM).
FractionFactorCdCrCuPbZn
Acid-soluble fraction (F1)Hydrological regime0.056 0.391 0.000 ** 0.002 ** 0.000 **
Salt0.505 0.320 0.000 ** 0.032 * 0.045 *
Time0.000 ** 0.000 ** 0.000 ** 0.000 ** 0.000 **
Hydrological regime × Salt0.805 0.555 0.000 ** 0.038 * 0.621
Reducible fraction (F2)Hydrological regime0.000 ** 0.122 0.000 ** 0.052 0.075
Salt0.320 0.696 0.271 0.160 0.432
Time0.000 ** 0.000 ** 0.000 ** 0.000 ** 0.000 **
Hydrological regime × Salt0.013 * 0.446 0.320 0.052 0.748
Oxidizable fraction (F3)Hydrological regime0.014 * 0.006 ** 0.023 * 0.101 0.509
Salt0.339 0.465 0.571 0.608 0.274
Time0.000 ** 0.000 ** 0.000 ** 0.000 **0.000 **
Hydrological regime × Salt0.317 0.506 0.087 0.1220.066
Residual fraction (F4)Hydrological regime0.518 0.004 ** 0.003 ** 0.4490.032 *
Salt0.874 0.445 0.598 0.7790.120
Time0.000 ** 0.000 ** 0.000 ** 0.000 ** 0.000 **
Hydrological regime × Salt0.149 0.519 0.301 0.2860.759
Notes: * significantly correlated at the 0.05 level (bilateral); ** significantly correlated at the 0.01 level (bilateral).
In general, there was no risk for Cr, with the RAC lower than 1%. However, the risk of Cr in the sediment after incubation was obviously higher than that in the original sediment. So attention should be paid to Cr in the intertidal zone, where continuous changing hydrological regimes and salinity happened all the time.
The RAC of Cu in the original sediment was 0.46%, which was no risk. After the incubation experiment, the risk caused by Cu increased, which was no risk or low risk. No risk mainly occurred in the ninth week, implying that risk decreased after longtime incubation. The risk caused by Cu under LS5 and LS20 was a little higher than that under other conditions. The risk of Cu in different weeks under PS5 was similar, except for the ninth week, which implied that periodic flooding had little influence on Cu risk within the seventh week.
RAC of Pb sampled from the first week to the seventh week was in the range of 1.38~3.11% (low risk), which was totally higher than that in the original sediment (0.73%). Similarly, with Cu, there was no risk for Pb in the ninth week. This indicated that with the increase of incubation time, the risk of Pb decreased.
In the original sediment, the RAC of Zn was 5.73%, which was low risk. As shown in Figure 4, most Zn showed low risk after incubation, with a mean RAC of 6.24%. In the seventh week, there existed some medium risk for Zn. The highest RAC of Zn was 17.59% (medium risk), which occurred in the seventh week under PS5.

4. Discussion

4.1. Change of Heavy Metal Concentrations During Incubation

Heavy metal concentrations could be influenced by the hydrological regimes down and up ground [29]. Metals in the soil could be leached to deeper soil or transported upward via capillary water under varying hydrological regimes. Under no flooding incubation, concentrations of Cd and Zn in soil increased during the first week, followed by a generalized rise in all metals by the third week. In our experiment, only the metal concentration in the upper soil (0~10 cm) was detected, and the soil structure was kept unchanged. The main reason for the metal increase first is that metal in the subsoil (10~15 cm) raised to the upper soil (0~10 cm) with the capillary water. This trend aligns with observations in the Yellow River Delta, where the mean annual precipitation (551.6 mm) is markedly lower than evaporation (1928.2 mm). Under the influence of seawater, the average water table ranged from 0.2 m to 3.0 m [30]. The capillary water raising occurred in the whole Yellow River Delta, which resulted in soil salinization and metal gathered in the upper soil. Abundant studies about metal vertical distribution showed that the highest metal concentration occurred in the upper soil [22,31].
Periodic flooding caused alternating redox conditions of soil. Periodic freshwater flooding is generally considered an effective strategy to mitigate metal-induced ecological risks [23]. The research of Khodaverdiloo et al. [32] clarified that the mobility (ecological risk) of Pb in sediment decreased with increasing incubation time under periodic flooding of fresh water. In our study, under fresh water, metal concentrations under freshwater periodic flooding exhibited the highest values across three hydrological regimes, except for Cr during the third week. The main reason was that metals in the whole sediment core were leached into water and then deposited in the upper soil with the flooding.
However, under the salinity of 30‰, concentrations of metals in long-term flooding was higher than that in periodic flooding for each week. This proved that high salinity could promote the adsorption of heavy metals on sediment [33]. Under the salinity of 5‰, 10‰, and 20‰, the distribution of metal under different hydrological regimes was irregular, which was due to the complex influence of hydrological regimes and salinity. Furthermore, the salinity and other physicochemical properties of sediment were also the reason for this irregularity.

4.2. Speciation Transformation of Heavy Metal During Incubation

Speciation of heavy metals could be influenced by the physicochemical properties of sediment, such as redox potential (Eh), pH, moisture content, ionic concentration, organic matter, and so on [34,35,36,37]. The hydrological regimes could affect the physicochemical properties of sediment.
Under flooding, Eh decreases, and the condition of soil reduces condition. In this condition, F2 of metals was influenced most. Normally, iron (Fe), manganese (Mn), and their oxides were the main influence factor of F2. Under flooding, Fe (Ⅲ), Mn (Ⅲ), and Mn (Ⅳ) would transform to Fe (Ⅱ) and Mn (Ⅱ); then, the metal adsorbed on Fe and Mn would release [25]. However, longer flooding inundation times may further decrease the Eh and metals easily combined with sulfur (S) and settle down [17]. The study of Yan et al. [38] showed that CdS was easily formed under 30-day continuous flooding. The metals combined with organic matter or sulfide were the main part of F3. In our study, the F3 of Cd showed a general increase under long-term flooding, with values exceeding those under no flooding and periodic flooding. In this condition, S may be a limiting factor in the formation of CdS in soils when the amounts of Cd and other chalcophile metals exceed the amount of reducible sulfate [38,39]. Many studies showed that organic matter decreases with the increased flooding time and the decomposition rate of organic matter decreases [40,41]. The F3 of Cr decreased significantly initially, followed by minor fluctuations. F3 of Cu decreased from the first week to the fifth week notably and then fluctuated, which was similar with the results of Zhao et al. [23]. This phenomenon indicated that organic matter has a critical impact on the speciation of Cr and Cu.
Under no-flooding conditions, Eh increased, and the transformation of Fe and Mn was contrary to that under flooding. And iron-manganese (Oxyhydr) oxides could determine mobilization of Cd under fresh water, which has been clarified by previous studies during soil drainage in paddy soil systems [42].
In all samples, there is a higher proportion of Cu in F3, with a mean percentage of 23.47%. Korfali and Karaki [43] observed that the proportion of Cu in F3 varied between 18% and 34% (mean: 25%). Li and Ji [44] reported that the percentage of Cu in F3 was 37%. The association of Cu with the organic phase has been widely reported [43,44,45].
The mean proportion of Pb in F1 was 1.84%, which is as low as expected [46]. During incubation, F1 of Pb exhibited initial fluctuations followed by a sharp decline in the ninth week. Accordingly, F4 of Pb increased in the ninth week markedly. As reported by Wang et al. [47], alternating redox conditions (e.g., hydrological fluctuations) affect the release of Pb from soil solids and subsequent distribution of Pb in more labile fractions.
Salinity of flooding could influence the speciation of metals through complexation and cation exchange [19,48]. Anions in salinity, such as chloride ions, could combine with metals in sediment to form a stable complex through complexation [49]. Positive ions, such as sodium, would replace metal ions in sediment to soil solution or water [21]. In our study, F1 of Cd reached its lowest proportion under S0 but increased significantly under higher salinity treatments (S5, S10, S20, and S30). Positive ions in water combined with S may be the main reason for this. This also could explain that F3 of Cd was low under LS20 and LS30 in the seventh week and ninth week. The results of GLM also showed that salinity had a significant effect on F1 of Cu, Pb, and Zn. Four speciation of Cr under S0 and S5 were similar and totally different from that under S10, S20, and S30.

5. Conclusions

The incubation under three kind hydrological regimes and five kind salt conditions changed the metal concentration and metal speciation in the tidal flat sediment significantly. The concentration of Cr, Cu, and Pb decreased, whereas the concentration of Cd and Zn increased with the increased incubation time. Under the salinity of 0‰, concentrations for most metals in PS0 were higher than that in NS0 and LS0, whereas all metal concentrations under long-term flooding (LS30) were higher than that under periodic flooding (PS30) for highest salinity. After the incubation experiment, the speciation of heavy metal changed significantly, and the mean metal speciation values for the same hydrological regimes or same salt conditions showed a similar order for metal speciation. Cd was predominantly present in the F1, and the speciation of Cr, Cu, and Zn was sorted by F4 > F3 > F2 > F1, which were similar to the original sediment. After incubation, F1 and F2 of Cu were twice as high as that in the original sediment, which fluctuated obviously. GLM showed a significant association between metal speciation and incubation time. Hydrological regime and salt had obvious relevance with the speciation of some metals. The risk of Cd fluctuated at a high level (ranging from 21.91% to 71.91%), which threatened the ecological environment. The risk of Cr and Zn increased, and the risk of Cu and Pb increased first and then decreased in the last week of the experiment. In a word, hydrological regimes, salt conditions, and incubation times had obvious impact on the concentration and speciation of metals. This research will contribute to the prediction of intertidal risks under the influence factors, such as sea level rise, storm surge, and other climatic stressors. To make risk predictions more accurate, future studies should prioritize detecting sediment physicochemical properties (e.g., redox potential and organic carbon content) and elucidating the underlying mechanisms through controlled experiments.

Author Contributions

Y.Y.: Conceptualization, Writing—original draft & editing. Q.X., H.Z. and X.Z.: Data Collection. J.Y. (Jisong Yang): Supervision. Y.L.: Investigation, Data curation. N.S.: Statistical Analysis. J.Y. (Junbao Yu): Visualization, Review. All authors have read and agreed to the published version of the manuscript.

Funding

Shandong Provincial Natural Science Foundation (ZR2022QD093), the National Science Foundation of China (42201061, 42271055), and the project of the Cultivation Plan of Superior Discipline Talent Teams of Universities in Shandong Province: “The Coastal Resources and Environment Team for Blue-Yellow Area”.

Data Availability Statement

The datasets used during the current study are available from the corresponding author on reasonable request.

Acknowledgments

This research was supported by Shandong Provincial Natural Science Foundation (ZR2022QD093), the National Science Foundation of China (42201061, 42271055), and the project of the Cultivation Plan of Superior Discipline Talent Teams of Universities in Shandong Province, “The Coastal Resources and Environment Team for Blue-Yellow Area”. The authors are grateful for the support. Furthermore, the authors show gratitude to the editors and anonymous reviewers for providing suggestions and advice.

Conflicts of Interest

The authors declare that they have no competing interests.

References

  1. Xiao, R.; Zhang, M.; Yao, X.; Ma, Z.; Yu, F.; Bai, J. Heavy Metal Distribution in Different Soil Aggregate Size Classes from Restored Brackish Marsh, Oil Exploitation Zone, and Tidal Mud Flat of the Yellow River Delta. J. Soils Sediments 2016, 16, 821–830. [Google Scholar] [CrossRef]
  2. Díaz-Jaramillo, M.; Islas, M.S.; Gonzalez, M. Spatial Distribution Patterns and Identification of Microplastics on Intertidal Sediments from Urban and Semi-Natural Sw Atlantic Estuaries. Environ. Pollut. 2021, 273, 116398. [Google Scholar] [CrossRef] [PubMed]
  3. Yao, X.; Xiao, R.; Ma, Z.; Xie, Y.; Zhang, M.; Yu, F. Distribution and Contamination Assessment of Heavy Metals in Soils from Tidal Flat, Oil Exploitation Zone and Restored Wetland in the Yellow River Estuary. Wetlands 2016, 36, 153–165. [Google Scholar] [CrossRef]
  4. Sun, Z.; Li, J.; He, T.; Ren, P.; Zhu, H.; Gao, H.; Tian, L.; Hu, X. Spatial Variation and Toxicity Assessment for Heavy Metals in Sediments of Intertidal Zone in a Typical Subtropical Estuary (Min River) of China. Environ. Sci. Pollut. Res. 2017, 24, 23080–23095. [Google Scholar] [CrossRef]
  5. Lv, J.; Wang, Y. Multi-Scale Analysis of Heavy Metals Sources in Soils of Jiangsu Coast, Eastern China. Chemosphere 2018, 212, 964–973. [Google Scholar] [CrossRef]
  6. Cao, Z.; Wang, L.; Yang, L.; Yu, J.; Lv, J.; Meng, M.; Li, G. Heavy Metal Pollution and the Risk from Tidal Flat Reclamation in Coastal Areas of Jiangsu, China. Mar. Pollut. Bull. 2020, 158, 111427. [Google Scholar] [CrossRef]
  7. Ormaza-González, F.I.; Castro-Rendón, R.D.; Maridueña-Bravo, A.; Bobadilla-Cordova, N.; Ramos-Castañeda, I.; Statham, P.J. Hg, Cd, as, and Pb in Surface Sediments from the Tropical Coastal Lagoon Estero Salado, Gulf of Guayaquil-Ecuador. Front. Mar. Sci. 2024, 11, 1457548. [Google Scholar] [CrossRef]
  8. Estrada, E.S.; Juhel, G.; Han, P.; Kelly, B.C.; Lee, W.K.; Bayen, S. Multi-Tool Assessment of Trace Metals in Mangroves Combining Sediment and Clam Sampling, Dgt Passive Samplers and Caged Mussels. Sci. Total Environ. 2017, 574, 847–857. [Google Scholar] [CrossRef]
  9. Ranjan, P.; Ramanathan, A.L.; Kumar, A.; Singhal, R.K.; Datta, D.; Venkatesh, M. Trace Metal Distribution, Assessment and Enrichment in the Surface Sediments of Sundarban Mangrove Ecosystem in India and Bangladesh. Mar. Pollut. Bull. 2018, 127, 541–547. [Google Scholar] [CrossRef]
  10. Zhao, M.; Wang, E.; Xia, P.; Feng, A.; Chi, Y.; Sun, Y. Distribution and Pollution Assessment of Heavy Metals in the Intertidal Zone Environments of Typical Sea Areas in China. Mar. Pollut. Bull. 2019, 138, 397–406. [Google Scholar] [CrossRef]
  11. Liao, J.; Qian, X.; Liu, F.; Deng, S.; Lin, H.; Liu, X.; Wei, C. Multiphase Distribution and Migration Characteristics of Heavy Metals in Typical Sandy Intertidal Zones: Insights from Solid-Liquid Partitioning. Ecotoxicol. Environ. Saf. 2021, 208, 111674. [Google Scholar] [CrossRef]
  12. Chen, J.; Liu, J.; Hong, H.; Liang, S.; Zhao, W.; Jia, H.; Lu, H.; Li, J.; Yan, C. Coastal Reclamation Mediates Heavy Metal Fractions and Ecological Risk in Saltmarsh Sediments of Northern Jiangsu Province, China. Sci. Total Environ. 2022, 825, 154028. [Google Scholar] [CrossRef]
  13. Li, X.; Wang, X.; Yu, J.; Yang, J.; Yu, Y.; Zhou, D.; Li, Y. Effect of Water Level and Salinity on Metal Fractionation in Sediments of the Yellow River Delta. Wetlands 2020, 40, 2765–2774. [Google Scholar] [CrossRef]
  14. Sungur, A.; Soylak, M.; Yilmaz, E.; Yilmaz, S.; Ozcan, H. Characterization of Heavy Metal Fractions in Agricultural Soils by Sequential Extraction Procedure: The Relationship Between Soil Properties and Heavy Metal Fractions. J. Soil Contam. 2015, 24, 1–15. [Google Scholar]
  15. Zhang, G.; Bai, J.; Xiao, R.; Zhao, Q.; Jia, J.; Cui, B.; Liu, X. Heavy Metal Fractions and Ecological Risk Assessment in Sediments from Urban, Rural and Reclamation-Affected Rivers of the Pearl River Estuary, China. Chemosphere 2017, 184, 278–288. [Google Scholar] [CrossRef] [PubMed]
  16. Li, W.C.; Deng, H.; Wong, M.H. Metal Solubility and Speciation Under the Influence of Waterlogged Condition and the Presence of Wetland Plants. Geoderma 2016, 270, 98–108. [Google Scholar] [CrossRef]
  17. Xu, Y.; Sun, X.; Zhang, Q.; Li, X.; Yan, Z. Iron Plaque Formation and Heavy Metal Uptake in Spartina Alterniflora at Different Tidal Levels and Waterlogging Conditions. Ecotoxicol. Environ. Saf. 2018, 153, 91–100. [Google Scholar] [CrossRef]
  18. Lu, J.; Yuan, F. The Distribution of Heavy Metals in the Sediment of Low Tidal Flat, Eastern Chongming Island, China. Iop Conf. Ser. Mater. Sci. Eng. 2019, 472, 012091. [Google Scholar] [CrossRef]
  19. Du Laing, G.; De Vos, R.; Vandecasteele, B.; Lesage, E.; Tack, F.M.G.; Verloo, M.G. Effect of Salinity on Heavy Metal Mobility and Availability in Intertidal Sediments of the Scheldt Estuary. Estuar. Coast. Shelf Sci. 2008, 77, 589–602. [Google Scholar] [CrossRef]
  20. Costa, E.S.; Sá, F.; Gomes, L.E.O.; Silva, C.A.; Lima, A.T.; Lehrback, B.D.; Neto, R.R. Can Severe Drought Periods Increase Metal Concentrations in Mangrove Sediments? A Case Study in Eastern Brazil. Sci. Total Environ. 2020, 748, 142443. [Google Scholar] [CrossRef]
  21. Guo, S.; Liu, Z.; Li, Q.; Yang, P.; Wang, L.; He, B.; Xu, Z.; Ye, J.; Zeng, E.Y. Leaching Heavy Metals from the Surface Soil of Reclaimed Tidal Flat by Alternating Seawater Inundation and Air Drying. Chemosphere 2016, 157, 262–270. [Google Scholar] [CrossRef] [PubMed]
  22. Bai, J.; Jia, J.; Zhang, G.; Zhao, Q.; Lu, Q.; Cui, B.; Liu, X. Spatial and Temporal Dynamics of Heavy Metal Pollution and Source Identification in Sediment Cores from the Short-Term Flooding Riparian Wetlands in a Chinese Delta. Environ. Pollut. 2016, 219, 379–388. [Google Scholar] [CrossRef] [PubMed]
  23. Zhao, J.; Gao, X.; Yang, J. Influences of Hydrological Regime on Heavy Metal and Salt Ion Concentrations in Intertidal Sediment from Chongming Dongtan, Changjiang River Estuary, China. Chin. J. Oceanol. Limnol. 2017, 35, 1329–1341. [Google Scholar] [CrossRef]
  24. Liu, G.; Wang, J.; Zhang, E.; Hou, J.; Liu, X. Heavy Metal Speciation and Risk Assessment in Dry Land and Paddy Soils Near Mining Areas at Southern China. Environ. Sci. Pollut. Res. 2016, 23, 8709–8720. [Google Scholar] [CrossRef]
  25. Teuchies, J.; Singh, G.; Bervoets, L.; Meire, P. Land Use Changes and Metal Mobility: Multi-Approach Study on Tidal Marsh Restoration in a Contaminated Estuary. Sci. Total Environ. 2013, 449, 174–183. [Google Scholar] [CrossRef]
  26. Liang, B.; Qian, X.; Peng, S.; Liu, X.; Bai, L.; Cui, B.; Bai, J. Speciation Variation and Comprehensive Risk Assessment of Metal(Loid)S in Surface Sediments of Intertidal Zones. Int. J. Environ. Res. Public Health 2018, 15, 2125. [Google Scholar] [CrossRef]
  27. Huang, L.; Bai, J.; Chen, B.; Zhang, K.; Huang, C.; Liu, P. Two-Decade Wetland Cultivation and its Effects on Soil Properties in Salt Marshes in the Yellow River Delta, China. Ecol. Inform. 2012, 10, 49–55. [Google Scholar] [CrossRef]
  28. Zhang, G.; Bai, J.; Zhao, Q.; Lu, Q.; Jia, J.; Wen, X. Heavy Metals in Wetland Soils Along a Wetland-Forming Chronosequence in the Yellow River Delta of China: Levels, Sources and Toxic Risks. Ecol. Indic. 2016, 69, 331–339. [Google Scholar] [CrossRef]
  29. Hafeez, F.; Zafar, N.; Nazir, R.; Javeed, H.M.R.; Rizwan, M.; Faridullah; Asad, S.A.; Iqbal, A. Assessment of Flood-Induced Changes in Soil Heavy Metal and Nutrient Status in Rajanpur, Pakistan. Environ. Monit. Assess. 2019, 191, 234. [Google Scholar] [CrossRef]
  30. Cui, B.; Yang, Q.; Zhang, K.; Zhao, X.; You, Z. Responses of Saltcedar (Tamarix chinensis) to Water Table Depth and Soil Salinity in the Yellow River Delta, China. Plant Ecol. 2010, 209, 279–290. [Google Scholar] [CrossRef]
  31. Zhao, Q.; Bai, J.; Gao, Y.; Zhang, G.; Lu, Q.; Jia, J. Heavy Metal Contamination in Soils from Freshwater Wetlands to Salt Marshes in the Yellow River Estuary, China. Sci. Total Environ. 2021, 774, 145072. [Google Scholar] [CrossRef]
  32. Khodaverdiloo, H.; Rahmanian, M.; Rezapour, S.; Dashtaki, S.G.; Hadi, H.; Han, F.X. Effect of Wetting-Drying Cycles on Redistribution of Lead in some Semi-Arid Zone Soils Spiked with a Lead Salt. Pedosphere 2012, 22, 304–313. [Google Scholar] [CrossRef]
  33. Feng, C.; Guo, X.; Yin, S.; Tian, C.; Li, Y.; Shen, Z. Heavy Metal Partitioning of Suspended Particulate Matter–Water and Sediment–Water in the Yangtze Estuary. Chemosphere 2017, 185, 717–725. [Google Scholar] [CrossRef] [PubMed]
  34. Ibragimow, A.; Walna, B.; Siepak, M. Effects of Flooding on the Contamination of Floodplain Sediments with Available Fractions of Trace Metals (Western Poland). Pol. J. Environ. Stud. 2013, 22, 131–140. [Google Scholar]
  35. Balint, R.; Said-Pullicino, D.; Ajmone-Marsan, F. Copper Dynamics Under Alternating Redox Conditions is Influenced by Soil Properties and Contamination Source. J. Contam. Hydrol. 2015, 173, 83–91. [Google Scholar] [CrossRef]
  36. Gaulier, C.; Zhou, C.; Gao, Y.; Guo, W.; Reichstädter, M.; Ma, T.; Baeyens, W.; Billon, G. Investigation on Trace Metal Speciation and Distribution in the Scheldt Estuary. Sci. Total Environ. 2021, 757, 143827. [Google Scholar] [CrossRef]
  37. Yao, X.; Wang, Z.; Li, D.; Sun, H.; Ren, C.; Yu, Y.; Pei, F.; Li, Y. Distribution, Mobilization, Risk Assessment and Source Identification of Heavy Metals and Nutrients in Surface Sediments of Three Urban-Rural Rivers After Long-Term Water Pollution Treatment. Sci. Total Environ. 2024, 932, 172894. [Google Scholar] [CrossRef]
  38. Yan, J.; Fischel, M.; Chen, H.; Siebecker, M.G.; Wang, P.; Zhao, F.; Sparks, D.L. Cadmium Speciation and Release Kinetics in a Paddy Soil as Affected by Soil Amendments and Flooding-Draining Cycle. Environ. Pollut. 2021, 268, 115944. [Google Scholar] [CrossRef]
  39. Fulda, B.; Voegelin, A.; Kretzschmar, R. Redox-Controlled Changes in Cadmium Solubility and Solid-Phase Speciation in a Paddy Soil as Affected by Reducible Sulfate and Copper. Environ. Sci. Technol. 2013, 47, 12775–12783. [Google Scholar] [CrossRef]
  40. Song, T.; Liu, C.; Cui, G.; Tong, S. Research on the Migration and Transformation Behaviors of Soil Selenium in the Flood Irrigation Process. Arch. Agron. Soil Sci. 2020, 67, 1388–1399. [Google Scholar] [CrossRef]
  41. Zhao, Q.; Bai, J.; Wang, X.; Zhang, W.; Huang, Y.; Wang, L.; Gao, Y. Soil Organic Carbon Content and Stock in Wetlands with Different Hydrologic Conditions in the Yellow River Delta, China. Ecohydrol. Hydrobiol. 2020, 20, 537–547. [Google Scholar] [CrossRef]
  42. Wang, J.; Wang, P.; Gu, Y.; Kopittke, P.M.; Zhao, F.; Wang, P. Iron–Manganese (Oxyhydro)Oxides, Rather than Oxidation of Sulfides, Determine Mobilization of Cd During Soil Drainage in Paddy Soil Systems. Environ. Sci. Technol. 2019, 53, 2500–2508. [Google Scholar] [CrossRef] [PubMed]
  43. Korfali, S.I.; Karaki, H. Speciation of Metals in Soils and Water: Risk Assessment. Environ. Process. 2018, 5, 101–125. [Google Scholar] [CrossRef]
  44. Li, H.; Ji, H. Chemical Speciation, Vertical Profile and Human Health Risk Assessment of Heavy Metals in Soils from Coal-Mine Brownfield, Beijing, China. J. Geochem. Explor. 2017, 183, 22–32. [Google Scholar] [CrossRef]
  45. Laurent, C.; Bravin, M.N.; Crouzet, O.; Pelosi, C.; Tillard, E.; Lecomte, P.; Lamy, I. Increased Soil Ph and Dissolved Organic Matter after a Decade of Organic Fertilizer Application Mitigates Copper and Zinc Availability Despite Contamination. Sci. Total Environ. 2020, 709, 135927. [Google Scholar] [CrossRef]
  46. Emmanuel, S.; Erel, Y. Implications from Concentrations and Isotopic Data for Pb Partitioning Processes in Soils. Geochim. Cosmochim. Acta 2002, 66, 2517–2527. [Google Scholar] [CrossRef]
  47. Wang, C.; Wang, J.; Zhao, Y.; Zhong, C. The Vertical Migration and Speciation of the Pb in the Paddy Soil: A Case Study of the Yangtze River Delta, China. Environ. Res. 2019, 179, 108741. [Google Scholar] [CrossRef]
  48. Xiao, S.; Luo, M.; Liu, Y.; Bai, J.; Yang, Y.; Zhai, Z.; Huang, J. Rhizosphere Effect and its Associated Soil-Microbe Interactions Drive Iron Fraction Dynamics in Tidal Wetland Soils. Sci. Total Environ. 2021, 756, 144056. [Google Scholar] [CrossRef]
  49. Li, Q.; Liu, Y.; Du, Y.; Cui, Z.; Shi, L.; Wang, L.; Li, H. The Behavior of Heavy Metals in Tidal Flat Sediments During Fresh Water Leaching. Chemosphere 2011, 82, 834–838. [Google Scholar] [CrossRef]
Figure 1. The sampling areas of sediment cores.
Water 17 01038 g001
Figure 2. The schematic diagram of the incubation experiment under different hydrodynamic regimes. The blue line is water level line.
Water 17 01038 g002
Figure 3. Heavy metal concentration under different hydrological regimes, salt conditions, and different incubation times. Notes: N, No flooding; P, Periodic flooding; L, Long-term flooding; S0, 0‰; S5, 5‰; S10, 10‰; S20, 20‰; and S30, 30‰.
Water 17 01038 g003
Figure 4. RAC of heavy metals under different hydrological regimes, salt conditions, and different incubation times. Notes: N, No flooding; P, Periodic flooding; L, Long-term flooding; S0, 0‰; S5, 5‰; S10, 10‰; S20, 20‰; S30, and 30‰.
Water 17 01038 g004
Table 3. The proportion of four metal fractions under different hydrological regimes, salt conditions, and different incubation times.
MetalFractionOriginal SamplesHydrological RegimesSaltFirst WeekThird WeekFifth WeekSeventh WeekNinth Week
NPL0‰5‰10‰20‰30‰
CdF162.59%51.73%56.27%54.71%51.89%55.77%54.95%54.86%54.71%45.31%58.06%49.15%57.71%61.86%
F215.68%10.38%13.14%11.20%11.82%11.56%11.49%10.83%13.04%9.13%12.79%9.31%15.17%11.89%
F35.01%10.91%6.01%8.65%10.43%8.07%6.42%9.35%7.09%2.77%3.52%19.52%8.50%7.47%
F416.72%26.97%24.58%25.43%25.86%24.59%27.14%24.96%25.16%42.79%25.63%22.02%18.63%18.78%
CrF10.13%0.17%0.17%0.18%0.16%0.17%0.18%0.17%0.20%0.18%0.14%0.23%0.14%0.17%
F20.91%1.22%1.07%1.13%1.18%1.18%1.12%1.11%1.04%1.36%0.87%0.95%1.07%1.41%
F310.14%15.85%12.07%13.29%14.77%14.25%12.75%12.63%13.49%37.78%7.84%7.62%5.81%8.87%
F488.81%82.76%86.70%85.39%83.89%84.39%85.95%86.09%85.26%60.68%91.15%91.20%92.97%89.54%
CuF10.46%1.17%1.08%1.33%1.13%1.24%1.22%1.27%1.09%1.32%1.30%1.15%1.41%0.81%
F24.43%12.05%10.06%11.91%10.87%11.65%11.76%11.53%10.31%8.71%9.68%13.36%15.10%9.59%
F328.72%31.01%28.10%27.50%29.35%29.96%28.66%27.35%28.04%37.25%29.21%19.87%33.36%23.89%
F466.39%55.68%60.60%59.16%58.54%57.04%58.26%59.72%60.42%52.72%59.80%65.63%50.13%65.13%
PbF10.73%1.72%1.89%1.88%1.91%1.79%1.85%1.74%1.94%1.74%2.17%1.94%2.62%0.73%
F223.47%32.44%33.49%31.76%32.49%31.99%32.10%32.49%34.41%31.32%41.05%31.92%37.50%21.08%
F38.79%15.73%13.74%18.35%16.79%14.68%15.99%17.96%13.54%10.18%10.89%28.24%24.79%5.68%
F467.01%50.11%50.87%48.01%48.81%51.55%50.06%47.80%50.11%56.76%45.89%37.91%35.10%72.51%
ZnF15.73%6.45%6.91%5.39%6.33%6.77%5.53%5.91%6.84%4.28%6.38%5.16%10.94%4.41%
F210.04%12.05%12.95%11.19%12.52%11.28%11.66%12.02%13.22%6.86%12.84%11.45%21.84%7.32%
F317.67%26.92%27.74%26.28%28.31%26.14%25.27%27.20%28.51%14.28%18.70%34.44%48.64%18.86%
F466.57%54.58%52.40%57.13%52.84%55.81%57.53%54.86%51.43%74.57%62.08%48.95%18.58%69.38%
Disclaimer/Publisher’s Note: The statements, opinions and data contained in all publications are solely those of the individual author(s) and contributor(s) and not of MDPI and/or the editor(s). MDPI and/or the editor(s) disclaim responsibility for any injury to people or property resulting from any ideas, methods, instructions or products referred to in the content.

