
Analysing the Water–Energy Nexus Considering Rainwater Harvesting in Buildings


Abstract

1. Introduction
2. Method
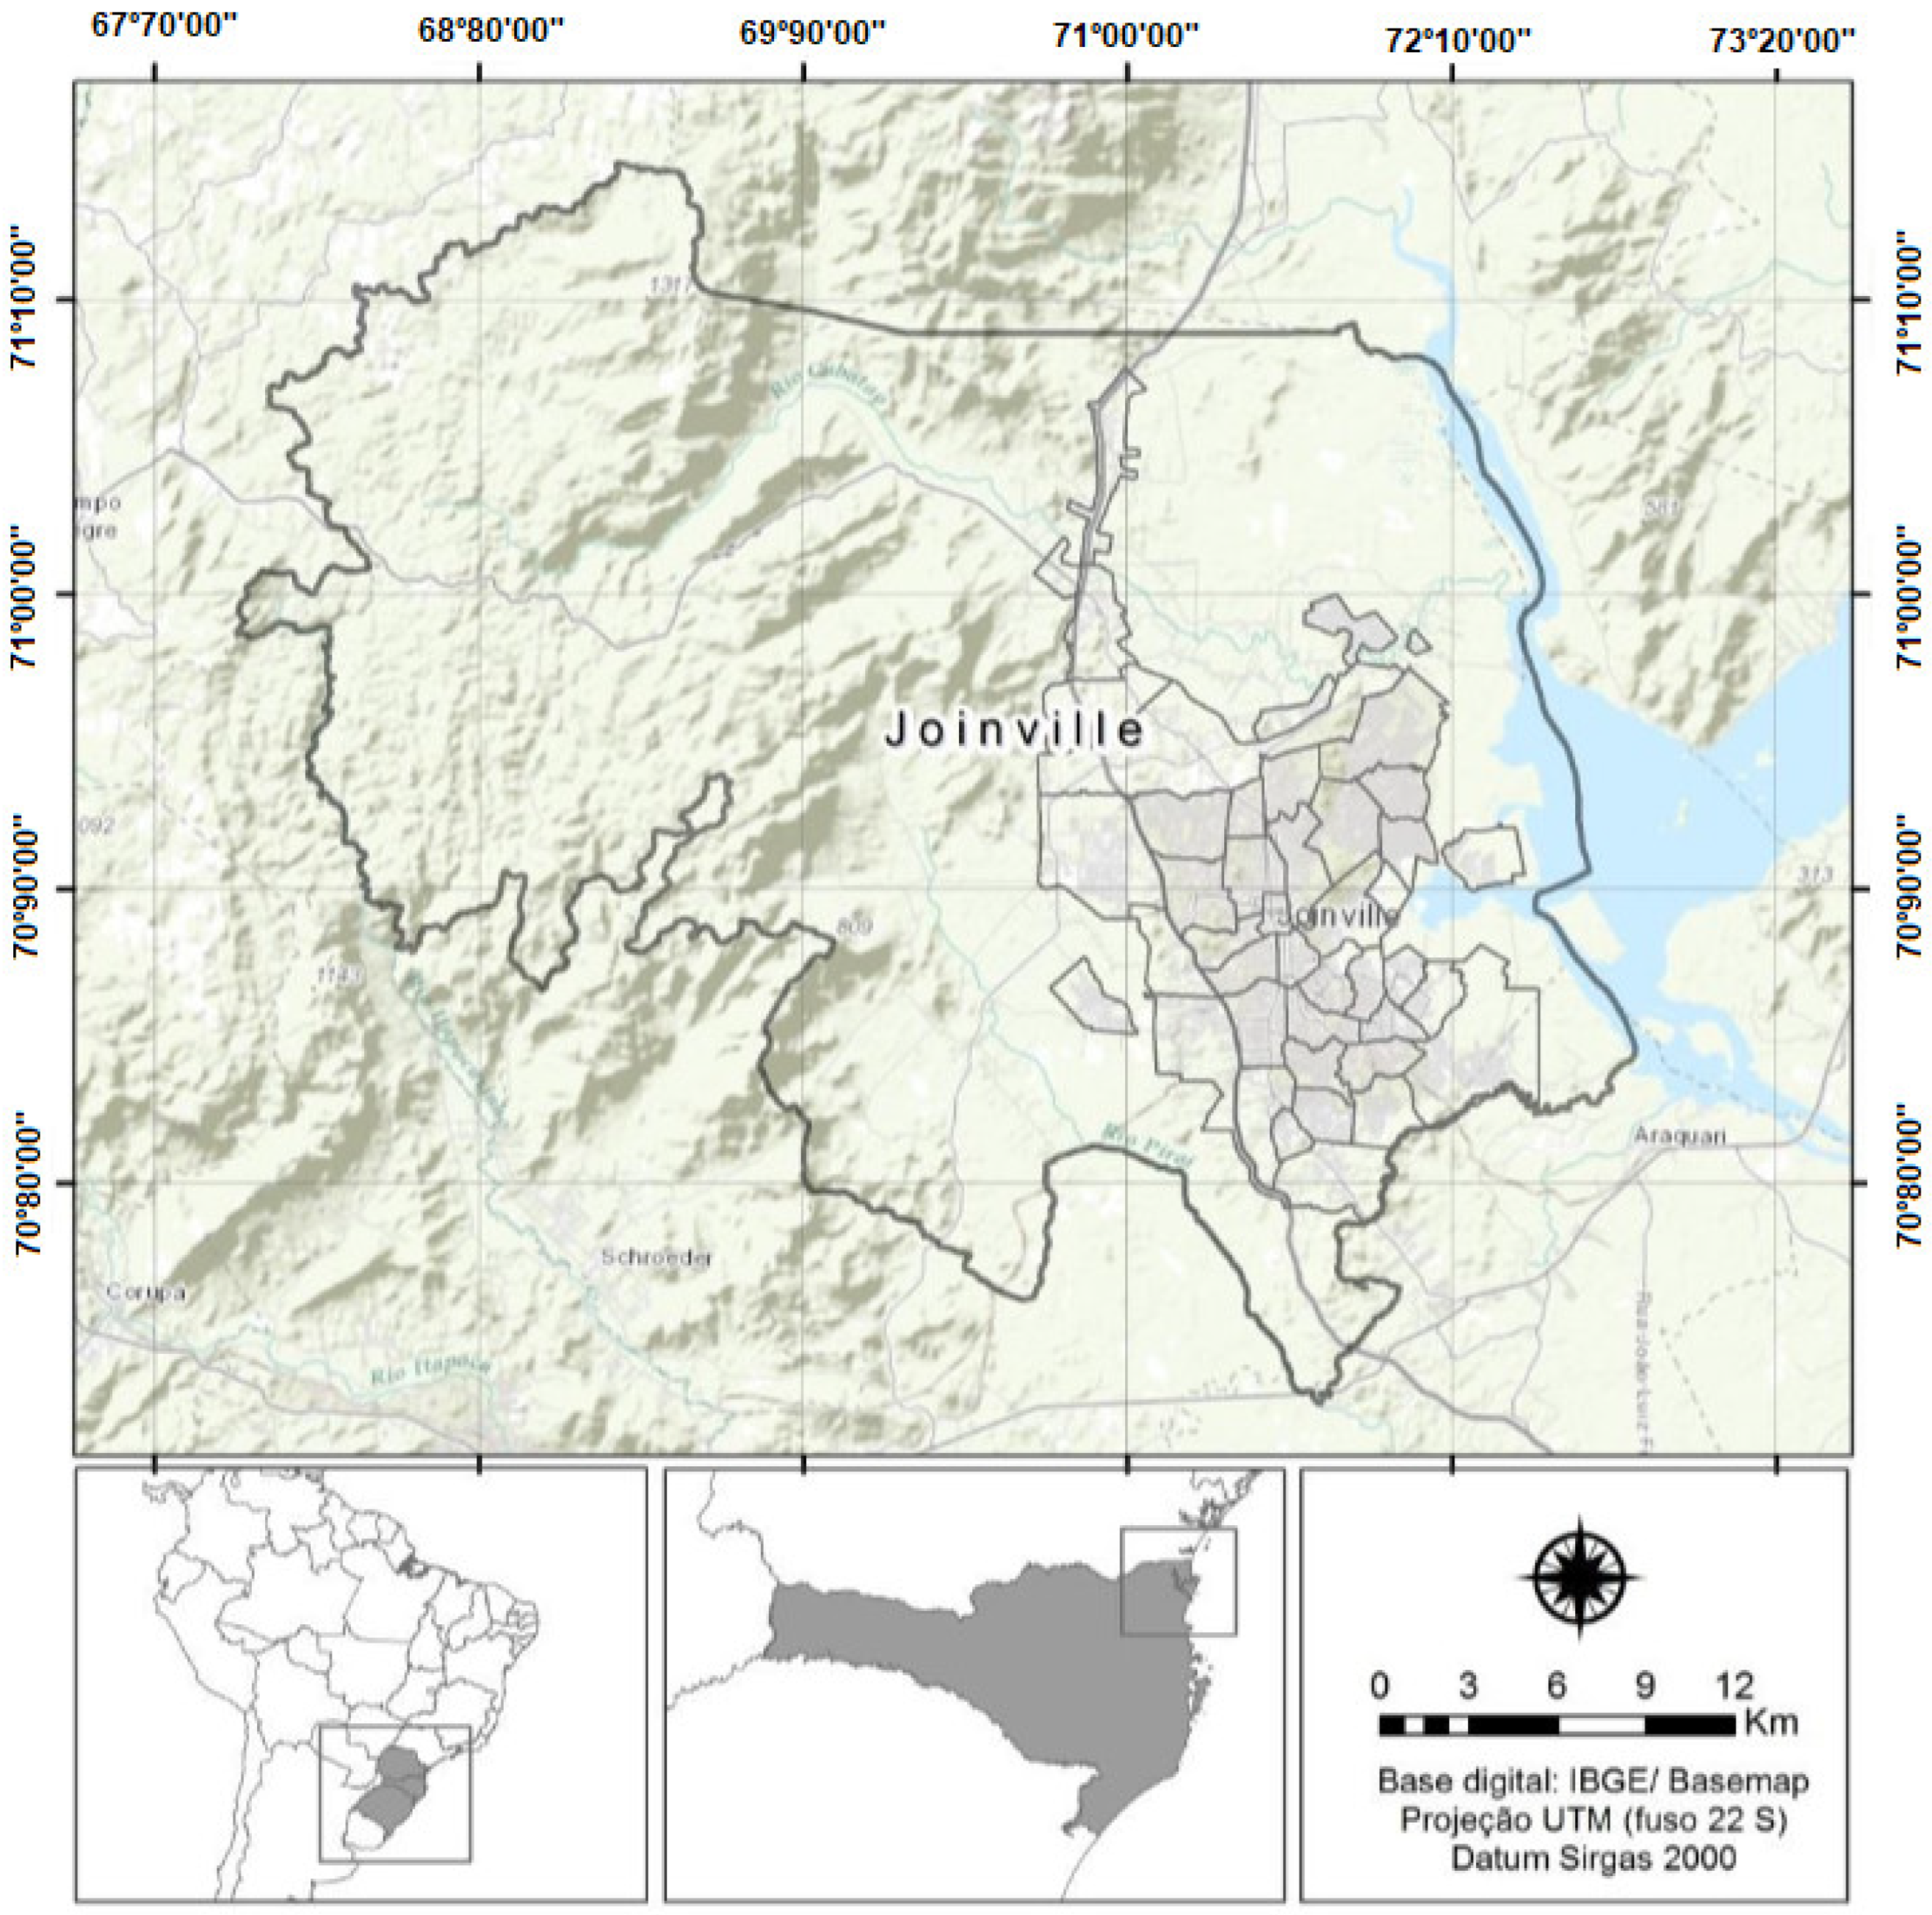
2.1. Study Area
2.2. Data Collection of Buildings
2.3. Building Classification by Typology
2.4. Representative Model for Each Building Typology
2.5. Netuno Programme Simulations
2.5.1. Rainfall Data
2.5.2. Surface Runoff Coefficient
2.5.3. Total Water Demand and Number of Occupants
2.5.4. Rainwater Demand
2.5.5. Upper and Lower Water Tank Capacities
2.5.6. Water–Energy Nexus
3. Results and Discussion
3.1. Representative Model
3.2. Rainwater Harvesting
3.2.1. Input Data in the Netuno Programme
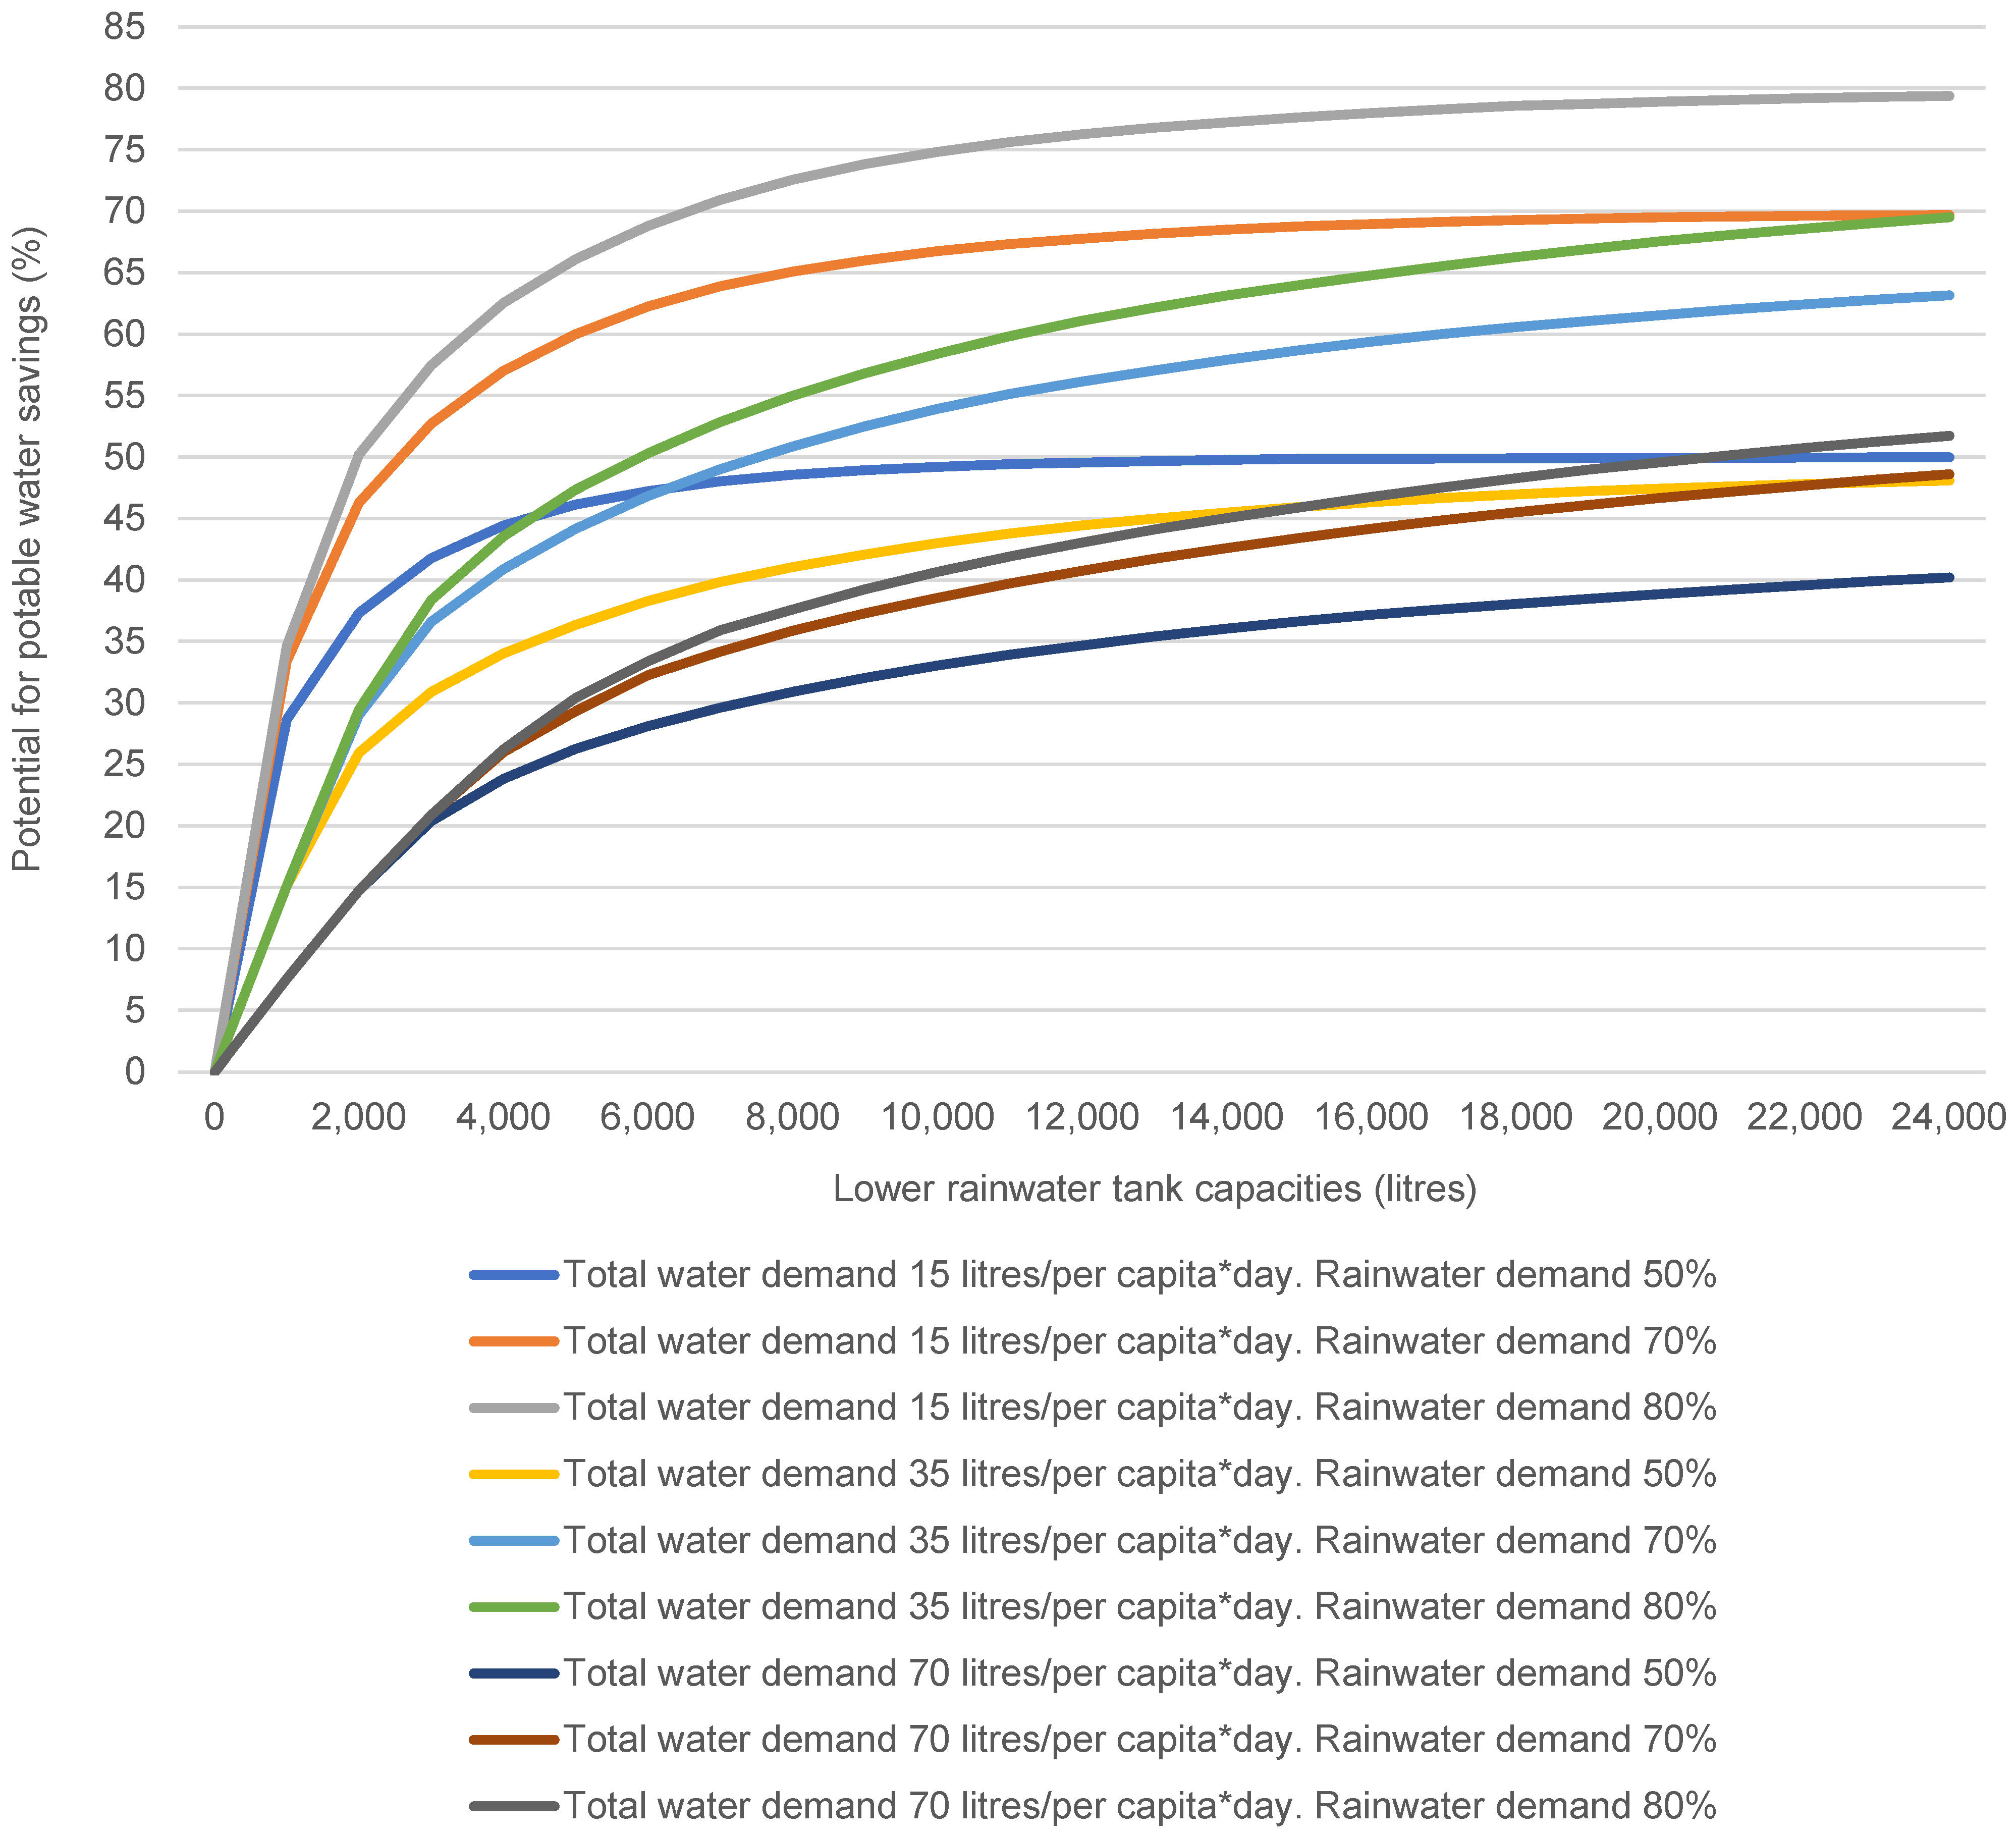
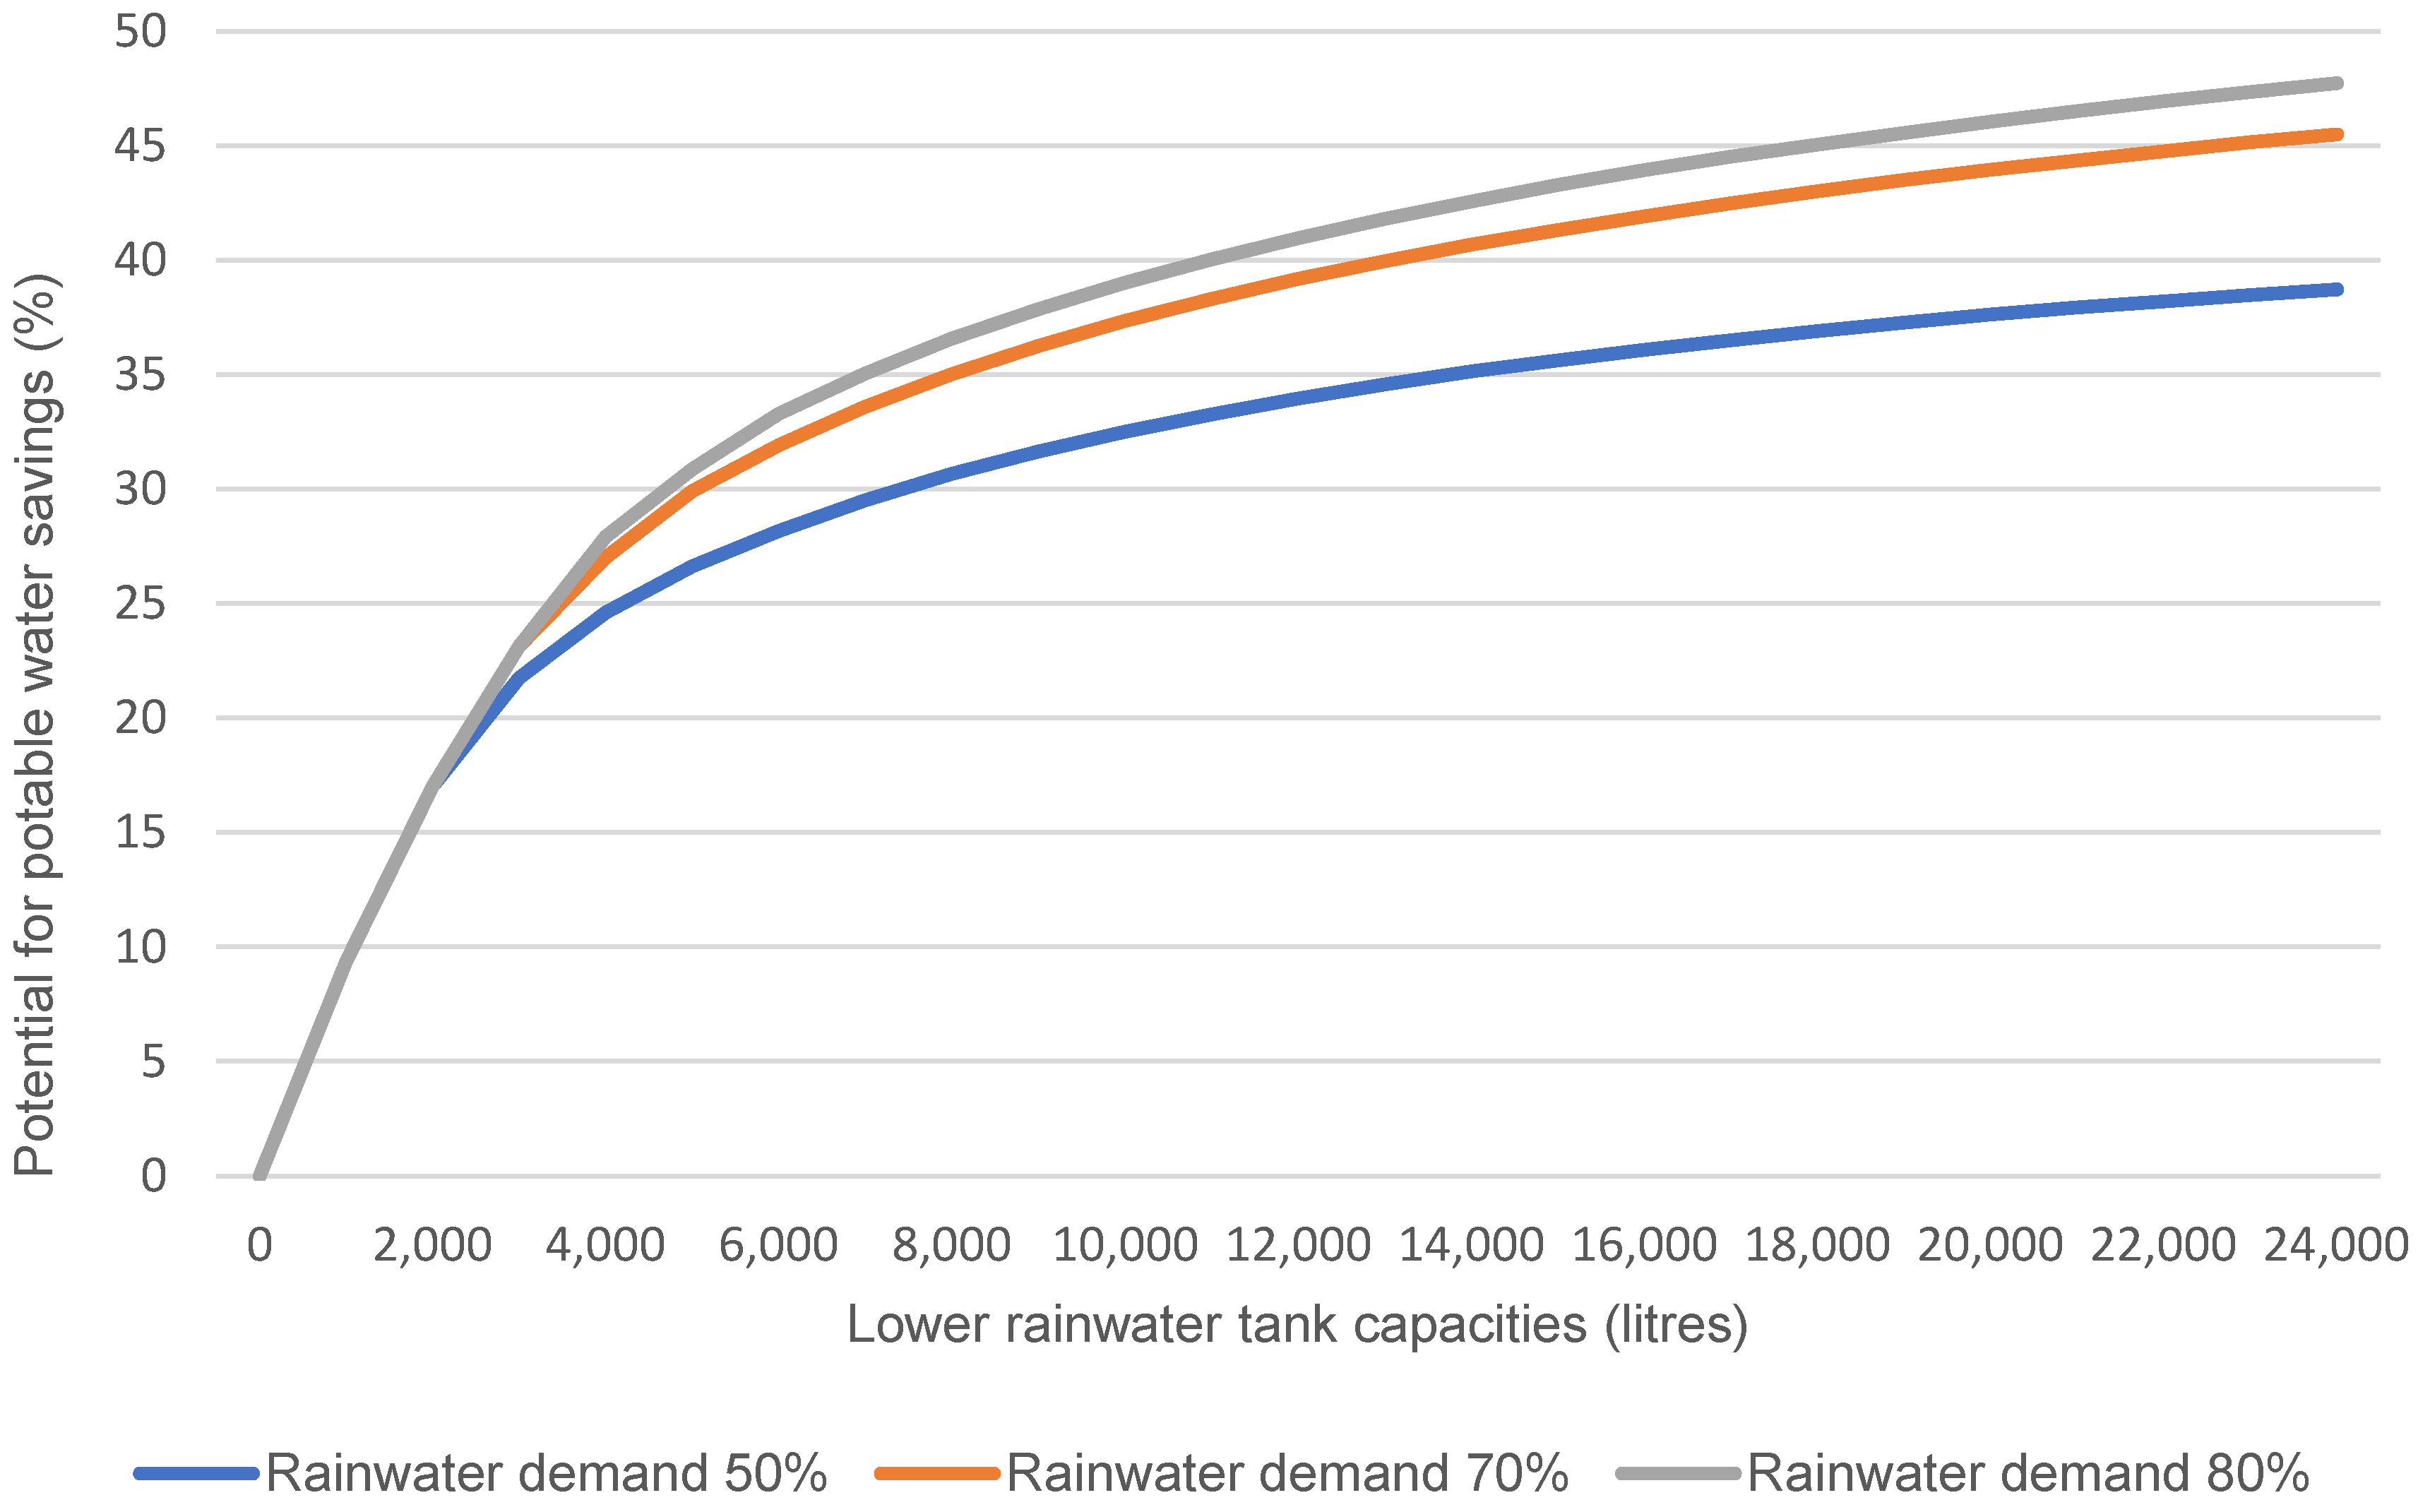
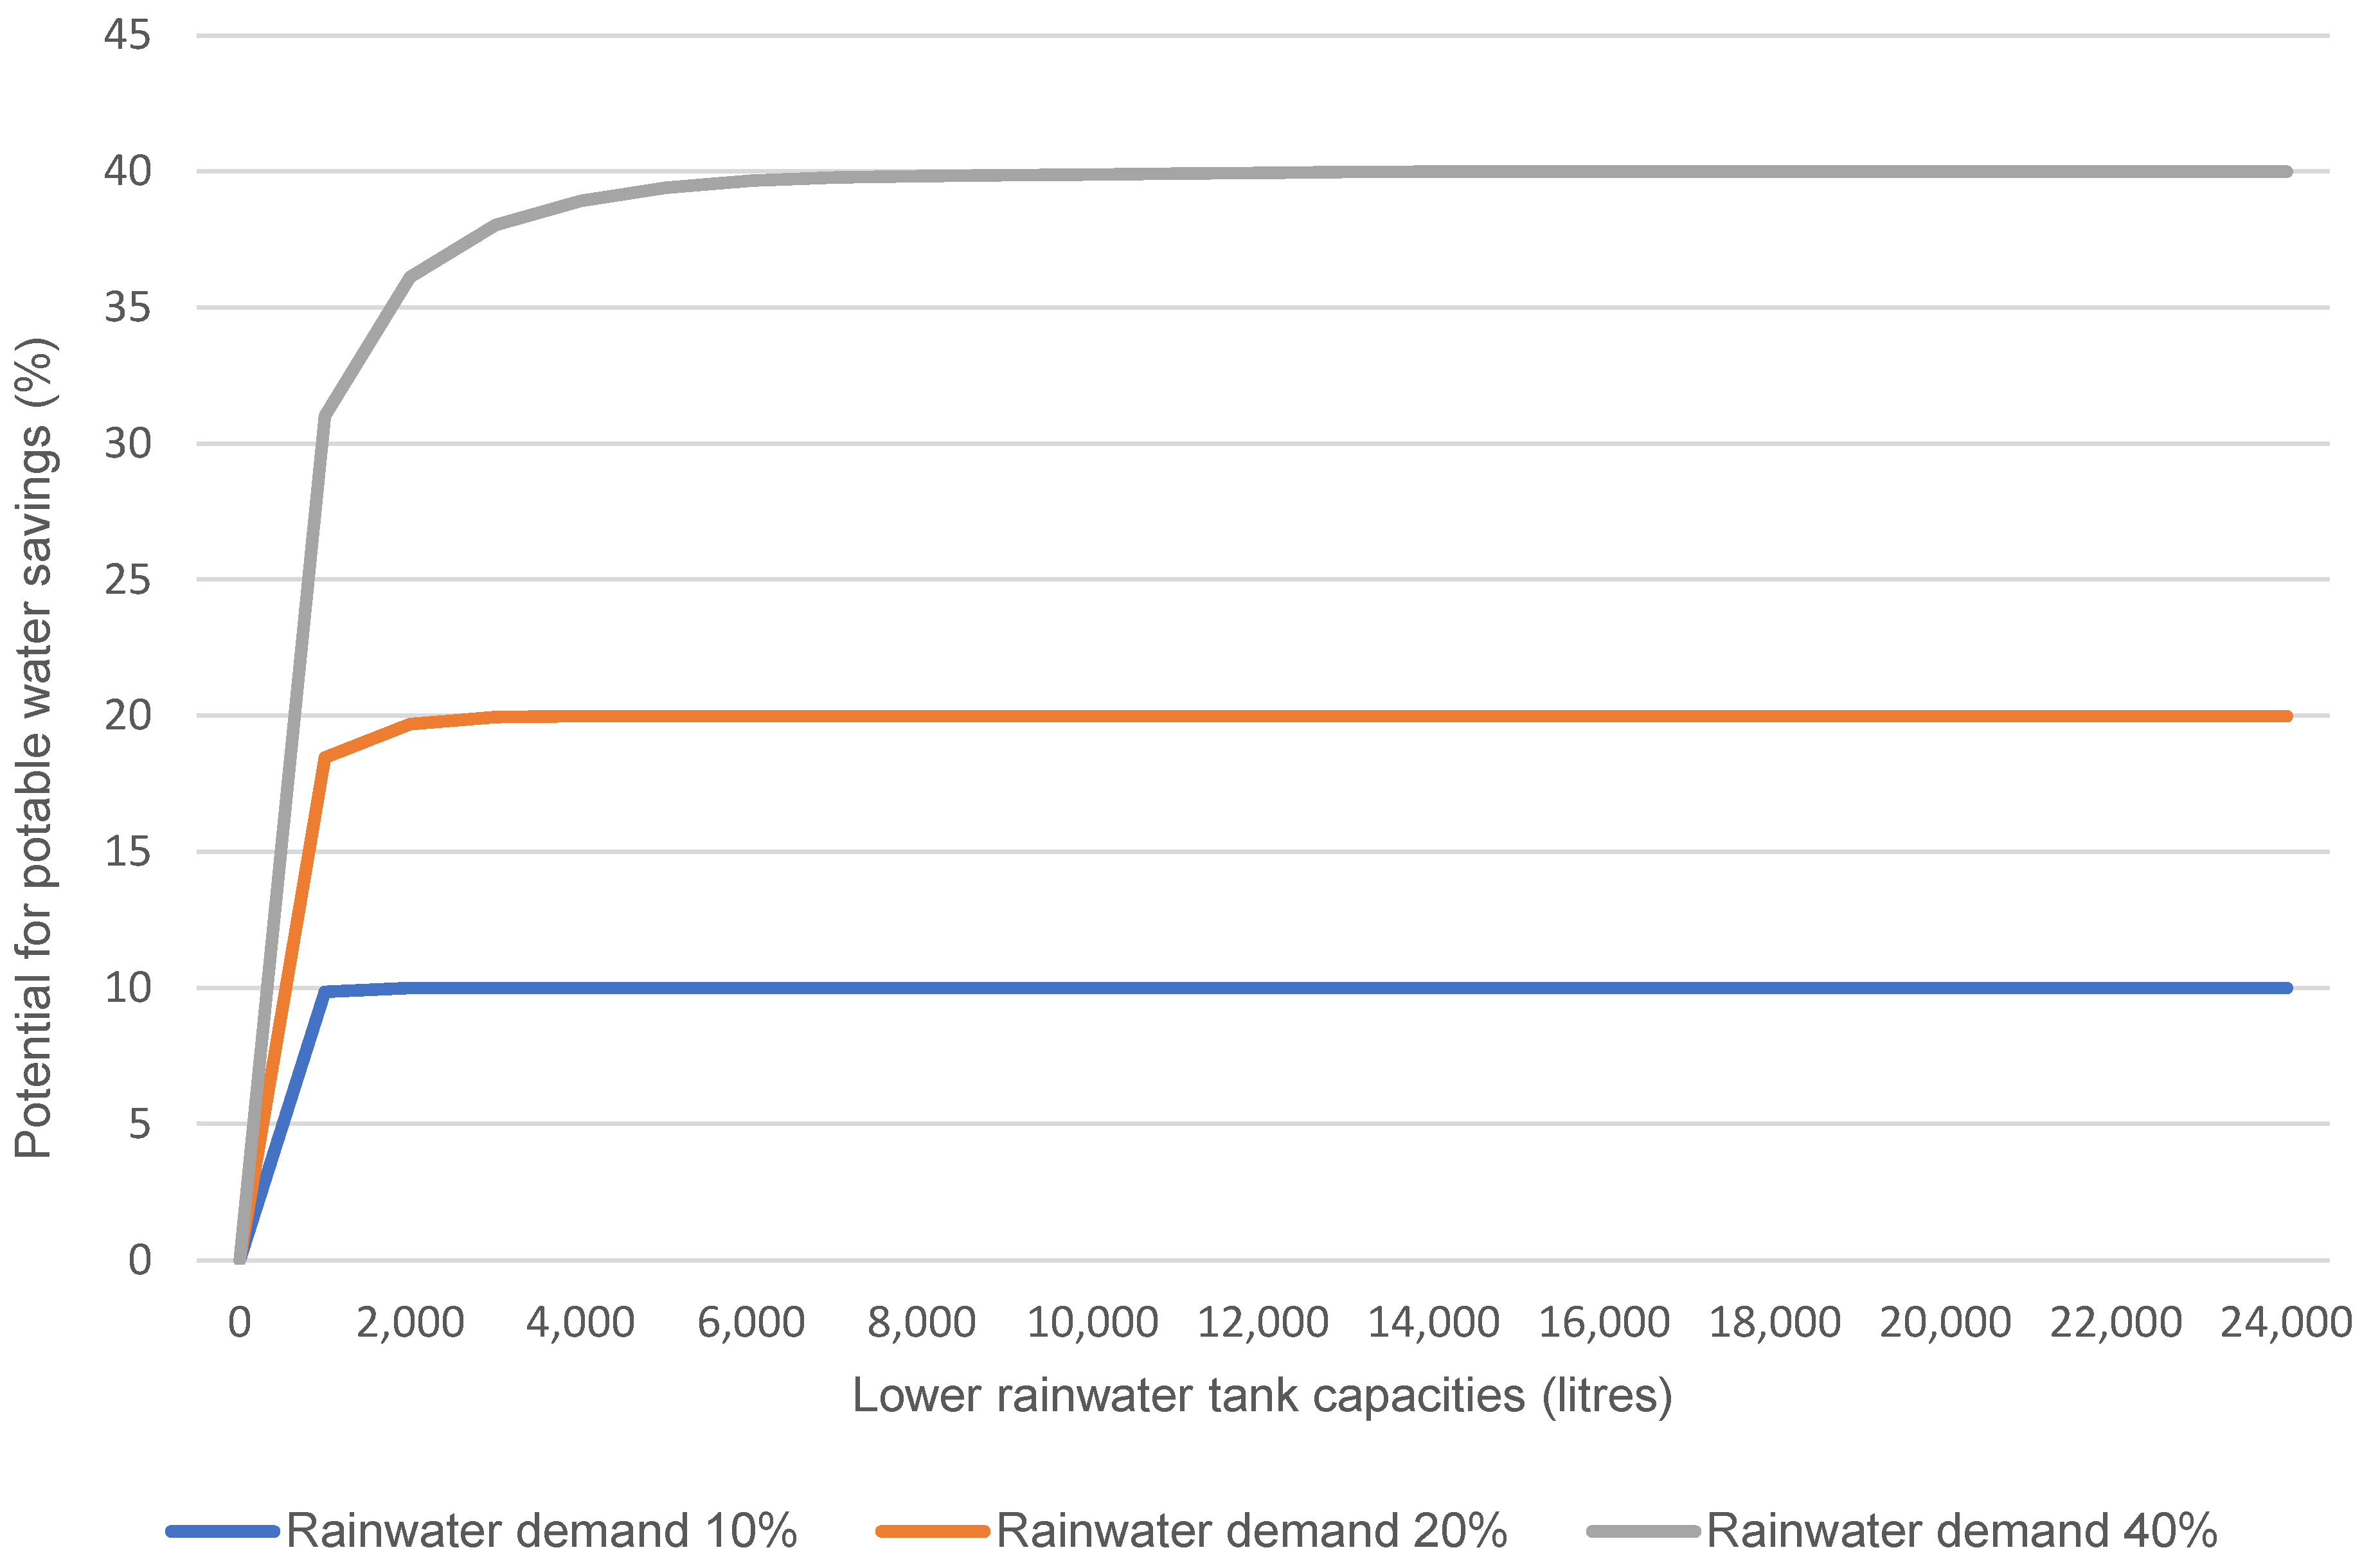
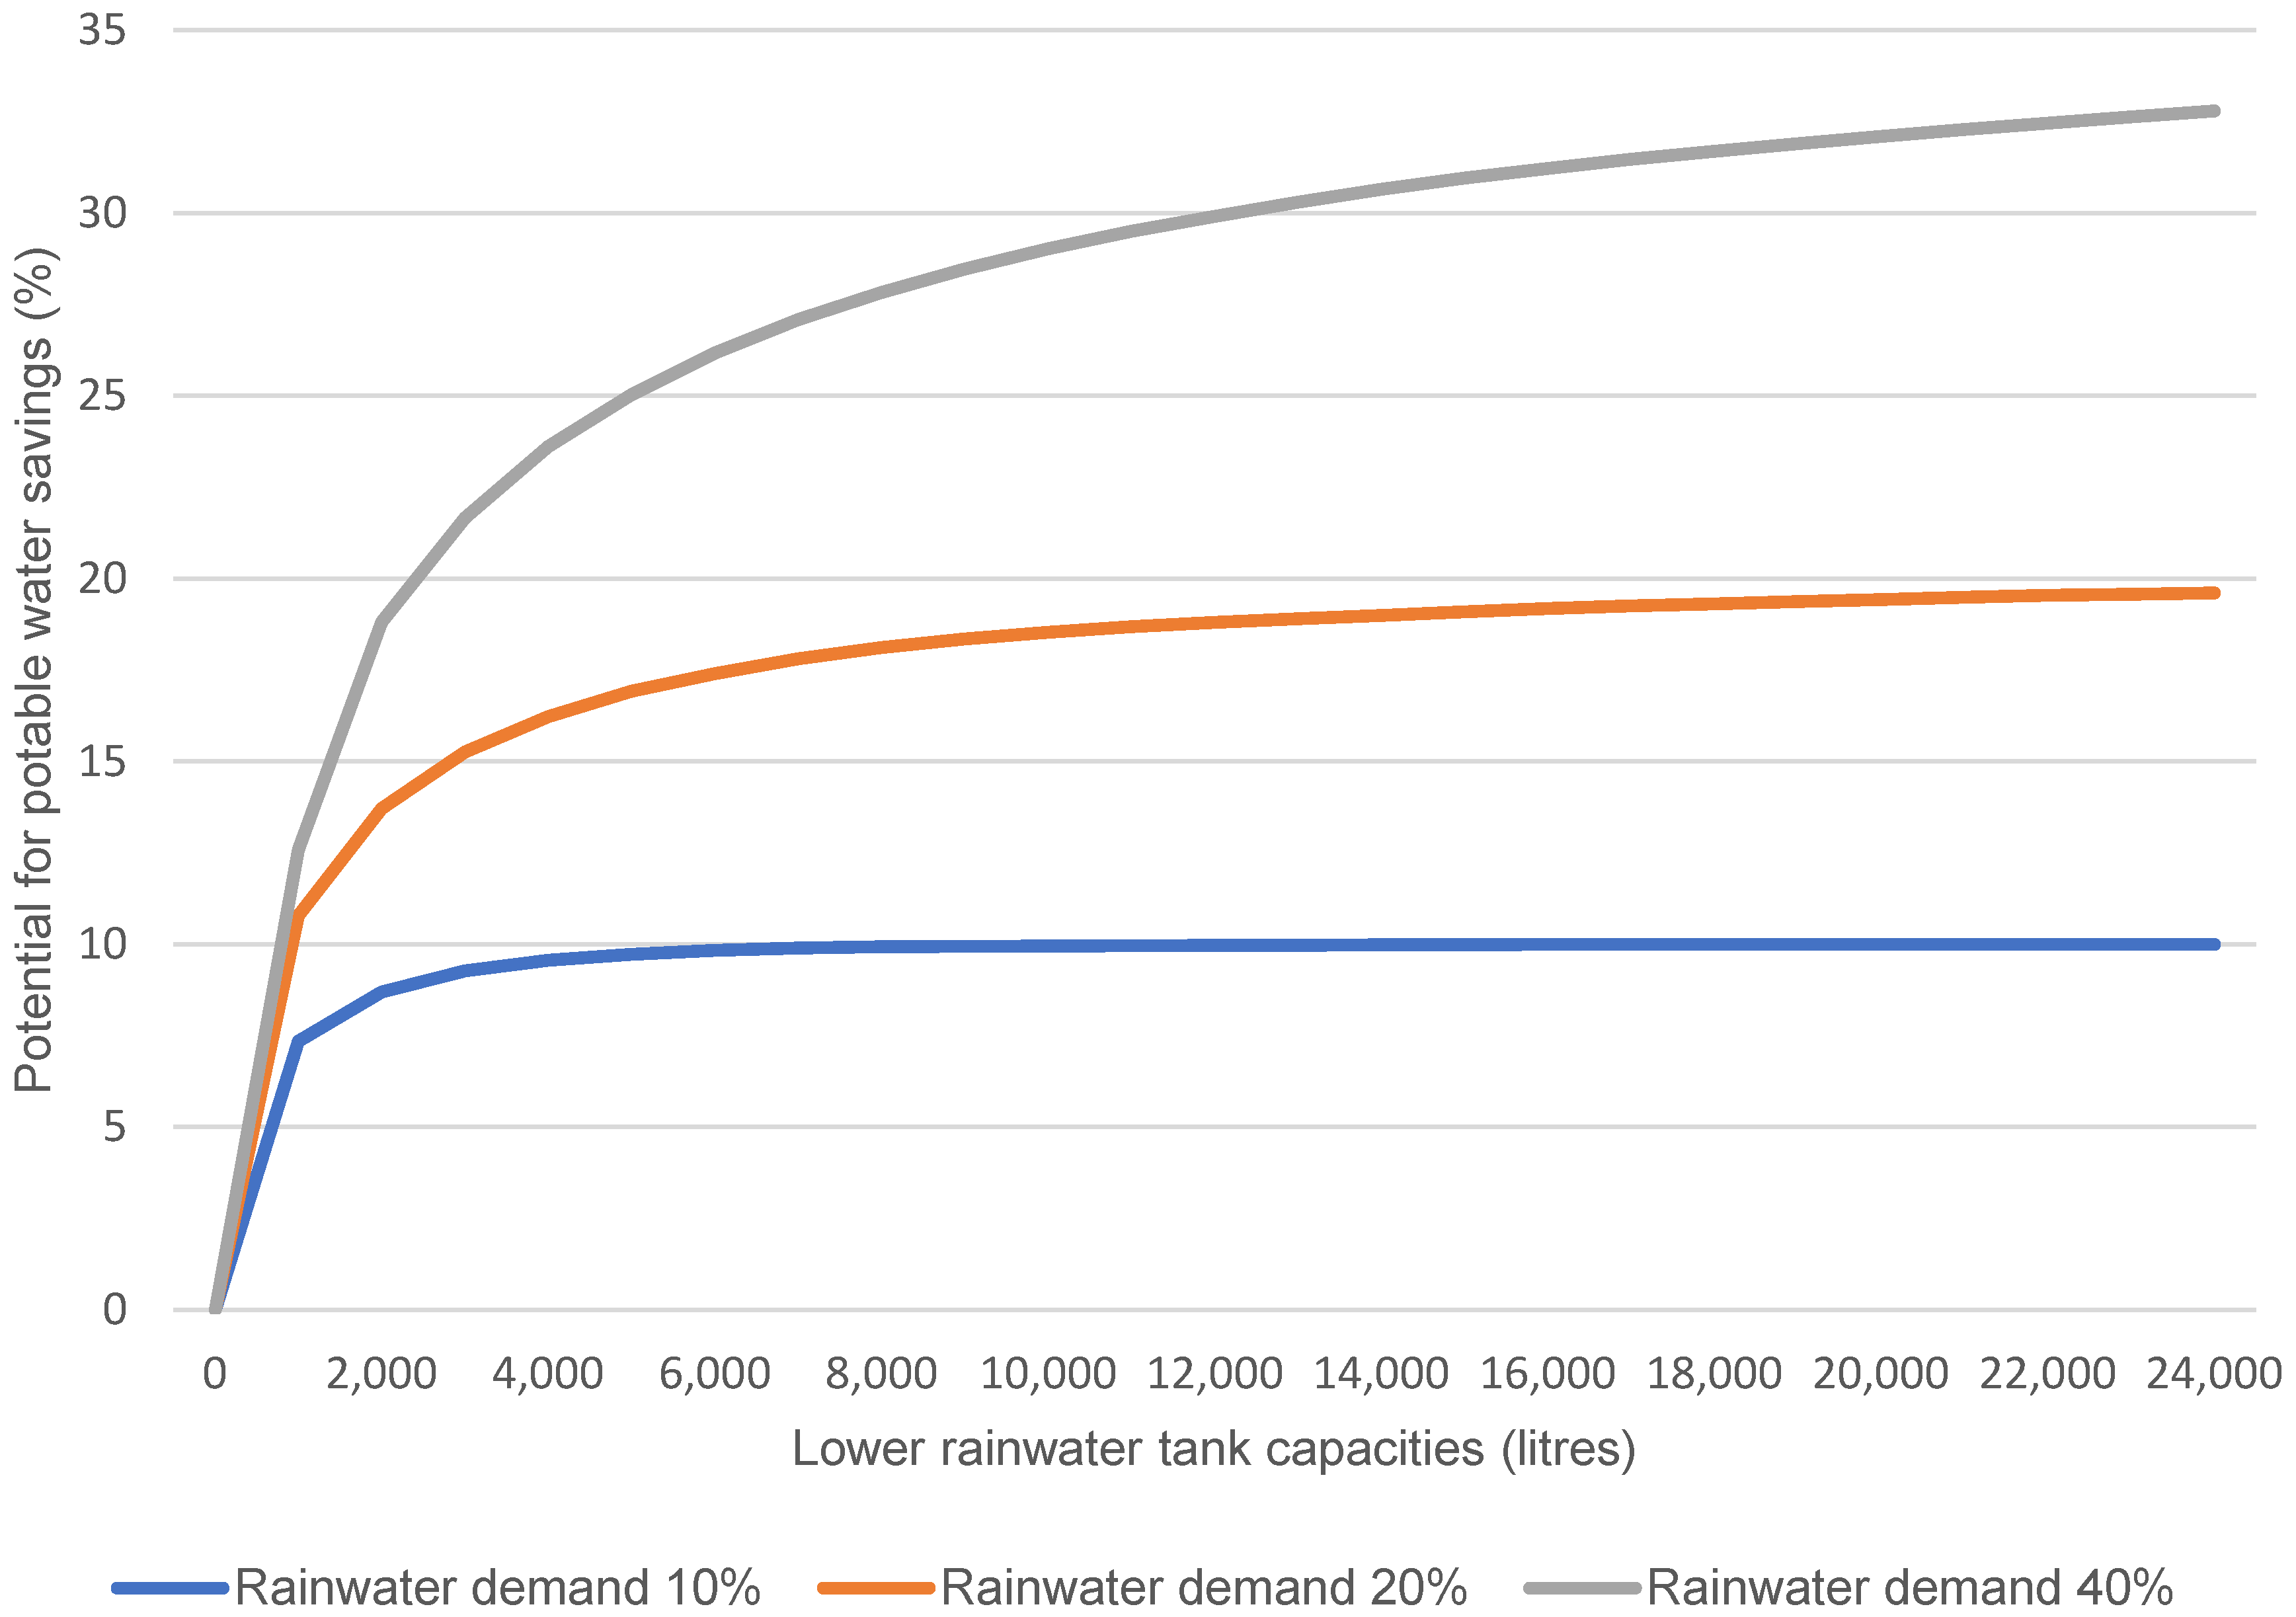
3.2.2. Simulations in the Netuno Programme
3.3. Water–Energy Nexus Analysis
4. Conclusions
Author Contributions
Funding
Data Availability Statement
Conflicts of Interest
References
- UNESCO. The United Nations World Water Development Report 2020: Water and Climate Change. UN-Water. 2020. Available online: https://unesdoc.unesco.org/ark:/48223/pf0000372985 (accessed on 17 October 2024).
- Fernandes, D.R.M.; Medeiros Neto, V.B.; Mattos, K.M.d.C. Viabilidade econômica do uso da água da chuva: Um estudo de caso da implantação de cisterna na UFRN/RN. In Proceedings of the Anais do XXVII Encontro Nacional de Engenharia de Produção (ENEGEP), Foz do Iguaçu, Brazil, 9–11 October 2007; p. 17. [Google Scholar]
- Teston, A.; Ghisi, E.; Martins Vaz, I.C.; Carvalho, J.W.L.T.; Mayer, D.; Teixeira, C.A. Water Balance Modelling as a Tool for Assessing the Environmental Impact of Urban Water Systems and Water Consumption in Buildings. J. Water Resour. Plan. Manag. 2023, 151, 4247883. [Google Scholar] [CrossRef]
- Custódio, D.A.; Ghisi, E. Potential for potable water savings using rainwater: A case study in a university building in Southern Brazil. Urban Water J. 2024, 21, 251–258. [Google Scholar] [CrossRef]
- Silva, M.C.S.R.; Vaz, I.C.M.; Ghisi, E. Rainwater Harvesting in Social Housing: An Analysis Across Twelve Cities in Brazil. Environ. Earth Sci. Proc. 2025, 32, 4. [Google Scholar] [CrossRef]
- Zhang, L.; Njepu, A.; Xia, X. Minimum cost solution to residential energy-water nexus through rainwater harvesting and greywater recycling. J. Clean. Prod. 2021, 298, 126742. [Google Scholar] [CrossRef]
- Vieira, A.S.; Ghisi, E. Water–energy nexus in houses in Brazil: Comparing rainwater and gray water use with a centralized system. Water Supply 2016, 16, 274–283. [Google Scholar] [CrossRef]
- Wanjiru, E.; Xia, X. Sustainable energy-water management for residential houses with optimal integrated grey and rainwater recycling. J. Clean. Prod. 2018, 170, 1151–1166. [Google Scholar] [CrossRef]
- Cureau, R.J.; Ghisi, E. Electricity savings by reducing water consumption in a whole city: A case study in Joinville, Southern Brazil. J. Clean. Prod. 2020, 261, 121194. [Google Scholar] [CrossRef]
- Njepu, A.; Zhang, L.; Xia, X. Optimal tank sizing and operation of energy-water supply systems in residences. Energy Procedia 2019, 159, 352–357. [Google Scholar] [CrossRef]
- Marteleira, R.; Niza, S. Does rainwater harvesting pay? Water–energy nexus assessment as a tool to achieve sustainability in water management. J. Water Clim. Change 2018, 9, 480–489. [Google Scholar] [CrossRef]
- Jones, E.C.; Leibowicz, B.D. Co-optimization and community: Maximizing the benefits of distributed electricity and water technologies. Sustain. Cities Soc. 2021, 64, 102515. [Google Scholar] [CrossRef]
- Hong, Y.; Park, J.; Ha, Y. Trade-offs between water security and energy use: Lifecycle energy of water supply options in Paju, Korea. J. Clean. Prod. 2023, 423, 138601. [Google Scholar] [CrossRef]
- Jacque, H.; Mozafari, B.; Dereli, R.K.; Cotterill, S. Implications of water conservation measures on urban water cycle: A review. Sustain. Prod. Consum. 2024, 50, 571–586. [Google Scholar] [CrossRef]
- Silva, A.C.R.d.S.; Bimbato, A.M.; Balestieri, J.A.P.; Vilanova, M.R.N. Exploring environmental, economic and social aspects of rainwater harvesting systems: A review. Sustain. Cities Soc. 2022, 76, 103475. [Google Scholar] [CrossRef]
- Joinville. Lei Complementar n. 492 de 8 de Dezembro de 2017. Altera Dispositivo da Lei Complementar nº 220, de 3 de Outubro de 2006, que Dispõe Sobre o Reaproveitamento de Águas Pluviais nos Casos Que Especifica. Joinville: Câmara Municipal. 2017. Available online: https://leismunicipais.com.br/a1/sc/j/joinville/lei-complementar/2017/49/492/lei-complementar-n-492-2017-altera-dispositivo-da-lei-complementar-n-220-de-3-de-outubro-de-2006-que-dispoe-sobre-o-reaproveitamento-de-aguas-pluviais-nos-casos-que-especifica (accessed on 22 October 2024).
- IBGE—Instituto Brasileiro de Geografia e Estatística. Cidades@. 2024. Available online: https://cidades.ibge.gov.br/brasil/sc/joinville/panorama (accessed on 20 September 2024).
- Mello, Y. Distribuição de Precipitação no Município de Joinville (SC) e sua Relação com a Incidência de Leptospirose. Master’s Thesis, Universidade da Região de Joinville, Joinville, Brazil, 2015. [Google Scholar]
- Barros, V.G.; Oliveira, B.G.; Oliveira, T.; Santos, L.K.; Nass, D.N.; Macedo, A.T.; Melo, Y.R.; Macedo, A.T.; Vieira, C.V. Extremos físico-químicos do Rio Cubatão Norte–Joinville, SC: A bacia nos ambientes urbano e rural. In Proceedings of the Anais Simpósio Brasileiro de Recursos Hídricos (ABRH), Maceió, Brazil, 27 November 2011–1 December 2011; p. 19. [Google Scholar]
- Oliveira, T.M.N.; Ribeiro, J.M.G.; Barros, V.G.; Simm, M.; Mello, Y.R.; Zeh, K.K. Bacias Hidrográficas da região de Joinville: Gestão de dados; Editora Univille: Joinville, Brazil, 2017. [Google Scholar]
- Campioli, P.F.; Vieira, C.V. Avaliação do Risco a Inundação na Bacia Hidrográfica do Rio Cubatão do Norte, Joinville/SC. Rev. Bras. Geogr. Física 2019, 12, 124–138. [Google Scholar]
- BECKER, J.L. Estatística Básica. Porto Alegre: Bookman, 2015. E-book. p. 74. ISBN 9788582603130. Available online: https://app.minhabiblioteca.com.br/reader/books/9788582603130/ (accessed on 28 March 2025).
- Cureau, R.J. Potencial de Economia de Energia Elétrica Decorrente da Redução do Consumo de água Potável em Joinville/SC. Master’s Thesis, Universidade Federal de Santa Catarina, Florianópolis, Brazil, 2019. [Google Scholar]
- Crespo, A.A. Estatística Fácil; Saraiva Educação: São Paulo, Brazil, 2017. [Google Scholar]
- Hair, J.F., Jr.; Black, W.C.; Babin, B.J.; Anderson, R.E.; Tatham, R.L. Análise Multivariada de Dados, 6th ed.; E-book; Bookman: Porto Alegre, Brazil, 2009; ISBN 9788577805341. Available online: https://app.minhabiblioteca.com.br/reader/books/9788577805341/ (accessed on 23 October 2024).
- Ghisi, E.; Cordova, M.M. Netuno 4: Manual do usuário. Universidade Federal de Santa Catarina—UFSC. 2014. Available online: https://labeee.ufsc.br/sites/default/files/Manual-Netuno-4_Junho2014.pdf (accessed on 23 October 2024).
- ABNT—Associação Brasileira de Normas Técnicas. NBR 15.527: Aproveitamento de Água de Chuva de Coberturas Para Fins Não Potáveis—Requisitos; ABNT: Rio de Janeiro, Brazil, 2019; 14p. [Google Scholar]
- Ribeiro, A.K.M.; Marinoski, D.L. Estudo sobre materiais para coberturas utilizadas em sistemas de aproveitamento de água pluvial residenciais. Mix. Sustentável 2020, 6, 53–66. Available online: https://ojs.sites.ufsc.br/index.php/mixsustentavel/article/view/4080 (accessed on 28 March 2025).
- Farina, M.; Maglionico, M.; Pollastri, M.; Stojkov, I. Water consumptions in public schools. Procedia Eng. 2011, 21, 929–938. [Google Scholar] [CrossRef]
- Kammers, P.C.; Ghisi, E. Usos finais de água em edifícios públicos localizados em Florianópolis, SC. Ambiente Construído 2006, 6, 75–90. [Google Scholar]
- Mierzwa, J.C.; Hespanhol, I.; Silva, M.D.; Rodrigues, L.B. Águas Pluviais: Método de cálculo do reservatório e conceitos para um aproveitamento adequado. Rev. De Gestão De Águas Da América Lat. 2007, 4, 29–37. [Google Scholar]
- Proença, L.C.; Ghisi, E. Water end-uses in Brazilian office buildings. Resour. Conserv. Recycl. 2010, 54, 489–500. [Google Scholar] [CrossRef]
- Marinoski, A.K.; Vieira, A.S.; Silva, A.S.; Ghisi, E. Water end-uses in low-income houses in Southern Brazil. Water 2014, 6, 1985–1999. [Google Scholar] [CrossRef]
- Oneda, T.M.S.; Kalbusch, A. Estudo de caso: Usos finais da água em uma residência em Joinville—SC. Encontro Nac. De Tecnol. Do Ambiente Construído 2018, 17, 3446–3451. [Google Scholar]
- Barreto, D. Perfil do consumo residencial e usos finais da água. Ambiente Construído 2008, 8, 23–40. [Google Scholar]
- Ywashima, L.A.; Campos, M.A.S.; Piaia, E.; De Luca, D.M.P.; Ilha, M.S.d.O. Caracterização do uso de água em residências de interesse social em Paulínia. Encontro Nac. De Tecnol. Do Ambiente Construído 2006, 11, 55014–55900. [Google Scholar]
- Hammes, G.; Ghisi, E.; Padilha Thives, L. Water end-uses and rainwater harvesting: A case study in Brazil. Urban Water J. 2020, 17, 177–183. [Google Scholar] [CrossRef]
- Custódio, D.A.; Ghisi, E. Assessing the potential for potable water savings in the residential sector of a city: A case study of Joinville city. Water 2019, 11, 2074. [Google Scholar] [CrossRef]
- PMJ—Prefeitura Municipal de Joinville. Planejar para Sanear. Plano Municipal de Saneamento Básico de Joinville—Componentes Água e Esgoto. 2011. Available online: https://www.joinville.sc.gov.br/wp-content/uploads/2017/11/PVC0-PMSB_Cartilha-Planejar-para-Sanear_2011-00-00.pdf (accessed on 3 February 2025).
- CBMSC—Corpo de Bombeiros Militar de Santa Catarina. Instrução Normativa IN9—Saídas de Emergência. 2024. Available online: https://documentoscbmsc.cbm.sc.gov.br/uploads/95f9038e8f2451e50a6693d998ada729.pdf (accessed on 28 March 2025).
- Teston, A.; Geraldi, M.; Colasio, B.M.; Ghisi, E. Rainwater harvesting in buildings in Brazil: A literature review. Water 2018, 10, 471. [Google Scholar] [CrossRef]
- Ywashima, L.A. Avaliação do uso de água em Edifícios Escolares Públicos e Análise de Viabilidade Econômica da Instalação de Tecnologias Economizadoras nos pontos de Consumo. Master’s Thesis, Faculdade de Engenharia Civil, Arquitetura e Urbanismo. Universidade Estadual de Campinas (FEC/UNICAMP), Campinas, Brazil, 2005. [Google Scholar]
- Ghisi, E.; de Oliveira, S.M. Potential for potable water savings by combining the use of rainwater and greywater in houses in southern Brazil. Build. Environ. 2007, 42, 1731–1742. [Google Scholar] [CrossRef]
- Ghisi, E.; Ferreira, D.F. Potential for potable water savings by using rainwater and greywater in a multi-storey building in southern Brazil. Build. Environ. 2007, 42, 2512–2522. [Google Scholar] [CrossRef]
- Custódio, D.A. Influência do Aproveitamento de água Pluvial em Edificações Residenciais na Drenagem Urbana de Joinville—SC. Master’s Thesis, Universidade Federal de Santa Catarina, Florianópolis, Brazil, 2017; p. 168. [Google Scholar]
- Rupp, R.F.; Munarim, U.; Ghisi, E. Comparação de métodos para dimensionamento de reservatórios de água pluvial. Ambiente Construído 2011, 11, 47–64. [Google Scholar] [CrossRef]
- Cureau, R.J.; Ghisi, E. Reduction of potable water consumption and sewage generation on a city scale: A case study in Brazil. Water 2019, 11, 2351. [Google Scholar] [CrossRef]
- Proença, L.C.; Ghisi, E.; Tavares, D.F.; Coelho, G.M. Potential for electricity savings by reducing potable water consumption in a city scale. Resour. Conserv. Recycl. 2011, 55, 960–965. [Google Scholar] [CrossRef]
- Ghisi, E.; Tavares, D.D.F.; Rocha, V.L. Rainwater harvesting in petrol stations in Brasília: Potential for potable water savings and investment feasibility analysis. Resour. Conserv. Recycl. 2009, 54, 79–85. [Google Scholar] [CrossRef]
- Lani, N.H.M.; Syafiuddin, A.; Yusop, Z.; Adam, U.B.; Amin, M.Z.M. Performance of small and large scales rainwater harvesting systems in commercial buildings under different reliability and future water tariff scenarios. Sci. Total Environ. 2018, 636, 1171–1179. [Google Scholar] [CrossRef]
- Matos, C.; Santos, C.; Pereira, S.; Bentes, I.; Imteaz, M. Rainwater storage tank sizing: Case study of a commercial building. Int. J. Sustain. Built Environ. 2013, 2, 109–118. [Google Scholar] [CrossRef]
- Chilton, J.C.; Maidment, G.G.; Marriott, D.; Francis, A.; Tobias, G. Case study of a rainwater recovery system in a commercial building with a large roof. Urban Water 2000, 1, 345–354. [Google Scholar]
- Gomes, J.; Weber, D.C.; Delong, C.M. Dimensionamento de reservatórios de armazenamento de Águas pluviais, usando um critério financeiro. Dir. Da ABRH 2010, 15, 89–100. [Google Scholar]
- de Oliveira, A.M.C. Optimização do uso da água na Indústria. Ph.D. Thesis, Universidade Técnica de Lisboa, Lisboa, Portugal, 2009. [Google Scholar]
- CNI—Confederação Nacional da Indústria. Uso da água no Setor Industrial Brasileiro: Matriz de Coeficientes Técnicos; CNI: Brasília, Brazil, 2013. Available online: https://www.imasul.ms.gov.br/wp-content/uploads/2017/12/Uso-de-%C3%81gua-no-Setor-Industrial-Brasileiro.pdf (accessed on 28 March 2025).
- ANA—Agência Nacional de Águas e Saneamento Básico. Conjuntura dos Recursos Hídricos no Brasil 2019: Informe Annual; ANA: Brasília, Brazil, 2019. Available online: http://www.snirh.gov.br/portal/snirh/centrais-de-conteudos/conjuntura-dos-recursos-hidricos/conjuntura_informe_anual_2019-versao_web-0212-1.pdf (accessed on 17 October 2024).
- Goldenfum, J.A. Reaproveitamento de águas Pluviais. Instituto de Pesquisas Hidráulicas da UFRGS. 2006. Available online: https://www.researchgate.net/profile/Joel-Goldenfum/publication/267196924_REAPROVEITAMENTO_DE_AGUAS_PLUVIAIS/links/559131fb08ae47a3490f0cae/REAPROVEITAMENTO-DE-AGUAS-PLUVIAIS.pdf (accessed on 11 November 2024).
- SNIS—Sistema Nacional de informações sobre saneamento. Diagnóstico Temático Serviços de água e Esgoto. Visão Geral Dez. 2023. Available online: https://www.gov.br/cidades/pt-br/acesso-a-informacao/acoes-e-programas/saneamento/snis/produtos-do-snis/diagnosticos-snis (accessed on 12 November 2024).
- EPE—Empresa de Pesquisa Energética. Anuário Estatístico de Energia Elétrica 2023. ano Base 2022. Governo Federal: Ministério de Minas e Energia. 2023. Available online: https://www.epe.gov.br/sites-pt/publicacoes-dados-abertos/publicacoes/PublicacoesArquivos/publicacao-160/topico-168/anuario-factsheet.pdf (accessed on 12 November 2024).
- Chiu, Y.-R.; Tsai, Y.-L.; Chiang, Y.-C. Designing rainwater harvesting systems cost-effectively in a urban water-energy saving scheme by using a GIS-simulation based design system. Water 2015, 7, 6285–6300. [Google Scholar] [CrossRef]
- Gianoli, A.; Bhatnagar, R. Managing the Water-Energy Nexus within a Climate Change Context—Lessons from the Experience of Cuenca, Ecuador. Sustainability 2019, 11, 5918. [Google Scholar] [CrossRef]
- Latif, M.H.; Amjad, M.; Qamar, A.; Asim, M.; Mahmood, W.; Khalid, W.; Rehman, A. Nexus implementation of sustainable development goals (SDGs) for sustainable public sector buildings in Pakistan. J. Build. Eng. 2022, 52, 104415. [Google Scholar] [CrossRef]
- Silva, A.C.R.D.S. O Nexo água-Energia no Aproveitamento de água de Chuva para fins não Potáveis em Habitações de Interesse Social: Análise na Região Metropolitana do Vale do Paraíba e Litoral Norte de São Paulo. Ph.D. Thesis, Faculdade de Engenharia, Universidade Estadual Paulista, Guaratinguetá, Brazil, 2022. [Google Scholar]
- Zang, J.; Kumar, M.; Werner, D. Real-world sustainability analysis of an innovative decentralized water system with rainwater harvesting and wastewater reclamation. J. Environ. Manag. 2021, 280, 111639. [Google Scholar] [CrossRef]


| Roof Material | Surface Runoff Coefficient |
|---|---|
| Ceramic tiles | 0.80 |
| Concrete tiles | 0.90 |
| Metal tiles | 0.95 |
| Building Typology | Total Water Demand (L/inhab*day) | Author | Considered Value (L/inhab*day) |
|---|---|---|---|
| Public | 18 to 48 | Farina et al. [29] | 35 |
| 36.7 | Kammers and Ghisi [30] | ||
| Industrial | Variable | Mierzwa et al. [31] | 15, 35 and 70 |
| Commercial | 34.9 to 101.6 | Proença and Ghisi [32] | 65 |
| Single-family house | 111 to 152 | Marinoski et al. [33] | 180 |
| 257 | Oneda and Kalbusch [34] | ||
| 262.7 | Barreto [35] | ||
| 46 to 309 | Ywashima et al. [36] | ||
| 110 | Hammes, Ghisi and Thives [37] | ||
| Multi-family residential buildings | 129.89 to 335.67 | Custódio and Ghisi [38] | 220 |
| 217 | PMJ [39] |
| Building Typology | Rainwater Demand (%) | Author | Considered Value (%) |
|---|---|---|---|
| Public | 77 | Teston et al. [41] | 50, 70 and 80 |
| 72.1 | Kammers and Ghisi [30] | ||
| 45; 71; 86 | Ywashima [42] | ||
| Industrial | 45; 71; 86 | Ywashima [42] | 50, 70 and 80 |
| Commercial | 53.2; 88.9 | Proença and Ghisi [32] | 50, 70 and 80 |
| 69.6 | Teston et al. [41] | ||
| Single-family house | 46.6 | Teston et al. [41] | 10, 20 and 40 |
| 25.8; 30.4 | Ghisi and Oliveira [43] | ||
| 10.9 | Barreto [35] | ||
| 18; 39 | Marinoski et al. [33] | ||
| Multi-family residential buildings | 46.6 | Teston et al. [41] | 10, 20 and 40 |
| 31.8; 39.6 | Ghisi and Ferreira [44] |
| Building Typology | Percentage (%) |
|---|---|
| Public | 10.96 |
| Industrial | 10.72 |
| Commercial | 9.52 |
| Single-family house | 5.95 |
| Multi-family residential buildings | 12.90 |
| Building Typology | Built Area (m2) | Equation | R2 (%) | Roof Area (m2) |
|---|---|---|---|---|
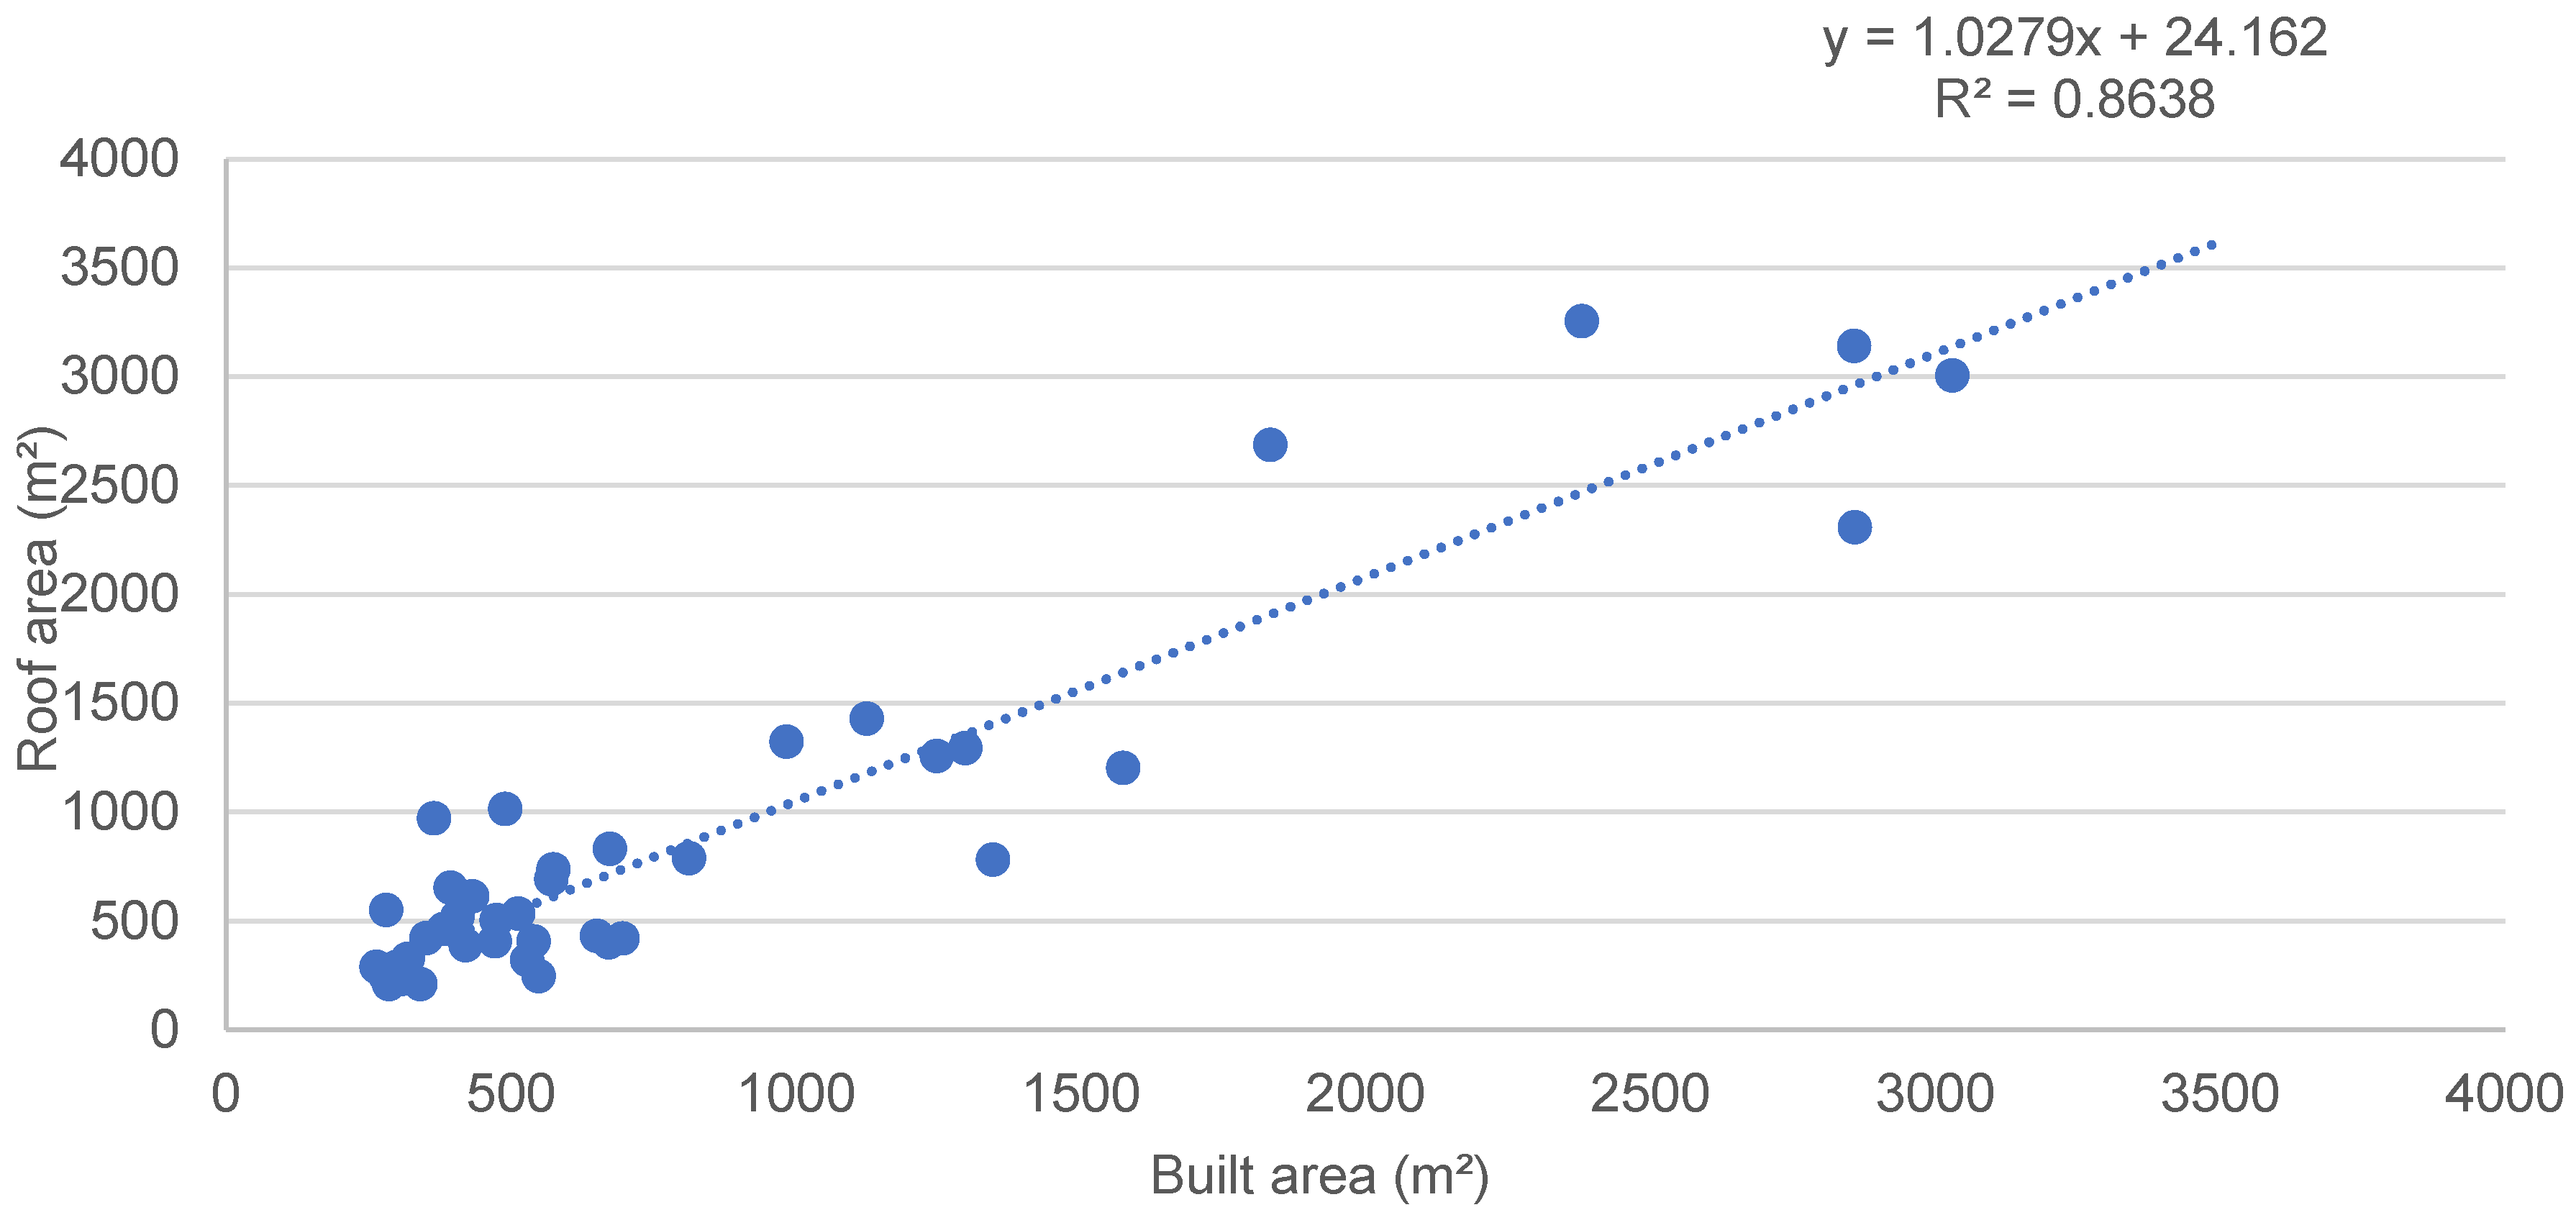
| Public | 474 | y = 1.0279x + 24.162 | 86.38 | 511 |
| Industrial | 701 | y = 0.8795x + 50.683 | 96.14 | 666 |
| Commercial | 437 | y = 0.8742x + 26.929 | 89.96 | 409 |
| Single-family house | 267 | y = 0.8548x − 25.600 | 81.08 | 203 |
| Multi-family residential buildings | 272 | y = 0.4498x + 108.22 | 80.95 | 230 |
| Parameter/Building Typology | Public | Industrial | Commercial | Single-Family House | Multi-Family Residential Buildings |
|---|---|---|---|---|---|
| Initial runoff discard (mm) | 2 | 2 | 2 | 2 | 2 |
| Roof area (m2) | 511 | 666 | 409 | 203 | 230 |
| Total water demand (L/per capita*day) | 35 | 15; 35; 70 | 65 | 180 | 220 |
| Number of users (people) | 157 | 70 | 60 | 3 | 12 |
| Coefficient of surface runoff (%) | 80 | 95 | 90 | 80 | 80 |
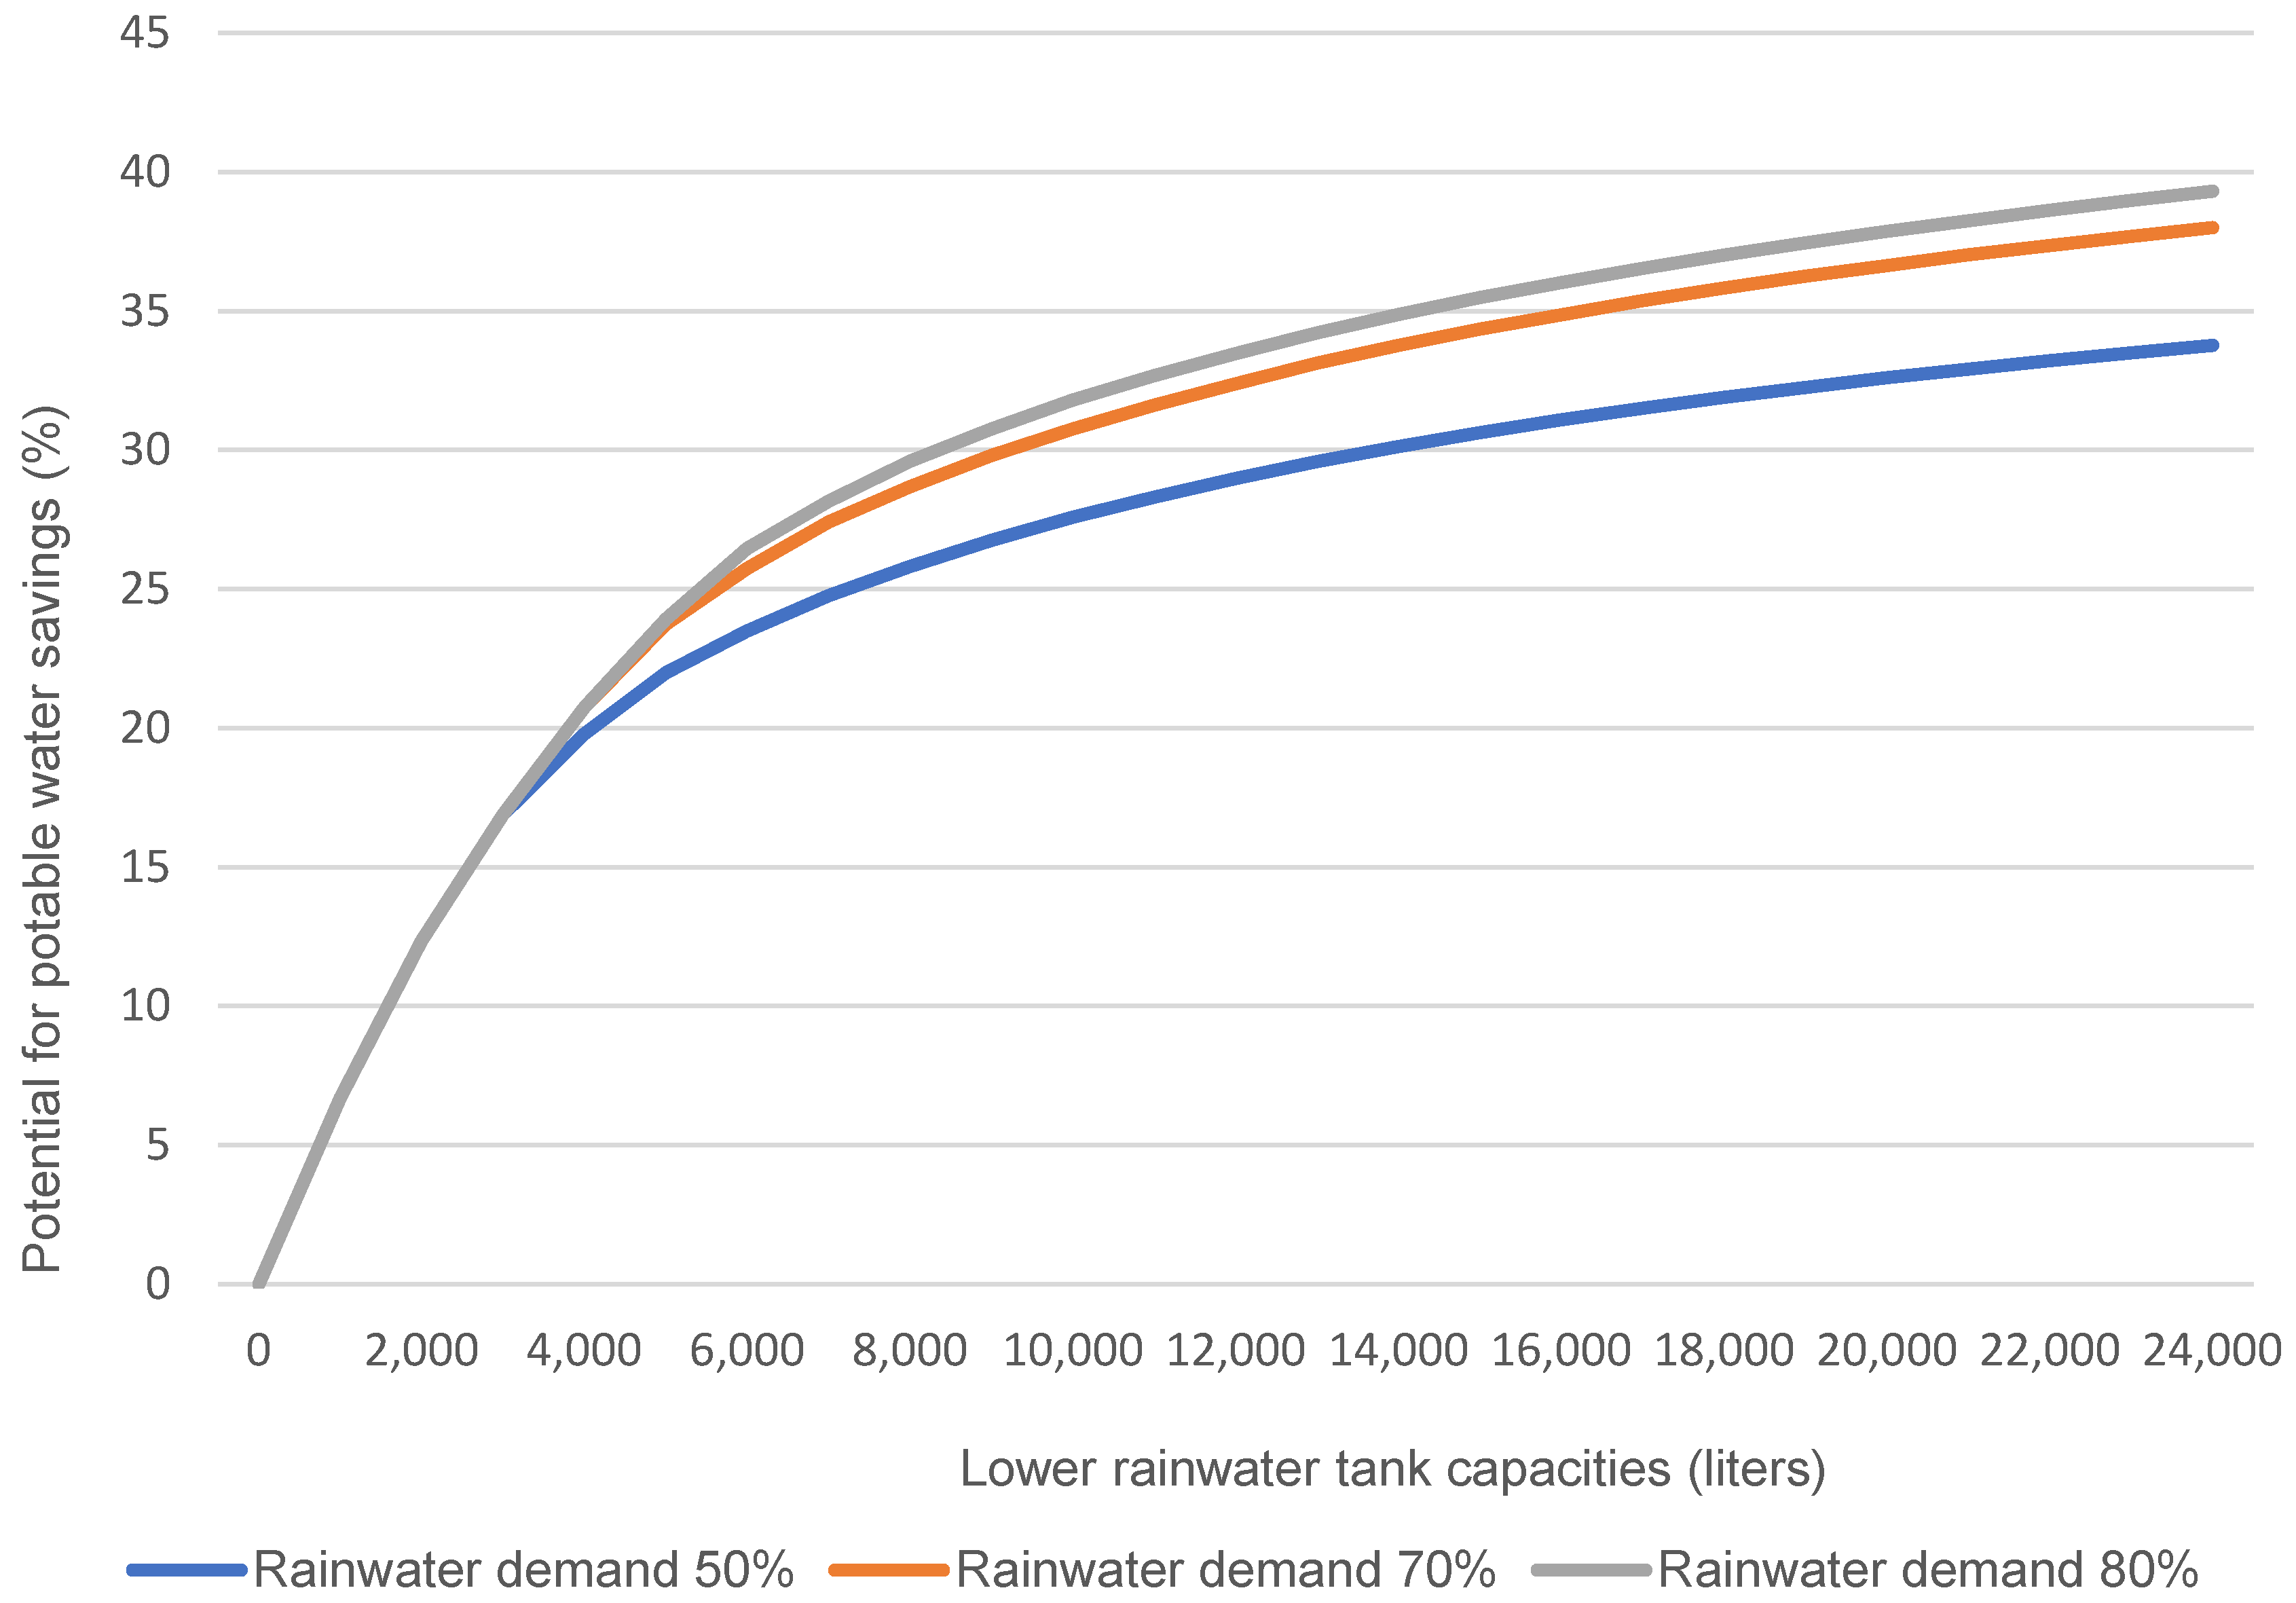
| Rainwater demand (% of total water demand) | 50; 70; 80 | 50; 70; 80 | 50; 70; 80 | 10; 20; 40 | 10; 20; 40 |
| Maximum lower water tank capacity (L) | 25,000 | 25,000 | 25,000 | 25,000 | 25,000 |
| Difference in the potential for potable water savings using rainwater harvesting (%/m3) | 2 | 2 | 2 | 2 | 2 |
| Parameter/Building Typology | Public | Industrial | Commercial | Single-Family Houses | Multi-Family Residential Buildings |
|---|---|---|---|---|---|
| Total water demand (L/day) | 5495 | 1050; 2450; 4900 | 260 | 540 | 2640 |
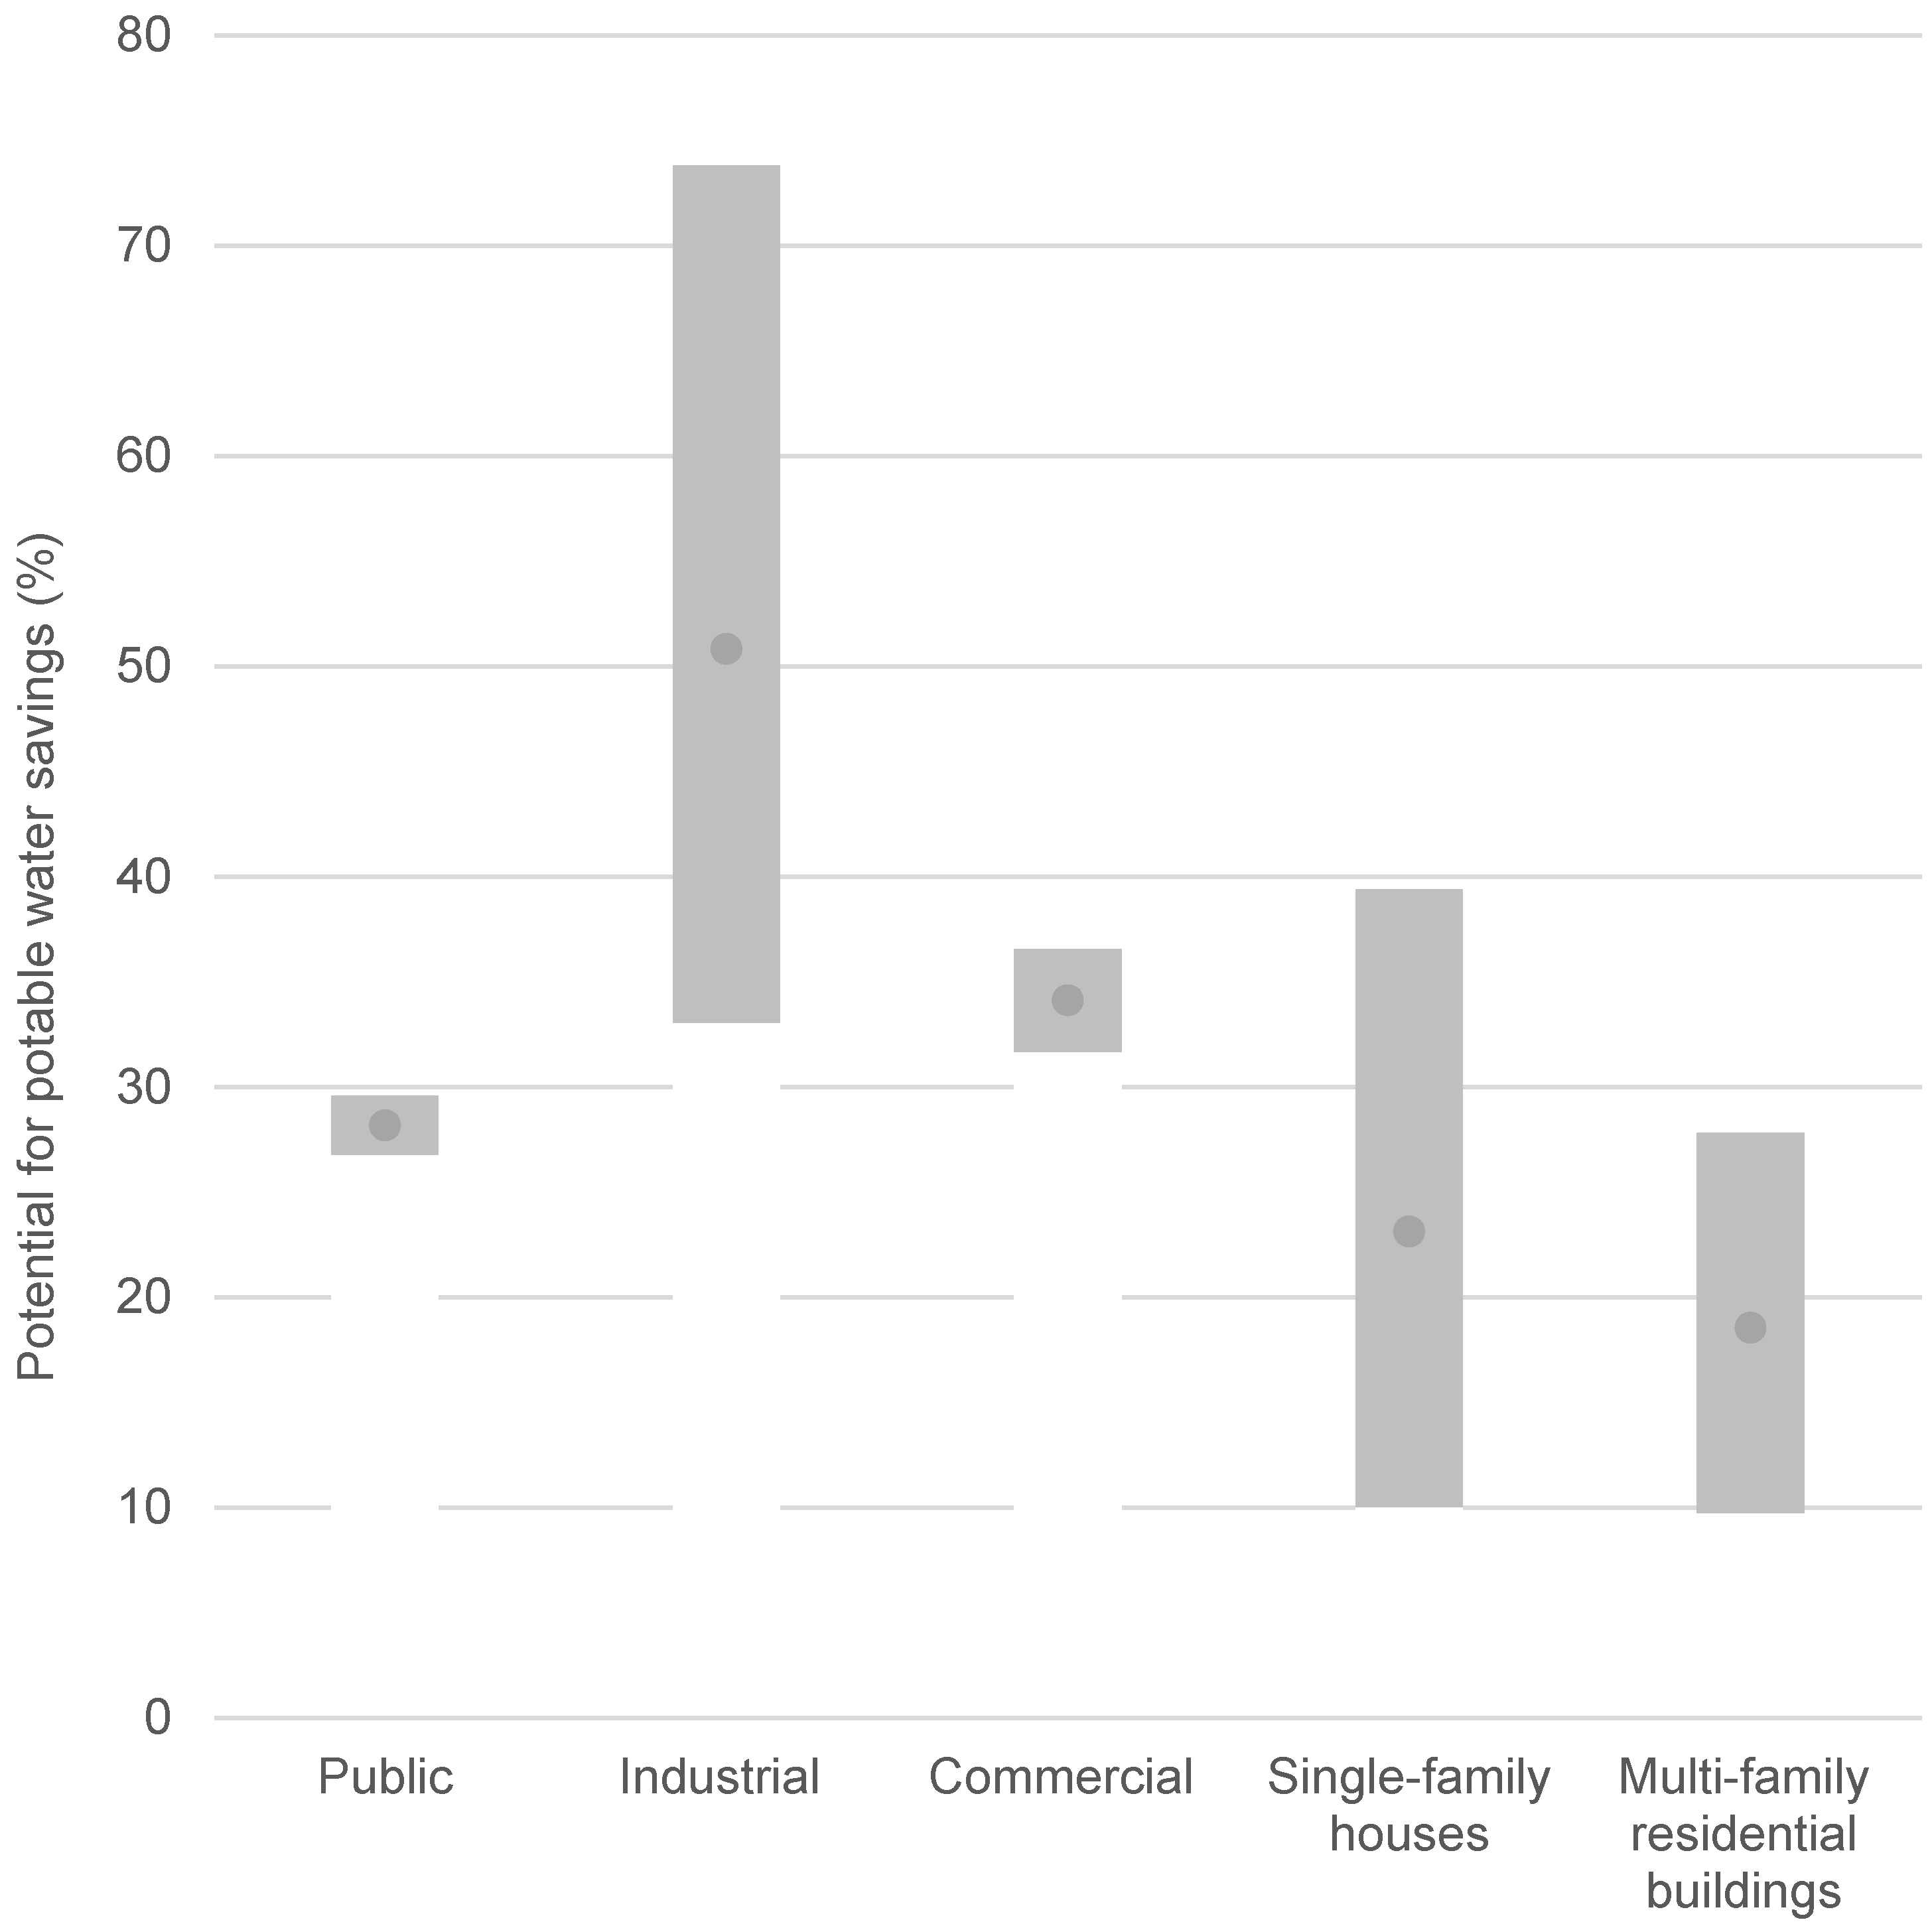
| Average potential for potable water savings (%) | 28.18 | 50.83 | 34.12 | 23.12 | 18.55 |
| Potential for potable water savings (L/day) | 1548 | 534; 1245; 2491 | 89 | 125 | 490 |
| Potential for energy savings (kWh/day) | 0.79 | 0.27; 0.63; 1.27 | 0.04 | 0.06 | 0.25 |
Disclaimer/Publisher’s Note: The statements, opinions and data contained in all publications are solely those of the individual author(s) and contributor(s) and not of MDPI and/or the editor(s). MDPI and/or the editor(s) disclaim responsibility for any injury to people or property resulting from any ideas, methods, instructions or products referred to in the content. |
© 2025 by the authors. Licensee MDPI, Basel, Switzerland. This article is an open access article distributed under the terms and conditions of the Creative Commons Attribution (CC BY) license (https://creativecommons.org/licenses/by/4.0/).
Share and Cite
Oneda, T.M.S.; Ghisi, E. Analysing the Water–Energy Nexus Considering Rainwater Harvesting in Buildings. Water 2025, 17, 1037. https://doi.org/10.3390/w17071037
Oneda TMS, Ghisi E. Analysing the Water–Energy Nexus Considering Rainwater Harvesting in Buildings. Water. 2025; 17(7):1037. https://doi.org/10.3390/w17071037
Chicago/Turabian StyleOneda, Tânia Mara Sebben, and Enedir Ghisi. 2025. "Analysing the Water–Energy Nexus Considering Rainwater Harvesting in Buildings" Water 17, no. 7: 1037. https://doi.org/10.3390/w17071037
APA StyleOneda, T. M. S., & Ghisi, E. (2025). Analysing the Water–Energy Nexus Considering Rainwater Harvesting in Buildings. Water, 17(7), 1037. https://doi.org/10.3390/w17071037