Article

Picoplankton Groups and Their Responses to Environmental Factors in Small Cascade Hydropower Stations

1
China Institute of Water Resources and Hydropower Research, Beijing 100038, China
2
National Research Center for Sustainable Hydropower Development, Beijing 100038, China
3
Key Laboratory of Water and Sediment Sciences, Ministry of Education, Department of Environmental Engineering, Peking University, Beijing 100871, China
*
Author to whom correspondence should be addressed.
Water 2025, 17(6), 903; https://doi.org/10.3390/w17060903
Submission received: 8 January 2025 / Revised: 17 March 2025 / Accepted: 18 March 2025 / Published: 20 March 2025

Abstract

:
Hydropower is a clean and renewable energy source, and cascade hydropower stations have been developed to enhance water energy utilization efficiency. While small hydropower stations have a smaller scale and environmental impact compared to large ones, the cumulative effects of cascade development on river ecosystems should not be overlooked. In this study, flow cytometry was used to classify picoplankton from water samples collected at four small cascade hydropower stations on a Pearl River tributary into six microbial groups: Virus, LNA (Low Nucleic Acid), HNA (High Nucleic Acid), Cyanobacteria, Algae, and Fungi. Four ecological assessment indices were calculated: Photosynthetic Autotrophic Capacity (PAC), Bacterial Activity Index (BAI), Virus Regulatory Capacity (VRC), and Fungal Metabolic Capacity (FMC). By analyzing trends in microbial abundance and ecological indices and their correlations with environmental factors, the results showed that along the small cascade hydropower stations, dissolved oxygen (DO) and electrical conductivity (EC) increased from 5.71 mg/L and 49.87 μS/cm upstream to 6.80 mg/L and 56.18 μS/cm downstream, respectively. In contrast, oxidation-reduction potential (ORP) and total organic carbon (TOC) concentrations decreased from 3.81 mV and 1.59 mg/L to −8.05 mV and 1.08 mg/L, respectively. Among the microbial groups, the abundance of Virus, LNA, and Fungi decreased by 30.9%, 30.5%, and 34.9%, respectively, along the cascade system. EC, TOC, and NO3-N were identified as key drivers of changes in the abundance of the Virus, LNA, and Fungi groups. The concentrations of carbon and nitrogen nutrients significantly influenced the ecological assessment indices. Cascade hydropower stations had a significant impact on PAC, BAI, and VRC, while their influence on FMC was relatively small. The VRC showed a decreasing trend, suggesting a weakening effect of the stations on VRC. This study offers new perspectives and methods that facilitate the rapid and quantitative assessment of the ecological impacts of cascade hydropower stations.

1. Introduction

Small hydropower refers to hydropower stations with an installed capacity of 50,000 kW or less and is internationally recognized as a clean and renewable energy source [1]. Small hydropower stations play an important role in securing rural electricity and improving irrigation, but their operation also has a considerable impact on river ecosystems. In order to make greater use of hydropower, cascade hydropower stations have been constructed on most rivers [2]. Their development and operation have even greater effects on the river’s water environment [3], which may lead to the fragmentation of river habitats, affect the diversity of species and the ecological health of rivers [4,5], and also increase the stability of the ecological functions of planktonic microorganisms [6]. Therefore, it is particularly important to objectively assess the impact of small cascade hydropower stations on river ecosystems.
Small hydropower stations are often located in mountainous areas, exhibiting typical characteristics of mountain stream ecosystems. Nanoplankton (2–20 μm) and picoplankton (0.2–2 μm) play a key role in these ecosystems [7], acting as the main drivers of material cycling, energy flow, and information transfer [8]. Furthermore, these microscopic and picoplankton respond to changes in the aquatic environment of small hydropower stations more quickly and sensitively than larger aquatic organisms such as fish and benthic organisms. Therefore, analyzing the community composition and abundance of picoplankton, as well as exploring the relationship between microbial communities and ecological environments, can provide a more effective way to assess the ecological impact of small hydropower stations.
Research on nanoplankton and picoplankton has long relied on traditional methods such as microscopic observation. Li et al. [9] classified, identified, and counted phytoplankton using optical microscopy, assessing the influence of cascade hydropower stations on the composition of phytoplankton communities. However, optical microscopy has limitations in accurately identifying and counting the tiny picoplankton, leading to an underestimation of their abundance. Scanning and transmission electron microscopes can directly observe and photograph the ultrastructure of algae, capturing the morphological features of phytoplankton smaller than 5 μm for classification and identification [10]. However, electron microscopy is only capable of species identification for single individuals and cannot facilitate quantitative analysis of phytoplankton populations, making it unsuitable for large-scale, high-throughput sample detection. Flow cytometry [11,12] and molecular biology informatics techniques [13] have been increasingly developed and applied for the monitoring and identification of microscopic organisms. In river microbiome research, amplicon-based high-throughput sequencing and quantitative Polymerase Chain Reaction (qPCR) are the most commonly used methods [14]. However, qPCR can only determine microbial abundance through relative quantification. While amplicon sequencing has made significant contributions to microbiome research, the taxonomic information derived from Operational Taxonomic Units (OTUs) or Amplicon Sequence Variants (ASVs) is still insufficiently annotated [15]. Additionally, environmental Deoxyribonucleic Acid (eDNA) technology has demonstrated significant potential for assessing river biodiversity, but the degradation of eDNA in the environment limits its applicability in research [16].
Flow cytometry (FCM), originally used in the medical field, was later introduced to the study of aquatic microorganisms. The flow cytometer can rapidly analyze large quantities of aquatic microorganisms without the need for culturing, making it suitable for counting Cyanobacteria, heterotrophic bacteria, and eukaryotic phytoplankton [17,18]. FCM can detect parameters such as the size, granularity, and concentration of cells or particles through light scattering, and by referencing standard-sized microspheres, it can classify the detected cell populations according to their size [19,20]. Additionally, based on the fluorescence emitted by fluorescent dyes or autofluorescence, aquatic microorganisms can be categorized into different microbial groups [12]. FCM enables the large-scale, rapid detection of picoplankton and nanoplankton in aquatic environments, but its application in the field of river ecology in the context of cascade hydropower stations is still relatively limited.
This research aims to assess the impact of small cascade hydropower stations on picoplankton communities and identify the key environmental factors driving their variations. FCM was used as the primary analytical technique to systematically detect and analyze picoplankton in water samples collected from four small cascade hydropower stations along a tributary of the Pearl River. Based on the cell size, granularity, and pigment autofluorescence characteristics of plankton, combined with fluorescent dye labeling, six distinct microbial groups with different ecological functions were accurately classified. The abundance trends of each microbial group across the cascade hydropower stations were analyzed, along with their responses to environmental factors. To quantitatively evaluate the ecological impact of small cascade hydropower stations on river ecosystems, microbial ecological assessment indices were developed based on flow cytometric microbial groups. This research offers new perspectives and methodologies for evaluating the ecological impacts of hydropower stations, enabling rapid and quantitative assessments of cascade hydropower stations’ ecological effects. It provides valuable theoretical and practical insights for advancing ecological impact assessments.

2. Materials and Methods

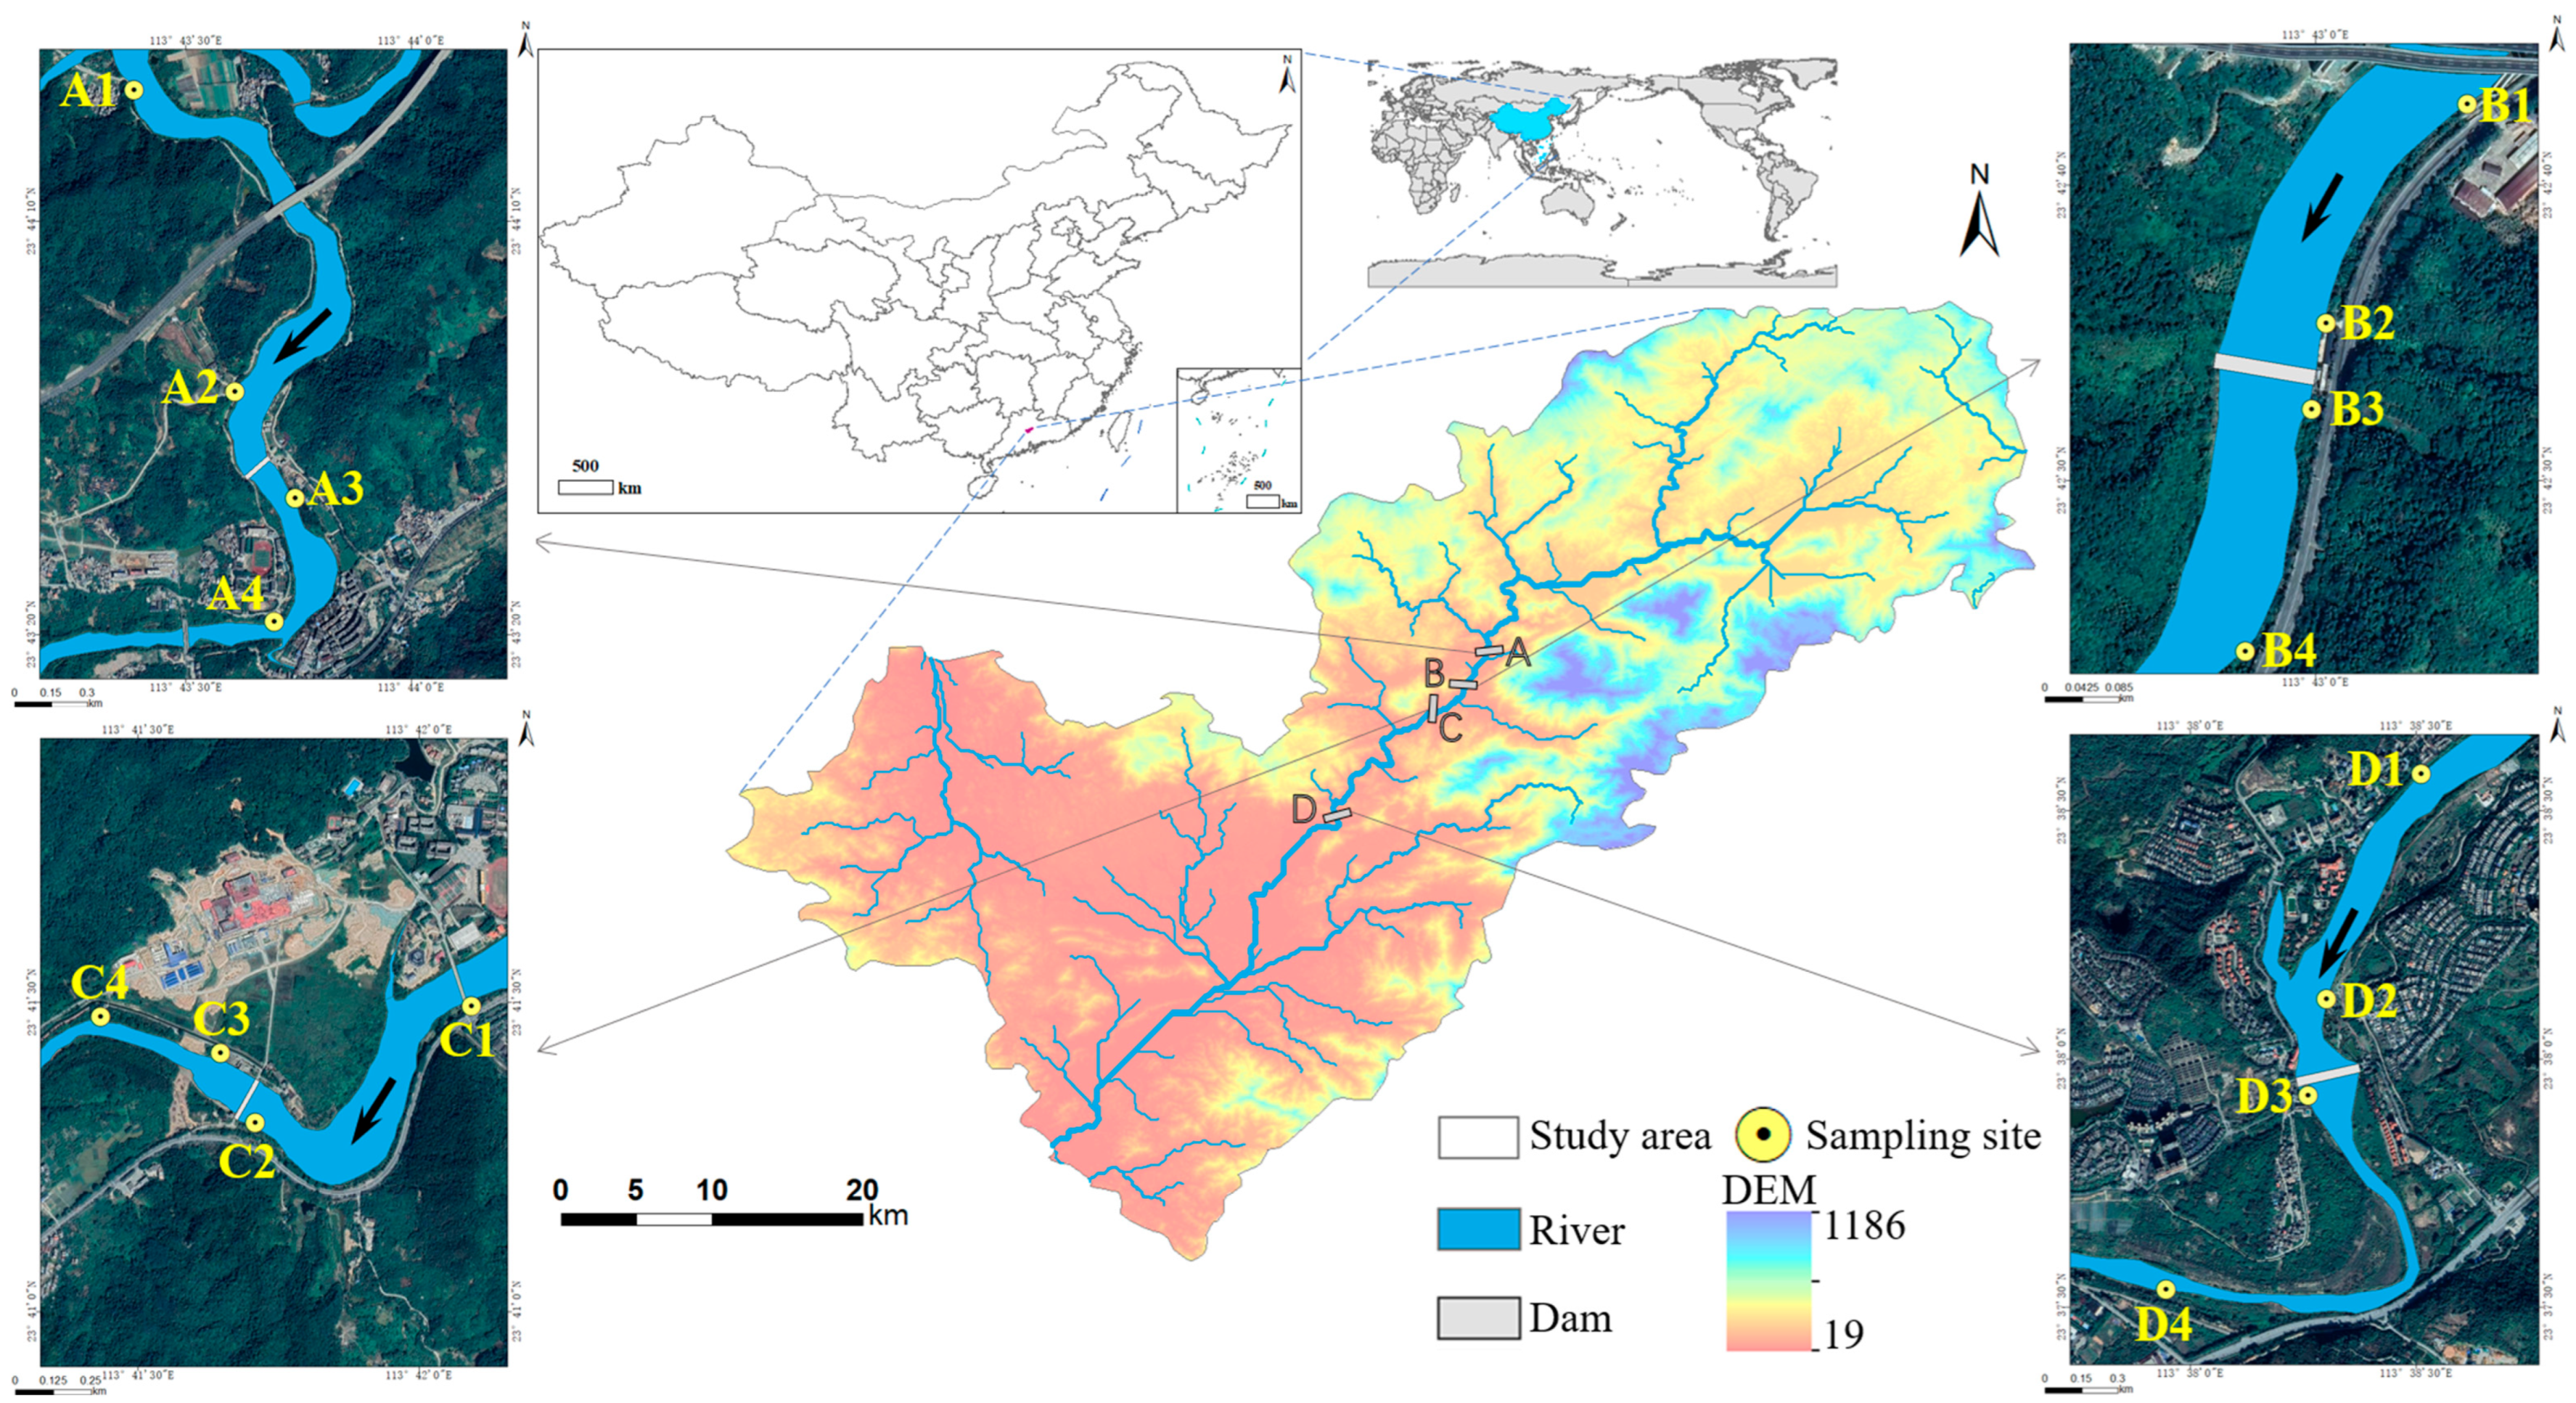
2.1. Study Area and Sampling

In August 2024, water samples were collected from four run-of-river small cascade hydropower stations (A, B, C, and D) along a tributary of the Pearl River, arranged sequentially from upstream to downstream (Figure 1). The installed capacities of small hydropower stations A, B, C, and D are 3000 kW, 910 kW, 3000 kW, and 1600 kW, respectively. Four sampling sections were designated at each station: Section 1 was located 500–1000 m upstream of the dam, Section 2 was 100–200 m upstream of the dam, Section 3 was at the tailwater immediately downstream of the dam, and Section 4 was where the tailwater mixed with the original river flow. Three parallel samples were collected at each section. The water sample collection followed the methods developed by Li et al. [9] and Coggins et al. [12].
GPS devices were used to obtain the latitude, longitude, and elevation of each sampling section. During the water sample collection, in situ measurements of pH, redox potential, water temperature, dissolved oxygen, and electrical conductivity at each sampling section were conducted using a multi-parameter water quality monitor (HACH-HQ40d, Hach Company, CO, USA). A turbidity meter and flow velocity meter were used to measure turbidity and river flow velocity, respectively. The measurements of total organic carbon (TOC), nitrate nitrogen (NO3-N), nitrite nitrogen (NO2-N), and ammonium nitrogen (NH4+-N) were carried out in an indoor laboratory [21,22]. For flow cytometry analysis, water samples were fixed with glutaraldehyde (final concentration 0.5%) to kill and preserve microorganisms, and then frozen and transported back to the laboratory for analysis.

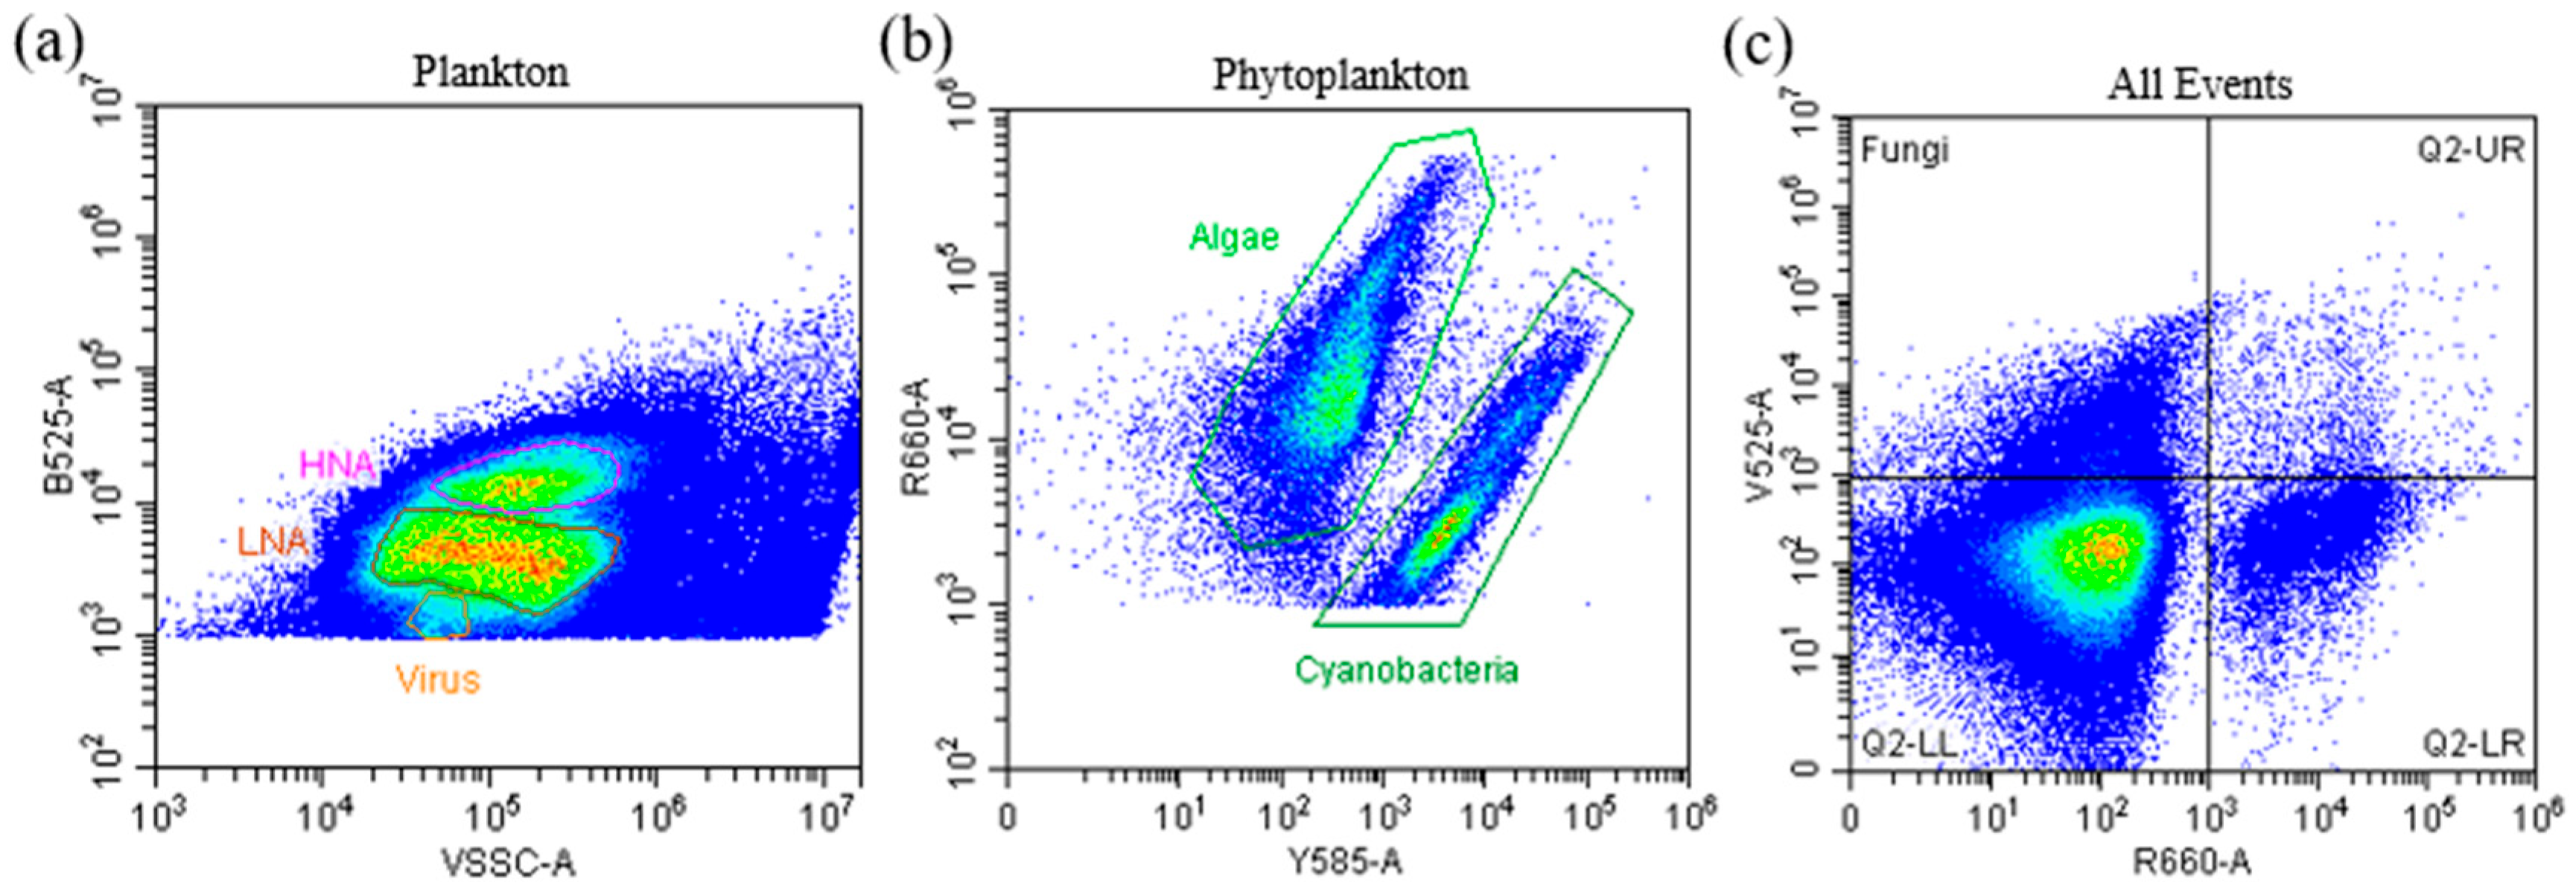
2.2. Sample Preparation and Flow Cytometry Analysis

The frozen samples were thawed in the laboratory and subjected to ultrasonic treatment using an ultrasonic device to disperse biological aggregates in the natural water samples. A needle filter with a 20 μm pore size was then used to remove large particles of biological cells and impurities, preventing nozzle and pipeline blockages. Ultra-pure water was used as a blank control to eliminate instrument noise interference. Signals with VSSC channel intensity below 103 were considered background noise, and the fluorescence intensity threshold for the nucleic acid dye was set at 600 to remove background noise and inorganic particle interference.
In this research, the nucleic acid fluorescent dye SYBR Green I [23] was used to specifically bind with the nucleic acids of biological cells. Under excitation by a 488 nm laser on the flow cytometer (CytoFLEX SRT, Beckman Coulter, CA, USA), the biological cells bound with the SYBR Green I dye emitted green fluorescence at 520 nm. By detecting the intensity of the green fluorescence, biological cells can be distinguished from inorganic particles. The SYBR Green I stock solution used in the research had a concentration of 10,000× and was diluted 100 times with PBS to prepare the working solution. The working solution was then added to the water samples at a 1:100 volume ratio, followed by vortex mixing for 10 s and incubation in the dark for at least 10 min to allow the SYBR Green I dye to fully bind to the biological nucleic acids. After this incubation, the samples were detected using the flow cytometer. To improve the staining efficiency of SYBR Green I with viruses, the mixture was thoroughly mixed and incubated in a water bath at 80 °C for 10 min, and then allowed to cool to room temperature in the dark before being detected by the flow cytometer [24]. For fungal detection, CFW (Calcofluor White) stain solution was used to stain the chitin in the cell walls [25].
Microorganisms in water samples from different locations of four cascade hydropower stations were grouped based on their autofluorescence and staining results with fluorescent dyes. After staining with SYBR Green I, biological cells containing nucleic acids showed a positive signal in the B525 channel, with a threshold set at 1 × 10³. Planktonic bacteria, which are widely distributed in aquatic ecosystems, were classified into two main functional groups: LNA (Low Nucleic Acid) and HNA (High Nucleic Acid) [26,27]. These groups were differentiated primarily by cell size and DNA content [28], with distinction based on fluorescence intensity in the B525 channel. Viruses, due to their smaller particle size and lower nucleic acid content, can be distinguished from bacteria (Figure 2a). Phytoplankton containing chlorophyll generated positive peaks in the R660 channel. Cyanobacteria, with higher phycocyanin content [29], emitted fluorescence in the Y585 yellow channel, allowing for differentiation between autotrophic eukaryotic algae and Cyanobacteria in flow cytometric analysis [30] (Figure 2b). Fungal plankton were identified by staining their cell walls with CFW, which fluoresced in the V525 channel. By combining this with the R660 channel to detect chlorophyll presence, fungi and eukaryotic algae could be distinguished (Figure 2c).

2.3. Absolute Abundance of Picoplankton

The quantitative analysis of planktonic microbial cells was performed using standard counting beads (Product 1426, APOGEE, Hertfordshire, UK), with a concentration of 5000 beads/μL. Flow cytometry analysis was conducted on both the standard counting beads and microbial cells under the same analysis parameters and flow rate pressure conditions. The calculation method for the quantitative analysis of microbial cells within a specific gate is as follows [31]:
  C p = N p × C s × t s N s × t p
where C p is the concentration of target microbial cells (cells/μL); N p denotes the total number of target microbial cells; t p is the analysis time for target microbial cells (s); C s is the concentration of standard counting beads (5000/μL); N s is the total number of standard counting beads; and t s represents the analysis time for standard counting beads (s).

2.4. Microbial Ecological Assessment Index

Most studies on microbial structure and function rely on molecular bioinformatics approaches, using functional gene annotation and other techniques to investigate microbial functions [32]. However, in freshwater microbial community research, the scarcity of reference databases remains a challenge [33]. FCM combined with specific fluorescent dyes enables a functional analysis of microorganisms. In this study, FCM was employed to rapidly and accurately quantify different microbial groups in small cascade hydropower river systems. The quantitative distribution patterns of these microbial groups provide insights into the functional characteristics of the microecosystem. Based on the abundance data of different picoplankton in the water, a microbial assessment index can be calculated to explore the impact of the operation of small cascade hydropower stations on the river microecosystem.
The ratio of the abundance of photosynthetic autotrophic producers (Cyanobacteria and Algae) to heterotrophic consumers (LNA and HNA), decomposers (Fungi), and viruses (Virus) reflects the Photosynthetic Autotrophic Capacity (PAC) of the microecosystem.
  P A C = C C y a n o b a c t e r i a + C A l g a e C V i r u s + C L N A + C H N A + C F u n g i
HNA and LNA are two functional groups in the microecosystem that exhibit significant differences in ecology and nucleic acid content, which can currently only be detected by FCM. Hammes and Egli [26] identified and validated that the difference between HNA and LNA bacteria reflects differences in bacterial metabolic activity. Therefore, in this research, the ratio of the abundance of HNA to LNA is used to represent bacterial activity (Bacterial Activity Index, BAI) within the microecosystem.
  B A I = C H N A C L N A
Viruses control 20% to 40% of biological cell death and material cycling in the microecosystem, playing an important regulatory role in the structure of microbial communities [34]. The ratio of the abundance of planktonic viruses to planktonic heterotrophic bacteria represents the self-regulation capacity of the microecosystem (Virus Regulatory Capacity, VRC).
  V R C = C V i r u s C L N A + C H N A
Fungi are a vital component of river ecosystems, and their key role in the degradation of organic matter is widely recognized. The ratio of the abundance of planktonic fungi to planktonic heterotrophic bacteria represents the decomposition metabolic capacity (Fungal Metabolic Capacity, FMC) of the microecosystem.
  F M C = C F u n g i C L N A + C H N A
In these calculations, C x represents the abundance (cells/μL) of each microbial group.

2.5. Data Processing and Statistical Analysis

Basic environmental and flow cytometry data processing was performed using Microsoft Excel 2019. Boxplots comparing environmental factors and microbial group abundances at each hydropower station were generated using RStudio 2023.12.1+402. Mantel test correlation heatmaps were also generated to visualize the correlations between environmental factors, microbial group abundances, and microbial ecological assessment indices. The Kruskal–Wallis test was applied to assess differences between the various cascade hydropower stations, with p < 0.05 indicating significant differences between stations. In the correlation heatmaps, Spearman’s correlation coefficient was used to calculate the correlation between environmental factors.

3. Results

3.1. Physicochemical Properties of Water Samples

The trends in the different environmental factors of cascade hydropower stations are shown in Figure 3. The turbidity ranged from 2.58 to 7.23, increasing from station A to B and then gradually decreasing, with station D having the lowest turbidity range of 2.58–3.42, indicating clearer water quality (Figure 3a). The pH of the water in stations A, B, and C ranged from 6.58 to 7.03, which is weakly acidic to neutral, while station D had a pH range of 6.97 to 7.14, indicating neutral to slightly alkaline water (Figure 3b). The oxidation-reduction potential (ORP) showed a decreasing trend along the cascade hydropower stations (Figure 3c). The temperature of the water (Twater), dissolved oxygen (DO), and electrical conductivity (EC) showed an increasing trend along the series of hydropower stations (Figure 3d–f). Twater ranged from 26.4 to 32.5 °C, indicating relatively high temperatures. Generally, mountainous rivers at the source tend to have low water temperatures and high DO, but as the river flows and human activities (such as thermal exchange during power generation) intervene, the water temperature rises. The increase in DO might be related to the higher abundance of phytoplankton in the water. The rising EC reflects the increasing content of dissolved minerals in the water. TOC decreased along the cascade of stations (Figure 3h), possibly due to the degradation or sedimentation of organic matter in the water. The concentrations of NO3-N and NH4+-N decreased from stations A to B, and then increased again (Figure 3i,k).
Velocity and NO2-N exhibited no significant differences across the four cascade hydropower stations (p > 0.05). As shown in Figure 3g, there were a few points with relatively high flow velocity at all four small hydropower stations. This was due to the larger flow at the tailwater discharge areas of each station, while other sampling sections had relatively slow flow velocities. The water flow near the dams upstream of each station was nearly stagnant. The distribution of NO2-N was more uniform at stations A, B, and C, while station D showed relatively higher values. However, the concentration did not vary significantly across the four stations, indicating that NO2-N remains relatively stable (Figure 3j).

3.2. Absolute Abundance of Picoplankton

Based on the cell size, granularity, and fluorescence characteristics of planktonic organisms, flow cytometry was used to classify the picoplankton in the water sample into six groups: Virus, LNA, HNA, Cyanobacteria, Algae, and Fungi (Figure 2). Among these, LNA exhibited the highest abundance, with an average of 2551 cells/μL, and the abundance of Algae and Cyanobacteria was relatively low, with averages of 47 cells/μL and 52 cells/μL, respectively. The abundance of Virus, LNA, and Fungi showed a decreasing trend along the cascade hydropower stations (Figure 4a,b,f), with LNA displaying a more pronounced trend. Virus and Fungi did not show a significant decrease between stations A, B, and C, but dropped significantly from C to D. HNA, on the other hand, increased from A to C, then decreased from C to D (Figure 4c). Cyanobacteria and Algae showed a decrease from A to B, followed by an increase from B to D (Figure 4d,e). No significant differences in the abundance of Virus and HNA were observed among the four small hydropower stations, while significant differences were found for LNA, Cyanobacteria, Algae, and Fungi. Figure 4 also reveals the differences in microbial groups across different sampling sections before and after the small hydropower stations, indicating the spatial heterogeneity of picoplankton abundance within individual small hydropower stations.

3.3. Microbial Ecological Assessment Index

The index representing the photosynthetic autotrophic capacity (PAC) of the microbial community follows a similar trend to that of Cyanobacteria and Algae, decreasing from A to B and then increasing from B to D (Figure 5a). The BAI increased from A to C and decreased from C to D (Figure 5b). The trends of VRC and FMC also mirror the abundance changes in Virus and Fungi, respectively, decreasing sequentially from A to D (Figure 5c,d). PAC, BAI, and VRC showed significant differences among the four small cascade hydropower stations, but FMC did not.

3.4. Analysis of Key Driving Factors

The results of PCA (Principal Component Analysis) are presented in Figure 6, indicating a certain degree of similarity in environmental conditions among adjacent small hydropower stations, while gradual changes occur along the cascade hydropower system. The upstream hydropower stations, A and B, are primarily influenced by TOC, suggesting higher organic matter content in the water. In contrast, the downstream stations, C and D, are mainly affected by DO, EC, and NO3-N, which exhibit a strong positive correlation. Key environmental factors influencing water quality include pH, ORP, DO, EC, TOC, NO3-N, and NH4+-N.
The Mantel test is widely used in ecology and environmental sciences to explore the correlations between species and environmental factors. From Figure 7, it can be seen that virus is highly significantly correlated with EC, TOC, and NO3-N and significantly correlated with NO2-N. LNA is highly significantly correlated with EC and TOC and significantly correlated with NO3-N. HNA is highly significantly correlated with EC and significantly correlated with turbidity. Algae is highly significantly correlated with TOC. Cyanobacteria did not show any significant correlation with environmental factors. Fungi is highly significantly correlated with EC and significantly correlated with TOC and NO3-N. Overall, EC, TOC, and NO3-N show significant correlations with the abundance of Virus, LNA, and, Fungi, which may be key driving factors influencing the abundance changes in heterotrophic consumers and decomposers in the water.
It is evident from Equation (2) that PAC is significantly correlated with Cyanobacteria and Algae. Figure 7 shows that Algae is significantly correlated with TOC, whereas in Figure 8, PAC is not only highly significantly correlated with TOC but also significantly correlated with NO2-N. The BAI is significantly correlated with turbidity, echoing the significant correlation between HNA and turbidity in Figure 7. Additionally, VRC is significantly correlated with TOC, NO3-N, and NH4+-N, and FMC is significantly correlated with NO3-N. Overall, the microbial community ecological assessment index is primarily influenced by the concentrations of carbon and nitrogen nutrients in the water.

4. Discussion

4.1. Correlation Analysis Between Microbial Groups and Environmental Factors

The construction of cascade hydropower stations improves the efficiency of water energy utilization, but it also breaks the natural continuity of the river, which affects both environmental factors and microbial communities in the river ecosystem. There is a cumulative effect of the construction of cascade dams on the river’s ecological factors [35], and the interception rate of suspended particulate matter increases gradually with each additional dam [36], resulting in a decrease in turbidity along the river at hydropower stations A, B, C, and D (Figure 3a), The operation of the cascade reservoirs also exerts a cumulative effect on downstream water temperature [37], causing a gradual increase in Twater (Figure 3d).
Because of the sensitivity of phytoplankton to the water environment, changes in the physicochemical factors of the water body will directly or indirectly change the community structure of phytoplankton [14], and the phytoplankton diversity can reflect the nutrient level and cleanliness of the water body to a certain extent; therefore, phytoplankton is often used as an indicator organism for water ecosystems [38,39]. The Mantel test analysis shows a highly significant correlation between Algae and TOC (Figure 7). However, since the main carbon source for phytoplankton is usually dissolved CO2 [40], this correlation may be related to TOC serving as an indirect carbon source for phytoplankton growth [41]. Meanwhile, the abundance of Algae and Cyanobacteria shows a gradual increase (Figure 4d), and DO also rises (Figure 3e), which may be because the proliferation of Algae and Cyanobacteria contributed to the increase in DO concentrations in the river.
Bacteria play a vital role in river ecosystems, performing key functions in material cycling and energy flow. Figuring out the composition and dynamics of bacterial communities in rivers is essential for making more accurate assessments of water quality and ecosystem health. Flow cytometry can categorize planktonic bacteria into subgroups with low and high DNA content based on cell size and DNA content. Bacteria with a high DNA content have a high growth advantage and dominate in eutrophic waters, while bacteria with a low DNA content dominate in depleted waters, and the total productivity of bacterioplankton is mainly derived from high-DNA-content bacteria [28]. Wang et al. [42] conducted a study on planktonic bacteria in the cascade reservoirs of the Lancang–Mekong River Basin and pointed out that reservoir impoundment has a significant impact on planktonic bacterial communities, with dam construction leading to a reduction in the abundance of planktonic bacteria. In this study, the abundance of LNA shows a decreasing trend from A to D (Figure 4b), while the abundance of HNA increased from A to C (Figure 4c). Mantel test correlation analysis reveals that both LNA and HNA are significantly positively correlated with EC, and LNA is also significantly correlated with TOC (Figure 7), suggesting that changes in EC and TOC in the river may be detrimental to the survival of LNA bacteria [43,44]. There is a significant negative correlation between TOC and DO (Figure 7), and DO can drive bacterial community changes by altering the aerobic–anoxic transition process [45]; as DO levels increase progressively in the river, the environment becomes more favorable for the growth of aerobic bacteria.
Due to the unique nature of their life form, there is limited research on the impact and regulatory effects of environmental factors on planktonic viruses. The increase in EC (Figure 3f) could inhibit the growth of certain host bacteria, indirectly leading to a decrease in virus abundance. The correlation heatmap analysis reveals a significant negative correlation between EC and TOC (Figure 7). The decrease in TOC concentration (Figure 3h) may suggest a reduction in organic matter in the water, leading to a decrease in resources supporting the growth of virus hosts, such as bacteria, which in turn reduces virus abundance. Nitrate nitrogen (NO3-N) is one of the common nitrogen sources in water bodies and has an important impact on the structure of microbial communities. Changes in NO3-N concentration could affect the types and quantities of bacterial communities [46], indirectly influencing the abundance of viruses that rely on these bacteria as hosts.
Fungal abundance in rivers is generally lower than that of bacteria, but fungi play an indispensable role in the degradation of organic matter and in maintaining nutrient balance in the water. Mantel test analysis shows that Fungi are significantly correlated with EC, TOC and NO3-N (Figure 7). An increase in EC is typically associated with higher concentrations of dissolved salts and minerals in the water, and the rise in salinity may be unfavorable for fungal growth [47]. TOC is crucial for sustaining microbial growth in aquatic environments. Fungi secrete various extracellular enzymes to degrade carbon-rich substances such as lignin, which they then absorb and utilize [48]. In cascade hydropower stations, the gradual decrease in TOC concentration may reduce the organic carbon sources that fungi rely on, thereby limiting their growth. Nitrogen is a major limiting factor for primary productivity in various ecosystems and is also a primary cause of environmental issues such as water eutrophication. Fungal growth and metabolism are typically influenced by nitrogen sources. Although nitrate and nitrite are common nitrogen sources in water, fungi primarily rely on organic nitrogen as their nitrogen source [49]. The variation in NO3-N concentration in rivers may affect the competitive survival ability of certain fungal species.
Of course, the abundance of plankton in rivers is not only influenced by changes in environmental factors but also by the interactions between different types of microorganisms within the aquatic ecosystem. Moreover, these interactions are intricate and dynamic and can be positive (e.g., mutualism), negative (e.g., competition or parasitism), or neutral (e.g., commensalism), influenced by both abiotic and biotic factors [50,51]. Therefore, the reasons behind the changes in the abundance of each microbial community are actually very complex, and the discussion provided in this paper is far from sufficient to fully explain them.

4.2. Microbial Ecological Index for Assessing the Impact of Cascade Hydropower Stations

Changes in nutrients and habitat factors drive changes in the biological structure and function of microecosystems, and such changes may affect material cycling processes of the entire aquatic microecosystems [52,53,54]. The continuous damming of rivers disrupts rivers’ ecological networks and reduces the connectivity and biodiversity of the microecosystem [55]. It has been shown that dam construction leads to decreased nutrient transfer efficiency in the micro-food web and the accumulation of nutrients [56], which, through trophic cascading effects, further impacts the cycling of elements such as carbon, nitrogen, and phosphorus [57]. Additionally, the reduced flow velocity induced by dams promotes a shift in the microecosystem from heterotrophy to autotrophy [58].
Photosynthetic algae are the main primary producers in the microecosystem [59]. As primary producers, they play a crucial role in aquatic ecosystems, providing a rapid response to changes in water quality and serving as effective bioindicators of water environment health. The turbidity of the four small cascade hydropower stations along the river decreases progressively (Figure 3a), which facilitates the penetration of light and thereby enhances the ecosystem’s photosynthetic autotrophic capacity [60]. The PAC increases from B to D (Figure 5a), indicating a gradual enhancement of photosynthetic capacity in the river’s aquatic ecosystem from B to D. Photosynthesis positively affects DO levels, and the increase in DO further promotes the growth and reproduction of other plankton in the river, which helps to maintain the biodiversity of the river’s microecosystem.
The BAI increases from A to C and decreases from C to D (Figure 5b), which is consistent with the trend of HNA (Figure 4c). HNA typically represents active bacterial populations, while LNA corresponds to dormant or senescent bacterial groups. In this research, the ratio of the abundance of HNA to LNA, as represented by the BAI, reflects the bacterial activity in the microecosystem; a higher BAI indicates stronger bacterial activity, indirectly suggesting a healthy aquatic environment conducive to bacterial growth and development [61]. The BAI of hydropower stations C and D is higher than that of A and B (Figure 5b), indicating that the bacterial activity in the two downstream hydropower stations is greater than that in the two upstream stations.
The main groups of planktonic viruses are bacteriophages and algal viruses, which primarily use prokaryotes as hosts. Although they are extremely small in size, they are highly active and serve as crucial regulators of the structure and function of aquatic ecosystems. They play a significant role in modulating the size, structure, and diversity of microbial populations in water [62], acting as ‘regulators’ in the material cycling of the ecosystem by influencing the health and behavior of their hosts [63]. Changes in the concentrations of TOC, NO2-N, and NH4+-N in the water can affect the growth of viral host microorganisms. Viruses rely on host microorganisms for replication, and when the abundance of host microorganisms decreases, the viral abundance also declines, thereby impacting the VRC. The VRC decreases progressively from A to D (Figure 5c), indicating a decline in the self-regulation capacity of the river’s microecosystem in the vicinity of the cascade hydropower stations, which is detrimental to maintaining the stability of the ecosystem. This trend suggests a possible weakening effect of the stations on the VRC, making it a key consideration in hydropower ecological impact assessments.
Fungi are major decomposers in ecosystems [64], with the potential to degrade toxic substances in rivers. They can be utilized in bioremediation to restore polluted rivers [65]. In the study area, the FMC shows a decreasing trend (Figure 5d), consistent with the changes in the abundance of Fungi (Figure 4f). This suggests a reduction in the decomposition metabolic capacity of the river ecosystem in the cascade hydropower station area. However, the differences in FMC across the four small hydropower stations are not significant, indicating that the decomposition metabolic levels of the river’s microecosystem between A, B, C, and D are relatively similar. The results from the Mantel test show a significant correlation between FMC and NO3-N (Figure 8). The development of cascade hydropower stations alters hydrodynamic conditions and nutrient distribution, and their operation plays a role in intercepting and storing NO3-N [66,67]. The retention effect of NO3-N varies among different reservoirs, influenced by multiple factors such as reservoir age, season, and hydraulic retention time [68]. The biogeochemical cycles within the reservoir can partially offset the nitrogen interception, alleviating the downstream nitrogen imbalance [69]. Fungi can release nitrogen from organic matter through decomposition, which may directly affect the utilization rate of nitrogen in the water and influence NO3-N concentrations [70]. Changes in NO3-N concentrations, in turn, lead to fluctuations in the FMC. The metabolism of carbon and nitrogen is an important process for maintaining the health of river ecosystems. However, our understanding of the driving factors behind river metabolism remains relatively limited. Increasing evidence suggests that the metabolic mechanisms are influenced by common environmental drivers shared with the ecosystem [71].

5. Conclusions

Small cascade hydropower stations improve water energy utilization efficiency by constructing multiple small-scale hydropower plants along rivers. With their relatively low construction and operational costs, they have become increasingly popular in mountainous regions and small basin areas. However, the potential impacts of these stations on river ecosystems must be carefully considered. This study sampled water from four small cascade hydropower stations along a tributary of the Pearl River. Using flow cytometry, picoplankton in the water samples were classified into six microbial groups: Virus, LNA, HNA, Cyanobacteria, Algae, and Fungi. The absolute abundance of each group, along with trends in four ecological assessment indices—PAC, BAI, VRC, and FMC—was analyzed. Mantel tests were used to examine the correlations between microbial abundances, ecological indices, and environmental factors, providing a comprehensive assessment of the ecological impacts of small cascade hydropower stations on the aquatic environment. The main findings of this study are as follows:
  • Along the small cascade hydropower stations, DO and EC progressively increased from 5.71 mg/L and 49.87 μS/cm upstream to 6.80 mg/L and 56.18 μS/cm downstream, respectively. Meanwhile, the ORP and TOC concentrations decreased from 3.81 mV and 1.59 mg/L to −8.05 mV and 1.08 mg/L, respectively. No significant differences were observed in velocity and NO2-N concentrations between the four cascade hydropower stations.
  • Among the six microbial groups classified by flow cytometry, LNA had the highest abundance, with an average of 2551 cells/μL, and the abundance of Algae and Cyanobacteria was relatively low, averaging 47 cells/μL and 52 cells/μL, respectively. The abundance of Virus, LNA, and Fungi decreased by 30.9%, 30.5%, and 34.9%, respectively, along the cascade hydropower stations.
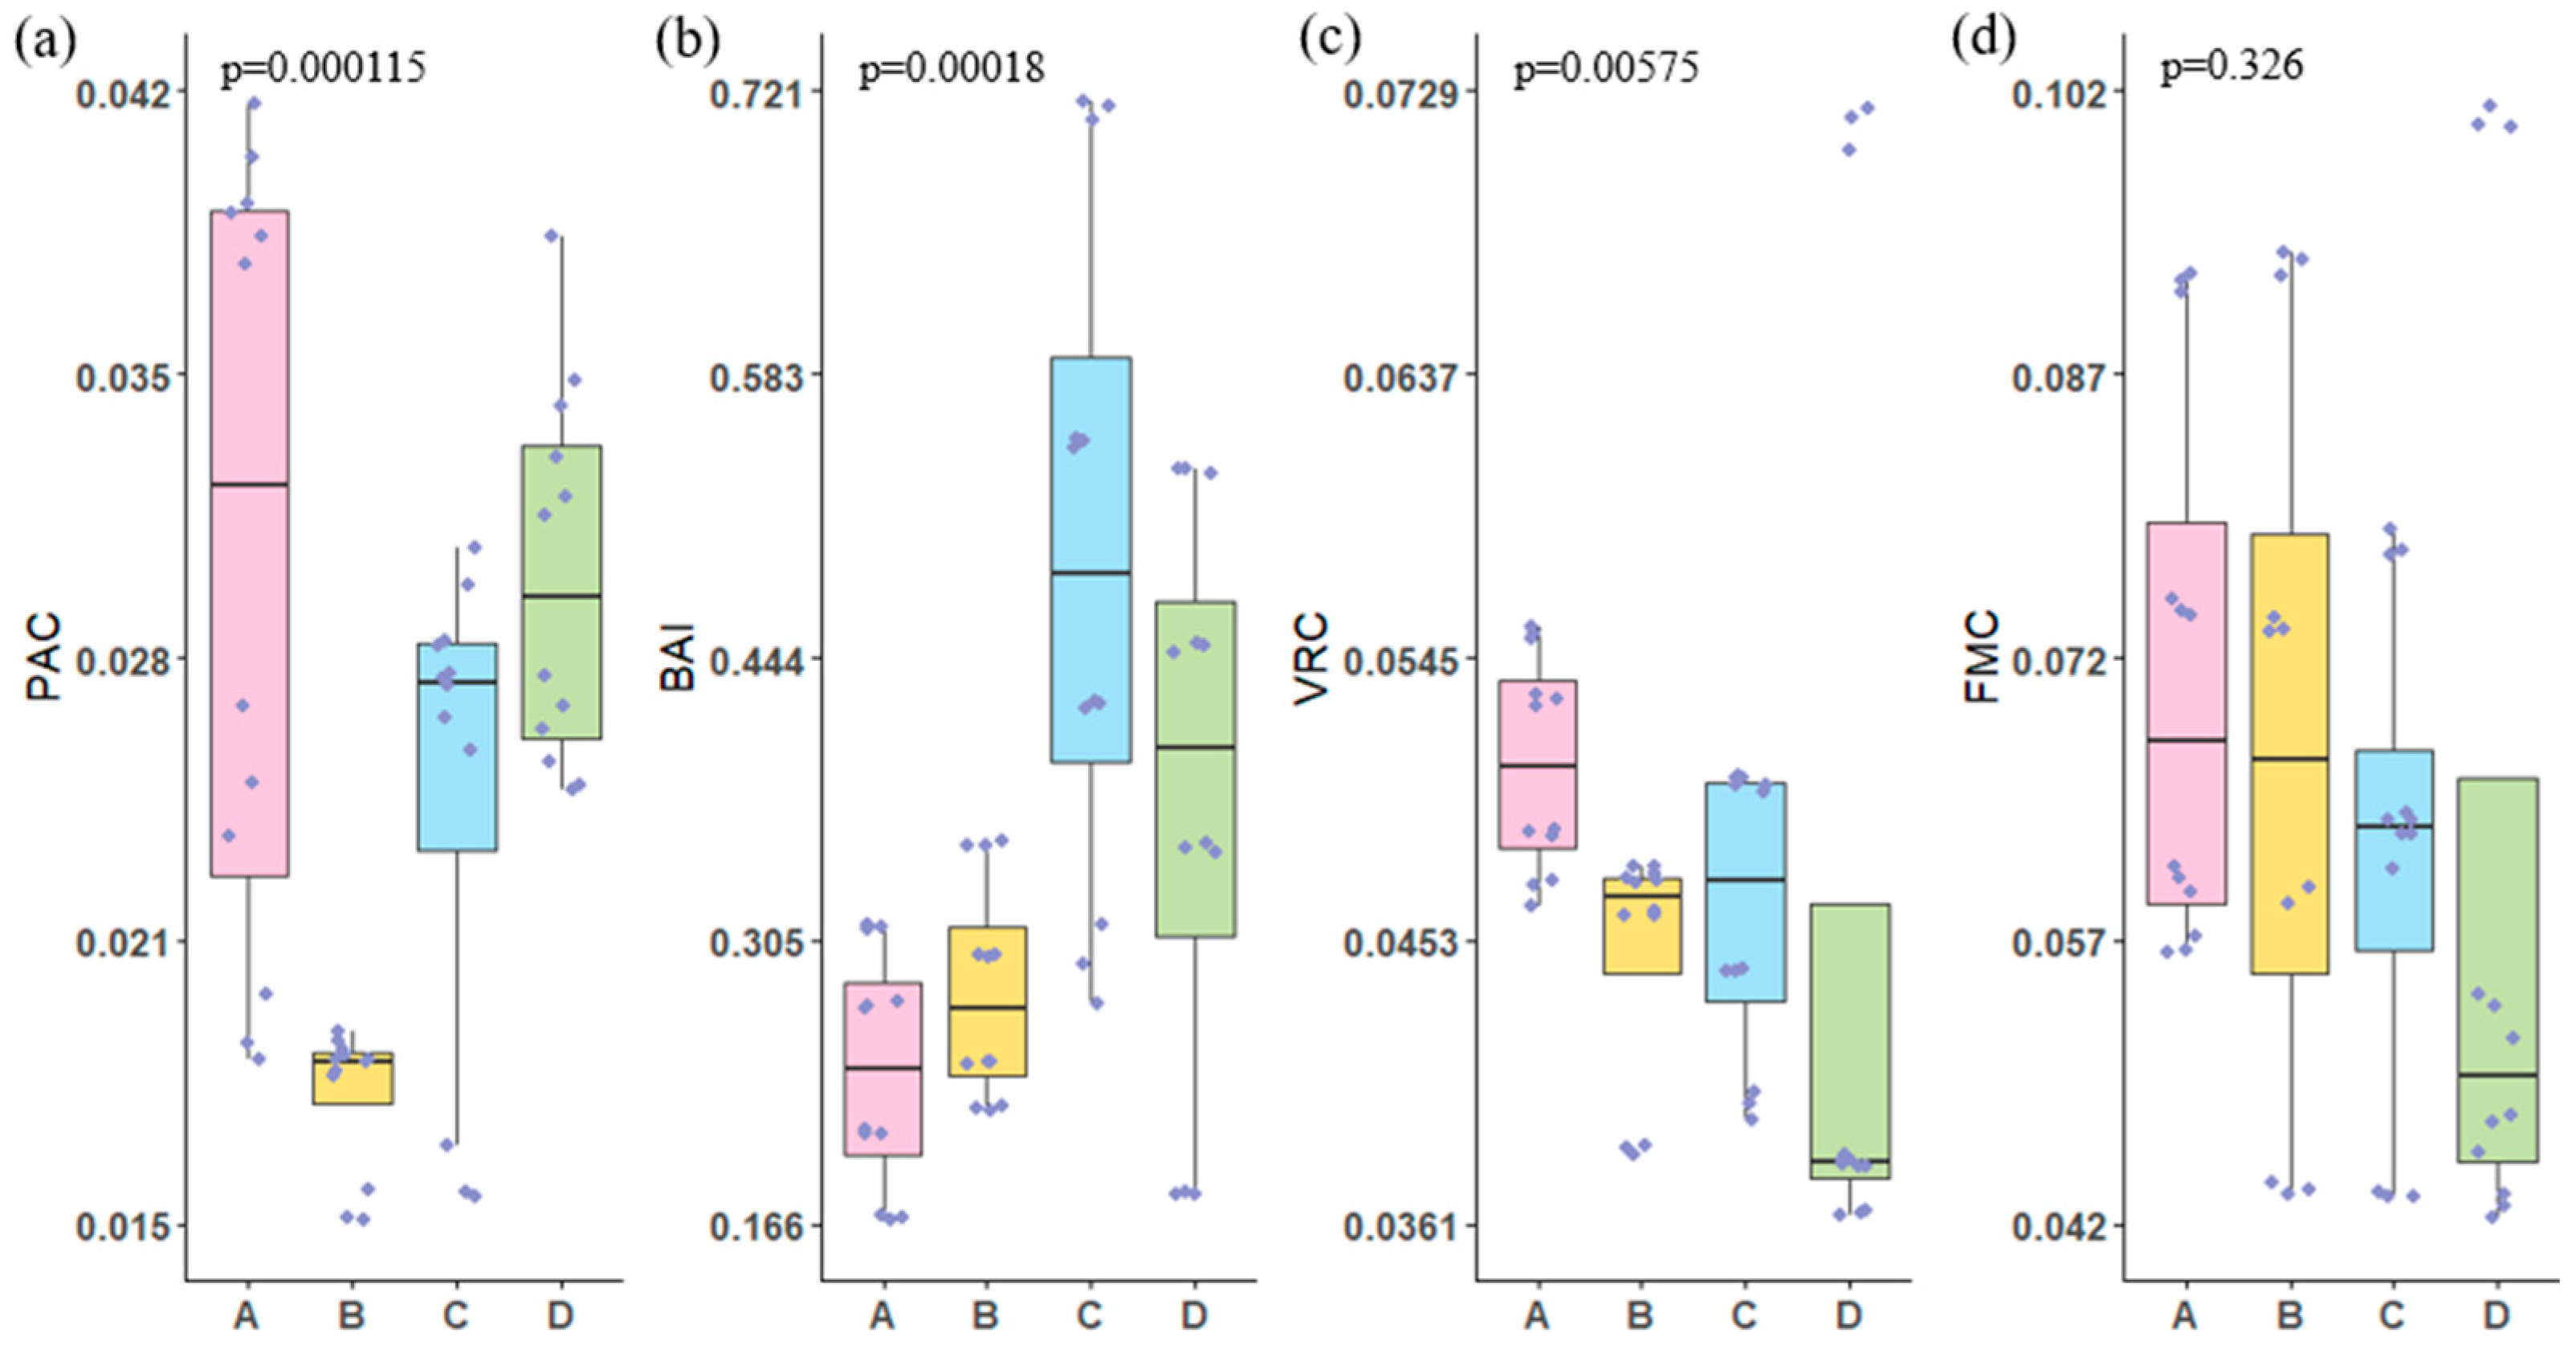
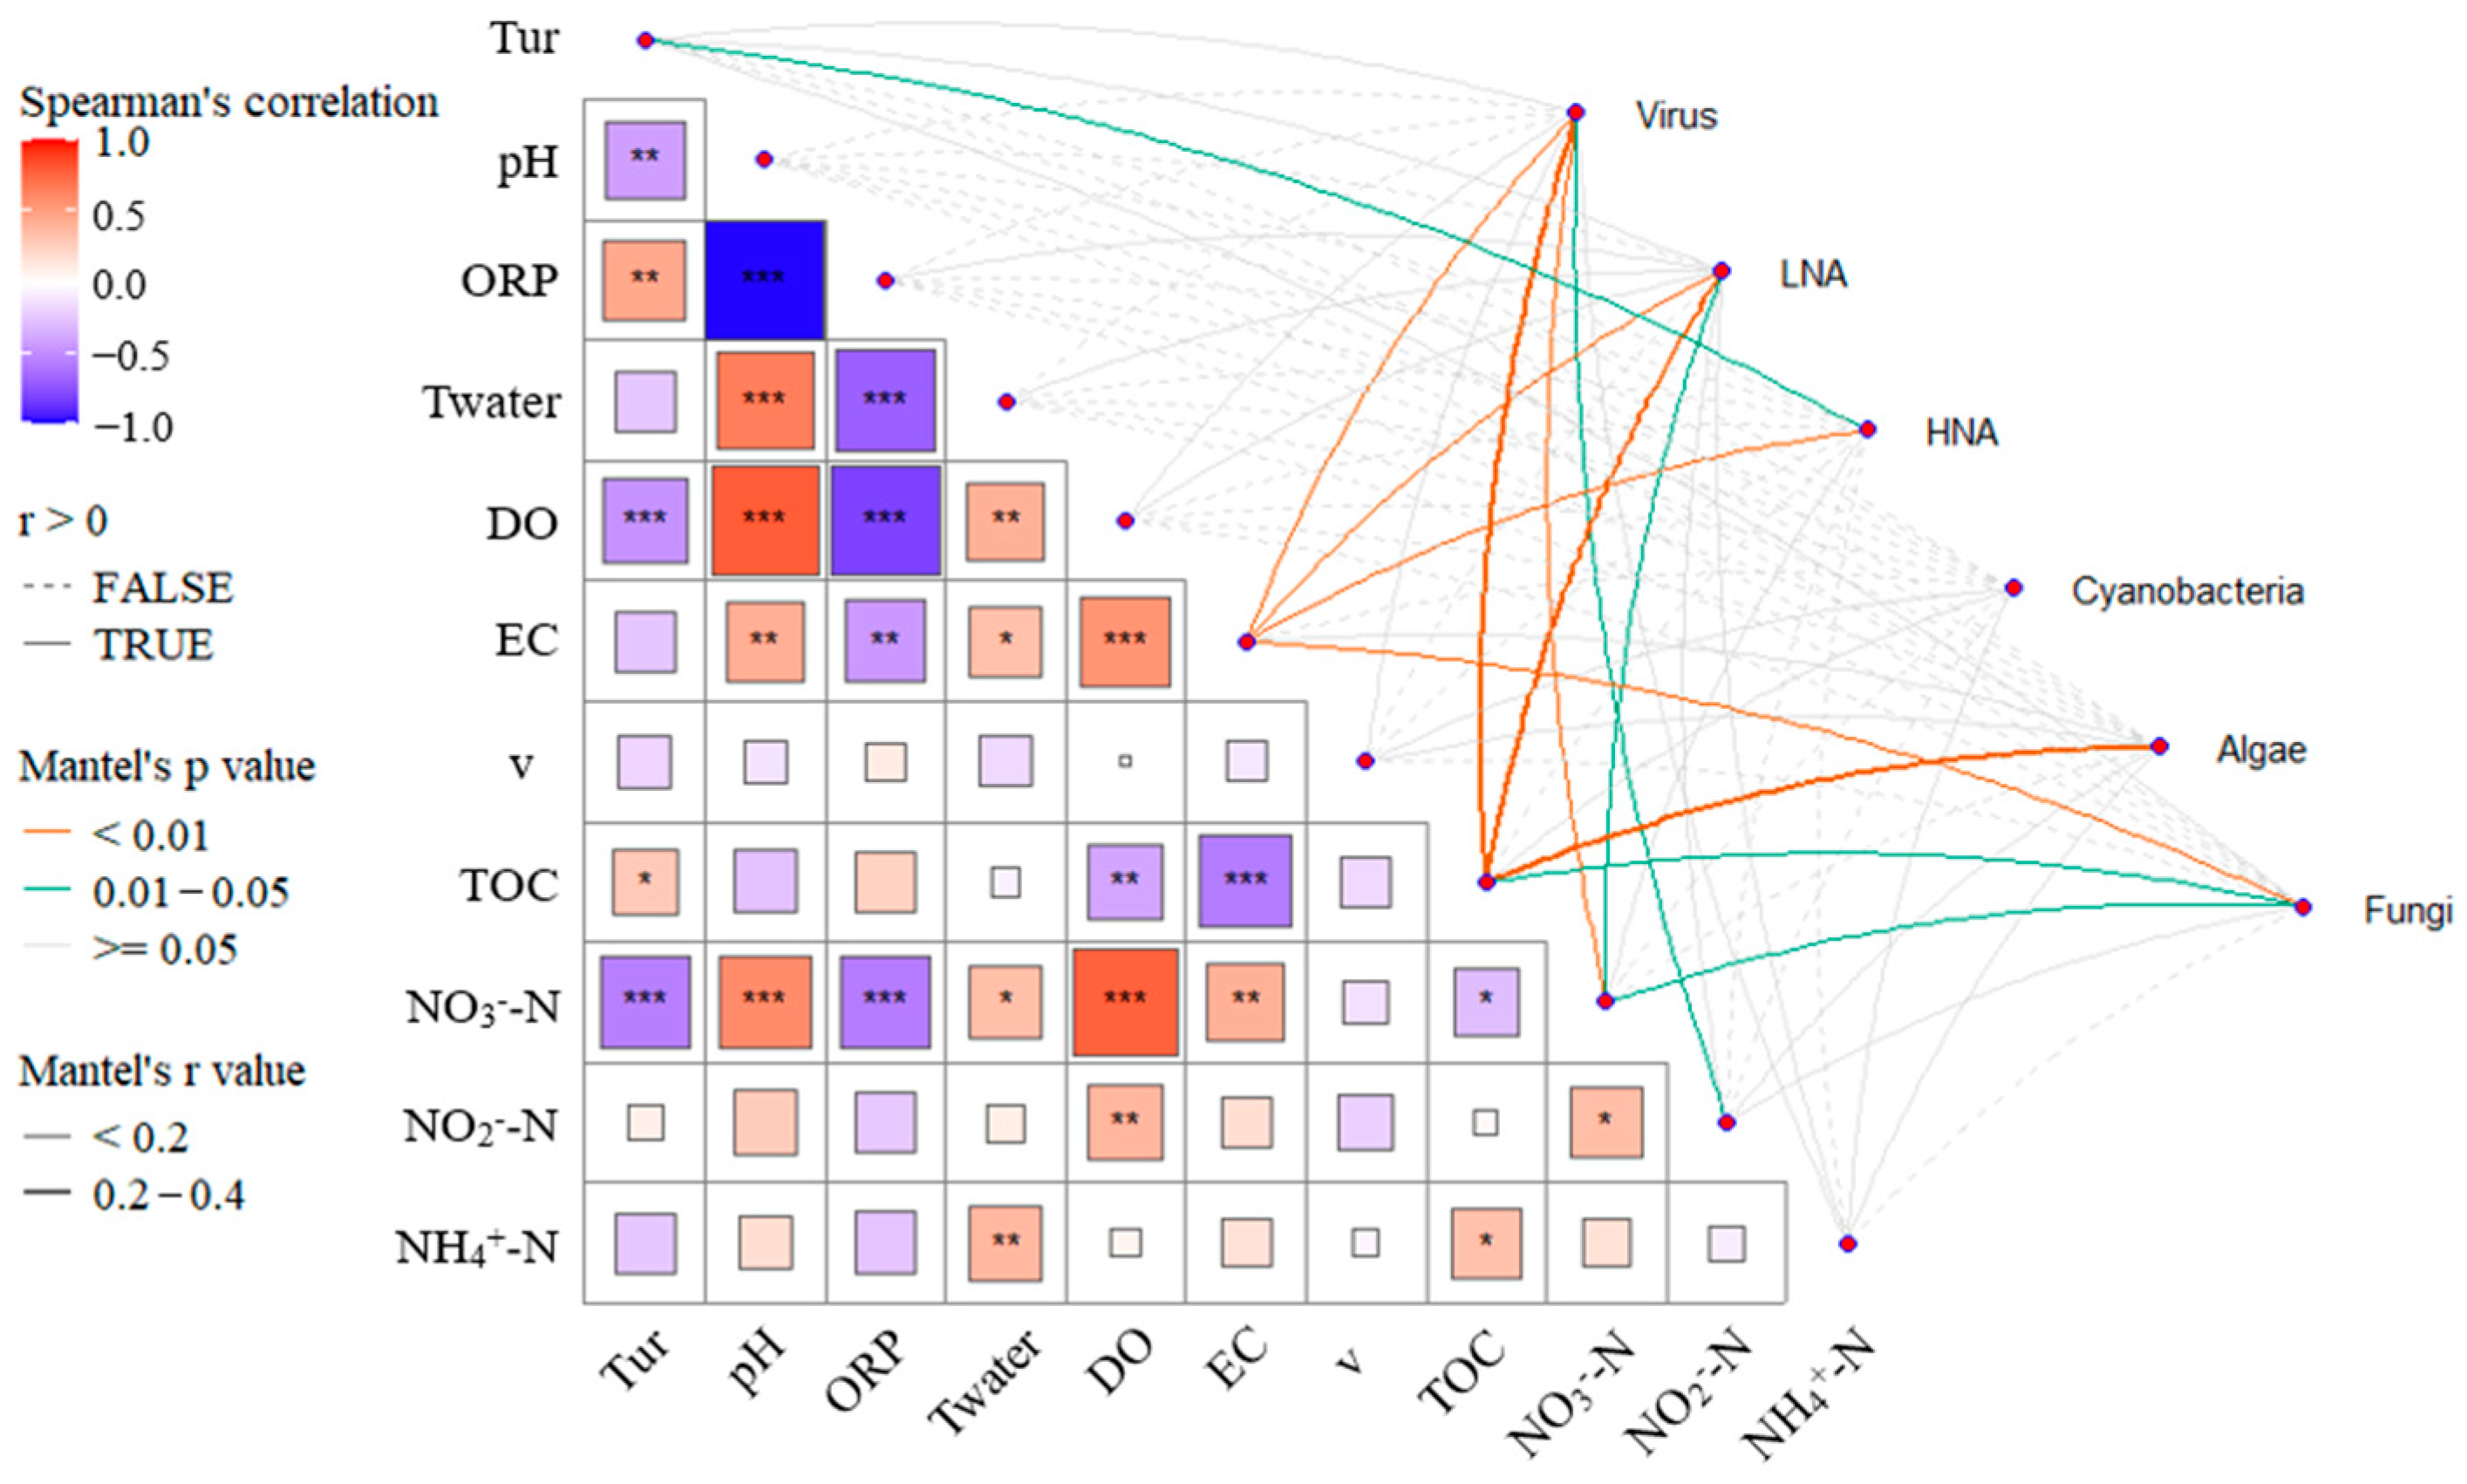
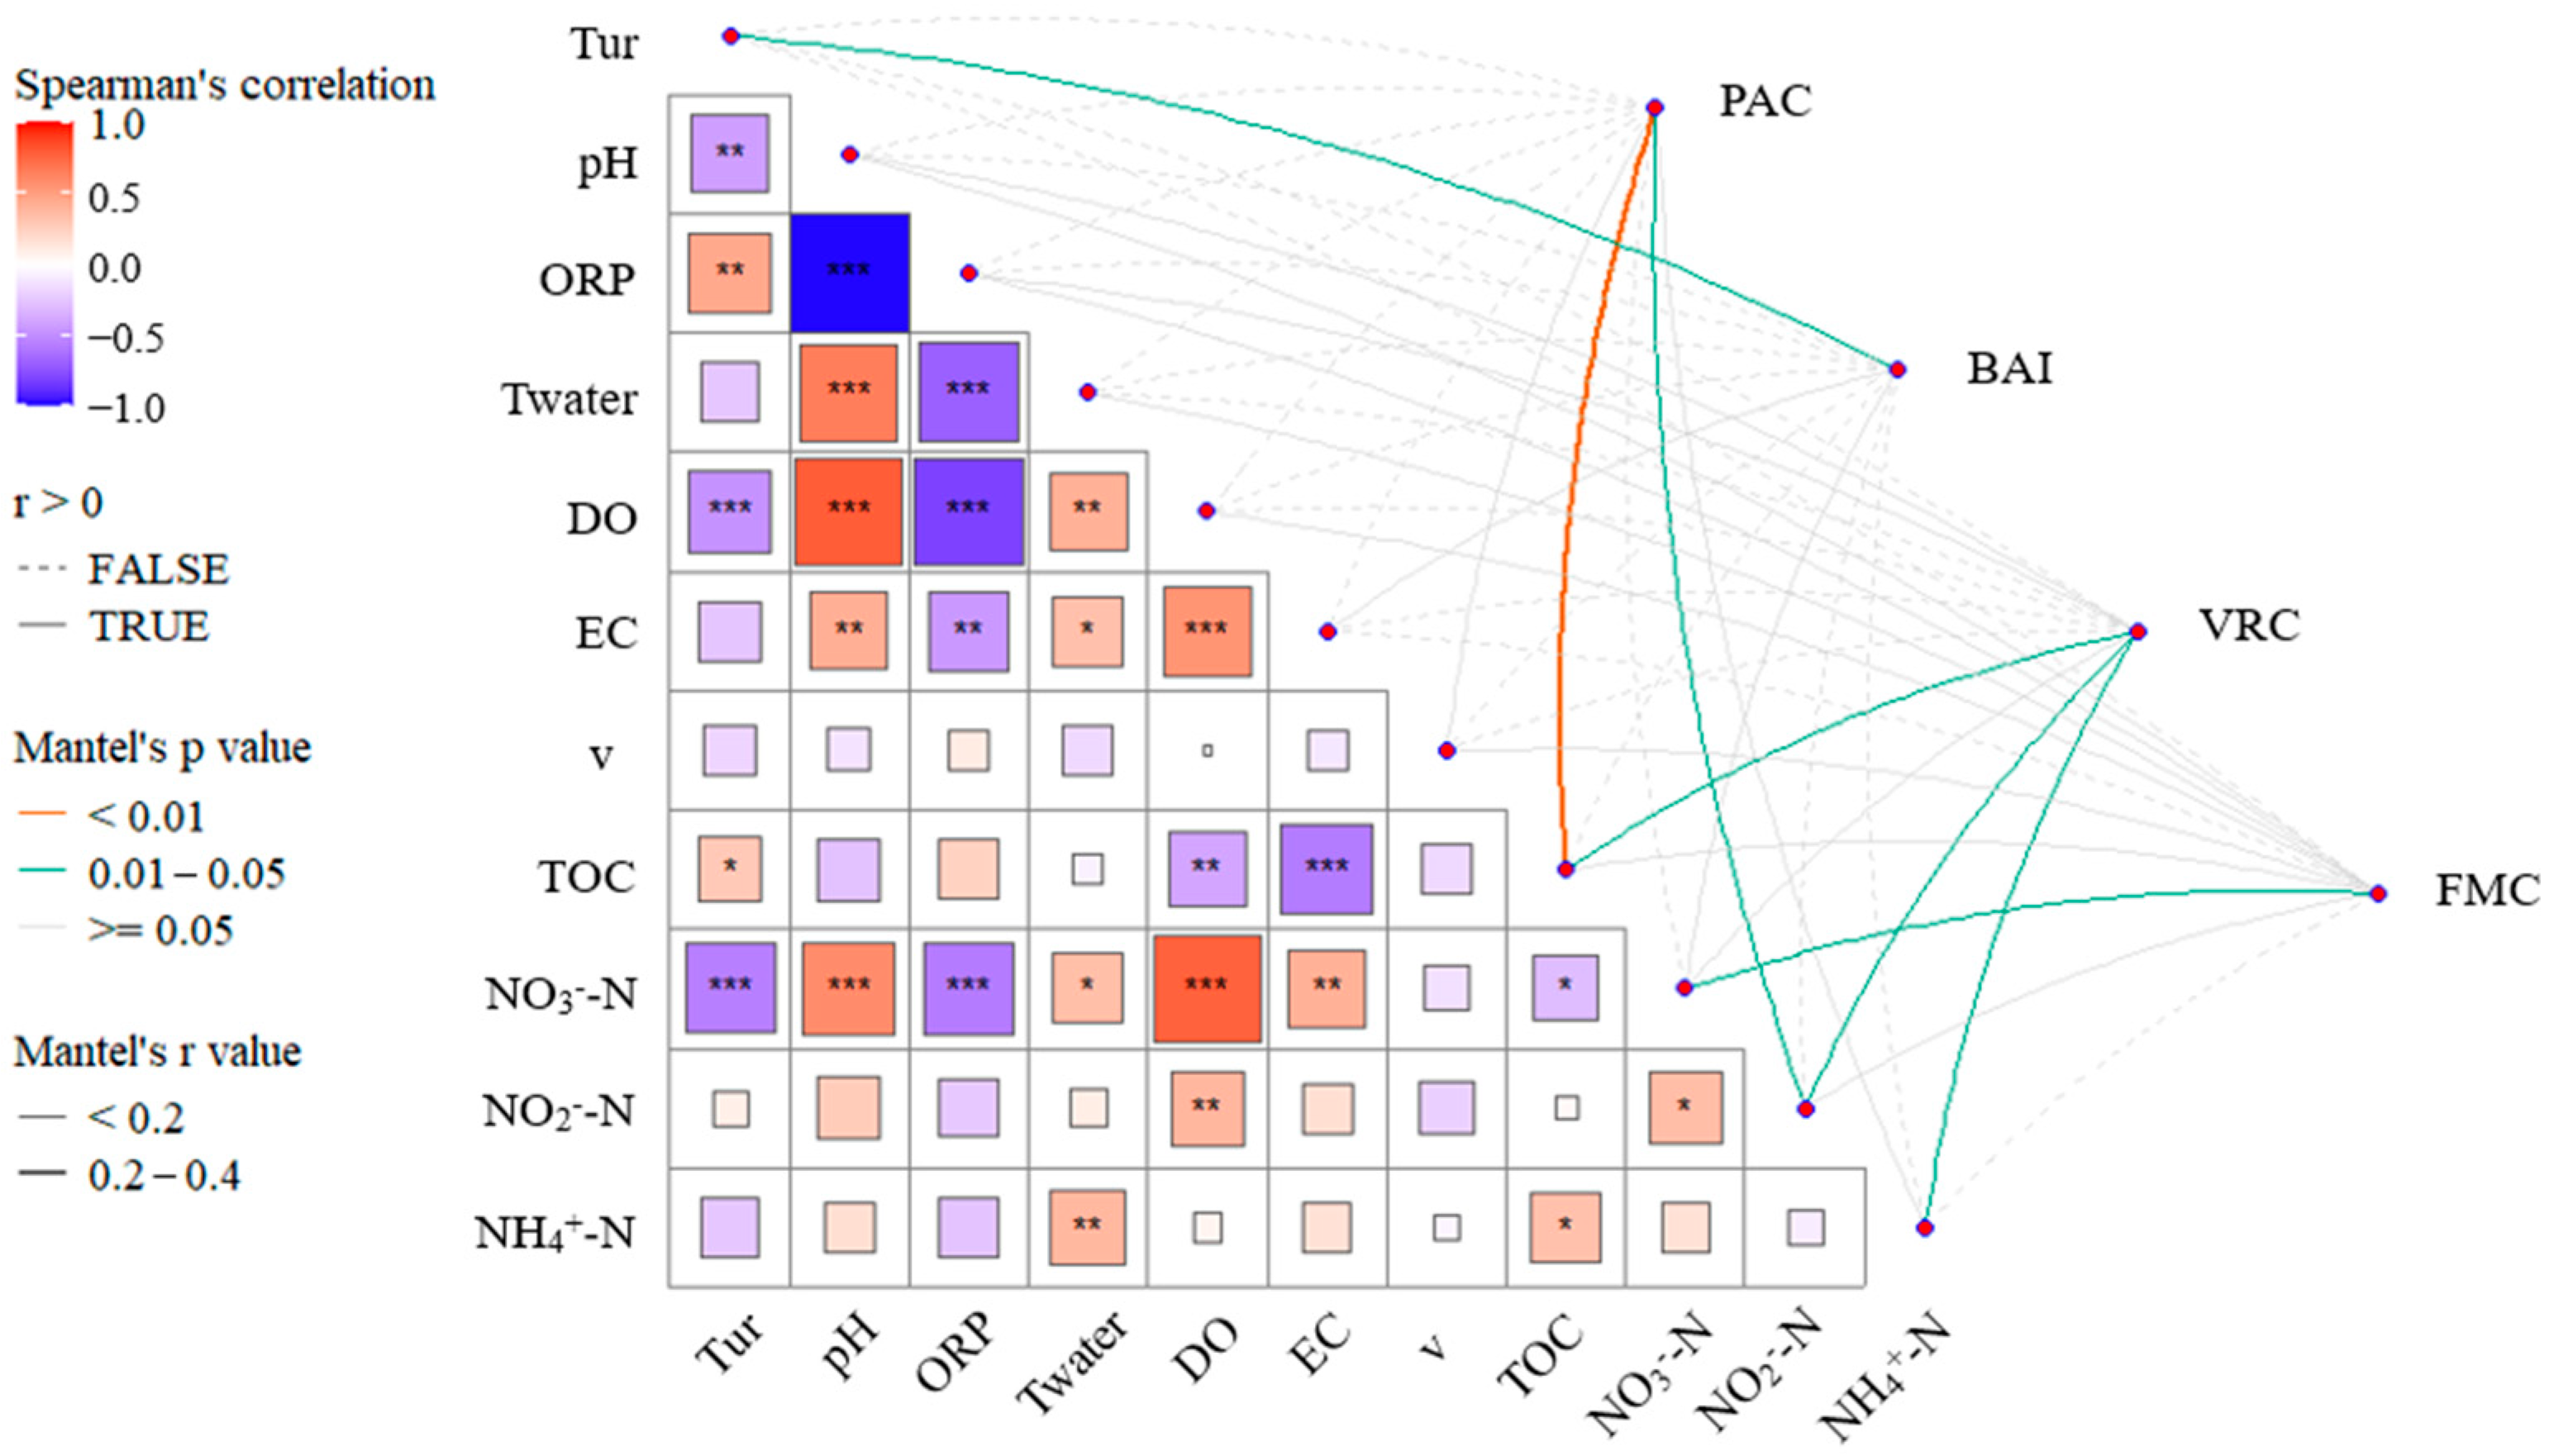
  • EC, TOC, and NO3-N concentrations are significantly correlated with the abundance of Virus, LNA, and Fungi. The concentrations of carbon and nitrogen nutrients significantly influence the microbial ecological assessment indices. Cascade hydropower stations significantly impact the PAC, BAI, and VRC of the river’s microbial ecosystem, while their influence on the FMC is relatively small. The VRC shows a decreasing trend along the cascade hydropower stations, suggesting a possible weakening effect of the stations on VRC.

Author Contributions

Conceptualization, P.L. and Z.L.; methodology, P.L., Z.L. and Z.D.; resources, P.L. and D.Z.; writing—original draft preparation, P.L.; writing—review and editing, Z.L., D.Z., X.Z. and Z.D.; visualization, P.L., Z.L. and D.Z.; supervision, X.Z. and X.S.; funding acquisition, X.S. All authors have read and agreed to the published version of the manuscript.

Funding

National Natural Science Foundation of China (NSFC) (No. 52379084) and the Key Projects of the Joint Fund of the National Natural Science Foundation of China (NSFC) (No. U22A20557).

Data Availability Statement

The data presented in this study are available on request from the corresponding author.

Conflicts of Interest

The authors declare no conflicts of interest.

Abbreviations

The following abbreviations are used in this manuscript:
qPCRquantitative Polymerase Chain Reaction
OTUsOperational Taxonomic Units
ASVsAmplicon Sequence Variants
eDNAenvironmental Deoxyribonucleic Acid
FCMFlow cytometry
CFWCalcofluor White
LNALow Nucleic Acid
HNAHigh Nucleic Acid
DNADeoxyribonucleic Acid
PACPhotosynthetic Autotrophic Capacity
BAIBacterial Activity Index
VRCVirus Regulatory Capacity
FMCFungal Metabolic Capacity
ORPOxidation-Reduction Potential
DODissolved Oxygen
ECElectrical Conductivity
TOCTotal Organic Carbon

References

  1. Sachdev, H.S.; Akella, A.K.; Kumar, N. Analysis and evaluation of small hydropower plants: A bibliographical survey. Renew. Sustain. Energy Rev. 2015, 51, 1013–1022. [Google Scholar] [CrossRef]
  2. Wang, B.; Yang, X.; Li, S.L.; Liang, X.; Li, X.D.; Wang, F.; Yang, M.; Liu, C.Q. Anthropogenic regulation governs nutrient cycling and biological succession in hydropower reservoirs. Sci. Total Environ. 2022, 834, 155392. [Google Scholar] [CrossRef]
  3. Moran, E.F.; Lopez, M.C.; Moore, N.; Müller, N.; Hyndman, D.W. Sustainable hydropower in the 21st century. Proc. Natl. Acad. Sci. USA 2018, 115, 11891–11898. [Google Scholar] [CrossRef] [PubMed]
  4. Lai, R.; Chen, X.; Zhang, L. Evaluating the impacts of small cascade hydropower from a perspective of stream health that integrates eco-environmental and hydrological values. J. Environ. Manag. 2022, 305, 114366. [Google Scholar] [CrossRef]
  5. He, F.; Zarfl, C.; Tockner, K.; Olden, J.D.; Campos, Z.; Muniz, F.; Svenning, J.C.; Jähnig, S.C. Hydropower impacts on riverine biodiversity. Nat. Rev. Earth Environ. 2024, 5, 755–772. [Google Scholar] [CrossRef]
  6. Li, W.; Wang, B.; Liu, N.; Yang, M.; Liu, C.Q.; Xu, S. River damming enhances ecological functional stability of planktonic microorganisms. Front. Microbiol. 2022, 13, 1049120. [Google Scholar] [CrossRef] [PubMed]
  7. Gao, F.Z.; Hu, L.X.; Liu, Y.S.; Qiao, L.K.; Chen, Z.Y.; Su, J.Q.; He, L.Y.; Bai, H.; Zhu, Y.G.; Ying, G.G. Unveiling the overlooked small-sized microbiome in river ecosystems. Water Res. 2024, 265, 122302. [Google Scholar] [CrossRef]
  8. Drummond, J.D.; Davies-Colley, R.J.; Stott, R.; Sukias, J.P.; Nagels, J.W.; Sharp, A.; Packman, A.I. Retention and remobilization dynamics of fine particles and microorganisms in pastoral streams. Water Res. 2014, 66, 459–472. [Google Scholar] [CrossRef]
  9. Li, J.; Dong, S.; Liu, S.; Yang, Z.; Peng, M.; Zhao, C. Effects of cascading hydropower dams on the composition, biomass and biological integrity of phytoplankton assemblages in the middle Lancang-Mekong River. Ecol. Eng. 2013, 60, 316–324. [Google Scholar] [CrossRef]
  10. Vaulot, D.; Eikrem, W.; Viprey, M.; Moreau, H. The diversity of small eukaryotic phytoplankton (≤3 μm) in marine ecosystems. FEMS Microbiol. Rev. 2008, 32, 795–820. [Google Scholar] [CrossRef]
  11. Dashkova, V.; Malashenkov, D.; Poulton, N.; Vorobjev, I.; Barteneva, N.S. Imaging flow cytometry for phytoplankton analysis. Methods 2017, 112, 188–200. [Google Scholar] [PubMed]
  12. Coggins, L.X.; Larma, I.; Hinchliffe, A.; Props, R.; Ghadouani, A. Flow cytometry for rapid characterisation of microbial community dynamics in waste stabilisation ponds. Water Res. 2020, 169, 115243. [Google Scholar]
  13. Di Bella, J.M.; Bao, Y.; Gloor, G.B.; Burton, J.P.; Reid, G. High throughput sequencing methods and analysis for microbiome research. J. Microbiol. Methods 2013, 95, 401–414. [Google Scholar] [PubMed]
  14. Li, K.; Hu, J.; Li, T.; Liu, F.; Tao, J.; Liu, J.; Zhang, Z.; Luo, X.; Li, L.; Deng, Y.; et al. Microbial abundance and diversity investigations along rivers: Current knowledge and future directions. Wiley Interdiscip. Rev. Water 2021, 8, e1547. [Google Scholar]
  15. Roots, P.; Wang, Y.; Rosenthal, A.F.; Griffin, J.S.; Sabba, F.; Petrovich, M.; Yang, F.; Kozak, J.A.; Zhang, H.; Wells, G.F. Comammox Nitrospira are the dominant ammonia oxidizers in a mainstream low dissolved oxygen nitrification reactor. Water Res. 2019, 157, 396–405. [Google Scholar] [PubMed]
  16. Perry, W.B.; Seymour, M.; Orsini, L.; Jâms, I.B.; Milner, N.; Edwards, F.; Harvey, R.; de Bruyn, M.; Bista, I.; Walsh, K.; et al. An integrated spatio-temporal view of riverine biodiversity using environmental DNA metabarcoding. Nat. Commun. 2024, 15, 4372. [Google Scholar] [PubMed]
  17. Marie, D.; Rigaut-Jalabert, F.; Vaulot, D. An improved protocol for flow cytometry analysis of phytoplankton cultures and natural samples. Cytom. Part A 2014, 85, 962–968. [Google Scholar]
  18. Zamorska, J.; Karwowska, E.; Przystaś, W. Assessment of microbiological quality of water using culture methods, flow cytometry and luminometry. Water 2023, 15, 4077. [Google Scholar] [CrossRef]
  19. Metz, S.; Lopes Dos Santos, A.; Berman, M.C.; Bigeard, E.; Licursi, M.; Not, F.; Lara, E.; Unrein, F. Diversity of photosynthetic picoeukaryotes in eutrophic shallow lakes as assessed by combining flow cytometry cell-sorting and high throughput sequencing. FEMS Microbiol. Ecol. 2019, 95, fiz038. [Google Scholar]
  20. Manohar, S.M.; Shah, P.; Nair, A. Flow cytometry: Principles, applications and recent advances. Bioanalysis 2021, 13, 181–198. [Google Scholar]
  21. Zhao, M.M.; Wang, S.M.; Chen, Y.P.; Wu, J.-H.; Xue, L.-G.; Fan, T.T. Pollution status of the Yellow River tributaries in middle and lower reaches. Sci. Total Environ. 2020, 722, 137861. [Google Scholar] [PubMed]
  22. Liu, Z.; Wang, X.; Jia, S.; Mao, B. Multi-methods to investigate spatiotemporal variations of nitrogen-nitrate and its risks to human health in China’s largest fresh water lake (Poyang Lake). Sci. Total Environ. 2023, 863, 160975. [Google Scholar]
  23. Prest, E.I.; Hammes, F.; Kötzsch, S.; van Loosdrecht, M.C.M.; Vrouwenvelder, J.S. Monitoring microbiological changes in drinking water systems using a fast and reproducible flow cytometric method. Water Res. 2013, 47, 7131–7142. [Google Scholar] [PubMed]
  24. Shen, C.F.; Meghrous, J.; Kamen, A. Quantitation of baculovirus particles by flow cytometry. J. Virol. Methods 2002, 105, 321–330. [Google Scholar] [PubMed]
  25. Lichius, A.; Zeilinger, S. Application of membrane and cell wall selective fluorescent dyes for live-cell imaging of filamentous fungi. J. Vis. Exp. 2019, 153, e60613. [Google Scholar]
  26. Hammes, F.; Egli, T. Cytometric methods for measuring bacteria in water: Advantages, pitfalls and applications. Anal. Bioanal. Chem. 2010, 397, 1083–1095. [Google Scholar]
  27. Song, Y.; Wang, Y.; Mao, G.; Gao, G.; Wang, Y. Impact of planktonic low nucleic acid-content bacteria to bacterial community structure and associated ecological functions in a shallow lake. Sci. Total Environ. 2019, 658, 868–878. [Google Scholar]
  28. García, F.C.; López-Urrutia, Á.; Morán, X.A.G. Automated clustering of heterotrophic bacterioplankton in flow cytometry data. Aquat. Microb. Ecol. 2014, 72, 175–185. [Google Scholar]
  29. Marie, D.; Shi, X.L.; Rigaut-Jalabert, F.; Vaulot, D. Use of flow cytometric sorting to better assess the diversity of small photosynthetic eukaryotes in the English Channel. FEMS Microbiol. Ecol. 2010, 72, 165–178. [Google Scholar]
  30. Thompson, A.W.; Foster, R.A.; Krupke, A.; Carter, B.J.; Musat, N.; Vaulot, D.; Kuypers, M.M.M.; Zehr, J.P. Unicellular cyanobacterium symbiotic with a single-celled eukaryotic alga. Science 2012, 337, 1546–1550. [Google Scholar]
  31. Gasol, J.M.; Morán, X.A.G. Flow Cytometric Determination of Microbial Abundances and Its Use to Obtain Indices of Community Structure and Relative Activity. In Hydrocarbon and Lipid Microbiology Protocols: Single-Cell and Single-Molecule Methods; Springer: Heidelberg, Germany, 2016; pp. 159–187. [Google Scholar]
  32. Suparna, M.; Paul, R.; Daniel, R.; Tim, U.; Jack, G.; Folker, M.; Andreas, W.; Daniel, H. Functional analysis of metagenomes and metatranscriptomes using SEED and KEGG. BMC Bioinform. 2011, 12, S21. [Google Scholar]
  33. Clark, D.R.; Ferguson, R.M.W.; Harris, D.N.; Matthews Nicholass, K.J.; Prentice, H.J.; Randall, K.C.; Randell, L.; Warren, S.L.; Dumbrell, A.J. Streams of data from drops of water: 21st century molecular microbial ecology. WIREs Water 2018, 5, e1280. [Google Scholar]
  34. Gaïa, M.; Meng, L.; Pelletier, E.; Forterre, P.; Vanni, C.; Fernandez-Guerra, A.; Jaillon, O.; Wincker, P.; Ogata, H.; Krupovic, M.; et al. Mirusviruses link herpesviruses to giant viruses. Nature 2023, 616, 783–789. [Google Scholar] [CrossRef]
  35. Wang, B.; Zhang, H.; Liang, X.; Li, X.; Wang, F. Cumulative effects of cascade dams on river water cycle: Evidence from hydrogen and oxygen isotopes. J. Hydrol. 2019, 568, 604–610. [Google Scholar]
  36. Sun, M.; Huang, K.; Shao, J.; Wu, W.; Liang, X. Effects of mountain rivers cascade hydropower stations on water ecosystems. Res. Ecol. 2022, 4, 17–26. [Google Scholar]
  37. Wang, Z.; Ma, J.; Yu, S.; Xu, Y.; Tao, Z.; Zhang, J.; Xiao, R.; Wei, H.; Liu, D. Analysis of water temperature variations in the Yangtze River’s upper and middle reaches in the context of cascade hydropower development. Water 2024, 16, 1669. [Google Scholar] [CrossRef]
  38. Chang, E.; Zhao, Y.; Wei, Q.; Shi, S.; Jiang, Z. Isolation of high-quality RNA from Platycladus orientalis and other Cupressaceae plants. Electron. J. Biotechnol. 2016, 23, 21–27. [Google Scholar]
  39. Dembowska, E.A. The use of phytoplankton in the assessment of water quality in the lower section of Poland’s largest river. Water 2021, 13, 3471. [Google Scholar] [CrossRef]
  40. Ly, Q.V.; Nguyen, X.C.; Lê, N.C.; Truong, T.-D.; Hoang, T.-H.T.; Park, T.J.; Maqbool, T.; Pyo, J.; Cho, K.H.; Lee, K.-S.; et al. Application of Machine Learning for eutrophication analysis and algal bloom prediction in an urban river: A 10-year study of the Han River, South Korea. Sci. Total Environ. 2021, 797, 149040. [Google Scholar] [CrossRef]
  41. Huang, Y.; Luo, L.; Xu, K.; Wang, X.C. Characteristics of external carbon uptake by microalgae growth and associated effects on algal biomass composition. Bioresour. Technol. 2019, 292, 121887. [Google Scholar] [CrossRef]
  42. Wang, X.; Wang, C.; Wang, P.; Chen, J.; Miao, L.; Feng, T.; Yuan, Q.; Liu, S. How bacterioplankton community can go with cascade damming in the highly regulated Lancang-Mekong River Basin. Mol. Ecol. 2018, 27, 4444–4458. [Google Scholar] [PubMed]
  43. Liu, L.; Yang, J.; Yu, X.; Chen, G.; Yu, Z. Patterns in the composition of microbial communities from a subtropical river: Effects of environmental, spatial and temporal factors. PLoS ONE 2013, 8, e81232. [Google Scholar]
  44. Qi, H.; Lv, J.; Liao, J.; Jin, J.; Ren, Y.; Tao, Y.; Wang, D.; Alvarez, P.J.; Yu, P. Metagenomic insights into microalgae-bacterium-virus interactions and viral functions in phycosphere facing environmental fluctuations. Water Res. 2025, 268, 122676. [Google Scholar]
  45. Liu, X.; Hu, S.; Sun, R.; Wu, Y. Dissolved oxygen disturbs nitrate transformation by modifying microbial community, co-occurrence networks, and functional genes during aerobic-anoxic transition. Sci. Total Environ. 2021, 790, 148245. [Google Scholar]
  46. Wang, P.; Zhao, J.; Xiao, H.; Yang, W.; Yu, X. Bacterial community composition shaped by water chemistry and geographic distance in an anthropogenically disturbed river. Sci. Total Environ. 2019, 655, 61–69. [Google Scholar] [CrossRef]
  47. Liu, L.; Wu, Y.; Yin, M.; Ma, X.; Yu, X.; Guo, X.; Du, N.; Eller, F.; Guo, W. Soil salinity, not plant genotype or geographical distance, shapes soil microbial community of a reed wetland at a fine scale in the Yellow River Delta. Sci. Total Environ. 2023, 856, 159136. [Google Scholar]
  48. Bailey, V.L.; Smith, J.L.; Bolton, H., Jr. Fungal-to-bacterial ratios in soils investigated for enhanced C sequestration. Soil Biol. Biochem. 2002, 34, 997–1007. [Google Scholar]
  49. Grossart, H.P.; Van den Wyngaert, S.; Kagami, M.; Wurzbacher, C.; Cunliffe, M.; Rojas-Jimenez, K. Fungi in aquatic ecosystems. Nat. Rev. Microbiol. 2019, 17, 339–354. [Google Scholar] [PubMed]
  50. Faust, K.; Raes, J. Microbial interactions: From networks to models. Nat. Rev. Microbiol. 2012, 10, 538–550. [Google Scholar]
  51. Yu, Z.; Gan, Z.; Tawfik, A.; Meng, F. Exploring interspecific interaction variability in microbiota: A review. Eng. Microbiol. 2024, 4, 100178. [Google Scholar]
  52. Luo, Z.; Li, S.; Hou, K.; Ji, G. Spatial and seasonal bacterioplankton community dynamics in the main channel of the Middle Route of South-to-North Water Diversion Project. Res. Microbiol. 2019, 170, 24–34. [Google Scholar]
  53. Pang, Y.; Ji, G. Biotic factors drive distinct DNRA potential rates and contributions in typical Chinese shallow lake sediments. Environ. Pollut. 2019, 254, 112903. [Google Scholar] [CrossRef] [PubMed]
  54. Zhikharev, V.; Vodeneeva, E.; Kudrin, I.; Gavrilko, D.; Startseva, N.; Kulizin, P.; Erina, O.; Tereshina, M.; Okhapkin, A.; Shurganova, G. The species structure of plankton communities as a response to changes in the trophic gradient of the mouth areas of large tributaries to a lowland reservoir. Water 2022, 15, 74. [Google Scholar] [CrossRef]
  55. Fan, H.; He, D.; Wang, H. Environmental consequences of damming the mainstream Lancang-Mekong River: A review. Earth-Sci. Rev. 2015, 146, 77–91. [Google Scholar] [CrossRef]
  56. Yang, N.; Li, Y.; Zhang, W.; Lin, L.; Qian, B.; Wang, L.; Niu, L.; Zhang, H. Cascade dam impoundments restrain the trophic transfer efficiencies in benthic microbial food web. Water Res. 2020, 170, 115351. [Google Scholar]
  57. Li, Z.; Lu, L.; Guo, J.; Yang, J.; Zhang, J.; He, B.; Xu, L. Responses of spatial-temporal dynamics of bacterioplankton community to large-scale reservoir operation: A case study in the Three Gorges Reservoir, China. Sci. Rep. 2017, 7, 42469. [Google Scholar]
  58. Yang, N.; Li, Y.; Lin, L.; Zhang, W.; Wang, L.; Niu, L.; Zhang, H. Dam-induced flow velocity decrease leads to the transition from heterotrophic to autotrophic system through modifying microbial food web dynamics. Environ. Res. 2022, 212, 113568. [Google Scholar] [PubMed]
  59. Ramanan, R.; Kim, B.H.; Cho, D.H.; Oh, H.M.; Kim, H.S. Algae–bacteria interactions: Evolution, ecology and emerging applications. Biotechnol. Adv. 2016, 34, 14–29. [Google Scholar]
  60. Liu, Y.; Li, C.; Jian, S.; Miao, S.; Li, K.; Guan, H.; Mao, Y.; Wang, Z.; Li, C. Hydrodynamics regulate longitudinal plankton community structure in an alpine cascade reservoir system. Front. Microbiol. 2021, 12, 749888. [Google Scholar] [CrossRef]
  61. Santos, M.; Oliveira, H.; Pereira, J.L.; Pereira, M.J.; Gonçalves, F.J.; Vidal, T. Flow cytometry analysis of low/high DNA content (LNA/HNA) bacteria as bioindicator of water quality evaluation. Ecol. Indic. 2019, 103, 774–781. [Google Scholar]
  62. Johannessen, T.V.; Larsen, A.; Bratbak, G.; Pagarete, A.; Edvardsen, B.; Egge, E.D.; Sandaa, R.-A. Seasonal dynamics of haptophytes and dsDNA algal viruses suggest complex virus-host relationship. Viruses 2017, 9, 84. [Google Scholar] [CrossRef] [PubMed]
  63. Gao, Y.; Lu, Y.; Dungait, J.A.J.; Liu, J.; Lin, S.; Jia, J.; Yu, G. The “regulator” function of viruses on ecosystem carbon cycling in the anthropocene. Front. Public Health 2022, 10, 858615. [Google Scholar]
  64. Martínez, A.; Larrañaga, A.; Pérez, J.; Descals, E.; Pozo, J. Temperature affects leaf litter decomposition in low-order forest streams: Field and microcosm approaches. FEMS Microbiol. Ecol. 2014, 87, 257–267. [Google Scholar] [CrossRef]
  65. Shishir, T.; Mahbub, N.; Kamal, N. Review on bioremediation: A tool to resurrect the polluted rivers. Pollution 2019, 5, 555–568. [Google Scholar]
  66. Hua, R.; Zhang, Y. Assessment of water quality improvements using the hydrodynamic simulation approach in regulated cascade reservoirs: A case study of drinking water sources of Shenzhen, China. Water 2017, 9, 825. [Google Scholar] [CrossRef]
  67. Wang, X.; Wang, P.; Wang, C.; Chen, J.; Hu, B.; Yuan, Q.; Du, C.; Xing, X. Cascade damming impacts on microbial mediated nitrogen cycling in rivers. Sci. Total Environ. 2023, 903, 166533. [Google Scholar]
  68. Bao, Y.; Wang, Y.; Hu, M.; Hu, P.; Wu, N.; Qu, X.; Liu, X.; Huang, W.; Wen, J.; Li, S. Deciphering the impact of cascade reservoirs on nitrogen transport and nitrate transformation: Insights from multiple isotope analysis and machine learning. Water Res. 2024, 268, 122638. [Google Scholar] [PubMed]
  69. Chen, Q.; Chen, Y.; Lin, Y.; Zhang, J.; Ni, J.; Xia, J.; Xiao, L.; Feng, T.; Ma, H. Does a hydropower reservoir cascade really harm downstream nutrient regimes. Sci. Bull. 2024, 69, 661–670. [Google Scholar]
  70. Jia, Y.; Hu, X.; Kang, W.; Dong, X. Unveiling microbial nitrogen metabolism in rivers using a machine learning approach. Environ. Sci. Technol. 2024, 58, 6605–6615. [Google Scholar] [CrossRef]
  71. Battin, T.J.; Lauerwald, R.; Bernhardt, E.S.; Bertuzzo, E.; Gener, L.G.; Hall, R.O., Jr.; Hotchkiss, E.R.; Maavara, T.; Pavelsky, T.M.; Ran, L. River ecosystem metabolism and carbon biogeochemistry in a changing world. Nature 2023, 613, 449–459. [Google Scholar]
Figure 1. Geographic location of the four small cascade hydropower stations and the sampling sections. The sampling section locations are denoted by combining the hydropower station codes (A, B, C, and D) with the section numbers (1, 2, 3, and 4). The arrows in the river indicate the direction of flow.
Water 17 00903 g001
Figure 2. Microbial grouping based on flow cytometry ((a): Virus, LNA, and HNA groups; (b): Algae and Cyanobacteria groups; (c): Fungi group).
Water 17 00903 g002
Figure 3. Trends in environmental factors of cascade hydropower stations. ((ak) represent turbidity, pH, ORP, Twater, DO, EC, Velocity, TOC, NO3-N, NO2-N, and NH4+-N in cascade hydropower stations, respectively).
Water 17 00903 g003
Figure 4. Trends in microbial groups abundance of cascade hydropower stations. ((af) represent the abundance of Virus, LNA, HNA, Cyanobacteria, Algae, and Fungi in cascade hydropower stations, respectively).
Water 17 00903 g004
Figure 5. Trends in ecological assessment indices of cascade hydropower stations. ((ad) represent PAC, BAI, VRC, and FMC in cascade hydropower stations, respectively).
Water 17 00903 g005
Figure 6. PCA of environmental factors in small hydropower stations.
Water 17 00903 g006
Figure 7. Correlation between microbial group abundances and environmental factors (* represents p < 0.05, ** represents p < 0.01, and *** represents p < 0.001, with no indication for p > 0.05).
Water 17 00903 g007
Figure 8. Correlation between ecological assessment indices and environmental factors (* represents p < 0.05, ** represents p < 0.01, and *** represents p < 0.001, with no indication for p > 0.05).
Water 17 00903 g008
Disclaimer/Publisher’s Note: The statements, opinions and data contained in all publications are solely those of the individual author(s) and contributor(s) and not of MDPI and/or the editor(s). MDPI and/or the editor(s) disclaim responsibility for any injury to people or property resulting from any ideas, methods, instructions or products referred to in the content.

