Abstract
Nitrification is the key process linking the oxidized and reduced forms of reactive nitrogen, playing an important role in the nitrogen biogeochemical cycle. Quantifying the nitrification rate and evaluating its environmental regulators in different aquatic environments at both regional and global scales has received increasing attention. However, the spatiotemporal variations in nitrification rates in coastal waters, particularly with different trophic states, remain unclear. By using the 15N-labeling technique, here, we quantified the nitrification rates under dark and light conditions in the surface waters of Shenzhen Bay and Dapeng Bay, representing eutrophic and oligotrophic environments, respectively. The nitrification rates were 2–3 orders of magnitude higher in Shenzhen Bay (eutrophic) than those in Dapeng Bay (oligotrophic). The concentrations of ammonium and total suspended matter play key roles in regulating the spatiotemporal distribution and difference in nitrification in these two coastal bays. The nitrification rate under the dark condition (0.13–49.37 nmol N L−1 h−1) was greater than that under light incubation (0–10.15 nmol N L−1 h−1), indicating light inhibition of 33–100% in the surface water. Such results imply that daily integrated nitrification based on the rates under dark incubation may have been overestimated. An environment with high turbidity is preferable for nitrification, as it reduces the damage caused by light to ammonia-oxidizing microbes. Collectively, the differences in nitrification rates further result in a distinct composition of dissolved inorganic nitrogen, with Shenzhen Bay dominated by nitrate and Dapeng Bay dominated by ammonium. Our results provide scientific references for the mitigation of nitrogen pollution in different trophic coastal bays.
1. Introduction
Nitrogen is a redox-sensitive element, and the transformation among different nitrogen species is one of the most complex biogeochemical cycles in the Earth system [1]. The release of anthropogenic reactive nitrogen (Nr) in recent years has totaled up to 200 Tg N yr−1, which is comparable to the rate of natural nitrogen fixation [2]. However, most of the Nr is ultimately delivered to coastal regions through river discharge, submarine groundwater discharge (riverine proportion 20–35%), and atmospheric deposition (15%) [2], resulting in significant changes in the concentration and composition of Nr and triggering a series of ecological problems, such as eutrophication, hypoxia, ocean acidification, and greenhouse gas emissions [1,3]. The amount of nitrogen has exceeded the safe limits of the Earth system, becoming the second most important environmental problem after biodiversity loss [4]. It is urgent to carry out the scientific prevention and control of nitrogen pollution in the Earth system to achieve the sustainable development of coastal ecosystems.
Nitrification, as the central pathway in the nitrogen biogeochemical cycle, is a microbe-mediated, chemoautotrophic process that oxidizes ammonium into nitrite and nitrate. The nitrification process plays a significant role in maintaining the nitrogen balance in aquatic ecosystems with environmental and climatic feedback. Firstly, nitrification changes the form of inorganic nitrogen, which, in turn, influences the community composition of phytoplankton due to different nitrogen preferences [5,6]. Secondly, the products of nitrification can be reduced back to dinitrogen gas (N2) by denitrification, which achieves Nr removement. This link between nitrification and denitrification helps to mitigate eutrophication in aquatic environments [7]. Moreover, the greenhouse gas nitrous oxide (N2O), which is about 300 times more potent that carbon dioxide in terms of global warming potential, is a byproduct of nitrification. Nitrification is the predominant pathway for producing N2O in estuarine, coastal, and even open ocean waters [8,9,10]. Additionally, nitrification, as one step in organic matter degradation, consumes oxygen and produces protons, potentially leading to hypoxia [11] and acidification [12,13] in water bodies.
In recent years, the nitrification process in different aquatic environments, from nearshore waters to open oceans at both regional and global scales, has received increasing attention. The results have indicated that the nitrification rates can vary by orders of magnitude in time and space and are regulated by multiple environmental factors, such as light exposure, the substrate, total suspended matter (TSM), temperature, salinity, and pH [14,15,16,17,18]. As the substrate, the ammonium concentration is a major limiting factor for nitrification. This is supported by positive correlations between the nitrification rates and the ammonium concentrations found in previous studies [19]. Some studies have also shown that the relationship between ammonium concentration and nitrification rates is represented by the typical kinetic curve of an enzymatic reaction [18]. Light is considered to inhibit nitrification by directly damaging nitrifying microbes [20] or enhancing the competitive capacity of phytoplankton for ammonium to regulate nitrification [21]. The TSM can protect nitrifying microorganisms from light damage by providing a site or more substrates, resulting in high nitrification rates in areas with high turbidity [15,22]. Temperature affects nitrification rates by influencing microbial enzyme activity [15,23]. Additionally, ocean acidification can promote the conversion of NH3 to NH4+, reducing the substrate concentration, and thus inhibiting nitrification [12]. However, most of these studies have focused on the spatiotemporal distribution of nitrification in individual ecosystems, such as estuaries and bays. The magnitude of nitrification and its environmental factors in coastal waters with different trophic states (e.g., eutrophic vs. oligotrophic environments) remain unclear.
Shenzhen and its surrounding areas have become the most populous and economically vibrant region in South China. The coastal waters of Shenzhen are divided into two parts: Shenzhen Bay and Dapeng Bay, with completely different environmental characteristics [24]. Shenzhen Bay (SZB) is affected by the Shenzhen River, Pearl River runoff, and sewage discharge from the cities of Shenzhen and Hong Kong, with poor hydrodynamics, resulting in a turbid, eutrophic, and high-productivity environment [25,26]. In contrast, Dapeng Bay (DPB) is mainly affected by nearshore pollution and has better water exchange, presenting an oligotrophic and relatively low-productivity environment [26]. Ecosystem issues, such as red tides, have occurred in both DPB and SZB. The red tides in SZB last longer, while those in DPB occur more frequently. The form and concentration of nitrogen may be one of the important factors [27]. This study aims to enrich our knowledge of spatiotemporal variations in nitrification and its environmental factors with different trophic states in order to supply great guidance for the prevention and control of nitrogen pollution in coastal regions. To fulfill our goal, we quantified the nitrification rates in the surface water of eutrophic SZB and oligotrophic DPB, and assessed the environmental regulators, such as light, substrate, and TSM, using an 15N isotope tracing technique and conducting seasonal field surveys.
2. Materials and Methods
2.1. Sampling
Two sampling cruises were conducted in May and October 2018, representing the wet and dry seasons, respectively. In total, 6 sites were investigated in the SZB (113.9436–113.9816° E, 22.4897–22.5052° N) and DPB (114.3871–114.4619° E, 22.5686–22.4351° N) (Figure 1). Nearly 20 L of surface water (1 m depth) at each site was collected by applying a portable water sampler and stored in a polycarbonate bottle under dark conditions in the field. In the laboratory, some of the water was filtered (0.2 μm) and preserved in 50 mL centrifuge tubes at −20 °C for later measurement of the dissolved inorganic nutrients, including the dissolved inorganic nitrogen (DIN, including NH4+, NO2−, and NO3−), phosphate (P), and silicate (Si). Another 2 L of water was filtered via 47 mm pre-combusted and pre-weighed GF/F filters. Each site included two filters; one was stored at −20 °C for later freeze-drying to measure the TSM, and the other was immediately frozen at −196 °C in liquid nitrogen until chlorophyll a (Chl a) analysis. The remaining surface water was prepared for incubation experiments to determine the on-deck nitrification rates.
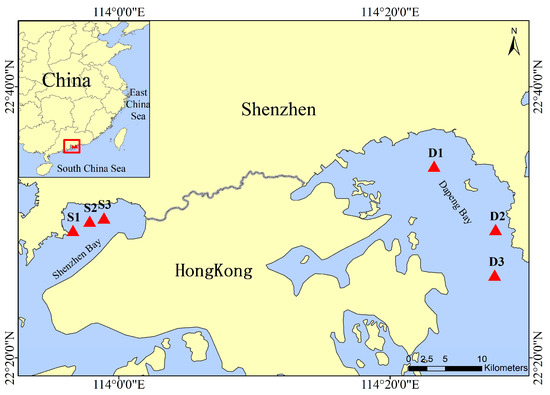
Figure 1.
Map of sampling stations in Shenzhen Bay and Dapeng Bay.
2.2. Incubation Experiments
The 15N-labeled tracer technique was applied in this study to determine the nitrification rate. Briefly, 1 mL of 1.5 mmol L−1 15NH4Cl tracer (98% 15N; Sigma-Aldrich, 299251-1G, Lot#TA2540V) was added to 3 L water samples to reach a final concentration of 0.5 μmol L−1. After the tracer addition, ~50 mL of water was immediately filtered through a 0.2 μm polycarbonate fiber filter membrane (PC membrane). The filtrate was stored frozen in a centrifuge tube, and assigned as the control sample (t0). The remaining water samples were divided into two 500 mL transparent PC bottles, one wrapped with aluminum foil to simulate dark conditions and the other to simulate light incubation conditions. The two PC bottles were incubated under natural irradiance in on-deck incubators with flow-through surface seawater to maintain a constant temperature during the incubations. The samples were fixed at a time intervals of 1 and 5 h for each experimental set. To end the incubation, the water samples were filtered using a 0.22 μm PC membrane, and the filtrate was frozen at − 20 °C until later nitrogen isotopic composition analysis.
To evaluate the effect of light on the nitrification rate, a light intensity manipulate experiment was carried out at site S2 in Shenzhen Bay during the cruise in May. Neutral density screens (Lee Filters) were used to adjust the light penetration. The light gradients were adjusted to 1333 μmol E m−2 s−1, 343 μmol E m−2 s−1, 146 μmol E m−2 s−1, 72 μmol E m−2 s−1, and 39 μmol E m−2 s−1, corresponding to surface light intensities of 100%, 26%, 11%, 5.4%, 3%, and 0%, respectively. As aforementioned, the tracer addition and experimental procedures were similar.
2.3. Chemistry Analysis
The temperature (T), salinity (S), turbidity, pH, and dissolved oxygen (DO) in surface waters were measured in the field by applying a multi-parameter water quality monitoring instrument (YSI, America) [28]. The concentrations of DIN, P, and Si were determined by an automatic nutrient auto-analyzer (QuAAtro 39) in the laboratory [29]. The concentration of Chl a was determined using UV spectrophotometry after extraction with 90% acetone [14]. The concentrations of TSM were weighed in the laboratory [30].
The nitrogen isotopic composition (δ15N) in NOX− (NO3− + NO2−) was determined using the denitrifying bacteria method [15]. NOX− was quantitatively converted into N2O by culturing Pseudomonas aureofaciens, a denitrifying bacterium (ATCC13985) lacking N2O reductase. The produced N2O gas was enriched, and the δ15N of N2O was determined using a Gasbench-II (Thermo Fisher) connected to an isotope ratio mass spectrometer (Thermo Delta V Advantage). In order to obtain accurate δ15N values, international reference materials (δ15NUSGS 34 = 1.80‰, δ15NIAEA N3 = 4.70‰, δ15NUSGS 32 = 180.00‰) were also determined to calibrate the δ15N of NOX− in the samples [31,32,33].
2.4. Nitrification Rate Calculation
Similar to previous studies, we used a linear regression approach to obtain in situ reaction rates (three incubation time points: t0, t1, and t2) [34], which was obtained using Equations (1)–(4):
where NTr is the nitrification rate (nmol L−1 h−1), △15N/△T is the slope of the produced 15N to the incubation time. 14NH4+ and 15NH4+ represent the concentrations of ammonium in the environment and after the addition of tracer, respectively. 15N (nmol L−1) represents the 15NOX− concentration of NOX− products. [NOX−] is the concentration of nitrate and nitrite, and we assume that the concentration of [NOX−] remains constant during the incubation from t0 to t2. 15N% represents the ratio of 15NOX− to 15NOX– plus 14NOX−, calculated using Equation (3). The ratio of (15N/14N)sample refers to the ratio of 15N to 14N in the NOX− of the sample, which is calculated using Equation (4). The δ15N is the nitrogen isotope value of NOX−, determined using isotope ratio mass spectrometry. The ratio of (15N/14N)reference is the ratio of 15N to 14N in the atmospheric N2, which is typically taken as 0.365% [15]. NTr-d is the daily rate of nitrification (nmol L−1 d−1). NTr-L and NTr-D represent the nitrification rates (nmol L−1 h−1) in light and dark incubation, respectively. Combining the nitrification rates under light and dark conditions and taking into account the effect of circadian rhythms, the daily rates were integrated using light plus dark rates (12 + 12 h), as shown in Equation (5).
2.5. Nutrient Limitation Criteria and Evaluation of Potential Eutrophication
Based on the ratio of nutrients absorbed by phytoplankton, the dissolved form of available nutrients, and the possible limiting conditions of Si, N, and P in phytoplankton growth, we used a criterion proposed by previous studies [35,36] to systematically evaluate the stoichiometric limitation of each nutrient: (1) when Si/P > 22 and N/P > 22, phosphate is the limiting factor; (2) when N/P < 10 and Si/N > 1, DIN is the limiting factor; and (3) when Si/P < 10 and Si/N < 1, dissolved silicate is the limiting factor.
We then used the potential eutrophication assessment model (Table 1) to evaluate the trophic states in our study area [37].

Table 1.
The classification of nutrient levels using the potential eutrophication assessment model.
3. Results
3.1. Environmental Settings
The temperatures in SZB and DPB ranged from 26.7–30.8 °C, with no significant difference between the two regions. The temperatures in May were slightly higher than in October (Figure 2A). The salinity varied from 17.0–26.0 in SZB, which was significantly higher than that in DPB, which ranged from 32.1 to 33.7 regardless of the sampling time (Figure 2B). The pH varied from 7.56 to 8.12 in the two study areas. The pH in May was higher than in October in SZB, while there was no obvious difference between the two months in DPB (Figure 2C). The concentrations of Chl a in SZB (2.3–10.9 μg L−1) were generally 2–5 times higher than those in DPB (0.7–1.1 μg L−1). In particular, the Chl a concentration was significantly higher in May than that in October in SZB, whereas the opposite trend was found in DPB between the two months (Figure 2D). The concentrations of TSM in SZB and DPB ranged from 22.6 to 44.7 mg L−1 and from 4.0 to 20.3 mg L−1 during the sampling periods, with the TSM concentrations in May being 2 and 4 times higher than those in October, respectively (Figure 2E).
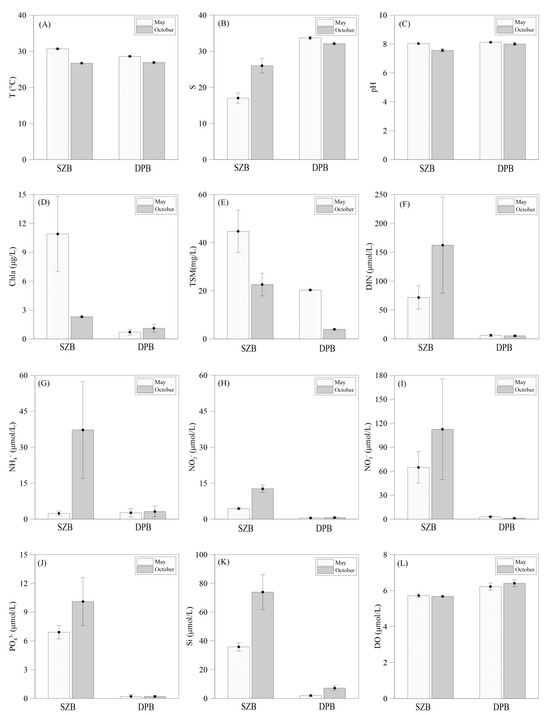
Figure 2.
Results of environmental factors in Shenzhen Bay and Dapeng Bay in different months. (A) Temperature, (B) salinity (S), (C) pH, (D) chlorophyll a (Chl a), (E) total suspended solids (TSMs), (F) inorganic nitrogen (DIN), (G) ammonia nitrogen, (H) nitrite, (I) nitrate, (J) phosphate, (K) silicate, and (L) dissolved oxygen. White and black filled bars are averages of three stations, and error bars are standard deviations.
Overall, the concentrations of DIN, ammonium, nitrite, nitrate, phosphate, and silicate in SZB were significantly greater than those in DPB (Figure 2G–I), implying eutrophic and oligotrophic environments in SZB and DPB, respectively. Among the three DIN species, the concentration of nitrate in SZB (64.8 to 112.4 μmol L−1) was two orders of magnitude higher than the that in DPB (1.2–3.0 μmol L−1). The concentrations of ammonium (2.4–37.2 μmol L−1) and nitrite (4.4–12.7 μmol L−1) in SZB were up to 14 and 25 times higher than the results in DPB. This may be the reason for the smaller cumulative areas and shorter durations of each red tide in DPB, as the low nitrogen and phosphorus concentrations in DPB are more easily depleted [27]. In SZB, the concentrations of these nutrients showed significant variations, with higher observations in October than those in May. However, there was no obvious variation in the nutrient concentration between the two months in DPB (Figure 2G–I). This may be caused by heavy rainfall dilution in May, while in the dry season, anthropogenic discharges and poor water circulation lead to longer retention times of inorganic nitrogen in SZB. In DPB, there is no significant monthly variation, as better hydrodynamic exchange occurs [27].
In terms of the composition of DIN, nitrate was the main component in SZB, with a contribution of 61.7–92.6% to the total DIN pool, which was significantly higher than those of ammonium (1.7–26.5%) and nitrite (5.2–16.4%) (Figure 3A,B). The percentage of nitrate in SZB decreased from 86.3–92.6% in May to 61.7–73.7% in October, while the percentage of ammonium increased (Figure 3A,B). In DPB, the proportion of nitrate (39.6–69.5%) was comparable to that of ammonium (21.3–54.1%) during the sampling in May (Figure 3C). Nevertheless, the proportion of nitrate decreased to 10.4–39.3%, and ammonium predominated the DIN species in October (Figure 3D).
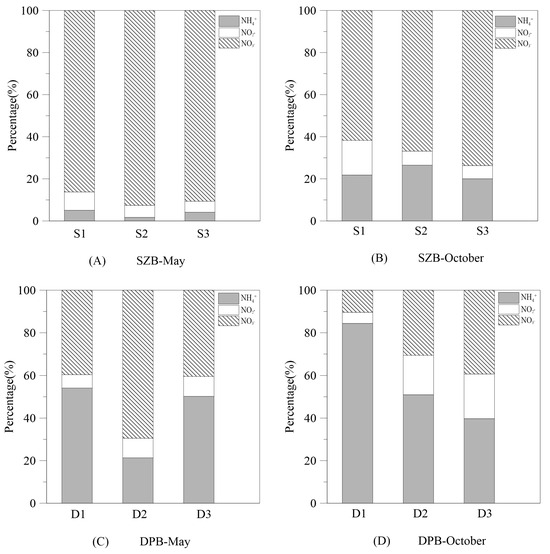
Figure 3.
The composition proportions of ammonium, nitrite, and nitrate in dissolved inorganic nitrogen in May and October in Shenzhen Bay and Dapeng Bay. S1, S2, and S3 and D1, D2, and D3 represent the survey stations in Shenzhen Bay and Dapeng Bay, respectively.
In SZB, the value of N/P (7.5–18.6) was obviously larger than those of Si/P (4.2–8.6) and Si/N (0.4–0.9). However, the values of N/P (12.9–100.9) and Si/P (6.1–51.4) were nearly the same order of magnitude and higher than the value of Si/N (0.3–1.8) in DPB (Table 2). Based on the calculation results of N/P, Si/P, and Si/N, and according to the classification system in Table 1, the water quality in SZB was classified as eutrophic and at level III, while the water quality in DPB was oligotrophic and at level I (Table 2). Silicate and phosphate were the main limiting elements in SZB and DPB, respectively. It should be noted that our assessment was limited to identifying the potential for eutrophication in the two study areas. The presence of eutrophication can be considered as an indicator of unhealthy water quality. However, oligotrophic conditions do not necessarily imply a healthier ecosystem. If nutrient limitations constrain biological productivity, this will lead to reduced resilience against environmental changes, such as climate shifts or pollution events.
Table 2.
The results of the potential eutrophication assessment in SZB and DPB.
3.2. Nitrification Rate
In May, the nitrification rates varied from 0.47 to 10.15 nmol L−1 h−1 under light conditions and from 1.56 to 49.37 nmol L−1 h−1 under dark conditions in SZB (Figure 4A). In October, the nitrification rates were 0–0.90 nmol L−1 h−1 and 0.02–0.09 nmol L−1 h−1 in SZB and DPB under light conditions, respectively. In contrast, the nitrification rates under dark conditions in the two regions were 7.90–9.68 nmol L−1 h−1 and 0.13–0.25 nmol L−1 h−1 (Figure 4B,C). Spatially, the nitrification rates in SZB were two orders of magnitude higher than those in DPB. The nitrification rates during dark incubation were significantly higher than the rates during light incubation regardless of the sampling time and region, except for station S3 in May. According to the correlation analysis, the nitrification rates were significantly and positively correlated to TSM. Further, the nitrification rates under light conditions were positively correlated to the Chl a concentration (Table 3).
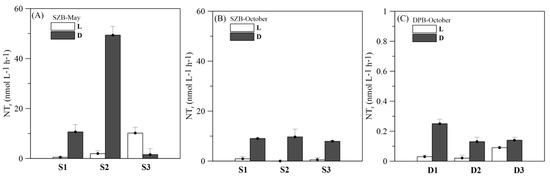
Figure 4.
The variations in the nitrification rates of SZB and DPB in May and October. The white and black-filled bars represent the rates under light and dark conditions, respectively.
Table 3.
Relationship between nitrification rate and environmental factors.
The daily nitrification rates in the two bays were evaluated considering the diurnal rhythmic variation (Figure 5). The daily integrated nitrification rates in SZB ranged from 101.16 to 615.60 nmol L−1 d−1 and were 1–2 orders of magnitude higher than those in DPB, which ranged from 1.73 to 3.30 nmol L−1 d−1. The daily nitrification rate in SZB varied greatly among the stations (296.44 ± 276.42 nmol L−1 d−1) in May, while the spatial difference was smaller in October (112.17 ± 9.7 nmol L−1 d−1). Similar to SZB, there was no significant spatial difference in the daily nitrification rate in DPB in October (with a mean value of 2.58 ± 0.80 nmol L−1 d−1).
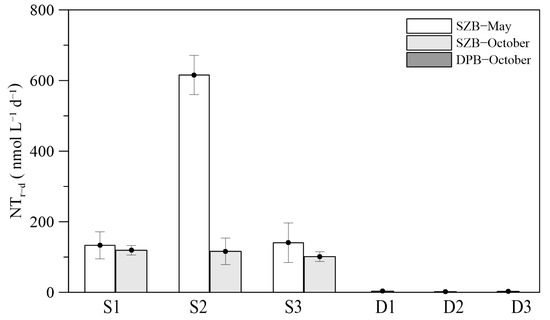
Figure 5.
Average daily nitrification rates in Shenzhen Bay and Dapeng Bay.
3.3. Effect of Light on Nitrification Rate
The nitrification rates at station S2 decreased exponentially as the light intensity increased (Figure 6). When the light intensity was higher than 146 μmol E m−1s−1, the nitrification rate was strongly inhibited and decreased to 1.93–3.86 nmol L−1 h−1. When the light intensity was less than 72 μmol E m−1s−1, the nitrification rate increased gradually. The nitrification rate increased sharply from 8.87 nmol L−1 h−1 to 49.37 nmol L−1 h−1, with the light intensity decreasing from 39 μmol E m−1 h−1 to 0 μmol E m−1 h−1. Under dark conditions (when the light intensity was 0), the rate was the highest, with a value of 49.37 nmol L−1 h−1.
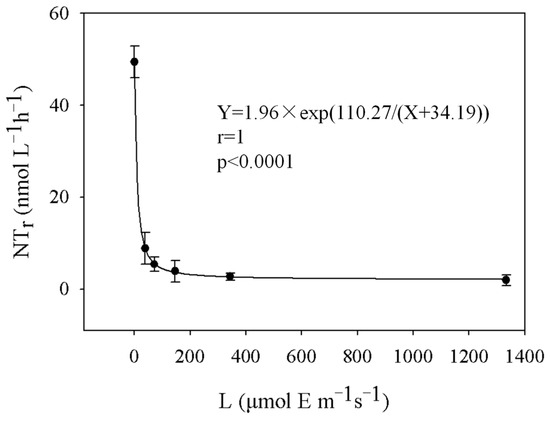
Figure 6.
The effect of light intensity on the nitrification rate.
4. Discussion
We compared the nitrification rates of different global aquatic environments (Table 4). The nitrification rates exhibited significant spatiotemporal variations, with potential differences spanning several orders of magnitude [19]. Our estimations in the eutrophic waters of SZB (101.16–615.60 nmol L−1 d−1) were comparable to those found in other eutrophic environments, such as Wuyuan Bay (4.3–644.5 nmol L−1 d−1) [15] and San Francisco Bay (7–310 nmol L−1 d−1) [19]; however, our results were significantly lower than the nitrification rates in the Pearl River Estuary (0–18200 nmol L−1 d−1) [11]. Correspondingly, the ammonium concentrations in SZB (2.4–37.2 μmol L−1) were similar to those in Wuyuan Bay (1.1–27.0 μmol L−1) and San Francisco Bay (0.4–19 μmol L−1), but much lower than that in Pearl River Estuary (0–183.3 μmol L−1). In contrast, the nitrification rates in oligotrophic environments in DPW (1.73–3.30 nmol L−1 d−1) were close to those of coastal oceans, such as the eastern tropical North Pacific (0–36 nmol L−1 d−1) [7] and the central California Current (0–31 nmol L−1 d−1) [38], and higher than those in the open ocean, such as the surface waters of the South China Sea, East China Sea, and Northwest Pacific (<1 nmol L−1 d−1) [14,34,39]. The corresponding ammonium concentrations in DPW were close to those in the eastern tropical North Pacific and central California Current, and higher than the ammonium concentrations in the surface waters of the South China Sea, East China Sea, and Northwest Pacific (<150 nmol L−1). The significant spatial variability in the nitrification rates corresponds well with the distribution of substrate ammonium, indicating that ammonium is a key environmental factor in the distribution of nitrification rates in various aquatic environments. However, there was no positive correlation between the nitrification rates and ammonium concentrations in this study (Table 3). The spatial distribution characteristic of high nitrification rates corresponding to high ammonium concentrations was consistent with studies in the Pearl River Estuary and San Francisco Bay [11,19]. In addition, a previous study in the Scheldt Estuary indicated that a significant reduction in nutrient input to the estuary has led to a noticeable decrease in nitrification rates in recent years [40].
Table 4.
The variation in nitrification rates from different global aquatic environments.
Previous studies in areas such as Hood Canal [41] and Sargasso Sea [42] have found a linear relationship between nitrification rates and ammonium concentrations. The ammonium concentrations in these regions were at the level of nmol L−1, and the half-saturation constants for nitrifying microorganisms in Hood Canal and Sargasso Sea were reported to be 98 nmol L−1, 65 ± 41 nmol L−1 respectively [41,42]. It is reasonable to observe a statistically positive correlation between nitrification rates and ammonium concentrations in these areas under a substrate-limited condition. Meanwhile, in our study, the ammonium concentration, especially in Shenzhen Bay ranged from 1.43 to 53.25 μmol L−1 (Figure 2), due to non-point sources and overflow pollution from intercepted and drained sources [25]. Such a eutrophic environment makes it unlikely for the growth of ammonia-oxidizing bacteria to be limited by ammonium; hence, there was no significant linear relationship between the nitrification rates and ammonium concentrations. In addition, the other factors, such as the nitrifying microorganisms/phytoplankton interaction, turbidity, temperature, light, rainfall, etc., may also mask this linear relationship [11].
Nitrification was significantly inhibited by light in our study (Figure 7A),which is consistent with previous research results [11,43]. The intensity of light inhibition was greater than 50%, and even reached up to 100% (Figure 7B). Furthermore, analysis of the suppression under different light intensity gradients revealed that the nitrification rates were almost completely inhibited when the light intensity was around 350 μmol E m−1 s−1. Previous research in Delaware showed similar findings, with a maximum inhibitory light intensity for nitrification of around 300 μmol E m−1 s−1 [43]. Subsequently, the nitrification rates increased, reaching an inflection point when the light intensity decreased to approximately 80 μmol E m−1 s−1. Nitrification increased dramatically, by nearly fivefold, as the light intensity was reduced from 80 μmol E m−1 s− to 0 μmol E m−1 s−1. This pattern of an exponentially decreasing nitrification rate with increasing light intensity is consistent with previous studies in the Delaware River and the South China Sea [14,43].
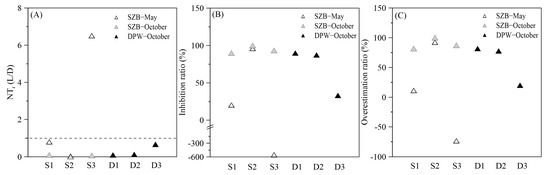
Figure 7.
Comparison of nitrification rates under light and dark conditions at different stations. (A) Ratio of the nitrification rate under light to that under dark condition; (B) light inhibition ratio; (C) the overestimation of the daily integral rate using only the nitrification rate under dark.
However, the impact of light on nitrification is still a subject of considerable debate and uncertainty. Early studies suggested that light inhibits nitrification by damaging the ammonia monooxygenase or catalase of nitrifying microorganisms [1,44,45,46]. Nitrification rates and the abundance of nitrifier genes frequently exhibit a vertical distribution pattern, with low values in the upper ocean and a maximum at the bottom of the euphotic zone, further supporting the theory that nitrification is light-inhibited [38,42]. However, recent studies of active nitrification in the sunlit ocean have challenged this view [21,41,47]. Therefore, some scholars have proposed that light enhances the competitive ability of phytoplankton to assimilate ammonium, leading to a substrate insufficiency, and thus, limiting the nitrification process [21]. Nevertheless, some nitrifying microorganisms have been identified as having the ability to reduce oxidative stress and repair UV damage [48,49], and thus, can resist the effects of light in the upper ocean [50]. Given the high concentration of ammonium in our study area, the inhibition of nitrification rates by light conditions should be a direct inhibition of microorganisms rather than competition for substrates with phytoplankton. The detectability of nitrification rates in the surface water of our study indicates that there may be some nitrifying microorganisms that can recover from light inhibition in the dark in this study area [50].
The aforementioned results indicate that both dark and night nitrification rates should be considered to calculate the daily integrated nitrification in aquatic environments, due to the inhibition effect of light. Previous studies that have used dark incubation rates to obtain the daily average nitrification rate in light-exposed areas may have led to overestimated results [7,19,22]. By comparing the data from this study, we found that the daily integrated nitrification rate calculated from the rate under dark conditions may be overestimated by more than 50%, and even up to 98% (Figure 7C). Therefore, we propose that calculating the daily average nitrification rate must consider the circadian rhythm of nitrifying microorganisms.
TSM is another key environmental factor affecting nitrifying microorganisms and their metabolic activity in aquatic systems [15,22]. Particles can provide a surface area for nitrifying microorganisms to adsorb more ammonium, and in oxygen-limited environments, iron and manganese ions on particles can also provide electron acceptors for ammonia-oxidizing microbes [22]. Moreover, the microenvironment provided by particles can protect nitrifying microorganisms from light damage or attenuate the photosynthesis of phytoplankton, reducing their competitive ability for ammonium nitrogen, and resulting in high nitrification rates in areas with high turbidity [15]. Previous studies at the Yangtze River Estuary [22], Wuyuan Bay [15], Seine River [51], Pearl River Estuary [11], and Baltic Sea [52] have also found a positive correlation between nitrification rates and TSM. For instance, In Wuyuan Bay, as the TSM concentration increased, the nitrification rate also increased [15]. By further distinguishing between particle-associated nitrification rates and free nitrification rates, they found that the ratio of particle-associated rates to the total nitrification rates increased with the TSM, indicating that in nearshore environments with high TSM, particle-associated nitrification rates play a more important role. Given that the ammonium concentrations in our study area were in the umol L−1 range, we believe it is because particles mainly provide a protective environment that shields nitrifying microorganisms from photic harm [53].
Temperature affects the activity of nitrifying microorganisms, and thus, influences the rate of nitrification, making it one of the important factors affecting nitrification rates [15,19]. The results of a temperature gradient cultivation experiment in Wuyuan Bay showed that both ammonium oxidation archaea and bacteria had consistent temperature sensitivity, with a Q10 value of 2.2 ± 0.2, and an optimal temperature of 29 °C [15]. In a study of Ariake seawater in Japan, it was also found that the nitrification rate was almost zero at temperatures below 5–10 °C and above 40 °C. However, within the range of 15–29.5 °C, the rate increased exponentially with the rise in temperature [18]. In this study, the temperature variation between different months in the two study areas was small, so there was no significant difference in the nitrification rates across the different survey months.
The higher Chl a content in SZB compared to DPB suggests higher primary productivity in SZB due to the higher nutrient concentration, which is consistent with previous studies [26]. Chl a represents a proxy of phytoplankton to some extent, and phytoplankton compete with nitrifying microorganisms for substrate ammonium in light, thereby affecting the rate of nitrification [21]. For instance, nitrification rates in Monterey Bay decreased with increasing Chl a concentrations [21]. In our study, the substrate concentrations were relatively high at the μmol L−1 level, and such competitive relationships showed a small effect on the nitrification rate, particularly in SZB. Interestingly, under light conditions, the nitrification rates showed a positive correlation with the Chl a concentration (Table 3), indicating that phytoplankton do not compete with nitrifying bacteria for substrate but rather provide a protective environment that shields nitrifying bacteria from the effects of light, thus promoting nitrification. The significant positive correlation between Chl a and TSM (r = 0.79, p < 0.05) suggests that Chl a is an important source for TSM, further supporting this hypothesis.
In addition to the environmental factors mentioned above, the effect of salinity on nitrification in the estuarine environments cannot be ignored [16]. The nitrification rates showed a significant negative correlation (r = 0.85, p < 0.05) with salinity when the results of station S2 from the May survey were not considered. Previous studies have shown that high nitrification rates were found to occur at low or intermediate salinities in the Mississippi River [54] and Yangtze River Estuary [22]. In addition, continuous stirred tank reactors (CSTRs) were found to have a negative correlation between nitrification and salinity when treating flue gas desulfurization wastewater or artificial wastewater [55]. Both field and bioreactor studies have shown that salinity has an inhibitory effect on the activity of ammonia-oxidizing bacteria [56,57]. The high salinity of DPB mixed with seawater reduces the nitrification rate physiologically to some extent, which is one of the reasons why the nitrification rate of DPB is lower than that of SZB. In summary, in this study, the higher nitrification rates in SZB compared to DPB are mainly driven by the substrate concentration and TSM, while other effects, such as Chl a and salinity, should also be taken into account (Figure 8).
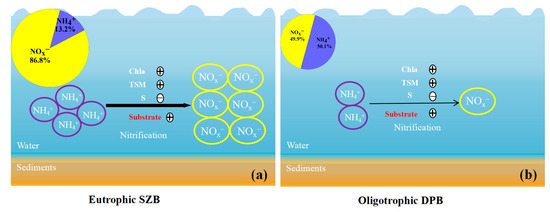
Figure 8.
A conceptual diagram of nitrification pathways in (a) eutrophic SZB and (b) oligotrophic DPB. The purple and yellow represent ammonium and nitrate plus nitrite, respectively. The black arrows of different sizes represent the nitrification rates. “+” represents promotion, and “−” represents inhibition. The red-colored “substrate” indicates that the nitrification rates in the two different study areas are driven by ammonium concentrations.
5. Conclusions
We applied nitrogen isotope technology to investigate nitrification in nearshore waters with different trophic states and its main environmental regulatory factors. This study was the first to measure the nitrification rates in Shenzhen Bay and Dapeng Bay and their factors at the same time. The DIN composition in eutrophic Shenzhen Bay was predominated by nitrate, while in oligotrophic Dapeng Bay, it was dominated by ammonium. The nitrification rates in Shenzhen Bay (a eutrophic environment) were significantly greater than those in Dapeng Bay (an oligotrophic environment), which was driven by ammonium concentration. Nitrification has further resulted in a distinct composition of DIN between these two regions, due to the fact that domestic sewage and aquaculture wastewater discharges near the coast are mainly in the form of ammonium. Considering ecosystem adaptability, more attention needs to be paid to nitrification and its ecological effects in the future. Therefore, strict measures should be taken in the future to reduce non-point source and overflow pollution in the eutrophic SZB. Meanwhile, follow-up monitoring should be conducted in the oligotrophic DPB to keep track of the changes in the environmental baseline in a timely manner.
Our study also found that the nitrification rate is closely related to the concentration of TSM, which is affected by rainfall, land use, and tidal/wave energy in the coastal zone. Future research can further investigate nitrification rates and their influencing factors under different particle size conditions by separating particulate and free-living microorganisms. Additionally, light gradient cultivation experiments showed that the inhibition rate of light on nitrification ranged from 33% to 100%, possibly due to direct light damage to nitrifiers. According to the detectable nitrification rates in surface water, there may be some nitrifying microorganisms that can recover from light inhibition in the dark in our study area. Furthermore, we propose that daily average nitrification rate calculations must consider the circadian rhythm of nitrifying microorganisms. In addition, this study only focused on nitrification in surface waters in two coastal bays with distinct trophic gradients. Future studies are needed to understand water column nitrification and the relationship between nitrifiers and phytoplankton. Overall, more in situ nitrification investigations should be conducted in different environments with various levels of ammonium, pH, turbidity, and oxygen to enhance our knowledge of nitrification.
Author Contributions
Conceptualization, Y.W., Z.Z., S.-J.K., and E.T.; data curation, Y.W., W.W., T.L., X.S., G.S., L.W., W.L., P.Z., and E.T.; formal analysis, Y.W., W.W., T.L., W.L., and P.Z.; funding acquisition, Y.W., W.W., T.L., X.S., and P.Z.; investigation, Y.W., X.S., G.S., and B.X.; methodology, Y.W., G.S., B.X., C.W., and Z.W.; project administration, Y.W., Z.Z., S.-J.K., and E.T.; resources, Y.W.; software, Y.W., T.L., L.W., C.W., and Z.W.; supervision, Y.W. and L.W.; validation, Y.W.; visualization, Y.W.; writing—original draft, Y.W. and E.T.; writing—review and editing, Y.W. and E.T. All authors have read and agreed to the published version of the manuscript.
Funding
This research was funded by grants from the Key Laboratory of Marine Environmental Survey Technology and Application, Ministry of Natural Resources (No. MESTA-2022-D007) and (No. MESTA-2022-D005), and the Hainan Province Natural Science Foundation (No. 423RC438).
Data Availability Statement
The data presented in this study are available upon request from the corresponding author. The data are not publicly available due to our laboratory’s policy and confidentiality agreements.
Conflicts of Interest
The remaining authors declare that this research was conducted in the absence of any commercial or financial relationships that could be construed as potential conflicts of interest.
References
- Hutchins, D.A.; Capone, D.G. The marine nitrogen cycle: New developments and global change. Nat. Rev. Microbiol. 2022, 20, 401–414. [Google Scholar] [CrossRef] [PubMed]
- Fowler, D.; Coyle, M.; Skiba, U.; Sutton, M.A.; Cape, J.N.; Reis, S.; Sheppard, L.J.; Jenkins, A.; Grizzetti, B.; Galloway, J.N. The global nitrogen cycle in the twenty-first century. Philos. Trans. R. Soc. B Biol. Sci. 2013, 368, 20130164. [Google Scholar] [CrossRef]
- Zhao, Y.; Liu, J.; Uthaipan, K.; Song, X.; Xu, Y.; He, B.; Liu, H.; Gan, J.; Dai, M. Dynamics of inorganic carbon and pH in a large subtropical continental shelf system: Interaction between eutrophication, hypoxia, and ocean acidification. Limnol. Oceanogr. 2020, 65, 1359–1379. [Google Scholar] [CrossRef]
- Rockström, J.; Steffen, W.; Noone, K.; Persson, Å.; Chapin, F.S.; Lambin, E.F.; Lenton, T.M.; Scheffer, M.; Folke, C.; Schellnhuber, H.J. A safe operating space for humanity. Nature 2009, 461, 472–475. [Google Scholar] [CrossRef] [PubMed]
- Van Oostende, N.; Fawcett, S.E.; Marconi, D.; Lueders-Dumont, J.; Sabadel, A.; Woodward, E.; Jönsson, B.F.; Sigman, D.M.; Ward, B.B. Variation of summer phytoplankton community composition and its relationship to nitrate and regenerated nitrogen assimilation across the North Atlantic Ocean. Deep. Sea Res. Part I Oceanogr. Res. Pap. 2017, 121, 79–94. [Google Scholar] [CrossRef]
- Glibert, P.M.; Wilkerson, F.P.; Dugdale, R.C.; Raven, J.A.; Dupont, C.L.; Leavitt, P.R.; Parker, A.E.; Burkholder, J.M.; Kana, T.M. Pluses and minuses of ammonium and nitrate uptake and assimilation by phytoplankton and implications for productivity and community composition, with emphasis on nitrogen-enriched conditions. Limnol. Oceanogr. 2016, 61, 165–197. [Google Scholar] [CrossRef]
- Peng, X.; Fuchsman, C.A.; Jayakumar, A.; Oleynik, S.; Martens-Habbena, W.; Devol, A.H.; Ward, B.B. Ammonia and nitrite oxidation in the Eastern Tropical North Pacific. Glob. Biogeochem. Cycles 2015, 29, 2034–2049. [Google Scholar] [CrossRef]
- Freing, A.; Wallace, D.W.; Bange, H.W. Global oceanic production of nitrous oxide. Philos. Trans. R. Soc. B Biol. Sci. 2012, 367, 1245–1255. [Google Scholar] [CrossRef]
- Buitenhuis, E.T.; Suntharalingam, P.; Le Quéré, C. Constraints on global oceanic emissions of N2O from observations and models. Biogeosciences 2018, 15, 2161–2175. [Google Scholar] [CrossRef]
- Dore, J.E.; Popp, B.N.; Karl, D.M.; Sansone, F.J. A large source of atmospheric nitrous oxide from subtropical North Pacific surface waters. Nature 1998, 396, 63–66. [Google Scholar] [CrossRef]
- Xu, M.N.; Wu, Y.; Zhang, X.; Tang, J.-M.; Tan, E.; Zheng, Z.-Z.; Du, M.; Yan, X.; Kao, S.-J. Diel change in inorganic nitrogenous nutrient dynamics and associated oxygen stoichiometry along the Pearl River Estuary. Water Res. 2022, 222, 118954. [Google Scholar] [CrossRef]
- Zhou, J.; Zheng, Y.; Hou, L.; An, Z.; Chen, F.; Liu, B.; Wu, L.; Qi, L.; Dong, H.; Han, P. Effects of acidification on nitrification and associated nitrous oxide emission in estuarine and coastal waters. Nat. Commun. 2023, 14, 1380. [Google Scholar] [CrossRef] [PubMed]
- Hu, X.; Cai, W.J. An assessment of ocean margin anaerobic processes on oceanic alkalinity budget. Glob. Biogeochem. Cycles 2011, 25. [Google Scholar] [CrossRef]
- Xu, M.N.; Li, X.; Shi, D.; Zhang, Y.; Dai, M.; Huang, T.; Glibert, P.M.; Kao, S.J. Coupled effect of substrate and light on assimilation and oxidation of regenerated nitrogen in the euphotic ocean. Limnol. Oceanogr. 2019, 64, 1270–1283. [Google Scholar] [CrossRef]
- Zheng, Z.Z.; Wan, X.; Xu, M.N.; Hsiao, S.S.Y.; Zhang, Y.; Zheng, L.W.; Wu, Y.; Zou, W.; Kao, S.J. Effects of temperature and particles on nitrification in a eutrophic coastal bay in southern China. J. Geophys. Res. Biogeosci. 2017, 122, 2325–2337. [Google Scholar] [CrossRef]
- Ward, B. Phytoplankton community composition and gene expression of functional genes involved in carbon and nitrogen assimilation. J. Phycol. 2008, 44, 1490–1503. [Google Scholar] [CrossRef]
- Beman, J.M.; Chow, C.-E.; King, A.L.; Feng, Y.; Fuhrman, J.A.; Andersson, A.; Bates, N.R.; Popp, B.N.; Hutchins, D.A. Global declines in oceanic nitrification rates as a consequence of ocean acidification. Proc. Natl. Acad. Sci. USA 2011, 108, 208–213. [Google Scholar] [CrossRef] [PubMed]
- Isnansetyo, A.; Getsu, S.; Seguchi, M.; Koriyama, M. Independent effects of temperature, salinity, ammonium concentration and pH on nitrification rate of the Ariake seawater above mud sediment. HAYATI J. Biosci. 2014, 21, 21–30. [Google Scholar] [CrossRef]
- Damashek, J.; Casciotti, K.L.; Francis, C.A. Variable Nitrification Rates Across Environmental Gradients in Turbid, Nutrient-Rich Estuary Waters of San Francisco Bay. Estuaries Coasts 2016, 39, 1050–1071. [Google Scholar] [CrossRef]
- Merbt, S.N.; Stahl, D.A.; Casamayor, E.O.; Martí, E.; Nicol, G.W.; Prosser, J.I. Differential photoinhibition of bacterial and archaeal ammonia oxidation. FEMS Microbiol. Lett. 2012, 327, 41–46. [Google Scholar] [CrossRef]
- Smith, J.M.; Chavez, F.P.; Francis, C.A. Ammonium uptake by phytoplankton regulates nitrification in the sunlit ocean. PLoS ONE 2014, 9, e108173. [Google Scholar] [CrossRef] [PubMed]
- Hsiao, S.S.Y.; Hsu, T.C.; Liu, J.W.; Xie, X.; Zhang, Y.; Lin, J.; Wang, H.; Yang, J.Y.T.; Hsu, S.C.; Dai, M. Nitrification and its oxygen consumption along the turbid Chang Jiang River plume. Biogeosci. Discuss. 2014, 10, 8685–8713. [Google Scholar] [CrossRef]
- Kim, J.H.; Guo, X.; Park, H.S. Comparison study of the effects of temperature and free ammonia concentration on nitrification and nitrite accumulation. Process Biochem. 2008, 43, 154–160. [Google Scholar] [CrossRef]
- Jiang, T.J.; Niu, T.; Ying, W.Y. Relationship between the total discharge of pollutants in Shenzhen and the occurrence of red tides in the eastern waters. J. Appl. Ecol. 2007, 18, 1102–1106. [Google Scholar]
- Liang, Z.H.; Cheng, X.H.; Luo, H.; Wu, Q.; Li, M.G. Spatial and Temporal Distribution Characteristics of Water Quality and Source Analysis of Pollution in Shenzhen Bay. Water Resour. Prot. 2020, 36, 93–99. [Google Scholar]
- Zhang, Y.N.; Chen, J.S.; Wang, J.J.; Han, Y.; Yi, L. Remote Sensing Inversion of Net Primary Productivity and Its Spatiotemporal Variability in Shenzhen Coastal Waters. J. Appl. Oceanogr. 2017, 36, 311–318. [Google Scholar]
- Huan, Q.L.; Pang, R.S.; Zhou, Q.L.; Leng, K.M. Trends in Nitrogen and Phosphorus Nutrient Salts in Shenzhen Coastal Waters and Their Relationship with Red Tide Occurrence. Mar. Environ. Sci. 2016, 35, 908–914. [Google Scholar]
- Zhai, W.; Dai, M.; Cai, W.-J.; Wang, Y.; Wang, Z. High partial pressure of CO2 and its maintaining mechanism in a subtropical estuary: The Pearl River estuary, China. Mar. Chem. 2005, 93, 21–32. [Google Scholar] [CrossRef]
- Shi, H.M.; Wang, X.; Ma, Y.; Cai, Y.C.; Xu, X. Spatial and Temporal Distribution Characteristics of Nutrient Salts in the Northeastern Gulf of Tonkin from 2017 to 2018. Guangxi Sci. 2023, 30, 663–671. [Google Scholar]
- Tao, W.; Niu, L.; Dong, Y.; Fu, T.; Lou, Q. Nutrient pollution and its dynamic source-sink pattern in the pearl river estuary (South China). Front. Mar. Sci. 2021, 8, 713907. [Google Scholar] [CrossRef]
- Böhlke, J.K.; Smith, R.L.; Hannon, J.E. Isotopic analysis of N and O in nitrite and nitrate by sequential selective bacterial reduction to N2O. Anal. Chem. 2007, 79, 5888–5895. [Google Scholar] [CrossRef] [PubMed]
- Sigman, D.; Casciotti, K.; Andreani, M.; Barford, C.; Galanter, M.; Böhlke, J. A bacterial method for the nitrogen isotopic analysis of nitrate in seawater and freshwater. Anal. Chem. 2001, 73, 4145–4153. [Google Scholar] [CrossRef] [PubMed]
- Casciotti, K.; Sigman, D.; Hastings, M.G.; Böhlke, J.; Hilkert, A. Measurement of the oxygen isotopic composition of nitrate in seawater and freshwater using the denitrifier method. Anal. Chem. 2002, 74, 4905–4912. [Google Scholar] [CrossRef]
- Xu, M.N.; Zhang, W.Z.; Zhu, Y.F.; Liu, L.; Zheng, Z.Z.; Sean Wan, X.H.; Qian, W.; Dai, M.H.; Gan, J.P.; Hutchins, D.A.; et al. Enhanced Ammonia Oxidation Caused by Lateral Kuroshio Intrusion in the Boundary Zone of the Northern South China Sea. Geophys. Res. Lett. 2018, 45, 12345–12350. [Google Scholar] [CrossRef]
- Dortch, Q.; Packard, T.T. Differences in biomass structure between oligotrophic and eutrophic marine ecosystems. Deep. Sea Res. Part A Oceanogr. Res. Pap. 1989, 36, 223–240. [Google Scholar] [CrossRef]
- Justić, D.; Rabalais, N.N.; Turner, R.E. Stoichiometric nutrient balance and origin of coastal eutrophication. Mar. Pollut. Bull. 1995, 30, 41–46. [Google Scholar] [CrossRef]
- Guo, W.D.; Zhang, X.M.; Yang, Y.P.; Hu, M.H. Evaluation of Potential Eutrophication in Coastal Waters of China. Strait Taiwan 1998, 17, 64–70. [Google Scholar]
- Santoro, A.E.; Sakamoto, C.M.; Smith, J.M.; Plant, J.N.; Gehman, A.L.; Worden, A.Z.; Johnson, K.S.; Francis, C.A.; Casciotti, K.L. Measurements of nitrite production in and around the primary nitrite maximum in the central California Current. Biogeosciences 2013, 10, 7395–7410. [Google Scholar] [CrossRef]
- Wan, X.S.; Sheng, H.-X.; Dai, M.; Casciotti, K.L.; Church, M.J.; Zou, W.; Liu, L.; Shen, H.; Zhou, K.; Ward, B.B.; et al. Epipelagic nitrous oxide production offsets carbon sequestration by the biological pump. Nat. Geosci. 2023, 16, 29–36. [Google Scholar] [CrossRef]
- Soetaert, K.; Middelburg, J.J.; Heip, C.; Meire, P.; Van Damme, S.; Maris, T. Long-term change in dissolved inorganic nutrients in the heterotrophic Scheldt estuary (Belgium, The Netherlands). Limnol. Oceanogr. 2006, 51, 409–423. [Google Scholar] [CrossRef]
- Horak, R.E.; Qin, W.; Schauer, A.J.; Armbrust, E.V.; Ingalls, A.E.; Moffett, J.W.; Stahl, D.A.; Devol, A.H. Ammonia oxidation kinetics and temperature sensitivity of a natural marine community dominated by Archaea. Isme J. 2013, 7, 2023–2033. [Google Scholar] [CrossRef] [PubMed]
- Newell, S.E.; Fawcett, S.E.; Ward, B.B. Depth distribution of ammonia oxidation rates and ammonia-oxidizer community composition in the Sargasso Sea. Limnol. Oceanogr. 2013, 58, 1491–1500. [Google Scholar] [CrossRef]
- Lipschultz, F.; Wofsy, S.C.; Fox, L.E. The effects of light and nutrients on rates of ammonium transformation in a eutrophic river. Mar. Chem. 1985, 16, 329–341. [Google Scholar] [CrossRef]
- Horrigan, S.; Carlucci, A.; Williams, P. Light inhibition of nitrification in sea-surface films [California]. J. Mar. Res. 1981, 39, 567–580. [Google Scholar]
- Levipan, H.A.; Molina, V.; Anguita, C.; Rain-Franco, A.; Belmar, L.; Fernandez, C. Variability of nitrifying communities in surface coastal waters of the Eastern South Pacific (~36° S). Environ. Microbiol. Rep. 2016, 8, 851–864. [Google Scholar] [CrossRef]
- Kim JongGeol, K.J.; Park SooJe, P.S.; Damsté, J.; Schouten, S.; Rijpstra, W.; Jung ManYoung, J.M.; Kim SoJeong, K.S.; Gwak JooHan, G.J.; Hong HeeJi, H.H.; Si OkJa, S.O. Hydrogen peroxide detoxification is a key mechanism for growth of ammonia-oxidizing archaea. Environ. Microbiol. 2016, 18, 1528–1543. [Google Scholar]
- Ward, B. Temporal variability in nitrification rates and related biogeochemical factors in Monterey Bay, California, USA. Mar. Ecol. Prog. Ser. 2005, 292, 97–109. [Google Scholar] [CrossRef]
- Santoro, A.E.; Dupont, C.L.; Richter, R.A.; Craig, M.T.; Carini, P.; McIlvin, M.R.; Yang, Y.; Orsi, W.D.; Moran, D.M.; Saito, M.A. Genomic and proteomic characterization of “Candidatus Nitrosopelagicus brevis”: An ammonia-oxidizing archaeon from the open ocean. Proc. Natl. Acad. Sci. USA 2015, 112, 1173–1178. [Google Scholar] [CrossRef]
- Luo, H.; Tolar, B.B.; Swan, B.K.; Zhang, C.L.; Stepanauskas, R.; Ann Moran, M.; Hollibaugh, J.T. Single-cell genomics shedding light on marine Thaumarchaeota diversification. ISME J. 2014, 8, 732–736. [Google Scholar] [CrossRef]
- Francis, C.A.; Roberts, K.J.; Beman, J.M.; Santoro, A.E.; Oakley, B.B. Ubiquity and diversity of ammonia-oxidizing archaea in water columns and sediments of the ocean. Proc. Natl. Acad. Sci. USA 2005, 102, 14683–14688. [Google Scholar] [CrossRef]
- Brion, N.; Billen, G.; Guézennec, L.; Ficht, A. Distribution of nitrifying activity in the Seine River (France) from Paris to the estuary. Estuaries Coasts 2000, 23, 669–682. [Google Scholar] [CrossRef]
- Elisabeth, H.; Ines, B.; Maren, V.; Lasse, R. Extensive nitrification and active ammonia oxidizers in two contrasting coastal systems of the Baltic Sea. Environ. Microbiol. 2018, 20, 2245–2258. [Google Scholar] [CrossRef]
- Wang, H.; Shen, Z.; Guo, X.; Niu, J.; Kang, B. Ammonia adsorption and nitritation in sediments derived from the Three Gorges Reservoir, China. Environ. Earth Sci. 2010, 60, 1653–1660. [Google Scholar] [CrossRef]
- Pakulski, J.D.; Benner, R.; Whitledge, T.; Amon, R.; Eadie, B.; Cifuentes, L.; Ammerman, J.; Stockwell, D. Microbial Metabolism and Nutrient Cycling in the Mississippi and Atchafalaya River Plumes. Estuar. Coast. Shelf Sci. 2000, 50, 173–184. [Google Scholar] [CrossRef]
- Dahl, C.; Sund, C.; Kristensen, G.; Vredenbregt, L. Combined biological nitrification and denitrification of high-salinity wastewater. Water Sci. Technol. 1997, 36, 345–352. [Google Scholar] [CrossRef]
- Zhang, Q.; Tang, F.; Zhou, Y.; Xu, J.; Chen, H.; Wang, M.; Laanbroek, H.J. Shifts in the pelagic ammonia-oxidizing microbial communities along the eutrophic estuary of Yong River in Ningbo City, China. Front. Microbiol. 2015, 6, 1180. [Google Scholar] [CrossRef]
- Coci, M.; Riechmann, D.; Bodelier, P.L.; Stefani, S.; Zwart, G.; Laanbroek, H.J. Effect of salinity on temporal and spatial dynamics of ammonia-oxidising bacteria from intertidal freshwater sediment. FEMS Microbiol. Ecol. 2005, 53, 359–368. [Google Scholar] [CrossRef]
Disclaimer/Publisher’s Note: The statements, opinions and data contained in all publications are solely those of the individual author(s) and contributor(s) and not of MDPI and/or the editor(s). MDPI and/or the editor(s) disclaim responsibility for any injury to people or property resulting from any ideas, methods, instructions or products referred to in the content. |
© 2025 by the authors. Licensee MDPI, Basel, Switzerland. This article is an open access article distributed under the terms and conditions of the Creative Commons Attribution (CC BY) license (https://creativecommons.org/licenses/by/4.0/).