
Evaluation of Industrial Water Use Efficiency on an Enterprise Scale Based on Analytic Hierarchy Process, Entropy Weight Method and Self-Organizing Map: A Case Study in Zhejiang, China

 ,
,
Abstract
1. Introduction
2. Materials
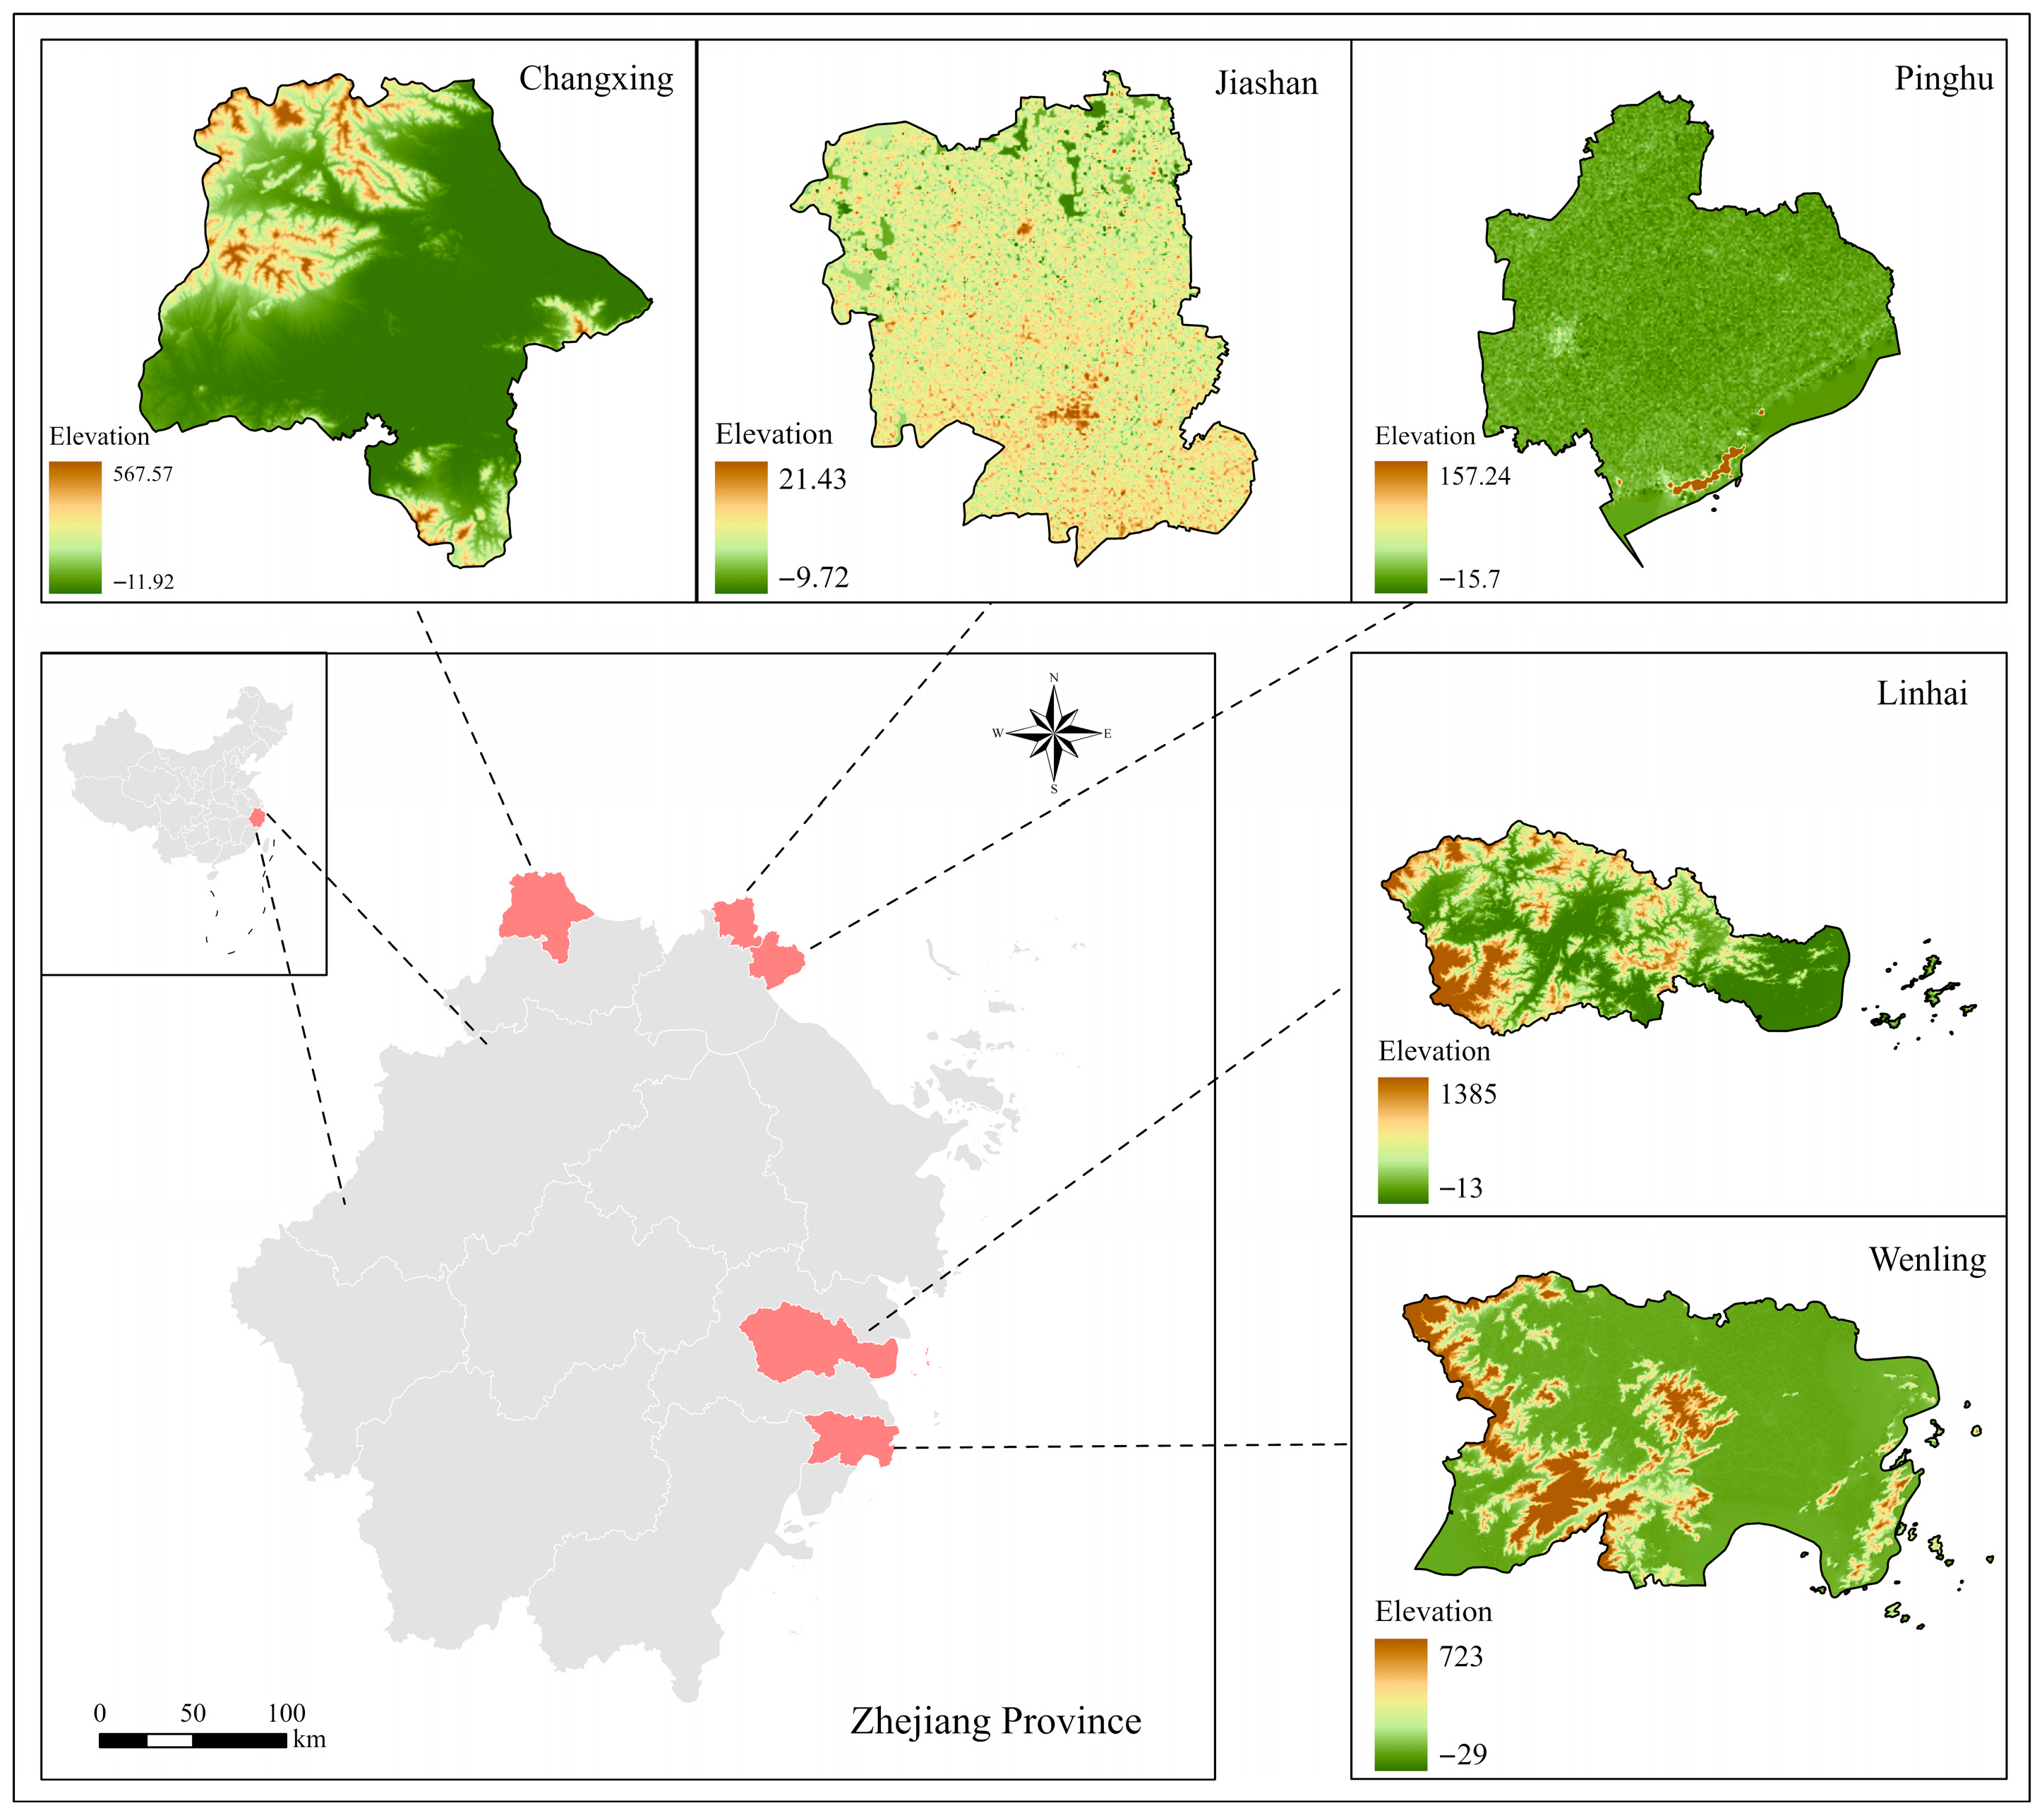
2.1. Study Area
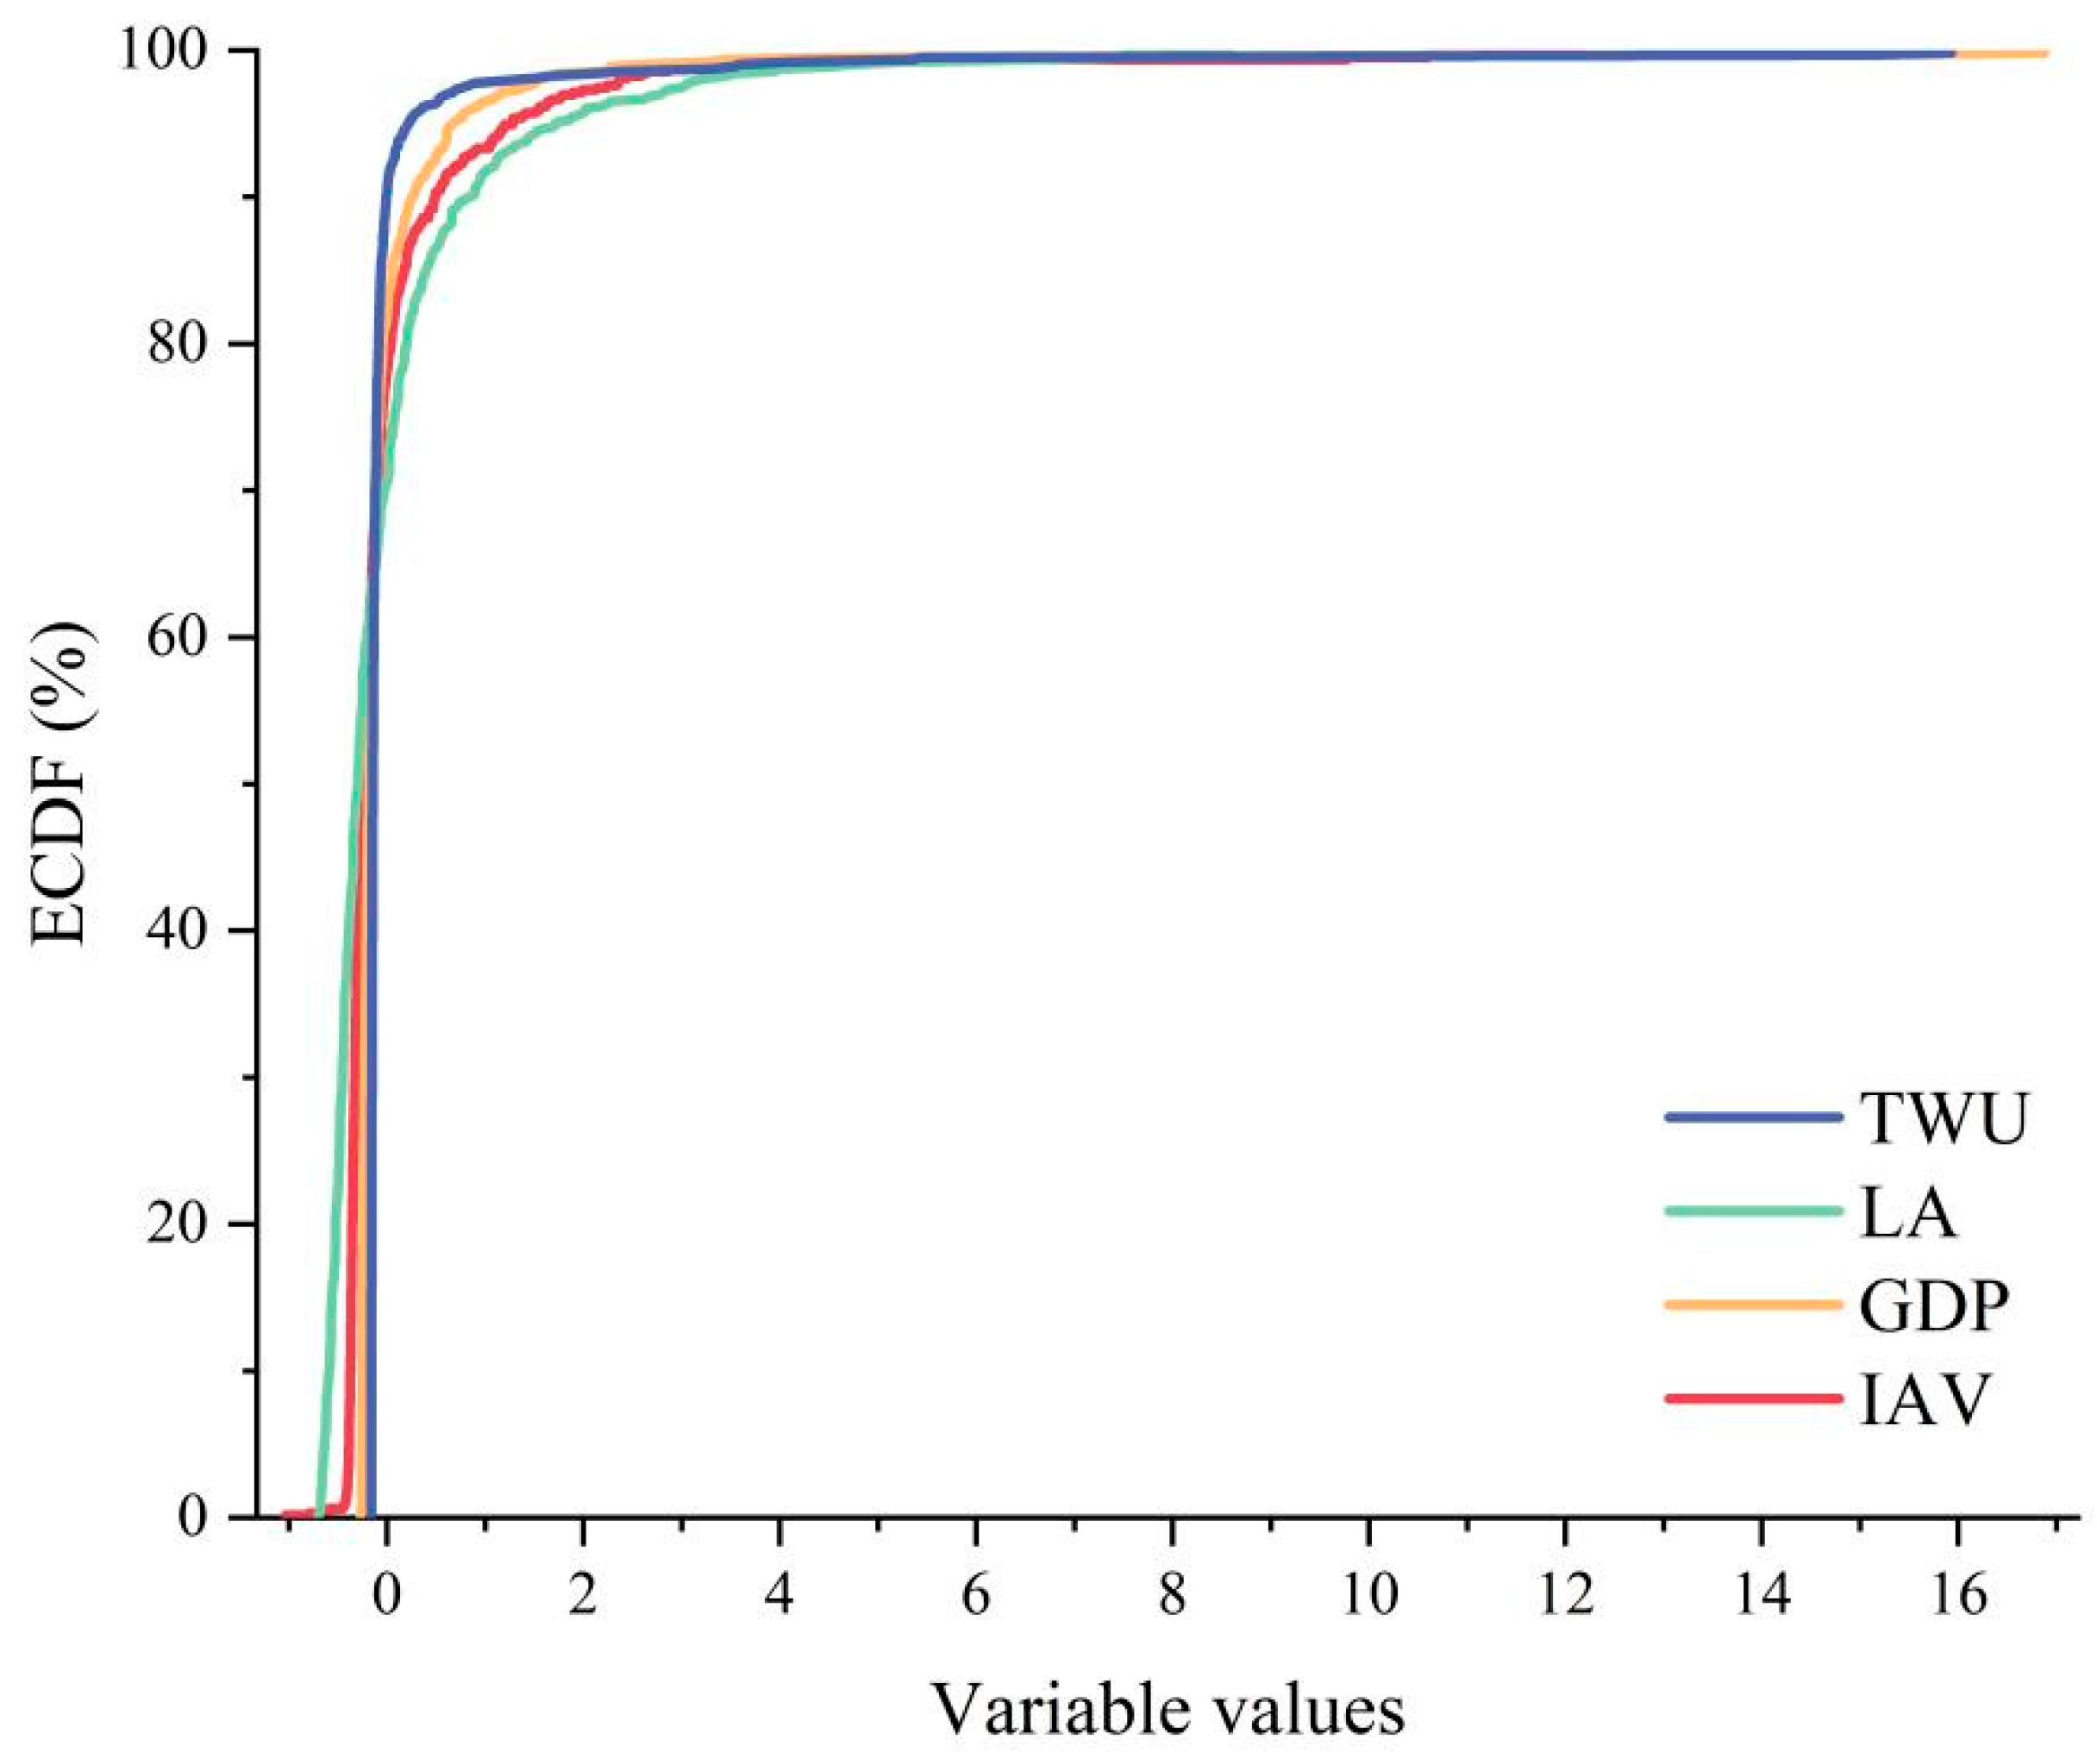
2.2. Data Sources
3. Methods
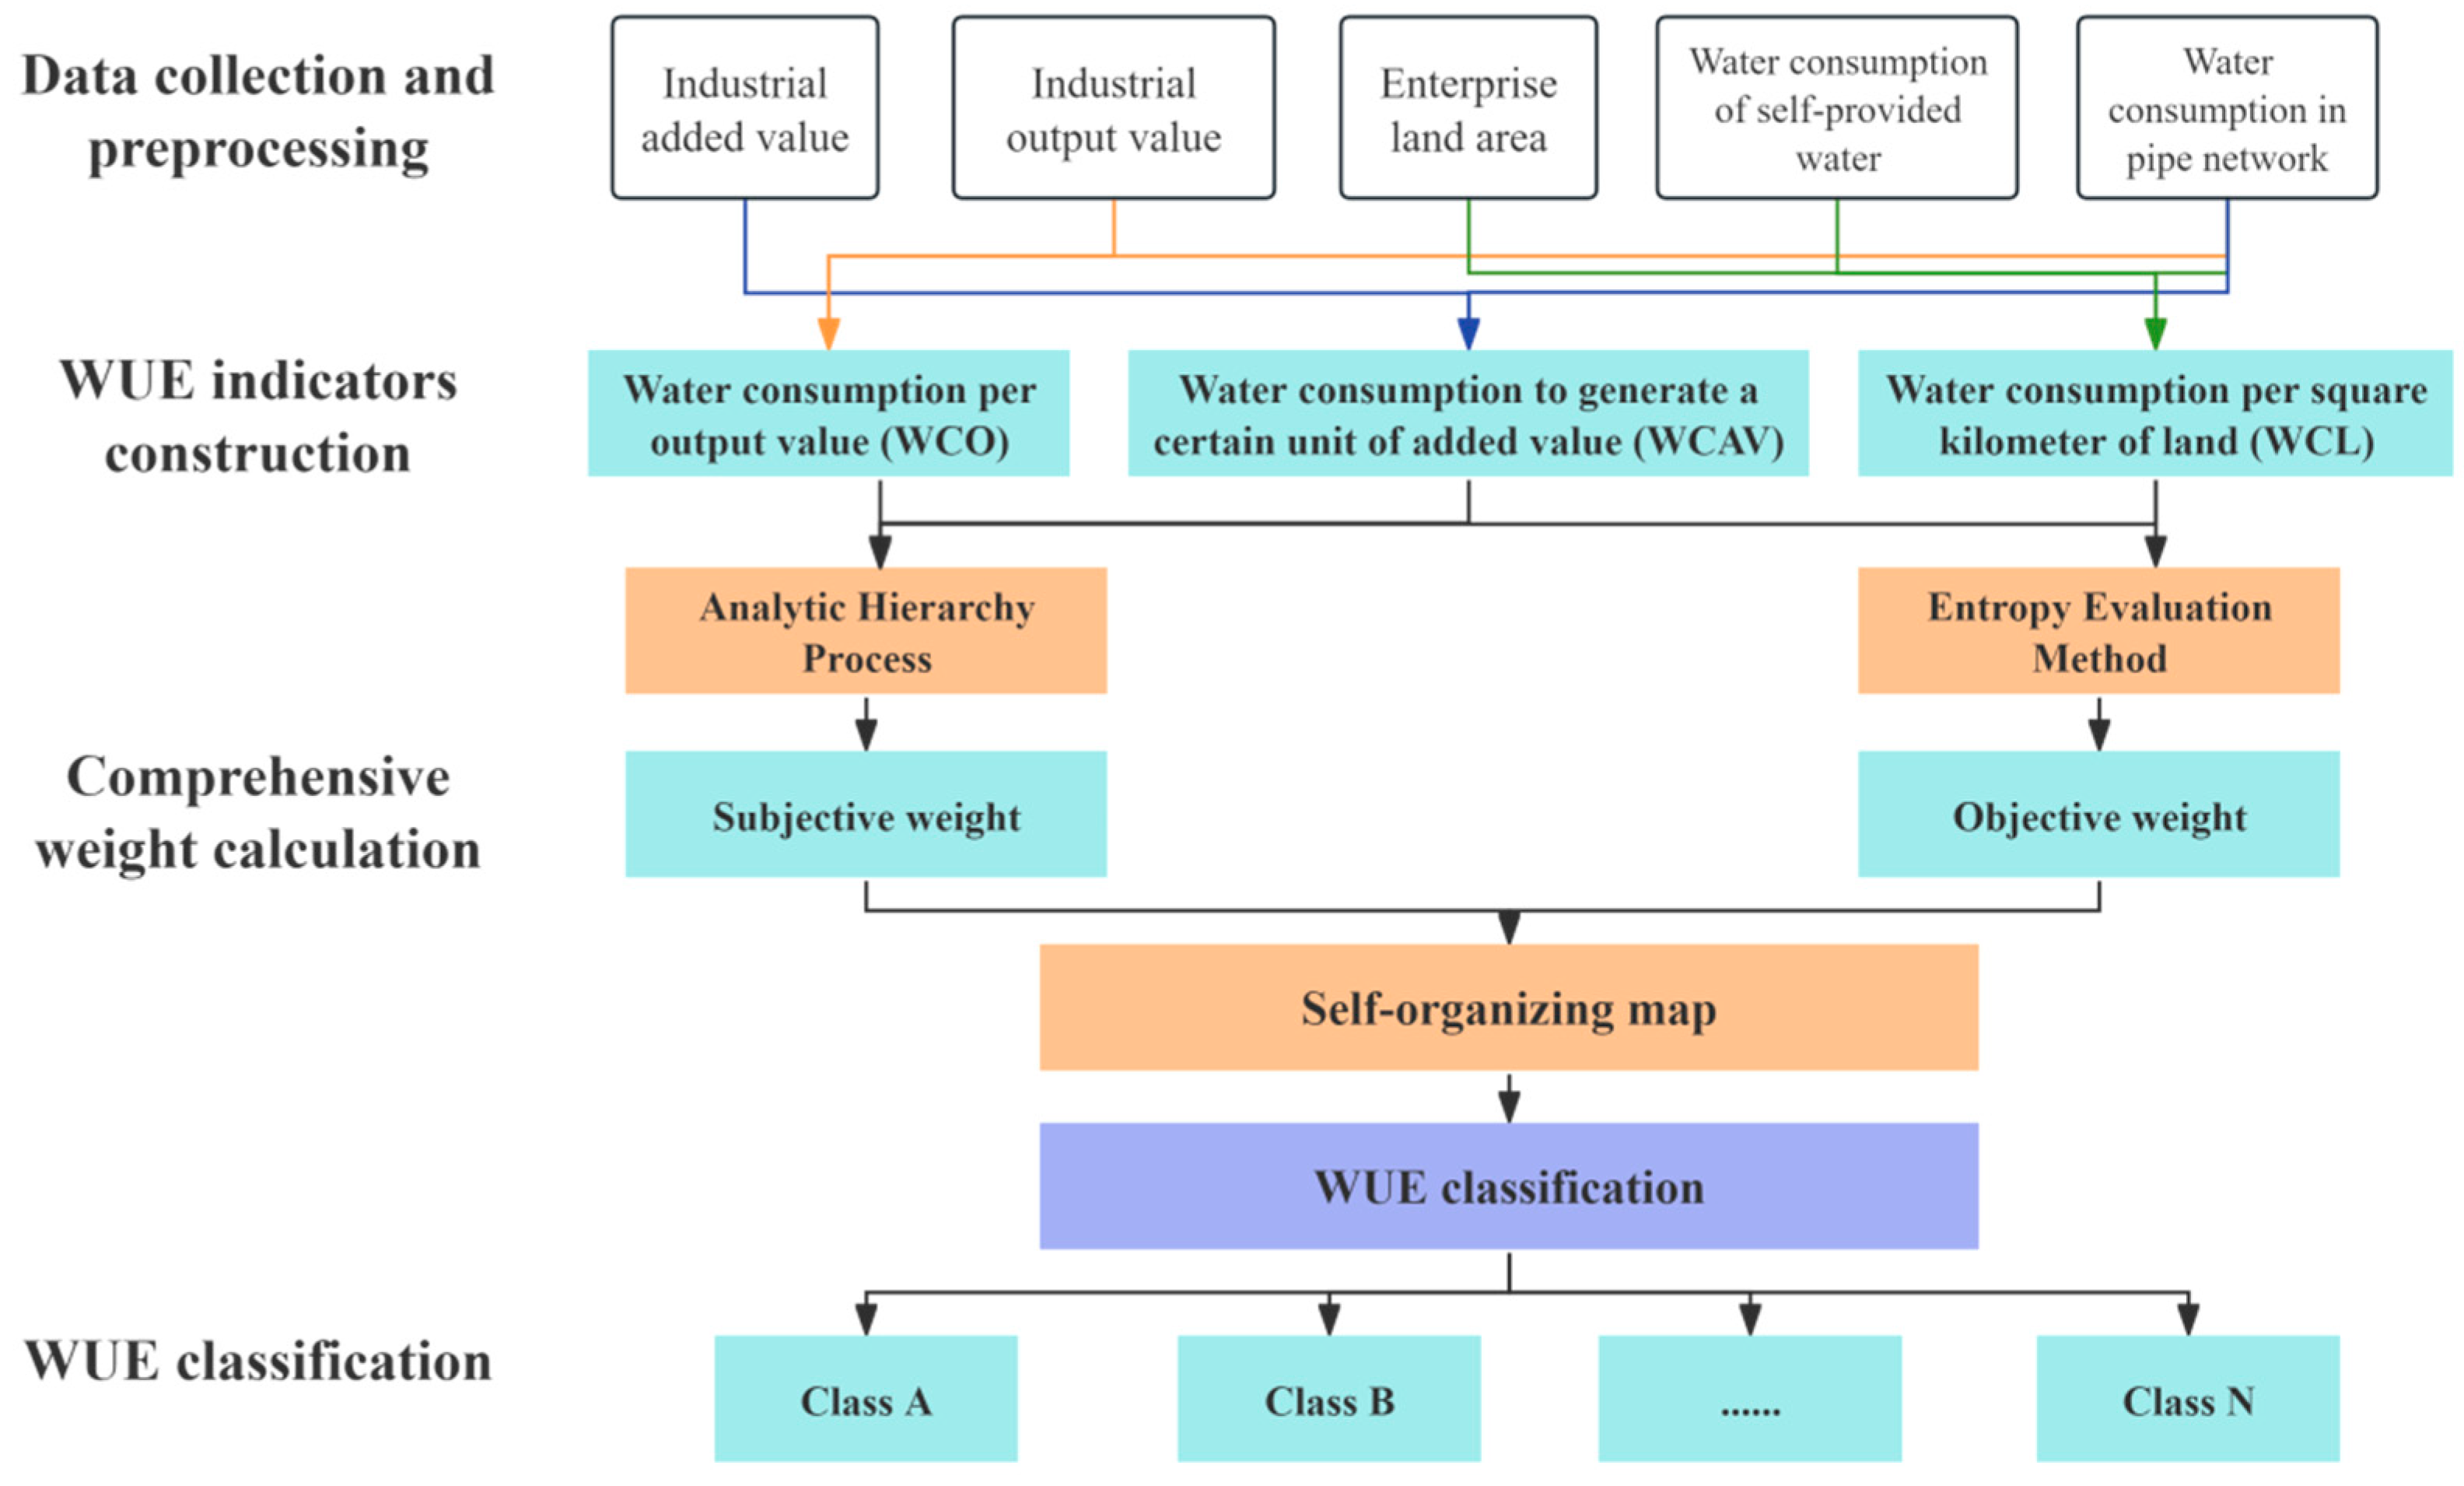
3.1. Technical Process
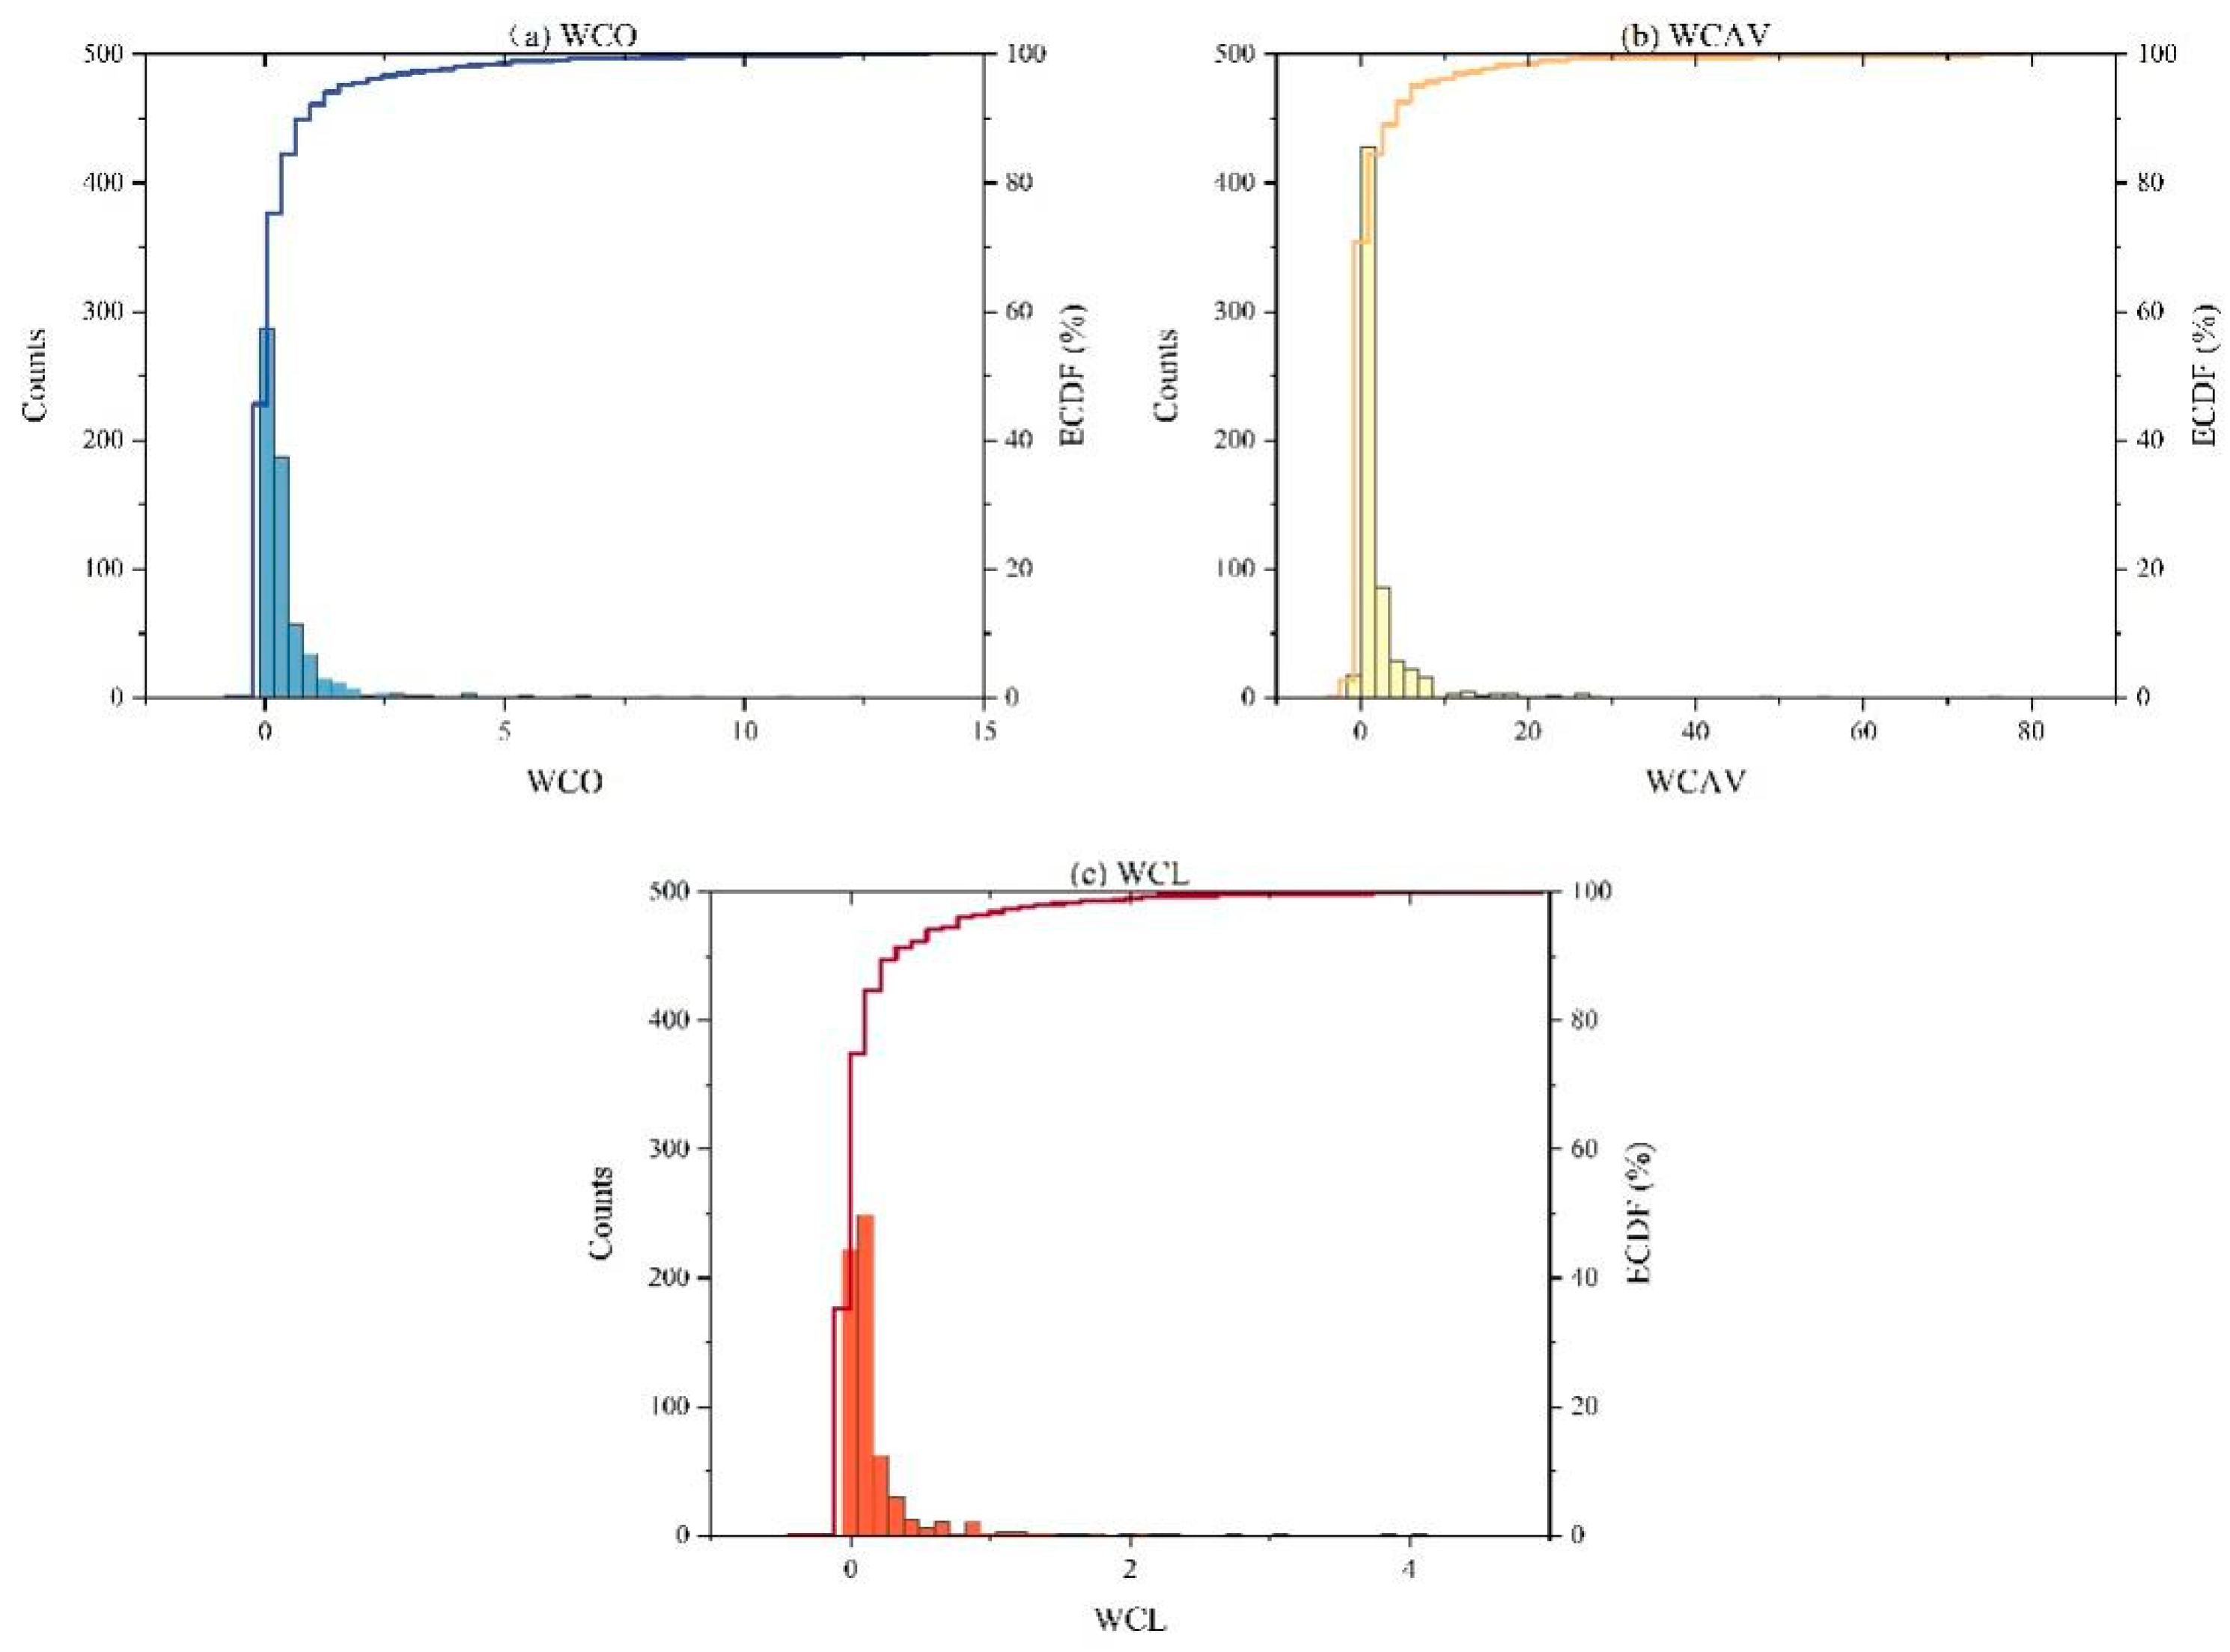
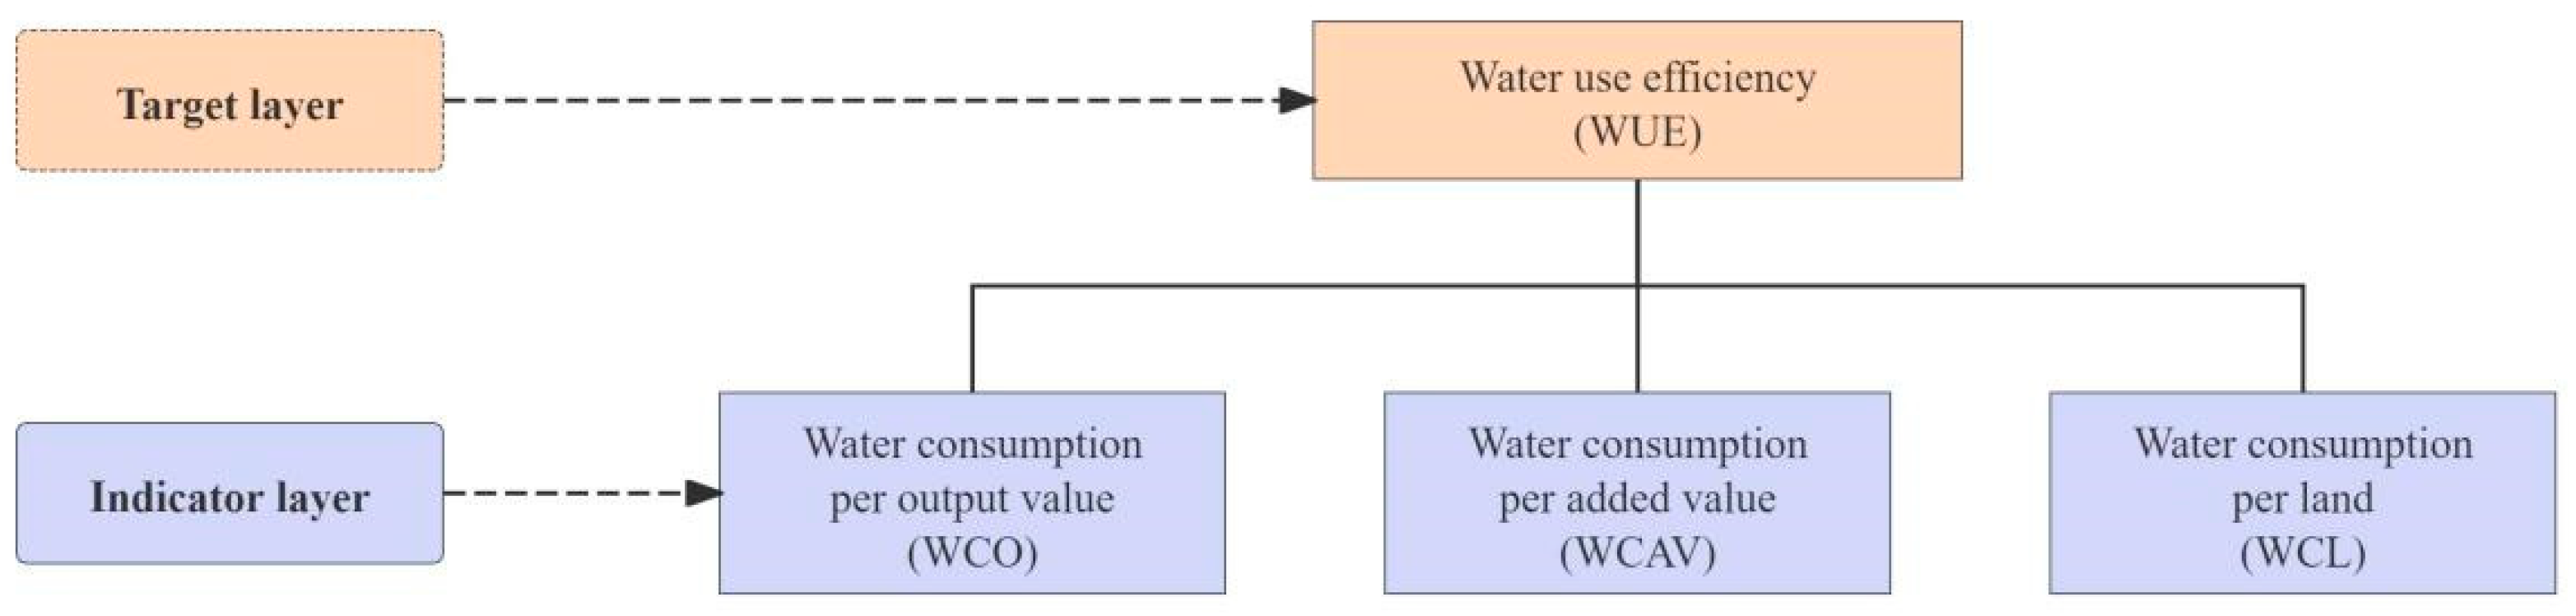
3.2. Construction of WUE Indicators
- (1)
- WCO
- (2)
- WCAV
- (3)
- WCL
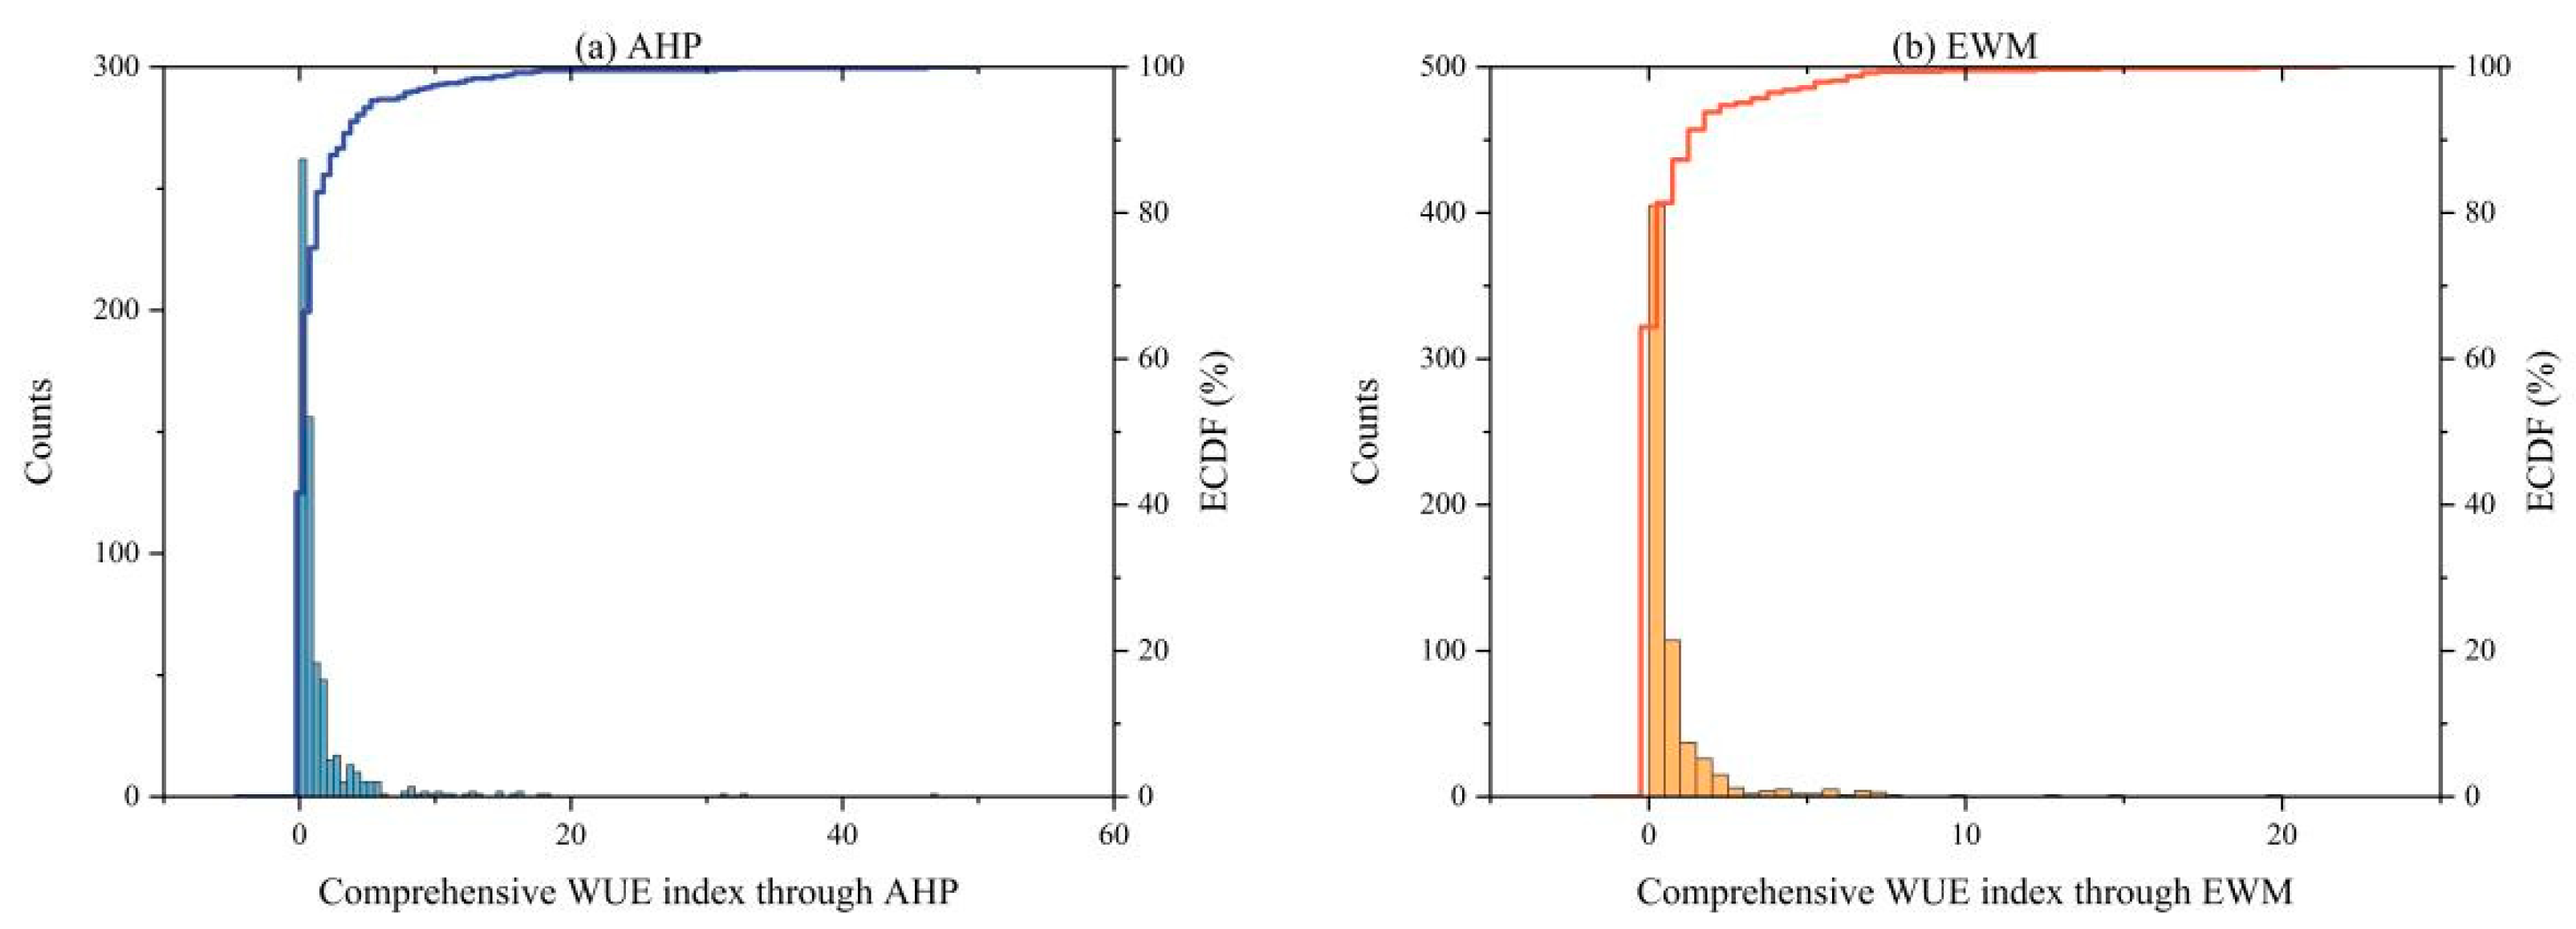
3.3. Construction of Comprehensive Index of WUE
3.3.1. Analytic Hierarchy Process
3.3.2. Entropy Weight Method
3.3.3. Construction of Comprehensive Index
3.4. Self-Organizing Map
4. Results
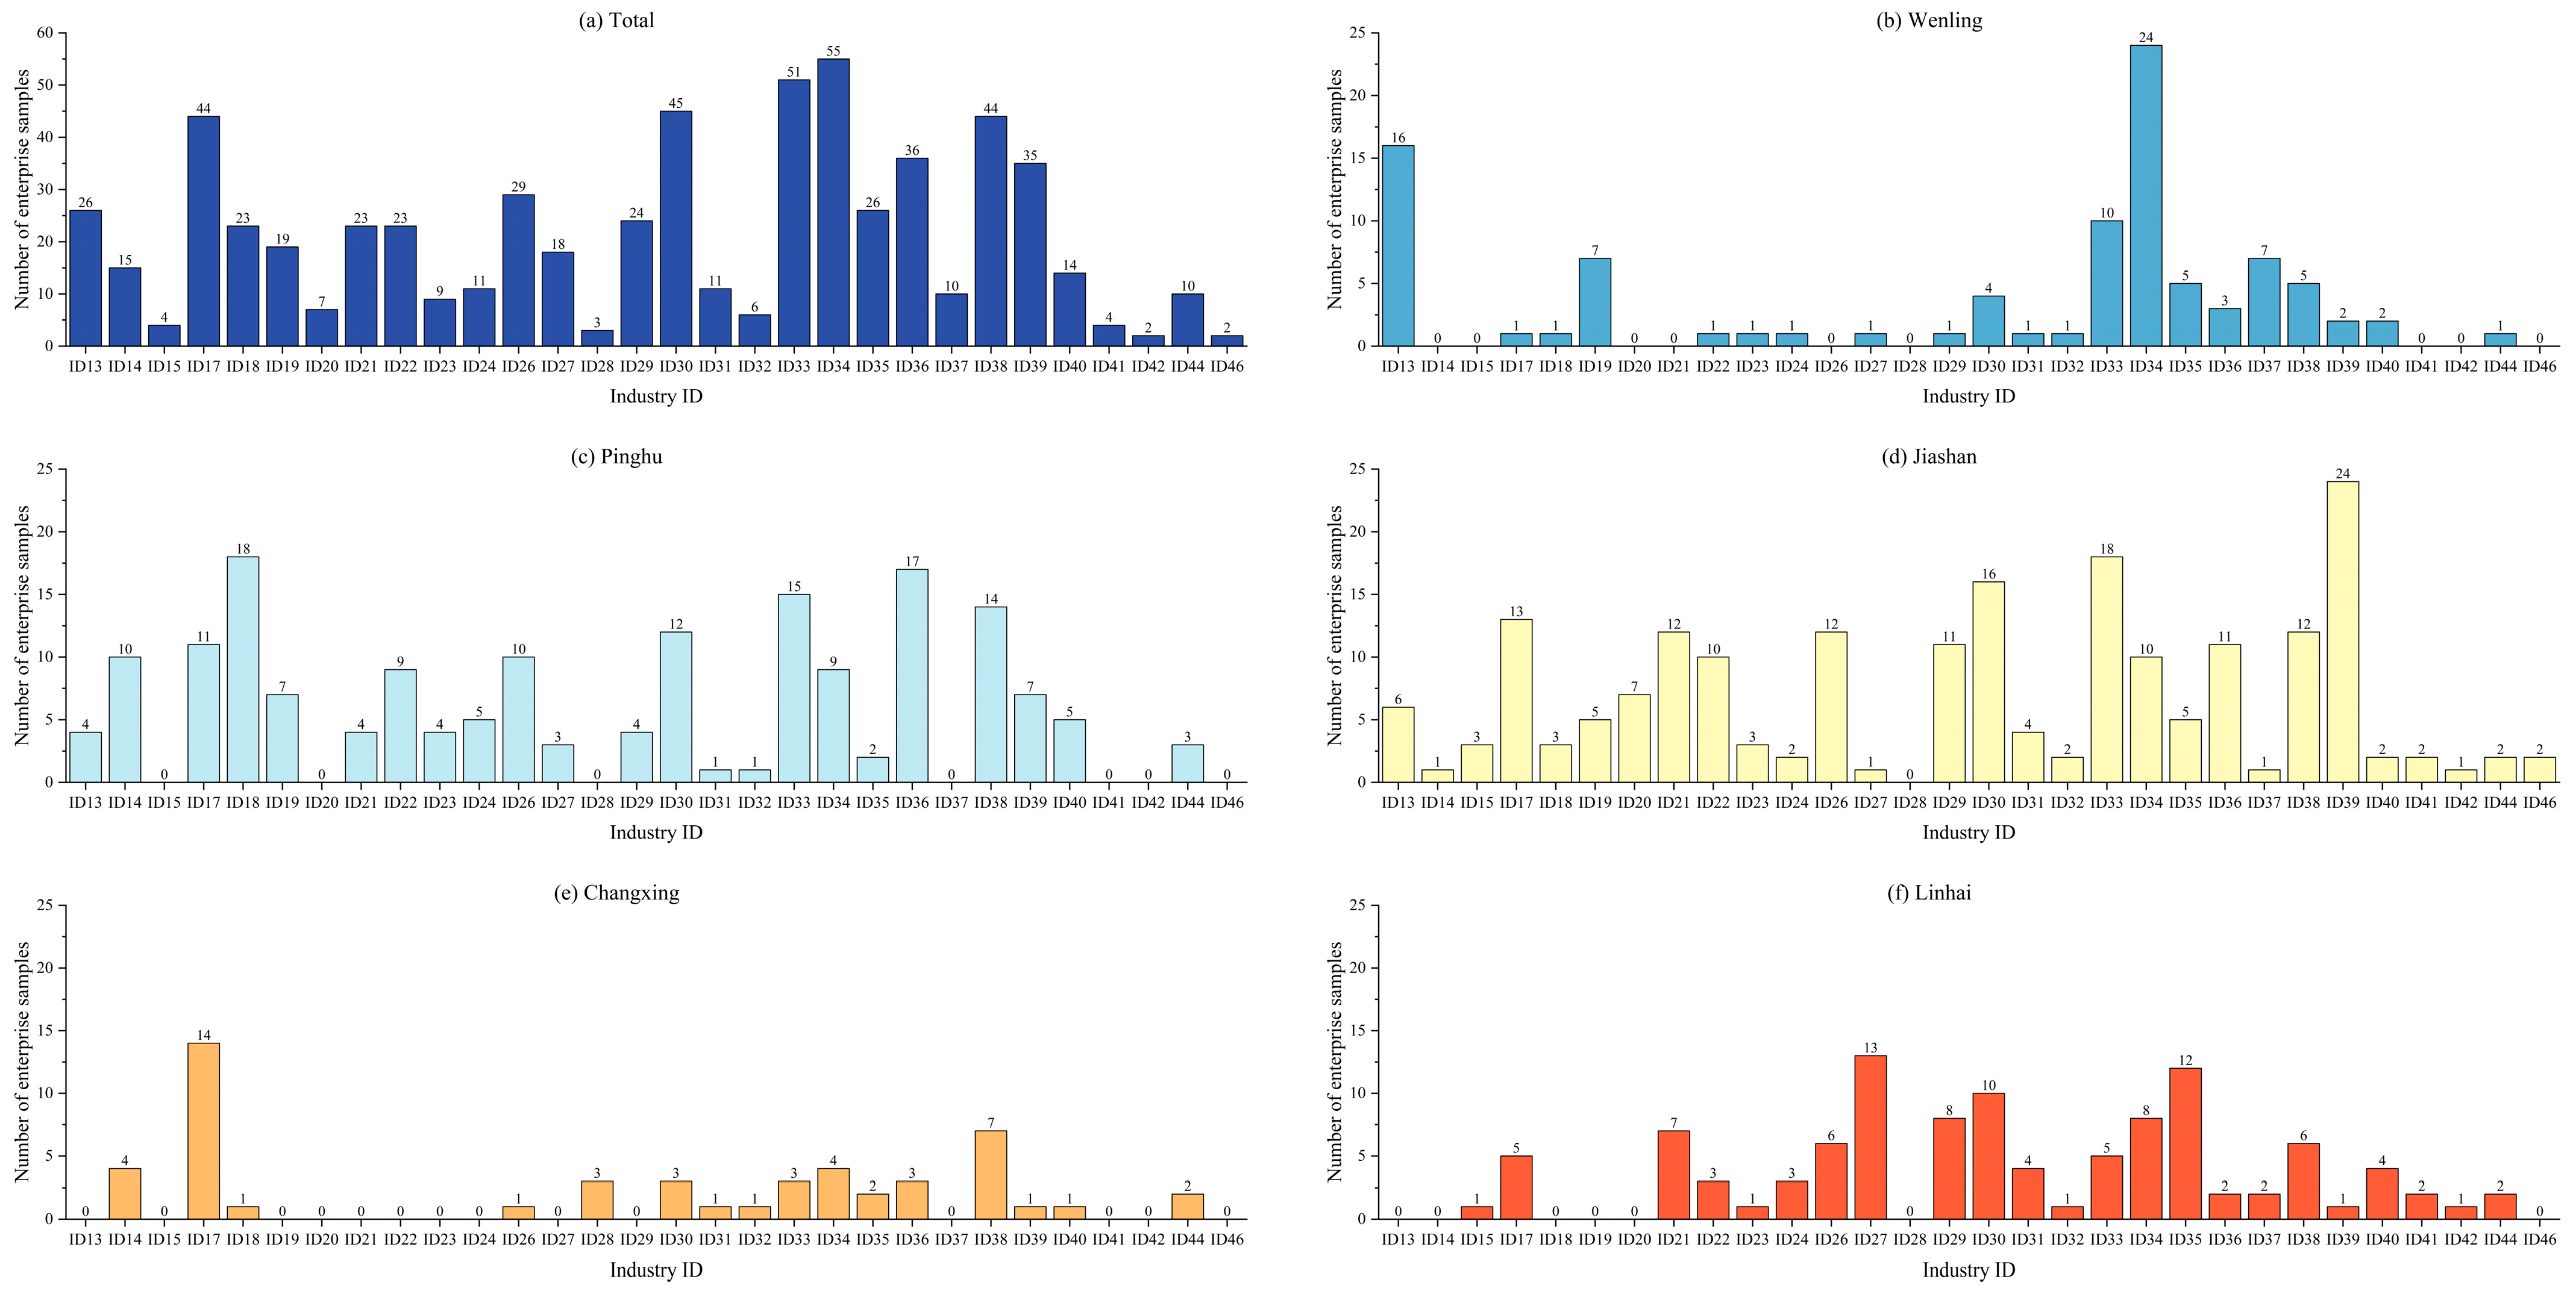
4.1. Overview of Data
4.2. Construction of Comprehensive WUE Index
4.3. WUE Classification of Enterprises
5. Discussion
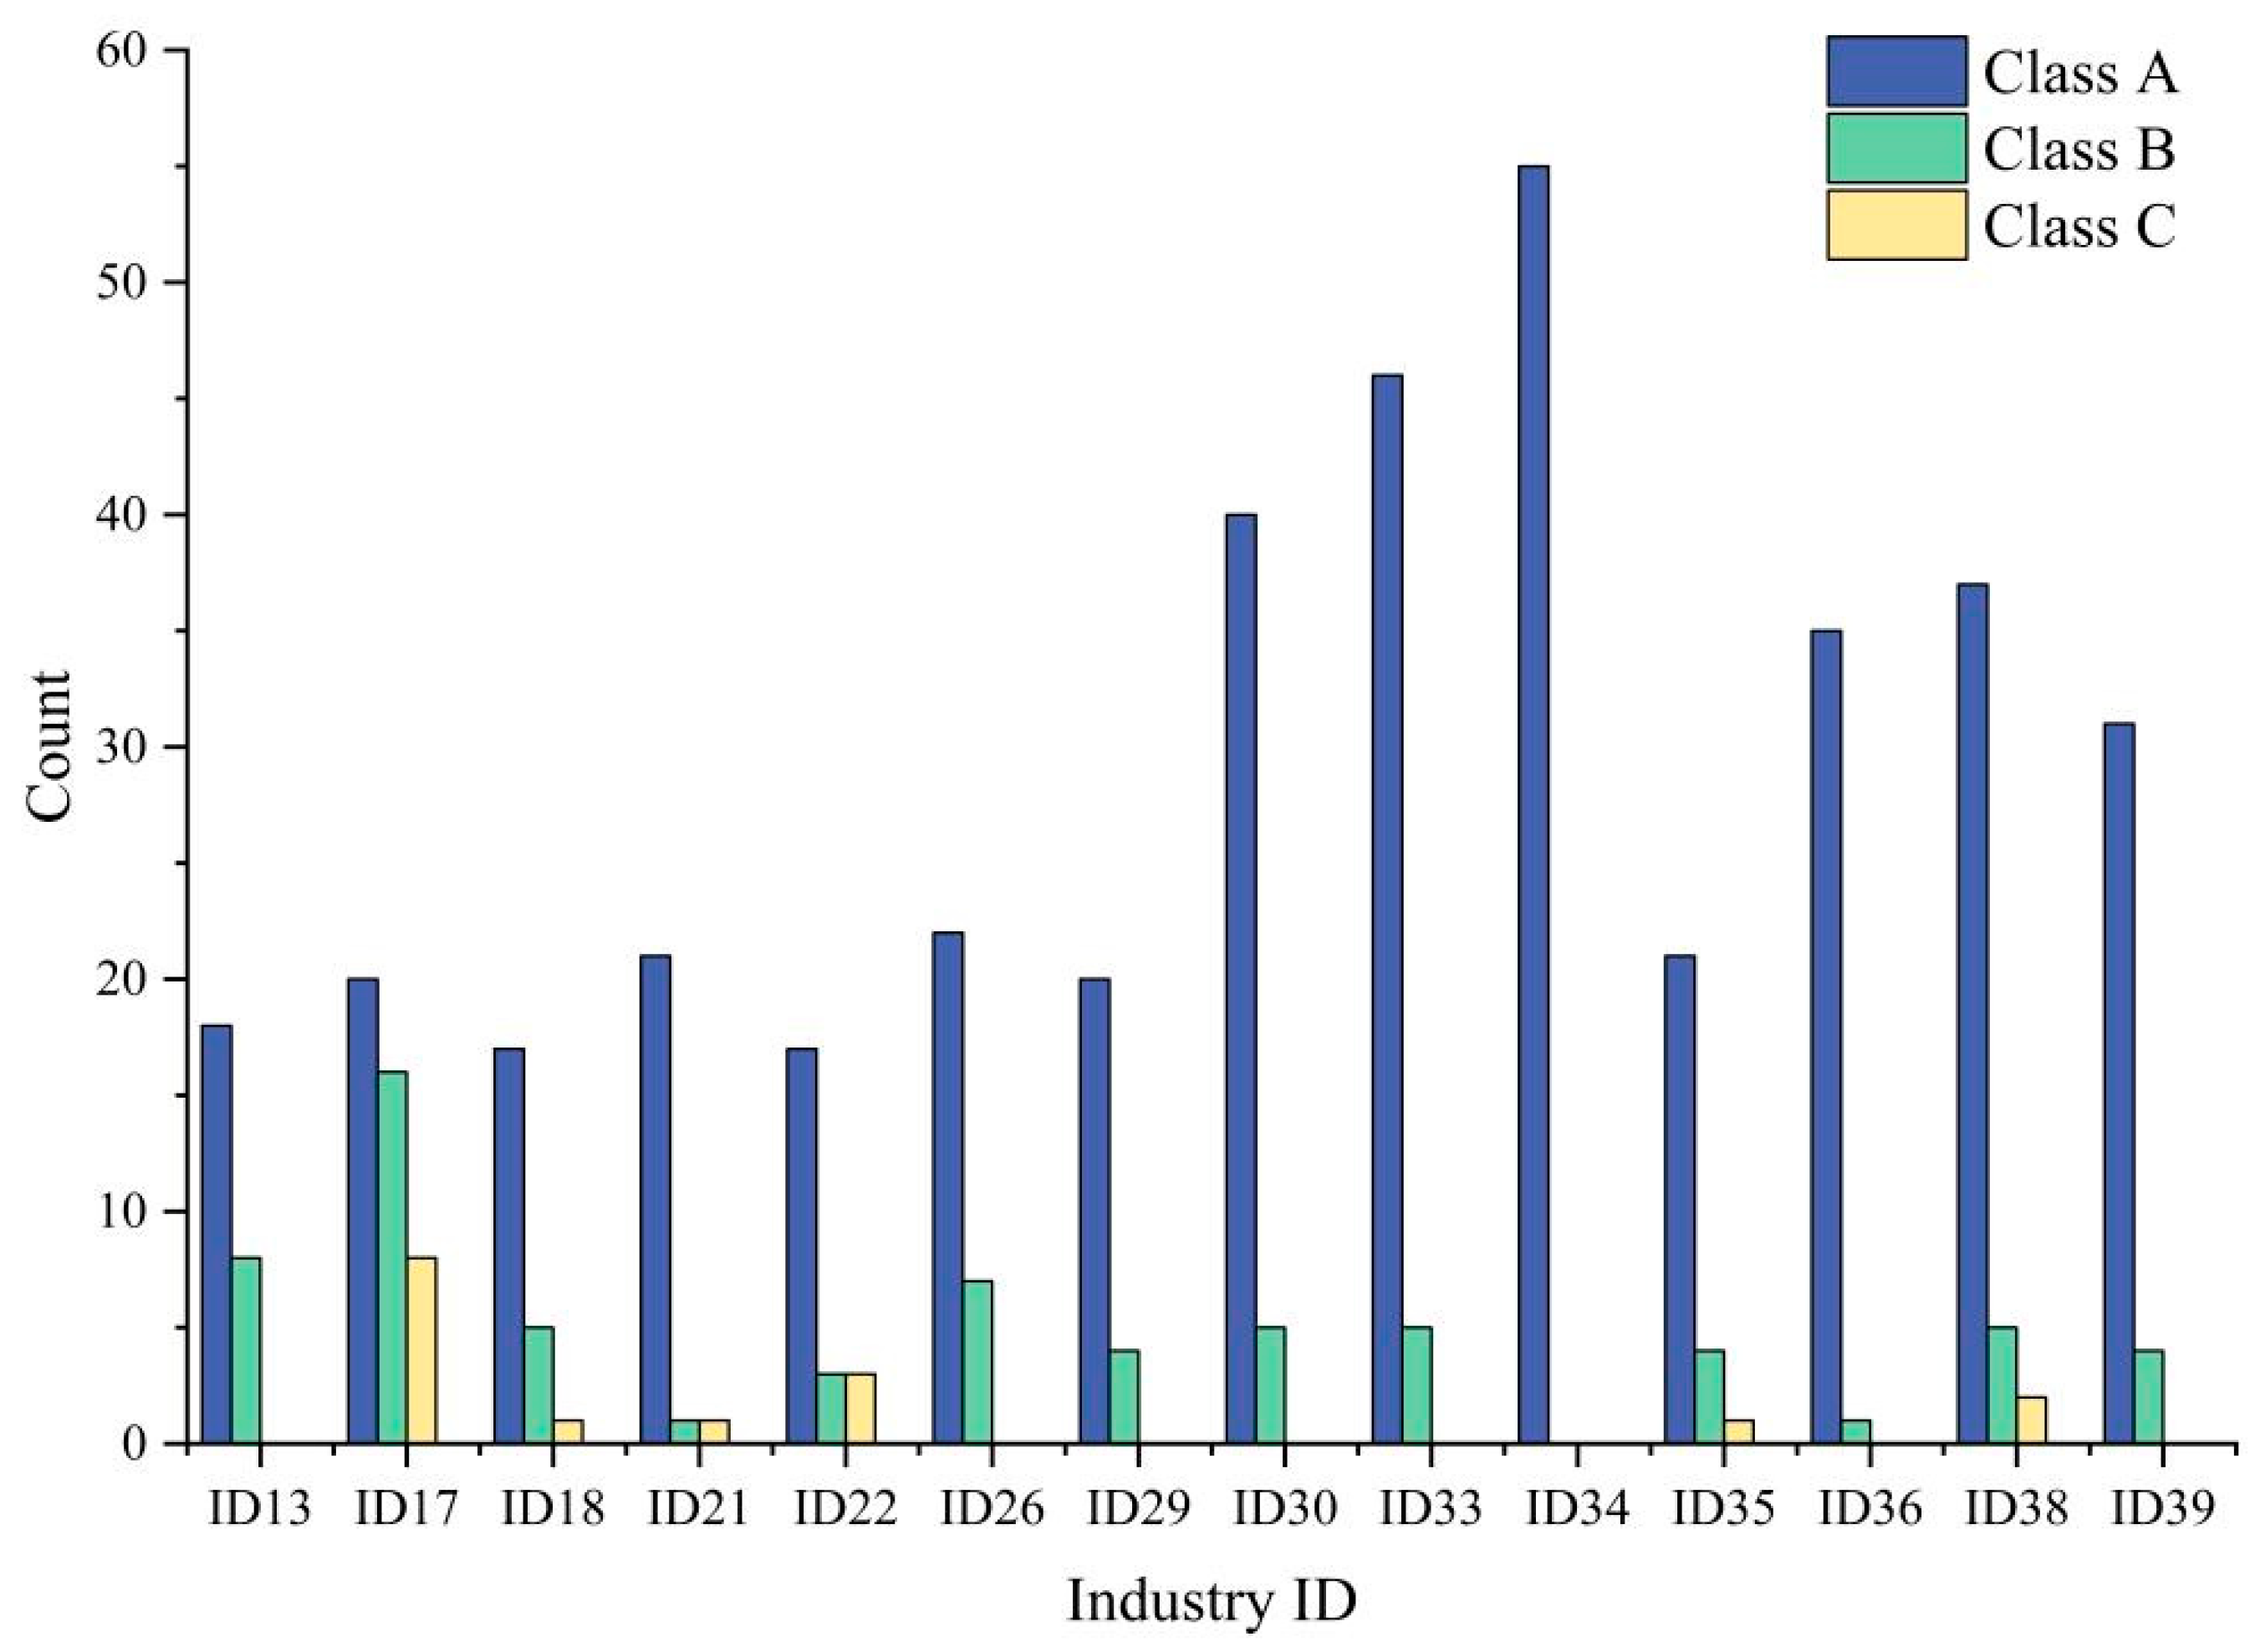
5.1. WUE in Different Industries
- (1)
- For ID 17 Manufacture of textiles and ID 18 Manufacture of wearing apparel, water is an essential raw material throughout the entire production process, used for rinsing, printing, and dyeing, etc.
- (2)
- The production of paper and paper products requires combining pulp fibers suspended in water through various processes to produce paper sheets. Therefore, water, as a production medium, is vital for ID 22 Manufacture of paper and paper products.
- (3)
- Water is mainly used as a coolant material in ID 26 Manufacture of chemical raw materials and chemical products.

| Industry ID | Total | Class A | Class B | Class C | Class D | ||||
|---|---|---|---|---|---|---|---|---|---|
| Count | Proportion | Count | Proportion | Count | Proportion | Count | Proportion | ||
| ID13 | 26 | 22 | 84.6% | 4 | 15.4% | 0 | 0.0% | 0 | 0.0% |
| ID17 | 44 | 20 | 45.5% | 16 | 36.4% | 8 | 18.2% | 0 | 0.0% |
| ID18 | 23 | 15 | 65.2% | 5 | 21.7% | 3 | 13.0% | 0 | 0.0% |
| ID21 | 23 | 22 | 95.7% | 1 | 4.3% | 0 | 0.0% | 0 | 0.0% |
| ID22 | 23 | 17 | 73.9% | 3 | 13.0% | 3 | 13.0% | 0 | 0.0% |
| ID26 | 29 | 18 | 62.1% | 7 | 24.1% | 4 | 13.8% | 0 | 0.0% |
| ID29 | 24 | 20 | 83.3% | 4 | 16.7% | 0 | 0.0% | 0 | 0.0% |
| ID30 | 45 | 40 | 88.9% | 5 | 11.1% | 0 | 0.0% | 0 | 0.0% |
| ID33 | 51 | 46 | 90.2% | 5 | 9.8% | 0 | 0.0% | 0 | 0.0% |
| ID34 | 55 | 55 | 100.0% | 0 | 0.0% | 0 | 0.0% | 0 | 0.0% |
| ID35 | 26 | 21 | 80.8% | 4 | 15.4% | 1 | 3.8% | 0 | 0.0% |
| ID36 | 36 | 35 | 97.2% | 1 | 2.8% | 0 | 0.0% | 0 | 0.0% |
| ID38 | 44 | 41 | 93.2% | 3 | 6.8% | 0 | 0.0% | 0 | 0.0% |
| ID39 | 35 | 31 | 88.6% | 4 | 11.4% | 0 | 0.0% | 0 | 0.0% |
5.2. WUE in Different Areas
- (1)
- According to the above results, the production of these two industries has a close relationship with water consumption, and their WUE classifications are also somewhat diverse.
- (2)
- These two industries are the dominant industries in two areas, i.e., the number of enterprises from these two industries is the largest in the local area. Specifically, ID 17 Manufacture of textiles is the dominant industry in Changxing, accounting for 27.4% of the total number of enterprise samples, and ID 18 Manufacture of wearing apparel is the dominant industry in Pinghu, accounting for 10.3% of the total number of enterprise samples.
5.3. Limitation and Future Work
6. Conclusions
Author Contributions
Funding
Data Availability Statement
Acknowledgments
Conflicts of Interest
Appendix A. Industrial Classification
| Section | Division | ||
|---|---|---|---|
| Code | Name | Code | Name |
| A | Agriculture, forestry, husbandry, and fishing | 01 | Agriculture |
| 02 | Forestry | ||
| 03 | Husbandry | ||
| 04 | Fishing | ||
| 05 | Agriculture, forestry, husbandry, and fishery professional and supporting activities | ||
| B | Mining | 06 | Mining and washing of coal |
| 07 | Extraction of oil and gas | ||
| 08 | Mining and processing of ferrous metal | ||
| 09 | Mining and processing of non-ferrous metal | ||
| 10 | Non-metallic mineral mining and processing | ||
| 11 | Mining professional and supporting activities | ||
| 12 | Other mining | ||
| C | Manufacturing | 13 | Processing of agricultural sideline food |
| 14 | Manufacture of food | ||
| 15 | Manufacture of wine, beverages, and tea | ||
| 16 | Manufacture of tobacco products | ||
| 17 | Manufacture of textiles | ||
| 18 | Manufacture of wearing apparel | ||
| 19 | Manufacture of leather, fur, feathers, and related products; manufacture of footwear | ||
| 20 | Processing of wood; manufacture of wood, bamboo, rattan, palm, and straw products | ||
| 21 | Manufacture of furniture | ||
| 22 | Manufacture of paper and paper products | ||
| 23 | Printing and reproduction of recorded media | ||
| 24 | Manufacture of culture, education, arts, crafts, sports, and entertainment products | ||
| 25 | Processing of petroleum, coal, and other fuel | ||
| 26 | Manufacture of chemical raw materials and chemical products | ||
| 27 | Manufacture of pharmaceuticals | ||
| 28 | Manufacture of chemical fiber | ||
| 29 | Manufacture of rubber and plastic products | ||
| 30 | Manufacture of other non-metallic mineral products | ||
| 31 | Smelting and calendaring of ferrous metal | ||
| 32 | Smelting and calendaring of nonferrous metal | ||
| 33 | Manufacture of metal products | ||
| 34 | Manufacture of general equipment | ||
| 35 | Manufacture of special equipment | ||
| 36 | Manufacture of automobile | ||
| 37 | Manufacture of railway, shipbuilding, aerospace, and other transportation equipment | ||
| 38 | Manufacture of electrical machinery and equipment | ||
| 39 | Manufacture of computers, communications, and other electronic equipment | ||
| 40 | Manufacture of instrumentation | ||
| 41 | Other manufacturing | ||
| 42 | Comprehensive utilization of waste resources | ||
| 43 | Repair of metal products, machinery, and equipment | ||
| D | Electricity, heat, gas and water production and supply | 44 | Electricity, heat power generation and supply |
| 45 | Manufacture of gas and gas supply | ||
| 46 | Water collection, treatment, and supply | ||
| E | Construction | 47 | Construction of buildings |
| 48 | Civil engineering | ||
| 49 | Construction installation | ||
| 50 | Building decoration, renovation, and other construction | ||
| F | Wholesale and retail trade | 51 | Wholesale trade |
| 52 | Retail trade | ||
| G | Transportation, warehousing and postal | 53 | Railway transport |
| 54 | Road transport | ||
| 55 | Water transport | ||
| 56 | Air transport | ||
| 57 | Pipeline transportation | ||
| 58 | Multimodal transport and transportation agency | ||
| 59 | Loading, unloading, handling, and warehousing | ||
| 60 | Postal | ||
| H | Accommodation and food service activities | 61 | Accommodation |
| 62 | Food and beverage service activities | ||
| I | Information transmission, software and information technology service | 63 | Telecommunications, radio and television and satellite transmission activities |
| 64 | Internet and related activities | ||
| 65 | Software and information technology activities | ||
| J | Financial activities | 66 | Monetary financial service activities |
| 67 | Capital Market service activities | ||
| 68 | Insurance | ||
| 69 | Other financial activities | ||
| K | Real estate activities | 70 | Real estate activities |
| L | Leasing and business activities | 71 | Leasing activities |
| 72 | Business service activities | ||
| M | Scientific research and technical activities | 73 | Research and experimental development |
| 74 | Professional and technical activities | ||
| 75 | Technology promotion and application activities | ||
| N | Water conservancy, environment and public facilities management | 76 | Water conservancy management |
| 77 | Ecological protection and environmental management | ||
| 78 | Public facilities management | ||
| 79 | Land management | ||
| O | Residential services, repairs and other services | 80 | Residential service activities |
| 81 | Repair of motor vehicles, electronic products, and daily products | ||
| 82 | Other service activities | ||
| P | Education | 83 | Education |
| Q | Human health and social work activities | 84 | Human health activities |
| 85 | Social work activities | ||
| R | Culture, sports and entertainment | 86 | News and publishing activities |
| 87 | Production of radio, television, film, and sound recordings | ||
| 88 | Culture and art activities | ||
| 89 | Sports activities | ||
| 90 | Entertainment activities | ||
| S | Public administration, social security and social organizations | 91 | Organs of the Communist Party of China activities |
| 92 | National Agencies activities | ||
| 93 | People’s Political Consultative Conference, democratic party activities | ||
| 94 | Social security activities | ||
| 95 | Mass organizations, social groups, and other member organizations activities | ||
| 96 | Grassroots mass autonomous organizations and other organizations activities | ||
| T | International organizations | 97 | International organizations activities |
Appendix B. Analytic Hierarchy Process
| Intensity of Importance | Verbal Judgment of Preference | Explanation |
|---|---|---|
| 1 | Equal importance | Two activities contribute equally to the objective. |
| 3 | Weak importance | Experience and judgment slightly favor one activity over another. |
| 5 | Strong importance | Experience and judgment strongly favor one activity over another. |
| 7 | Very strong importance | An activity is favored very strongly over another. |
| 9 | Extreme importance | The judgment favoring one activity over another is of the highest possible order of affirmation. |
| 2,4,6,8 | Intermediate values between the two adjacent judgements | / |
| Matrix order | 1 | 2 | 3 | 4 | 5 | 6 | 7 | 8 | 9 |
| RI | 0 | 0 | 0.52 | 0.89 | 1.12 | 1.26 | 1.36 | 1.41 | 1.46 |
Appendix C. Entropy Weight Method
References
- Cole, M.A. Economic growth and water use. Appl. Econ. Lett. 2004, 11, 1–4. [Google Scholar]
- Connor, R.; Miletto, M. The United Nations World Water Development Report 2023: Partnerships and Cooperation for Water; UNESCO: Paris, France, 2023. [Google Scholar]
- Duarte, R.; Pinilla, V.; Serrano, A. Looking backward to look forward: Water use and economic growth from a long-term perspective. Appl. Econ. 2013, 46, 212–224. [Google Scholar]
- Li, Y.; Luo, Y.; Wang, Y.; Wang, L.; Shen, M. Decomposing the Decoupling of Water Consumption and Economic Growth in China’s Textile Industry. Sustainability 2017, 9, 412. [Google Scholar] [CrossRef]
- Figueiredo, M.; Fernandes, A.; Neves, J.; Vicente, H. Sustainable Water Use and Public Awareness in Portugal. Sustainability 2024, 16, 5444. [Google Scholar] [CrossRef]
- Xu, H.; Yang, R.; Song, J. Agricultural Water Use Efficiency and Rebound Effect: A Study for China. Int. J. Environ. Res. Public Heal. 2021, 18, 7151. [Google Scholar]
- Chen, Y.; Yin, G.; Liu, K. Regional differences in the industrial water use efficiency of China: The spatial spillover effect and relevant factors. Resour. Conserv. Recycl. 2021, 167, 105239. [Google Scholar]
- Cheng, Z.; He, J.; Liu, Y.; Zhang, Q.; Deng, Y. Exploring the spatial structure and impact factors of water use efficiency in China. Environ. Impact Assess. Rev. 2023, 103, 107258. [Google Scholar]
- Shi, C.; Zeng, X.; Yu, Q.; Shen, J.; Li, A. Dynamic evaluation and spatiotemporal evolution of China’s industrial water use efficiency considering undesirable output. Environ. Sci. Pollut. Res. 2021, 28, 20839–20853. [Google Scholar]
- Zhao, J.; Wang, Y.; Zhang, X.; Liu, Q. Industrial and Agricultural Water Use Efficiency and Influencing Factors in the Process of Urbanization in the Middle and Lower Reaches of the Yellow River Basin, China. Land 2022, 11, 1248. [Google Scholar] [CrossRef]
- Wang, M.; Huang, Y.; Li, D. Assessing the performance of industrial water resource utilization systems in China based on a two-stage DEA approach with game cross efficiency. J. Clean. Prod. 2021, 312, 127722. [Google Scholar]
- Liu, B.; Zhang, L.; Wang, W.; Sun, C.; Dong, S.; Wang, Z. Development of a conceptual regional industrial water use efficiency model driven by economic development level. J. Hydrol. Reg. Stud. 2024, 55, 1248. [Google Scholar]
- Zhuang, Y.; Zhang, L.; Chiu, Y.-H.; Guo, Z.; Chu, Y.; Du, X. Evaluating the recycling efficiency of industrial water use systems in China: Basin differences and factor analysis. J. Environ. Manag. 2022, 316, 115313. [Google Scholar] [CrossRef] [PubMed]
- Zou, D.; Cong, H. Evaluation and influencing factors of China’s industrial water resource utilization efficiency from the perspective of spatial effect. Alex. Eng. J. 2021, 60, 173–182. [Google Scholar]
- Sachidananda, M.; Webb, D.P.; Rahimifard, S. A Concept of Water Usage Efficiency to Support Water Reduction in Manufacturing Industry. Sustainability 2016, 8, 1222. [Google Scholar] [CrossRef]
- Bai, M.; Zhou, S.; Zhao, M.; Yu, J. Water Use Efficiency Improvement against a Backdrop of Expanding City Agglomeration in Developing Countries—A Case Study on Industrial and Agricultural Water Use in the Bohai Bay Region of China. Water 2017, 9, 89. [Google Scholar] [CrossRef]
- Pan, Z.; Wang, Y.; Zhou, Y.; Wang, Y. Analysis of the water use efficiency using super efficiency data envelopment analysis. Appl. Water Sci. 2020, 10, 139. [Google Scholar]
- Moncaleano, D.C.C.; Pande, S.; Rietveld, L. Water Use Efficiency: A Review of Contextual and Behavioral Factors. Front. Water 2021, 3, 685650. [Google Scholar]
- Shang, Y.; Lu, S.; Li, X.; Sun, G.; Shang, L.; Shi, H.; Lei, X.; Ye, Y.; Sang, X.; Wang, H. Drivers of industrial water use during 2003–2012 in Tianjin, China: A structural decomposition analysis. J. Clean. Prod. 2017, 140, 1136–1147. [Google Scholar]
- Deng, G.; Li, L.; Song, Y. Provincial water use efficiency measurement and factor analysis in China: Based on SBM-DEA model. Ecol. Indic. 2016, 69, 12–18. [Google Scholar]
- Liu, K.-D.; Yang, G.-L.; Yang, D.-G. Industrial water-use efficiency in China: Regional heterogeneity and incentives identification. J. Clean. Prod. 2020, 258, 120828. [Google Scholar]
- Wu, X.; Liu, X.; Zhou, Y. Review of unsupervised learning techniques. In Proceedings of 2021 Chinese Intelligent Systems Conference, Fuzhou, China, 16–17 October 2021; Lecture Notes in Electrical Engineering; Springer: Singapore, 2021. [Google Scholar]
- Dike, H.U.; Zhou, Y.; Deveerasetty, K.K.; Wu, Q. Unsupervised Learning Based On Artificial Neural Network: A Review. In Proceedings of 2018 IEEE International Conference on Cyborg and Bionic Systems, Shenzhen, China, 25–27 October 2018. [Google Scholar]
- Akinduko, A.A.; Mirkes, E.M.; Gorban, A.N. SOM: Stochastic initialization versus principal components. Inf. Sci. 2016, 364–365, 213–221. [Google Scholar] [CrossRef]
- Kalteh, A.M.; Hjorth, P.; Berndtsson, R. Review of the self-organizing map (SOM) approach in water resources: Analysis, modelling and application. Environ. Model. Softw. 2008, 23, 835–845. [Google Scholar] [CrossRef]
- Vaidya, O.S.; Kumar, S. Analytic hierarchy process: An overview of applications. Eur. J. Oper. Res. 2006, 169, 1–29. [Google Scholar] [CrossRef]
- Ho, W. Integrated analytic hierarchy process and its applications—A literature review. Eur. J. Oper. Res. 2008, 186, 211–228. [Google Scholar] [CrossRef]
- Huang, S.; Ming, B.; Huang, Q.; Leng, G.; Hou, B. A Case Study on a Combination NDVI Forecasting Model Based on the Entropy Weight Method. Water Resour. Manag. 2017, 31, 3667–3681. [Google Scholar] [CrossRef]
- Li, Z.; Luo, Z.; Wang, Y.; Fan, G.; Zhang, J. Suitability evaluation system for the shallow geothermal energy implementation in region by Entropy Weight Method and TOPSIS method. Renew. Energy 2022, 184, 564–576. [Google Scholar] [CrossRef]
- Kohonen, T. Essentials of the self-organizing map. Neural Netw. 2013, 37, 52–65. [Google Scholar] [CrossRef]
- GB/T 4754-2017; Industrial Classification for National Economic Activities. National Standard of the People’s Republic of China: Beijing, China, 2017.


| Area Name | Population (Million Persons) | GDP (Billion Yuan) | IAV (Billion Yuan) |
|---|---|---|---|
| Wenling | 14.4 | 135.1 | 43.3 |
| Pinghu | 6.9 | 100.9 | 55.6 |
| Jiashan | 6.6 | 90.8 | 47.9 |
| Changxing | 6.8 | 89.4 | 39.8 |
| Linhai | 11.1 | 89.2 | 31.8 |
| Total | 45.8 | 505.4 | 218.4 |
| Variable Name | Abbreviation | Explanation | Unit |
|---|---|---|---|
| Gross domestic product | GDP | The total value of goods or services produced by an enterprise in 2024. | Yuan |
| Industrial added value | IAV | The market value added in the production of an enterprise in 2024. | Yuan |
| Total water use | TWS | The total amount of water used by an enterprise in 2024, including the water used for production and employees’ living. | m3 |
| Land areas | LA | The land area of an enterprise. | km2 |
| Industry classification | / | The industry classification of an enterprise in the standards of the Chinese government. | / |
| Judgment Matrix | WCO | WCAV | WCL |
|---|---|---|---|
| WCO | 1 | 2 | 7 |
| WCAV | 1/2 | 1 | 5 |
| WCL | 1/7 | 1/5 | 1 |
| Method | Weights of Variables | ||
|---|---|---|---|
| WCO | WCAV | WCL | |
| AHP | 0.5917 | 0.3332 | 0.0751 |
| EWM | 0.2252 | 0.3623 | 0.4125 |
| Industry ID | Area | Total | Class A | Class B | Class C | |||
|---|---|---|---|---|---|---|---|---|
| Count | Proportion | Count | Proportion | Count | Proportion | |||
| ID17 | Changxing | 14 | 11 | 78.6% | 2 | 14.3% | 1 | 7.1% |
| Total | 44 | 20 | 45.5% | 16 | 36.4% | 8 | 18.2% | |
| ID18 | Pinghu | 18 | 14 | 77.8% | 3 | 16.7% | 1 | 5.6% |
| Total | 23 | 15 | 65.2% | 5 | 21.7% | 3 | 13.0% | |
Disclaimer/Publisher’s Note: The statements, opinions and data contained in all publications are solely those of the individual author(s) and contributor(s) and not of MDPI and/or the editor(s). MDPI and/or the editor(s) disclaim responsibility for any injury to people or property resulting from any ideas, methods, instructions or products referred to in the content. |
© 2025 by the authors. Licensee MDPI, Basel, Switzerland. This article is an open access article distributed under the terms and conditions of the Creative Commons Attribution (CC BY) license (https://creativecommons.org/licenses/by/4.0/).
Share and Cite
Qian, Y.; Zhao, Y.; Qian, H.; Xiang, J.; Chen, C.; Su, L.; Cai, C. Evaluation of Industrial Water Use Efficiency on an Enterprise Scale Based on Analytic Hierarchy Process, Entropy Weight Method and Self-Organizing Map: A Case Study in Zhejiang, China. Water 2025, 17, 901. https://doi.org/10.3390/w17060901
Qian Y, Zhao Y, Qian H, Xiang J, Chen C, Su L, Cai C. Evaluation of Industrial Water Use Efficiency on an Enterprise Scale Based on Analytic Hierarchy Process, Entropy Weight Method and Self-Organizing Map: A Case Study in Zhejiang, China. Water. 2025; 17(6):901. https://doi.org/10.3390/w17060901
Chicago/Turabian StyleQian, Yimin, Yingjie Zhao, Hao Qian, Junhong Xiang, Caiming Chen, Longqiang Su, and Chenkai Cai. 2025. "Evaluation of Industrial Water Use Efficiency on an Enterprise Scale Based on Analytic Hierarchy Process, Entropy Weight Method and Self-Organizing Map: A Case Study in Zhejiang, China" Water 17, no. 6: 901. https://doi.org/10.3390/w17060901
APA StyleQian, Y., Zhao, Y., Qian, H., Xiang, J., Chen, C., Su, L., & Cai, C. (2025). Evaluation of Industrial Water Use Efficiency on an Enterprise Scale Based on Analytic Hierarchy Process, Entropy Weight Method and Self-Organizing Map: A Case Study in Zhejiang, China. Water, 17(6), 901. https://doi.org/10.3390/w17060901