
Hydrogeochemical Signatures and Processes Influencing Mineral Waters at Furnas Volcano (São Miguel, Azores)

 ,
,  ,
,  ,
,  ,
,  , , ,
, , , 
Abstract
1. Introduction
2. Characterization of the Study Area
2.1. Geological Setting
2.2. Furnas Hydrothermal Manifestations
2.3. Hydrogeological Settings
3. Sampling and Analytical Techniques
4. Results and Discussion
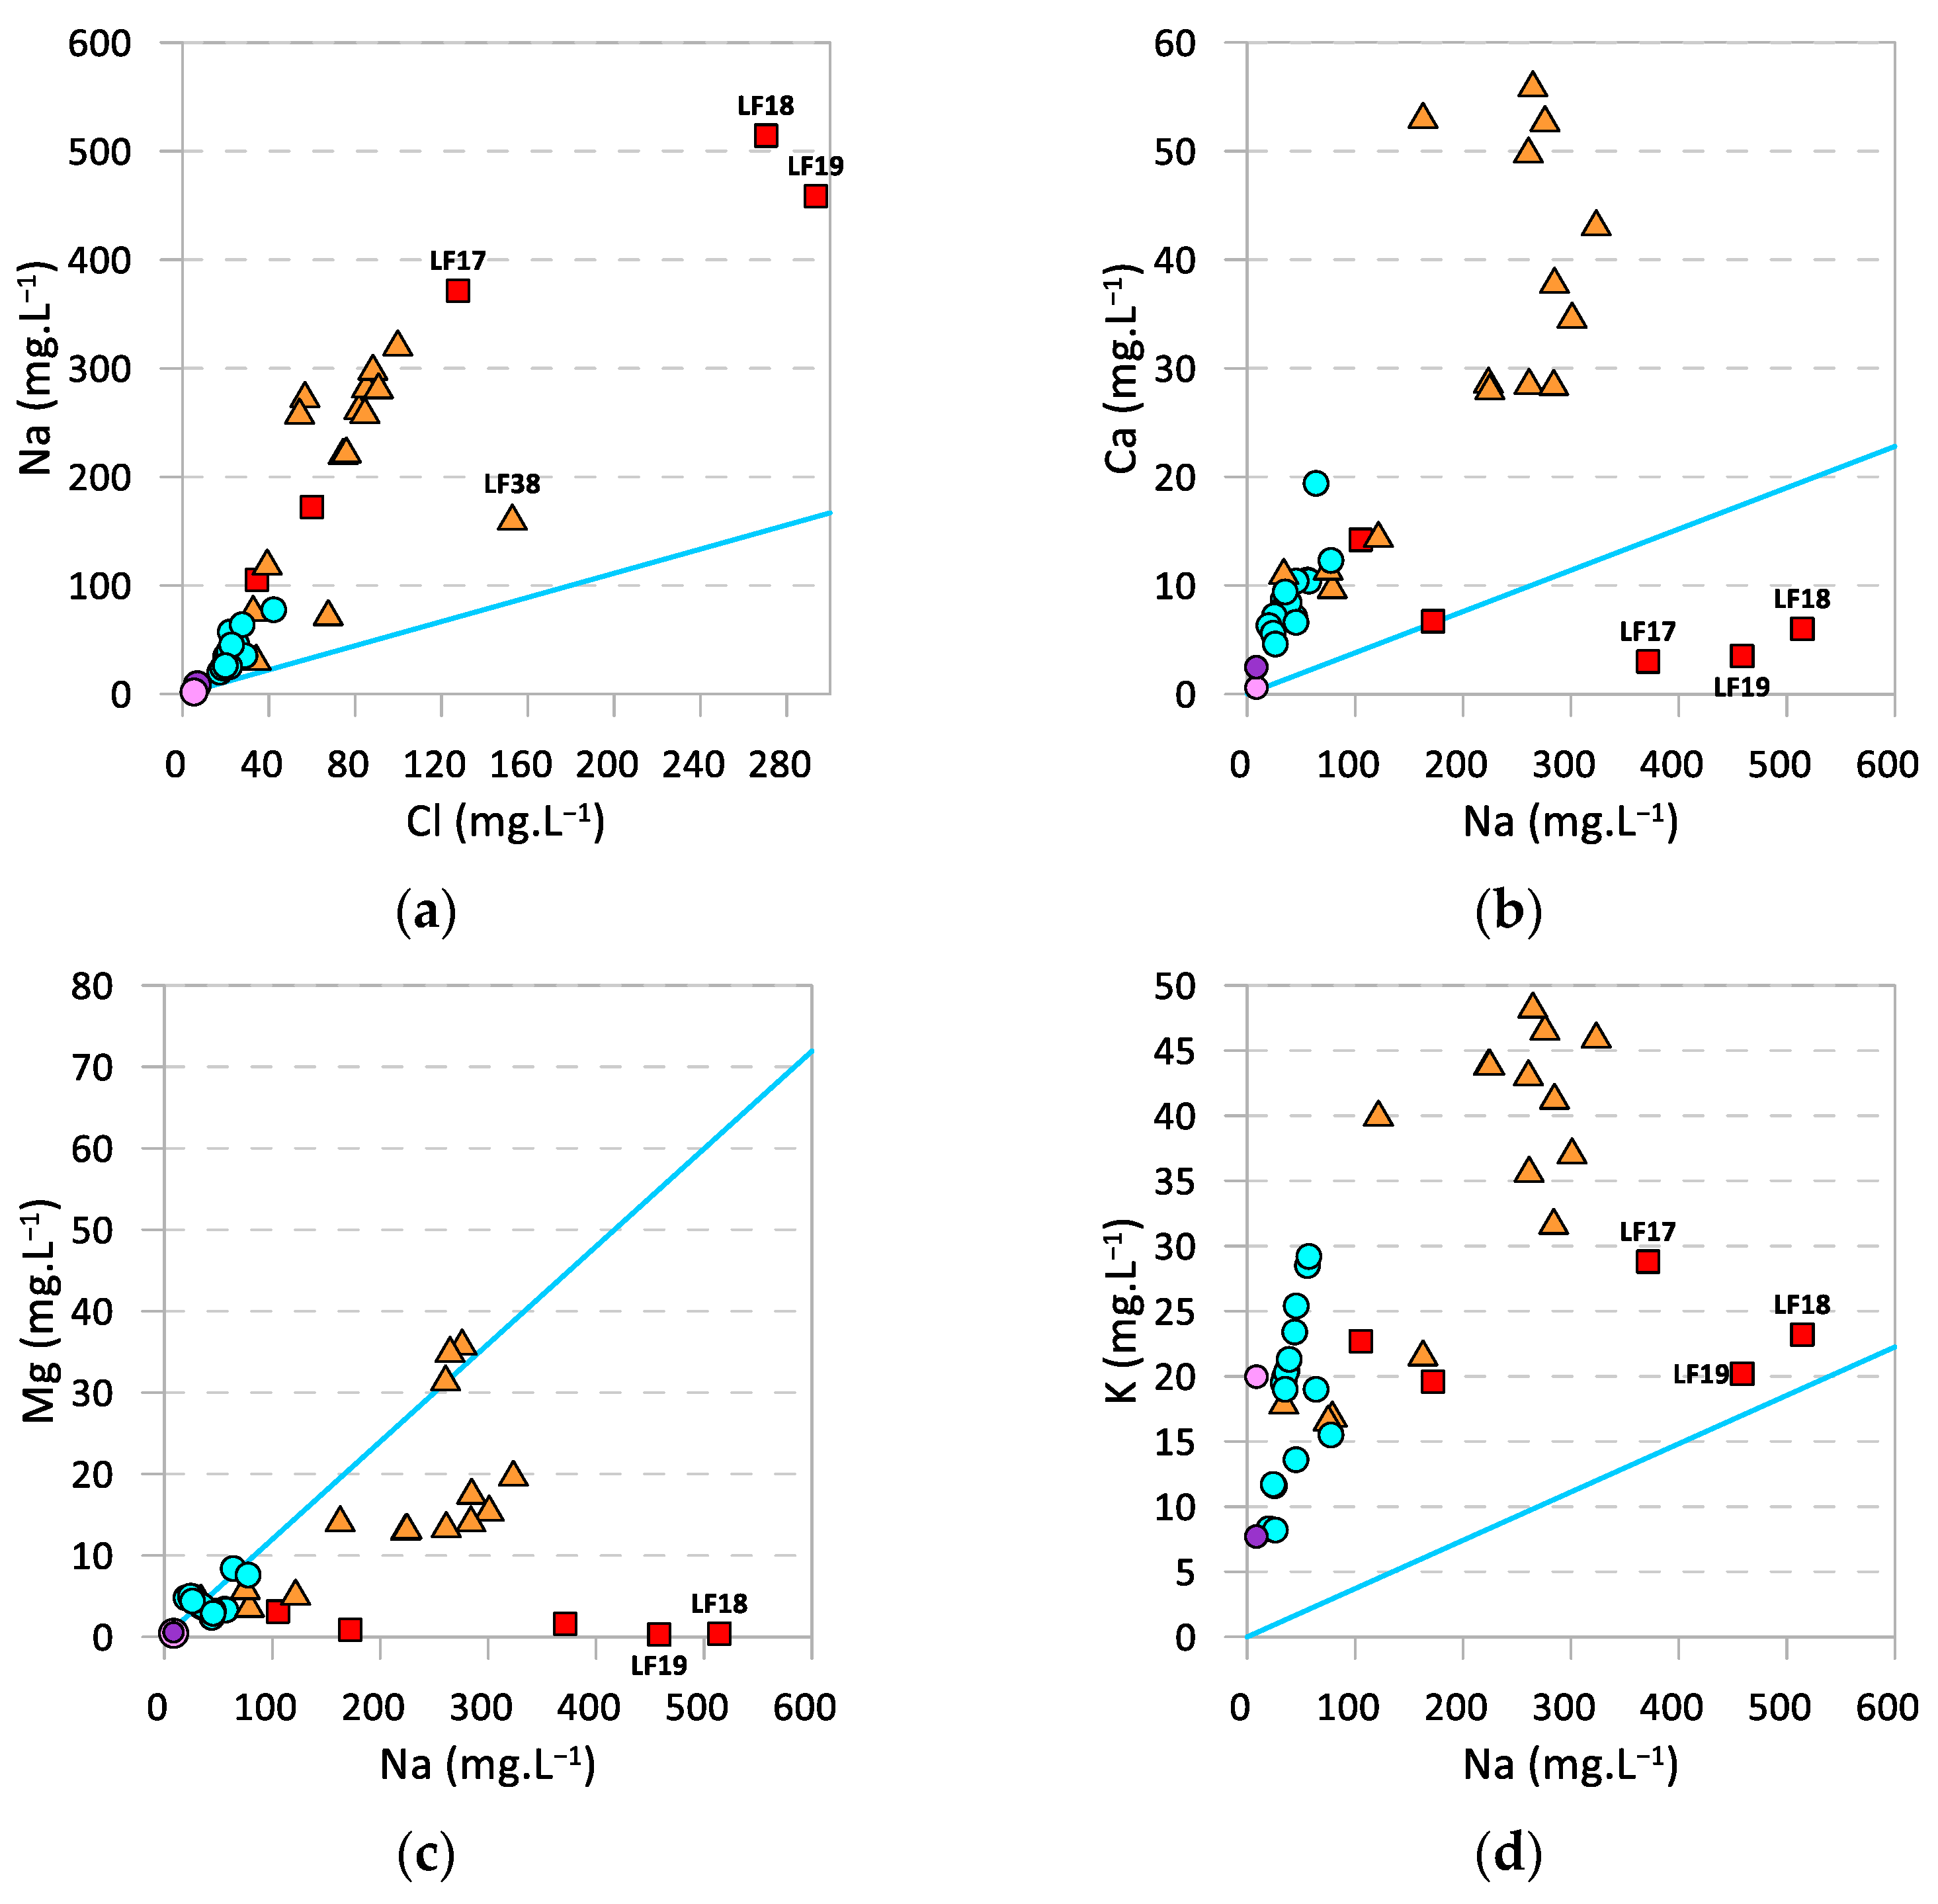
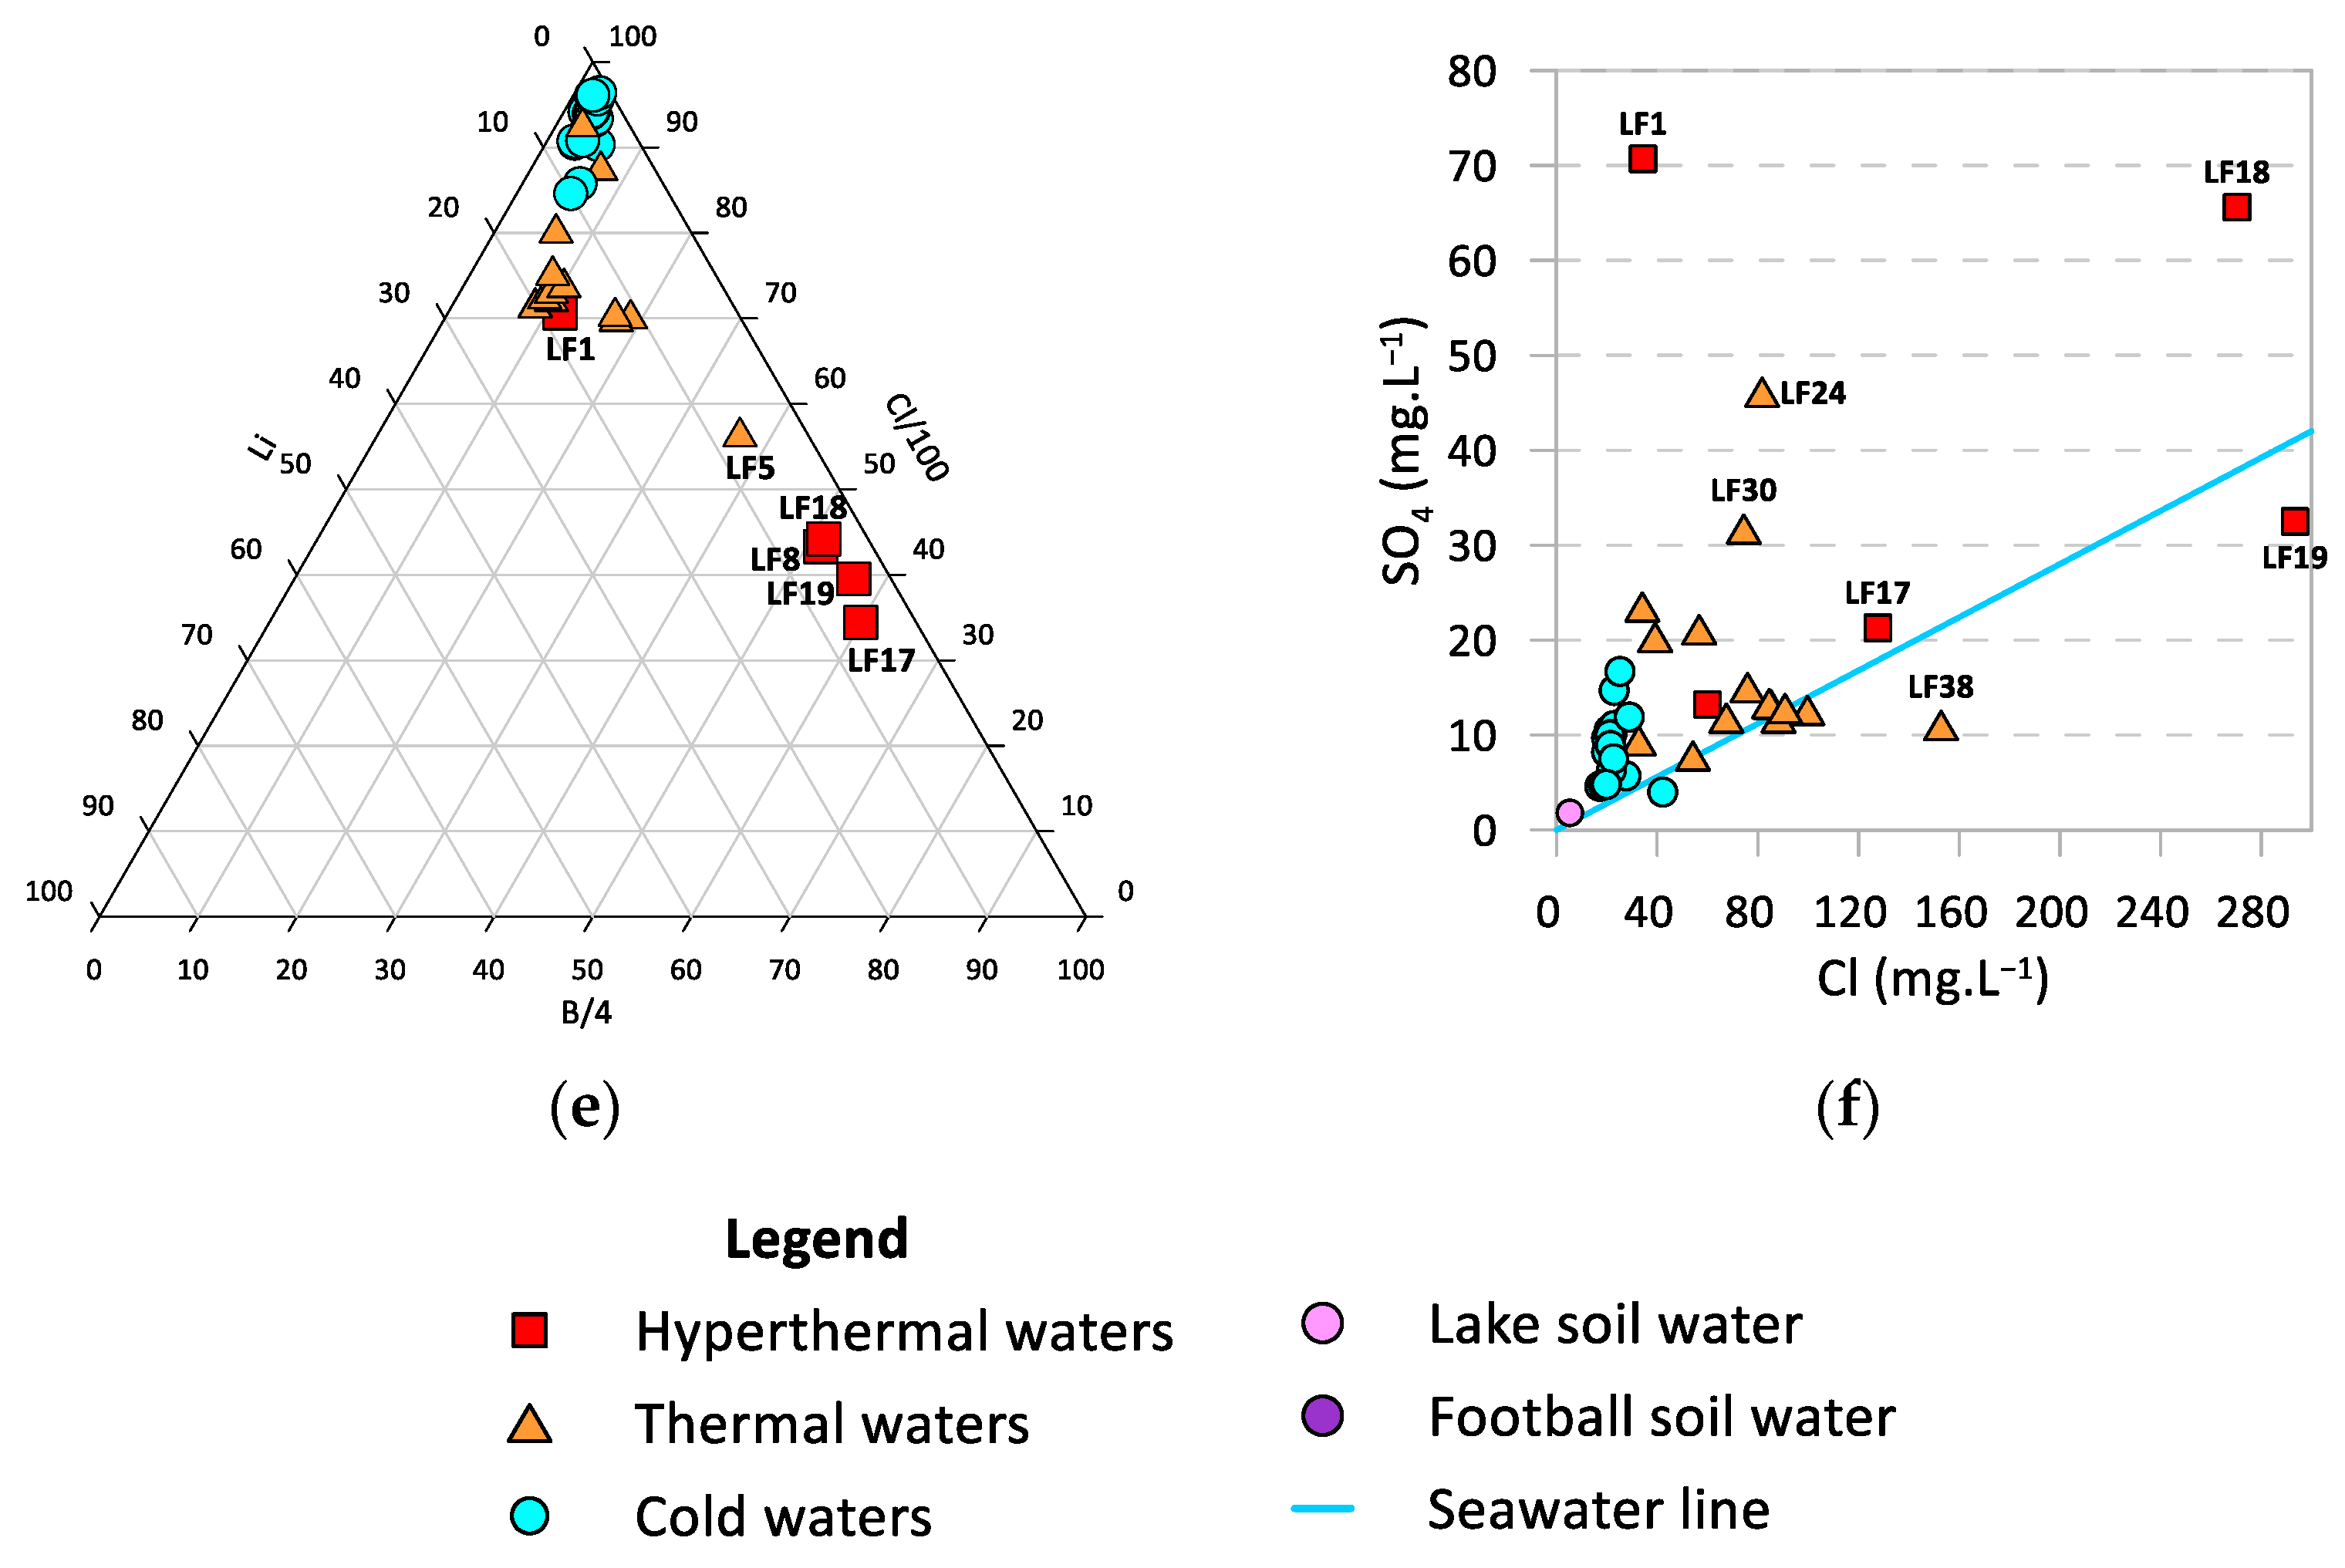
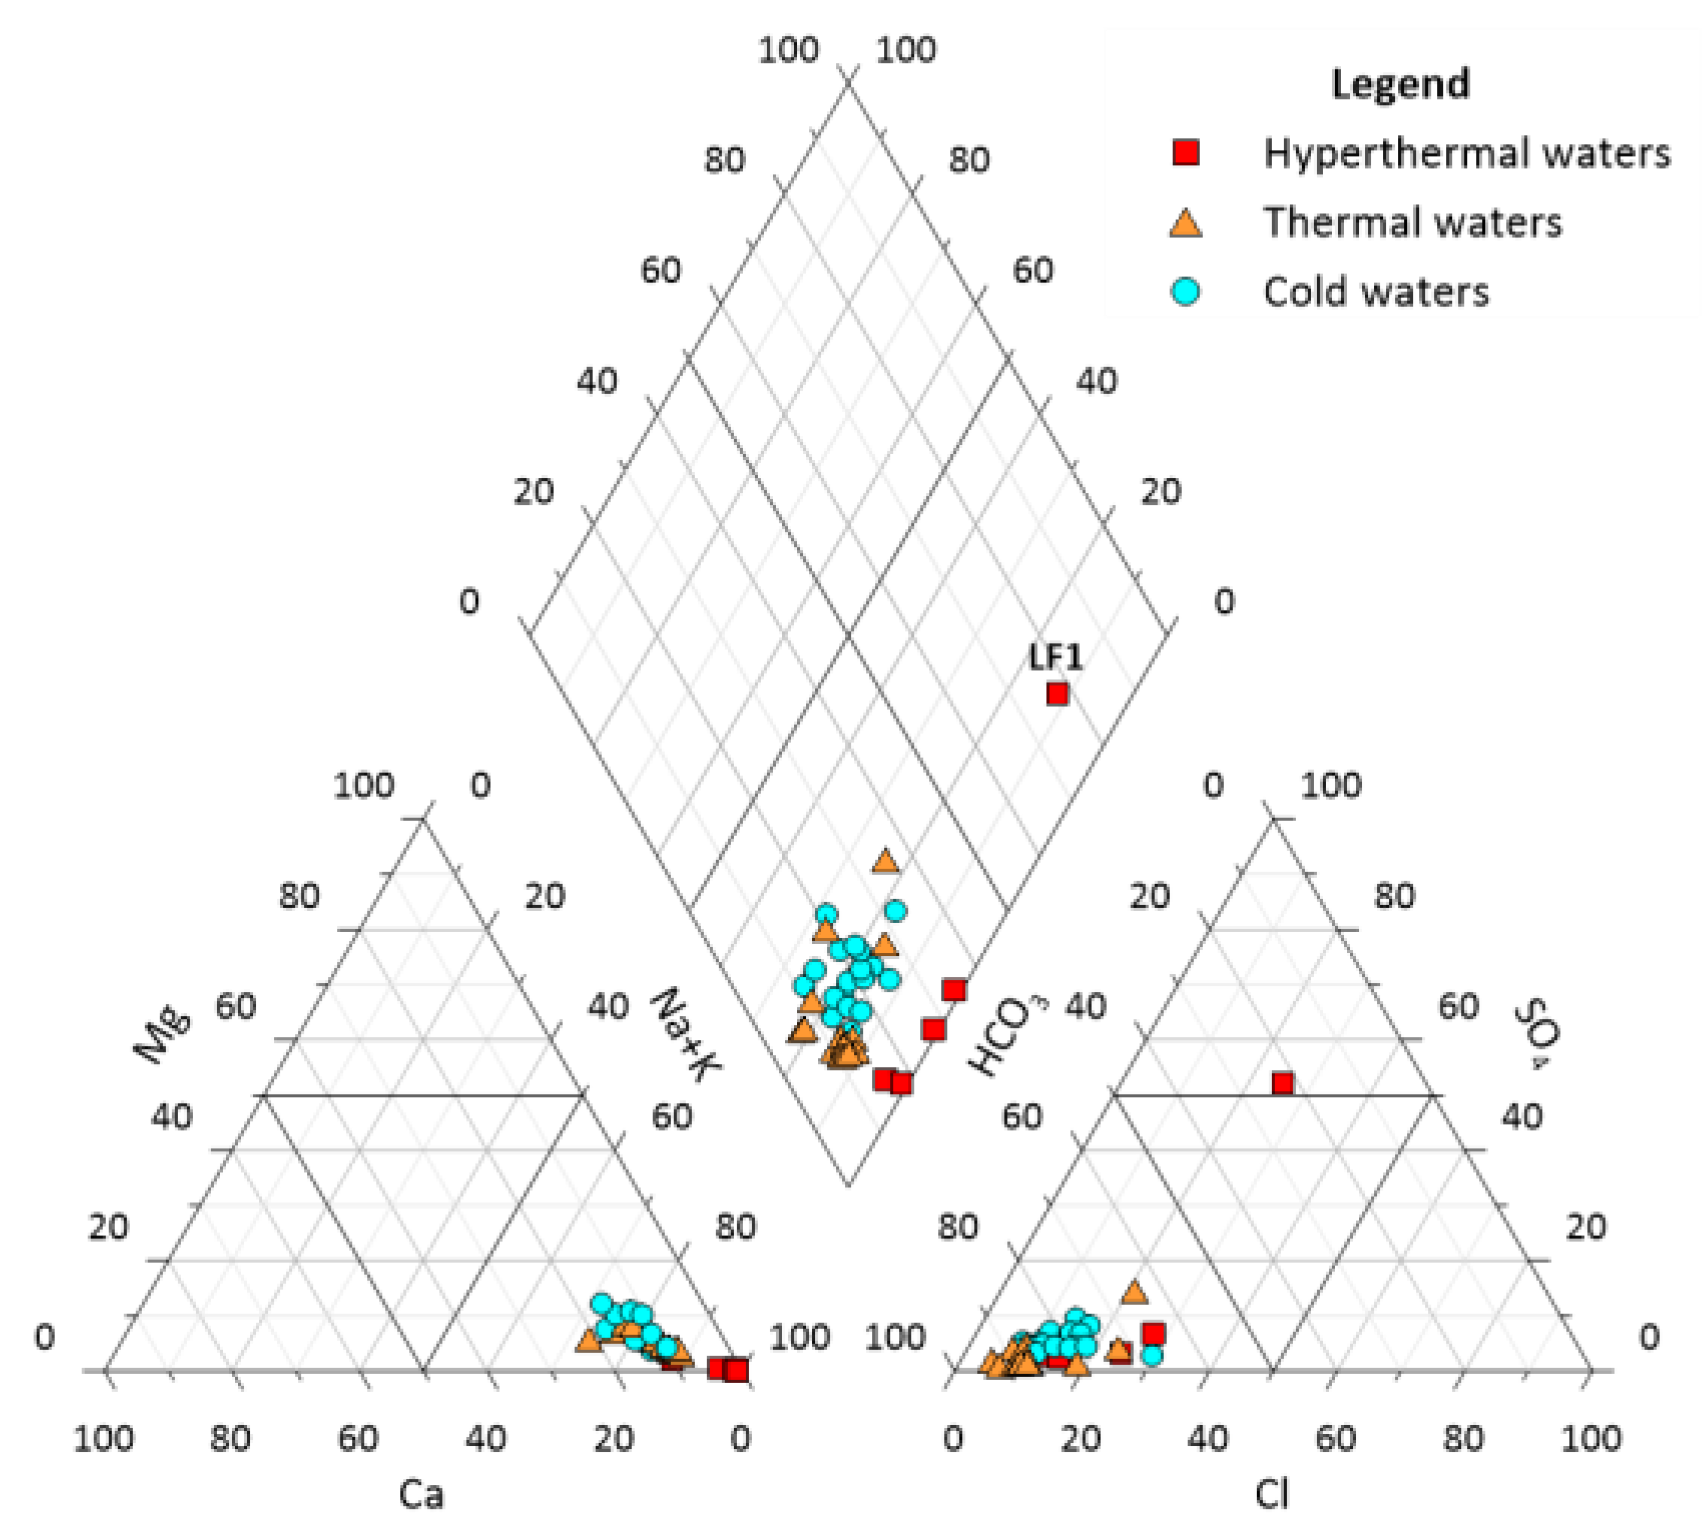
4.1. General Hydrogeochemical Characterization
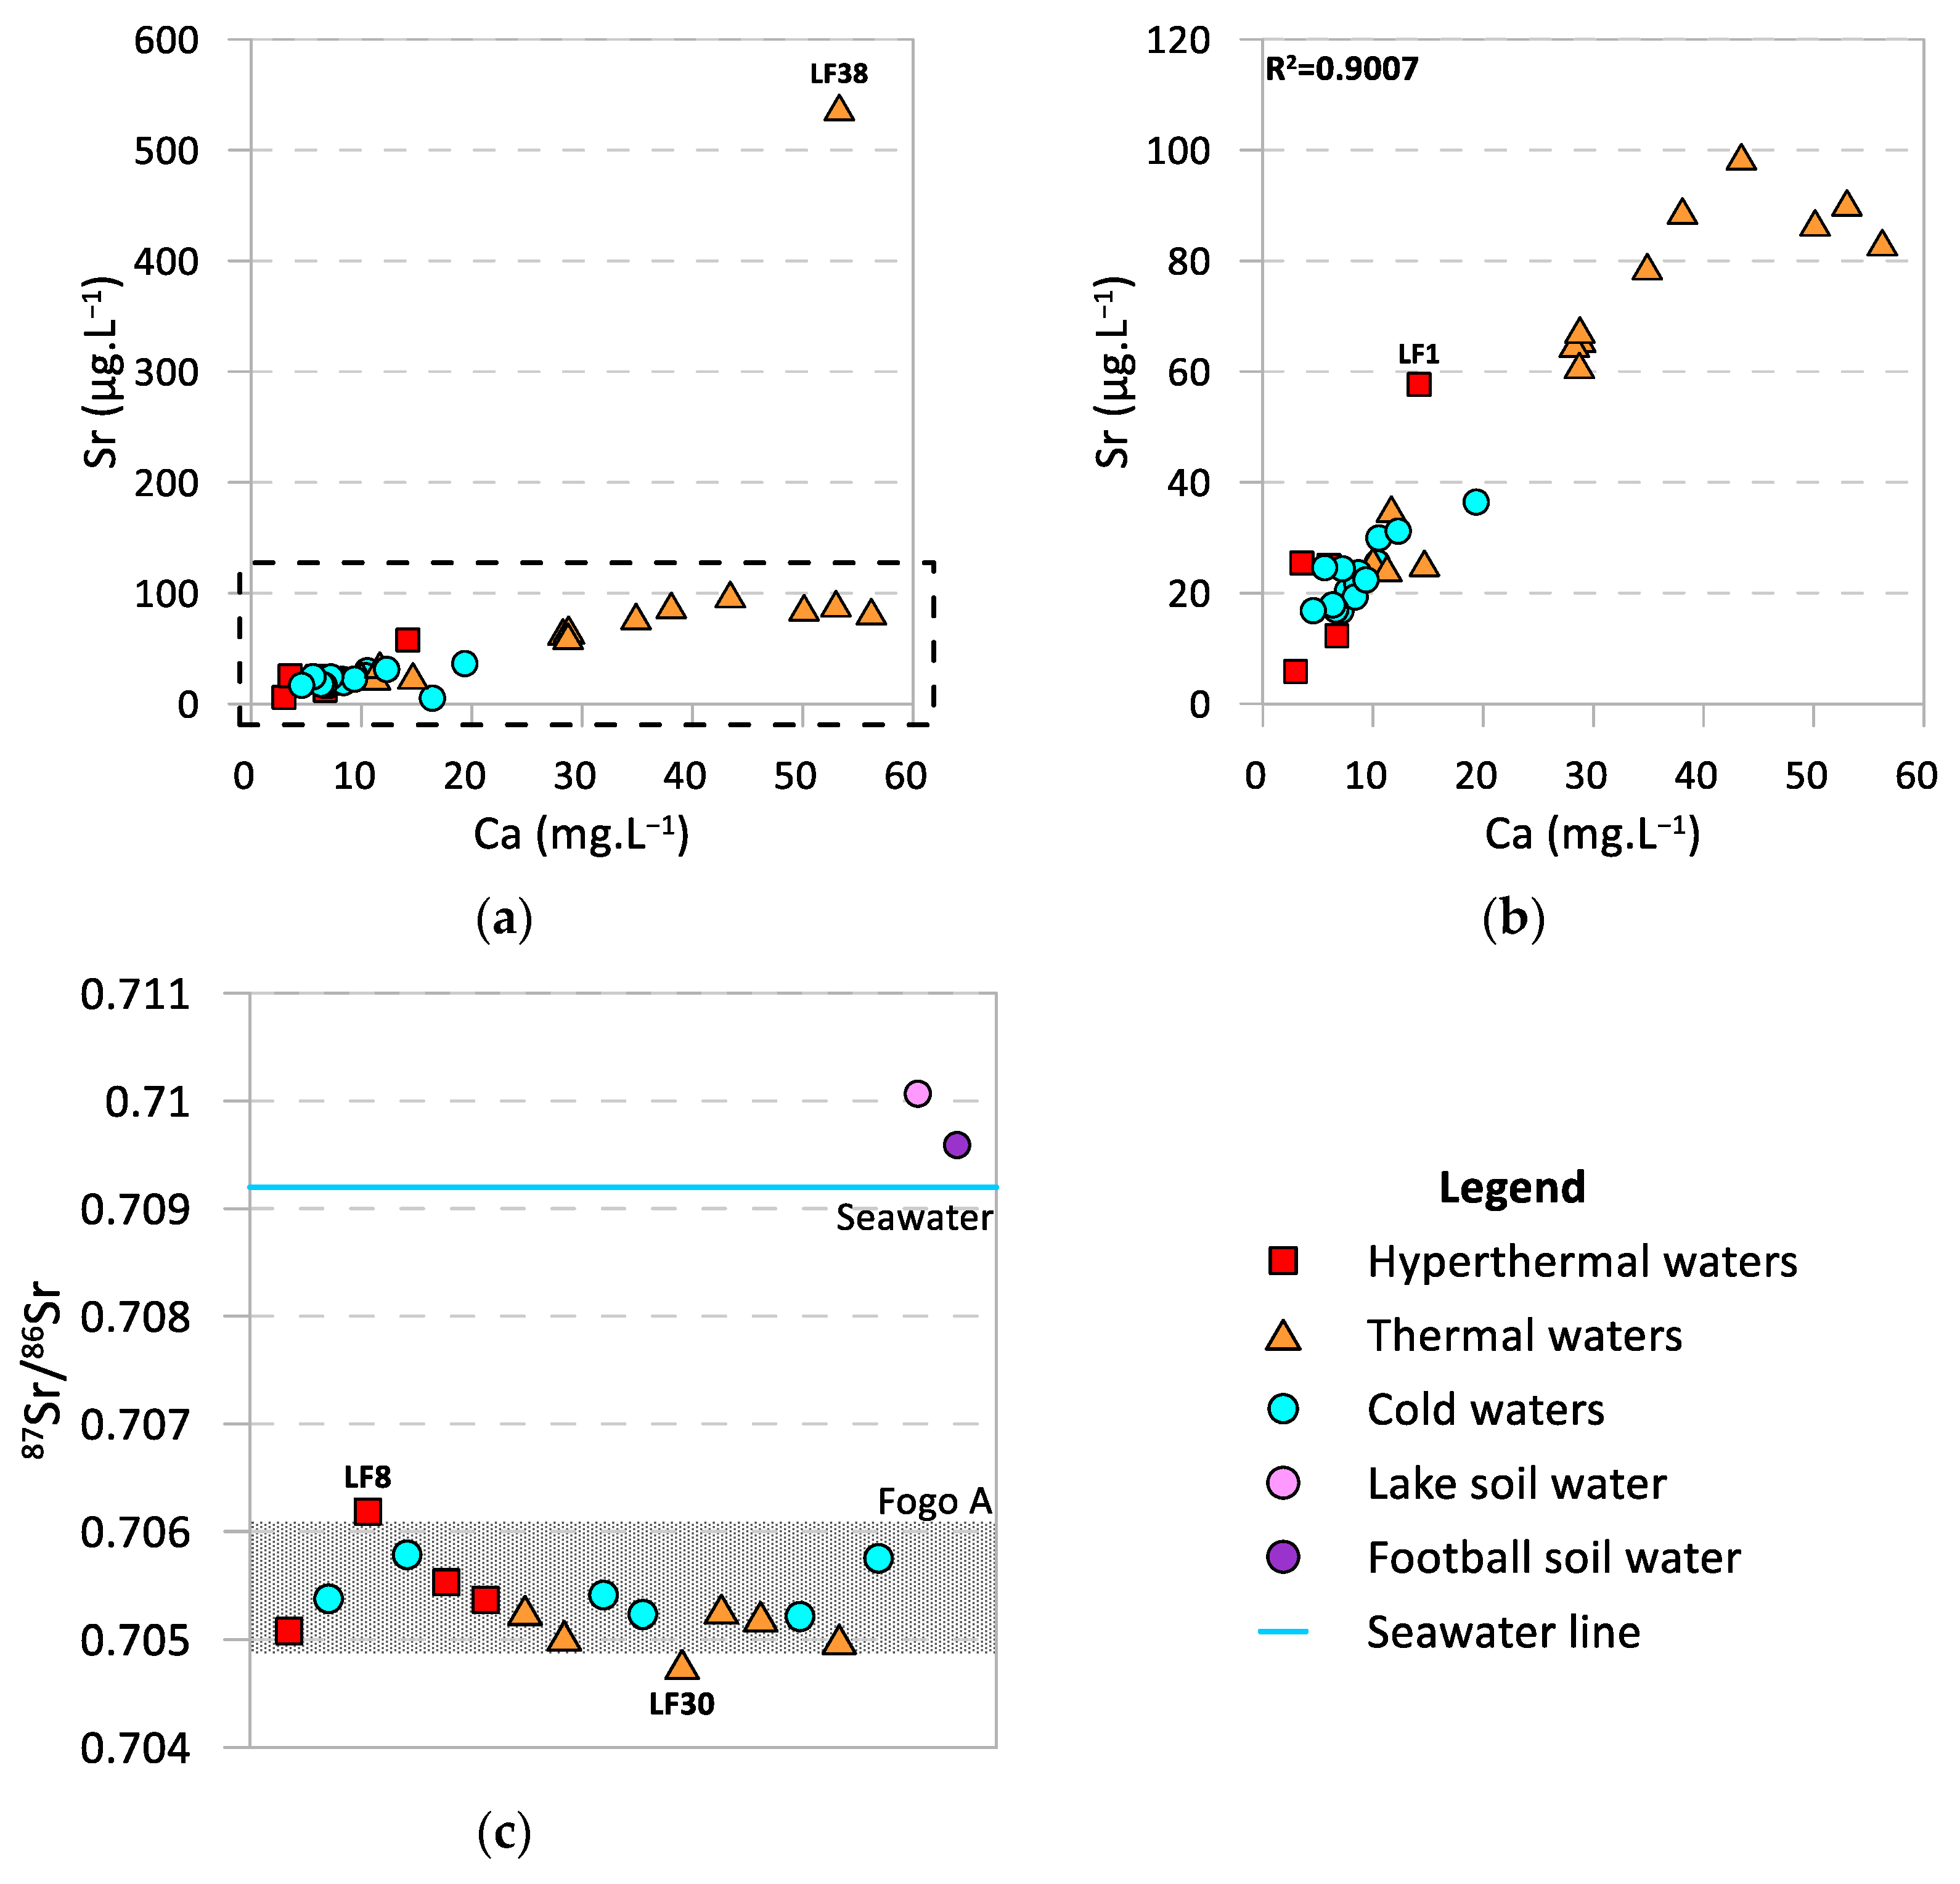
4.2. Strontium and Strontium Isotope Ratios as Source Tracers
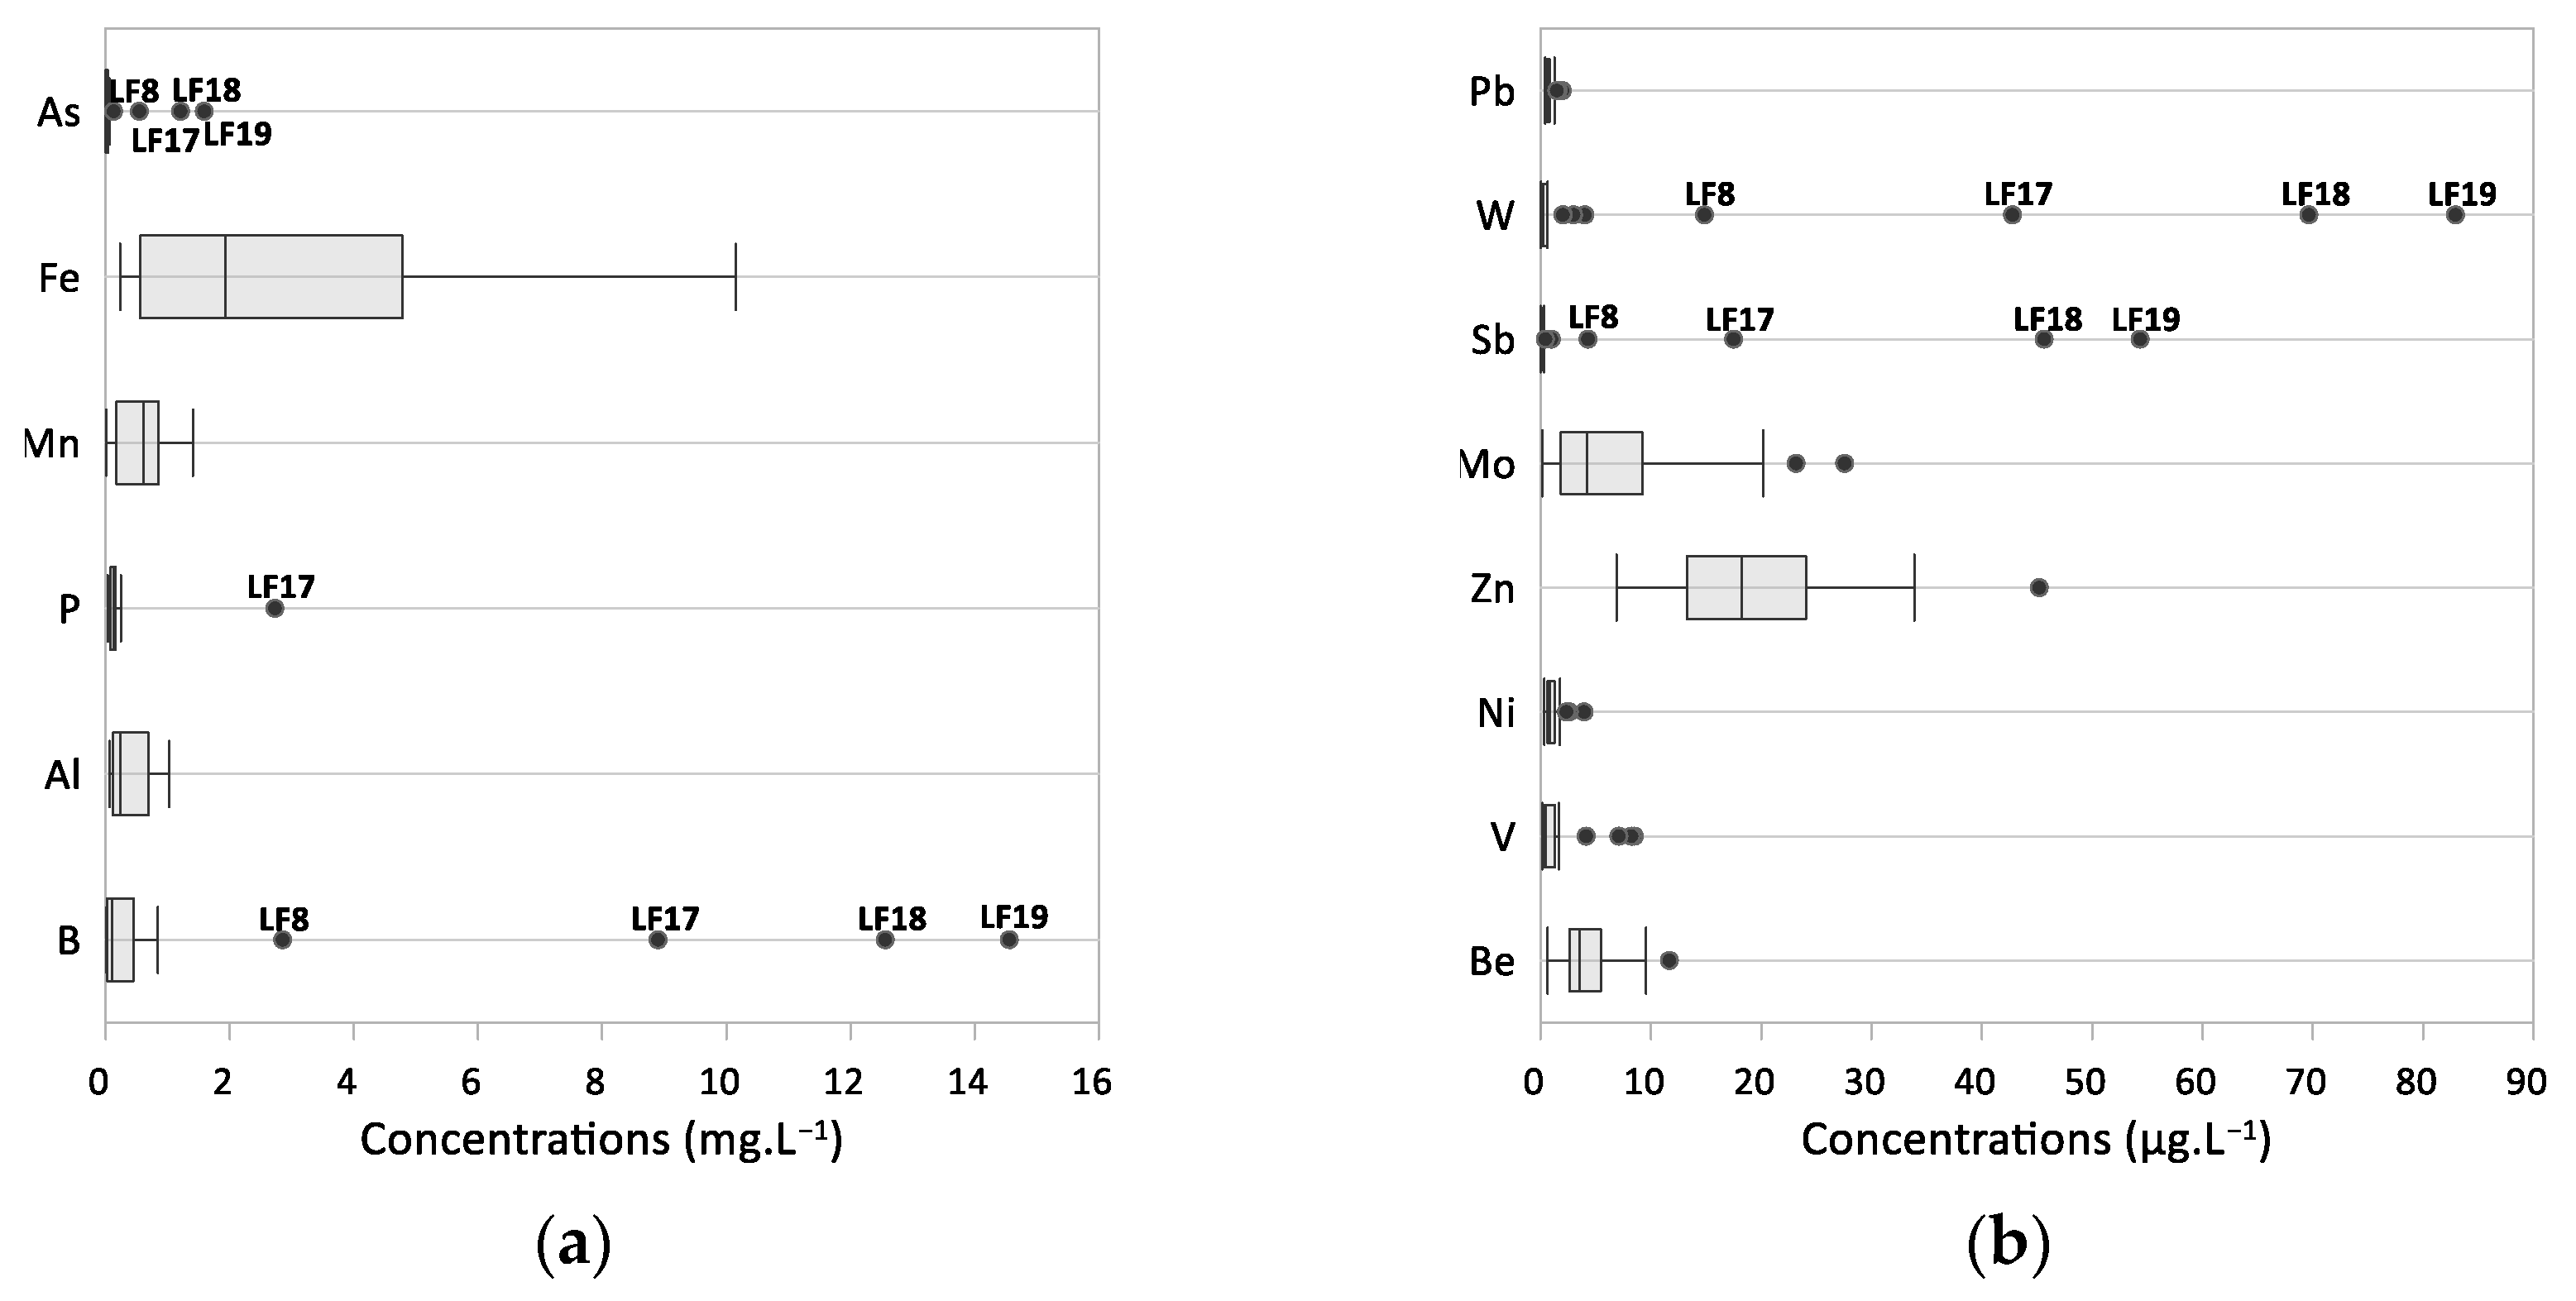
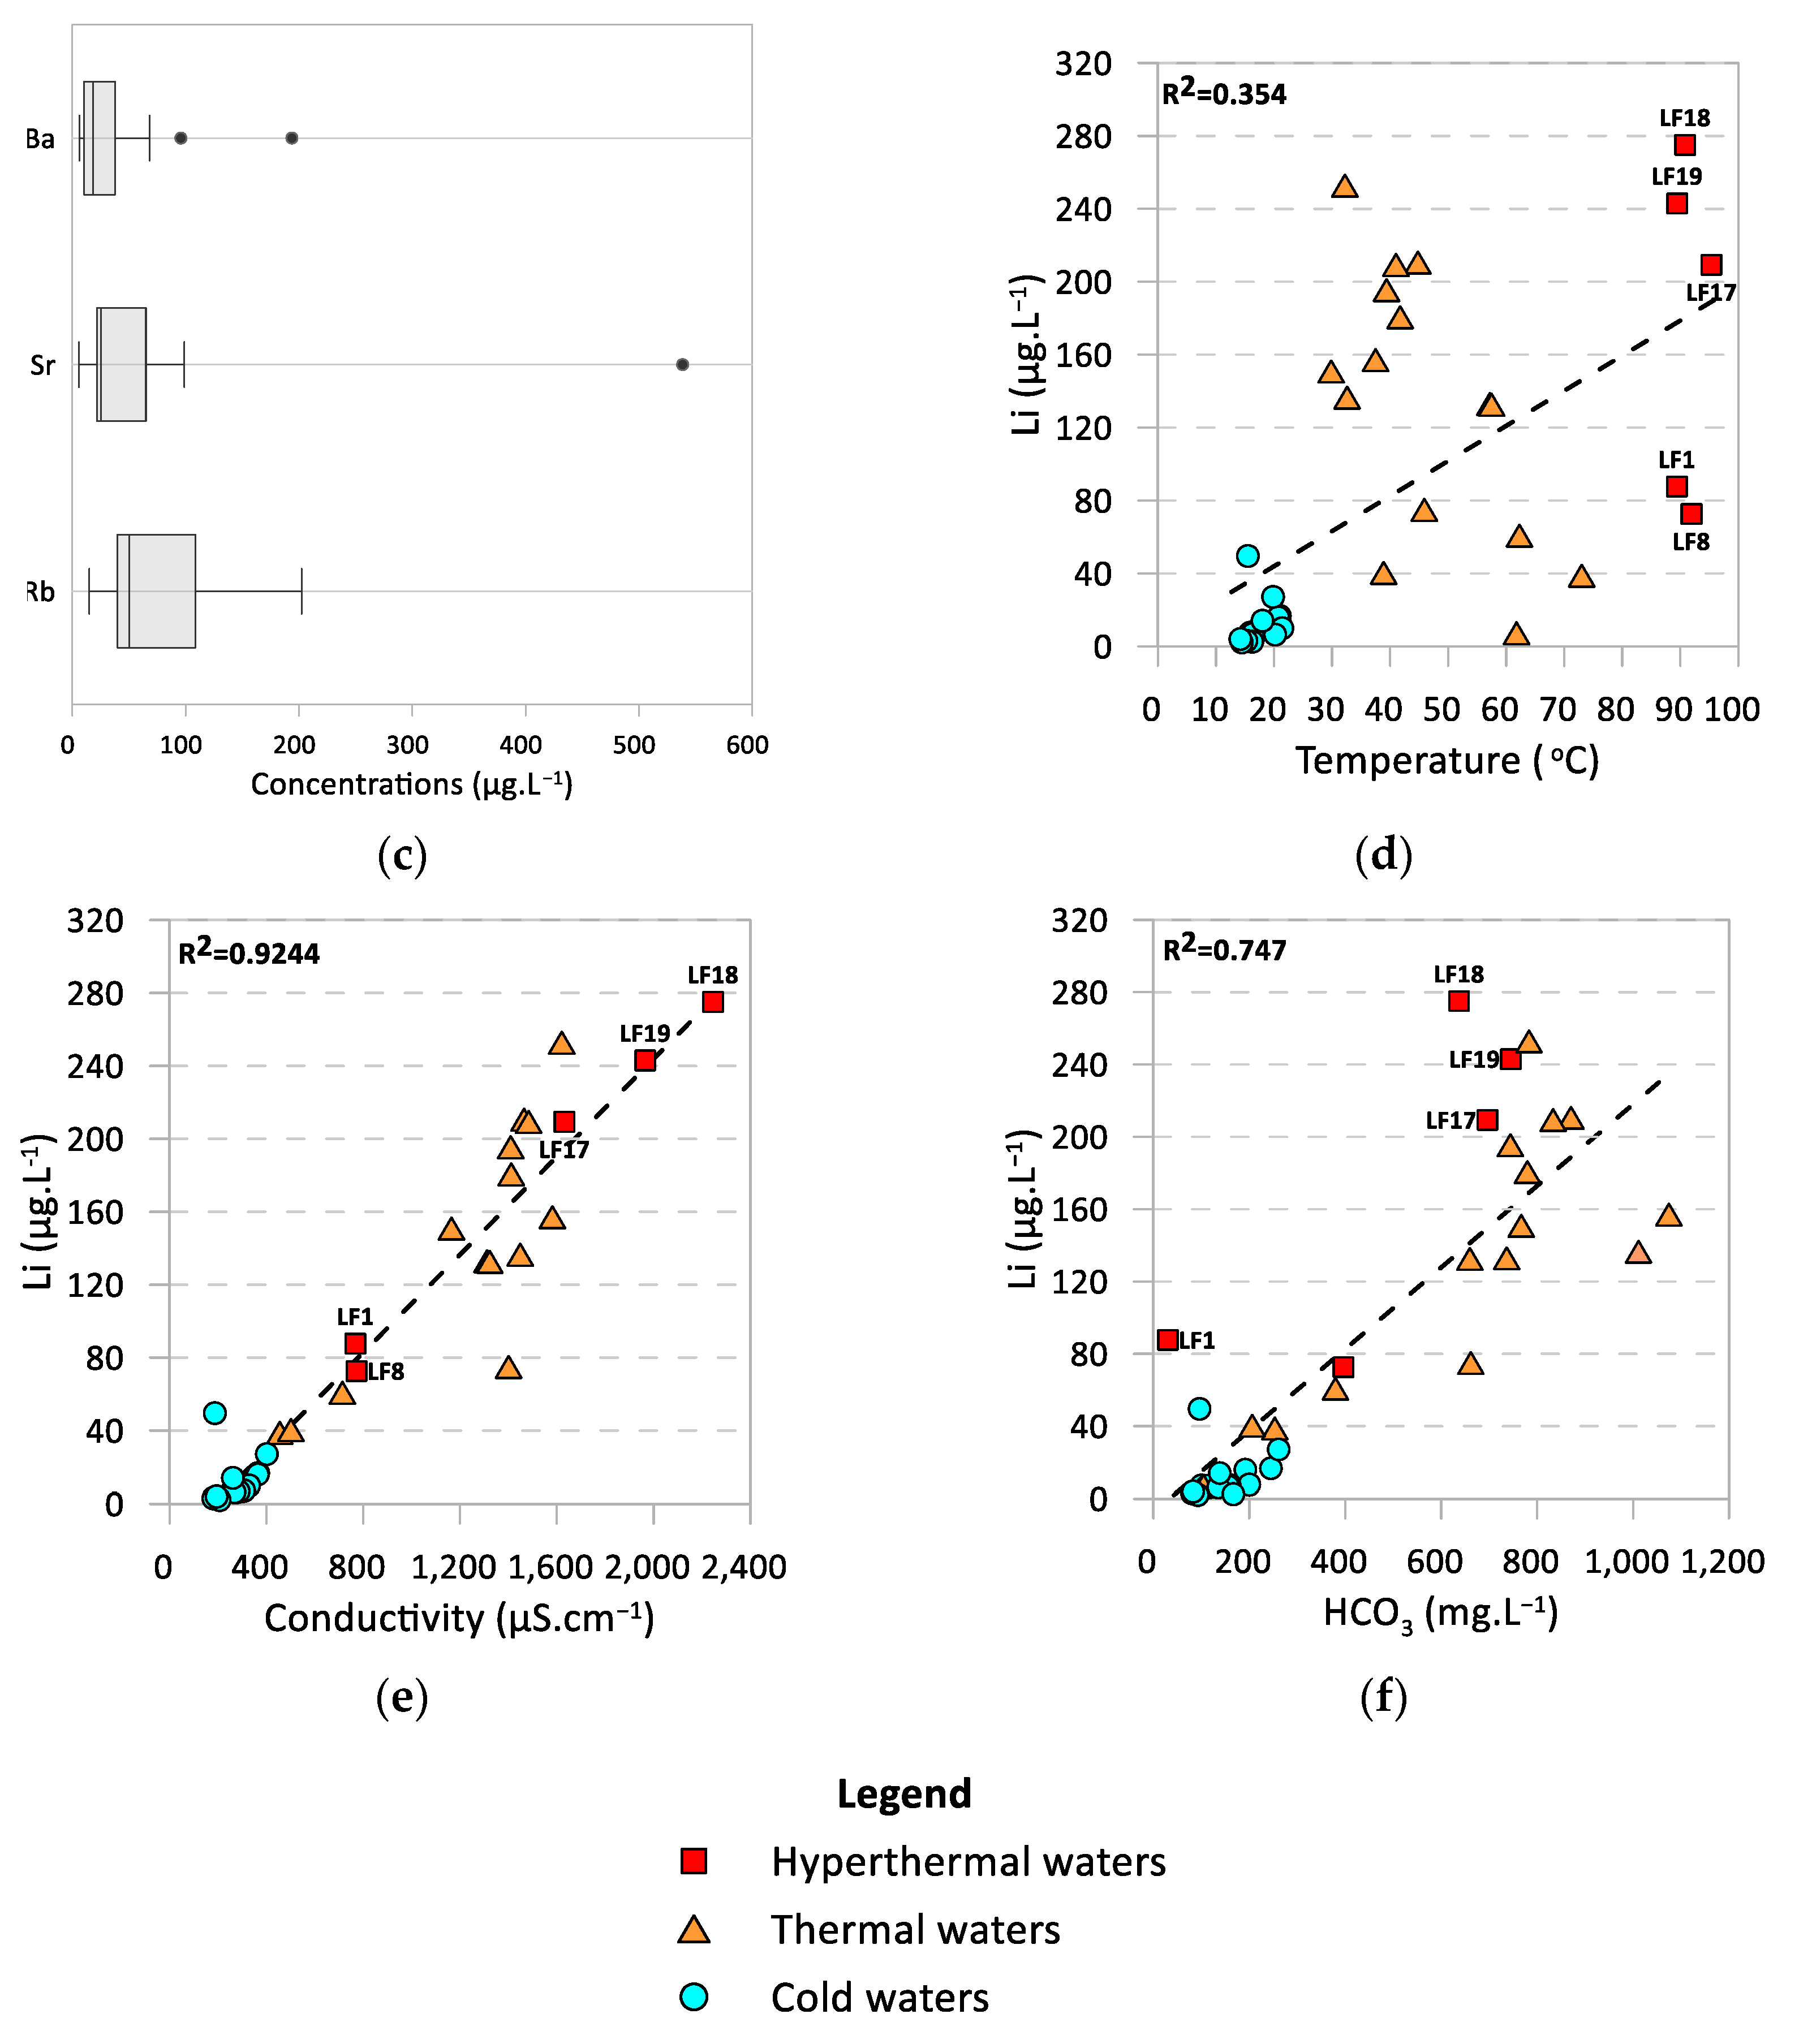
4.3. Trace Elements Signatures
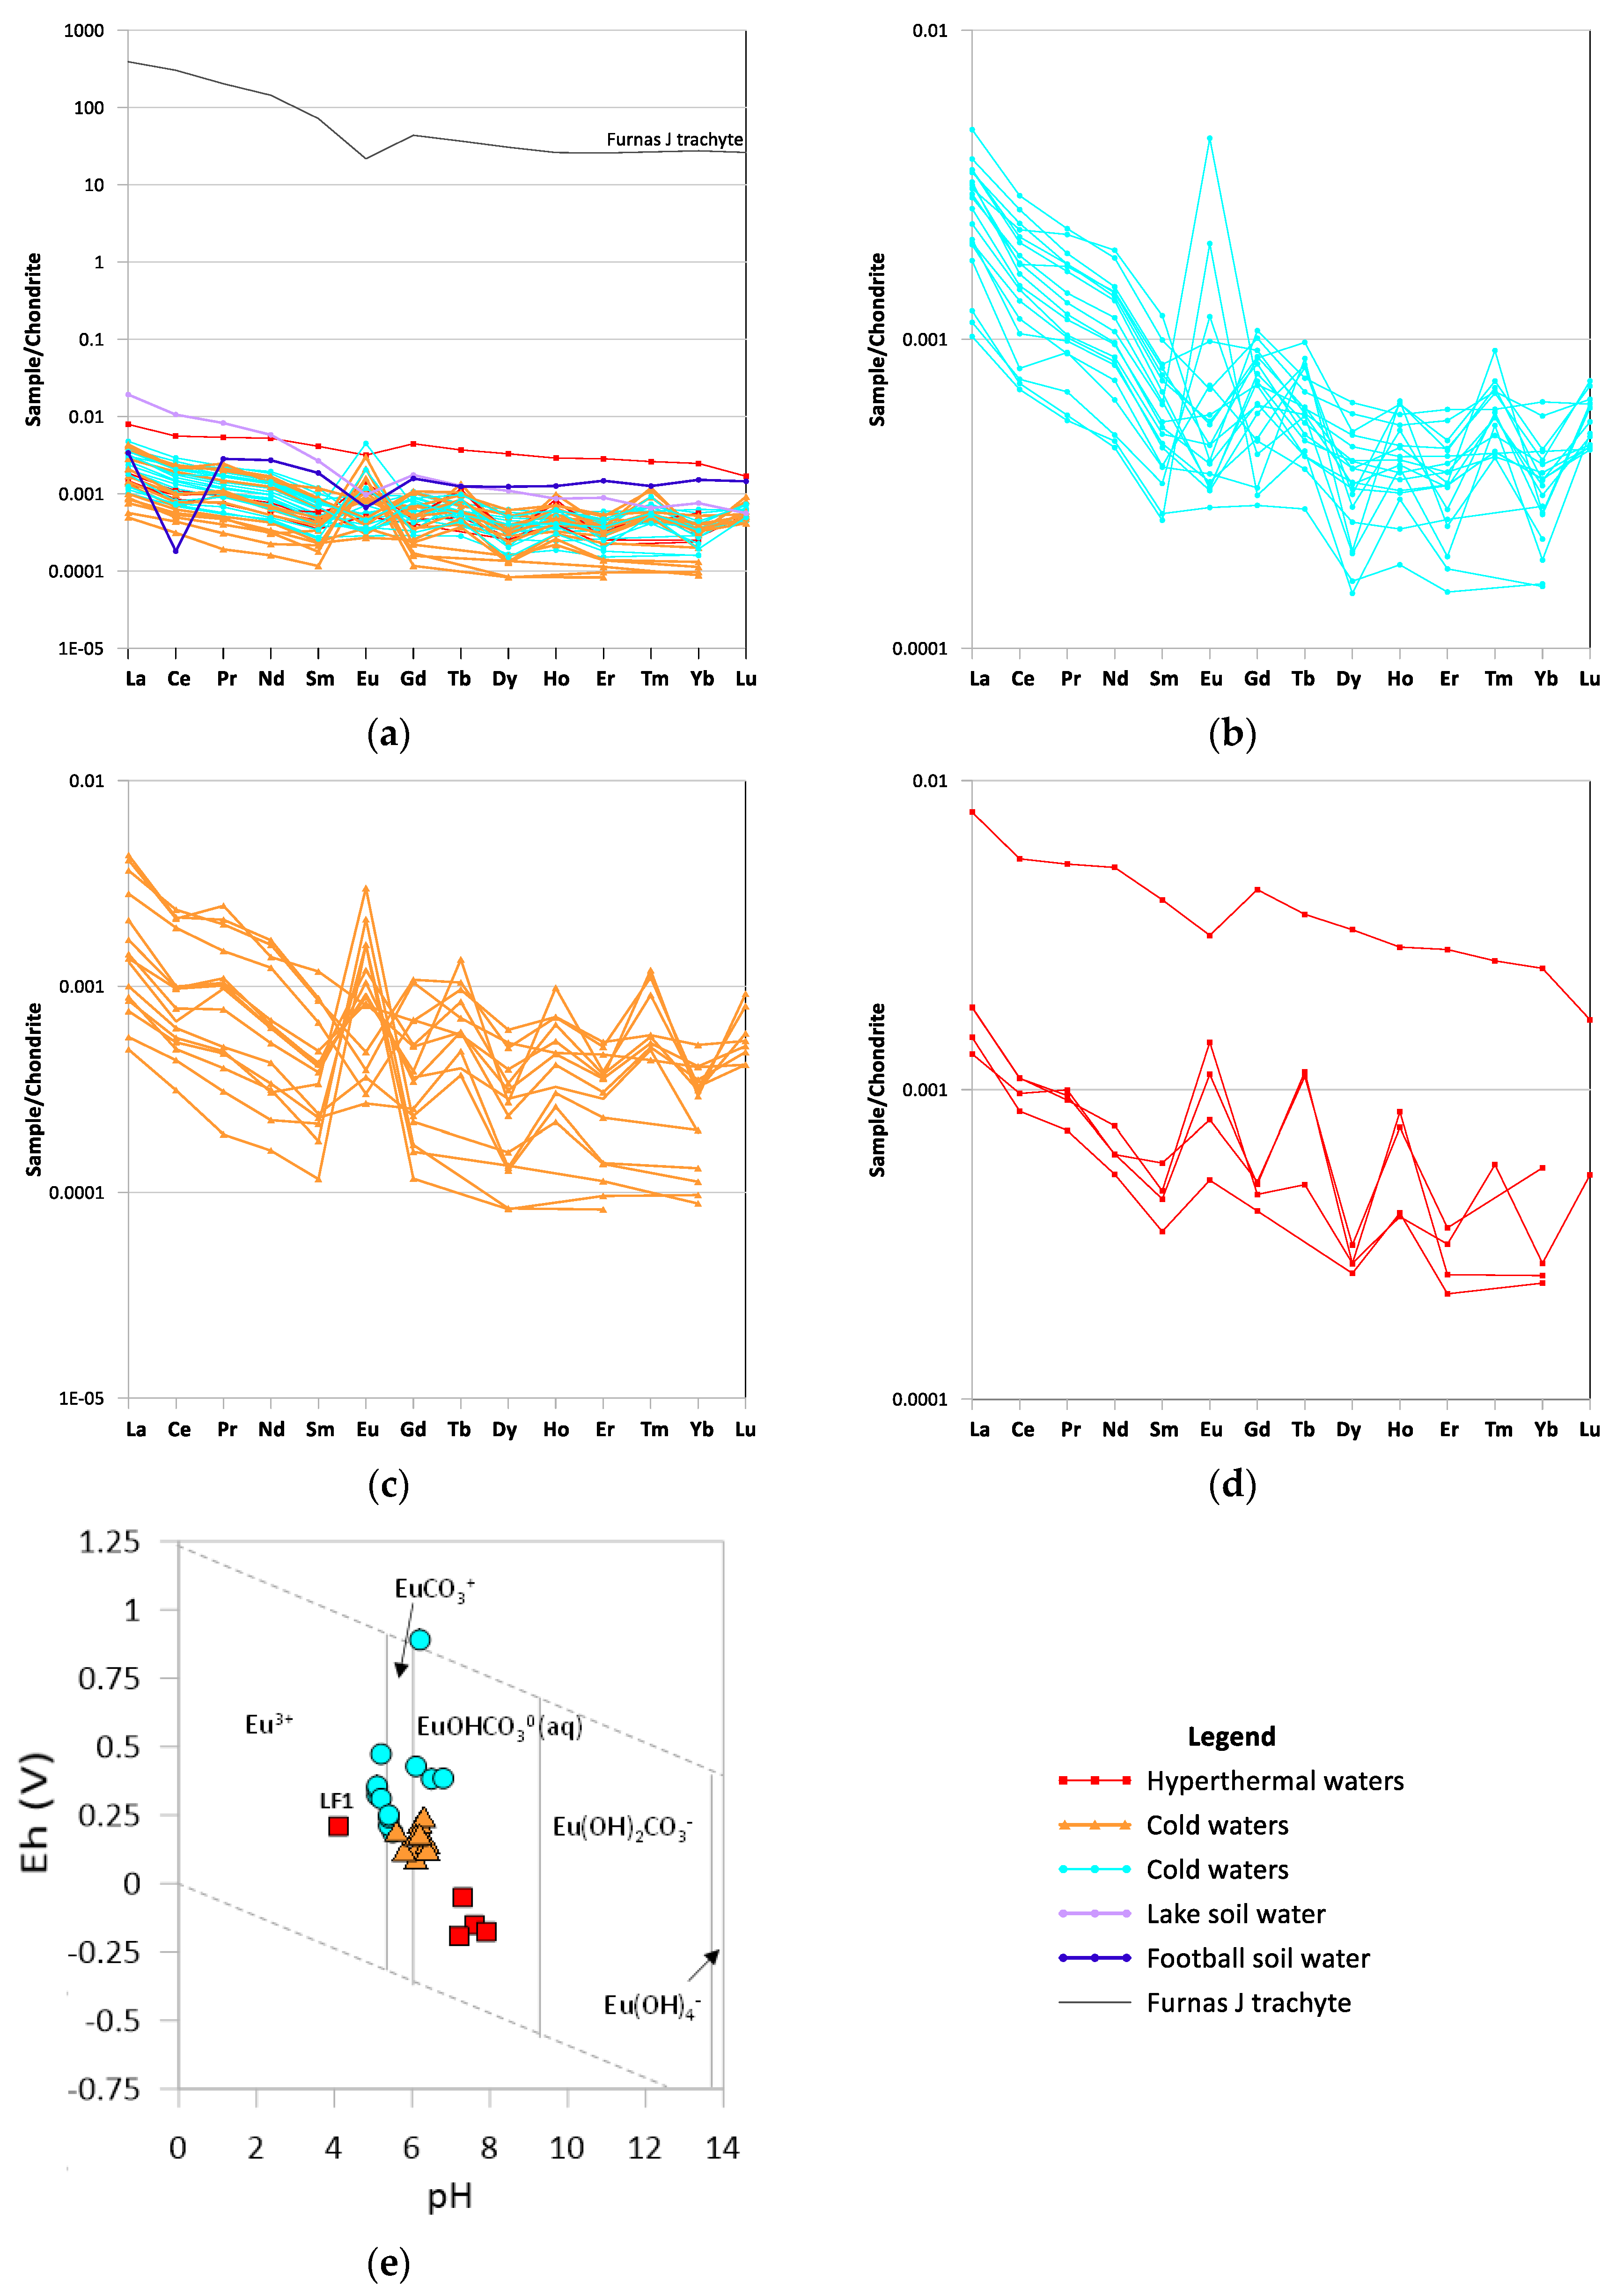
4.4. Rare Earth Element Patterns
5. Conceptual Hydrogeological Model
6. Conclusions
Supplementary Materials
Author Contributions
Funding
Data Availability Statement
Acknowledgments
Conflicts of Interest
Appendix A

| Ref. | Sample Location (Designation) | Type | Statistical Parameter | T | pH | Eh | Cond. | CO2 | HCO3− | Cl− | SO42− | Na+ | Mg2+ | K+ | Ca2+ |
|---|---|---|---|---|---|---|---|---|---|---|---|---|---|---|---|
| °C | V | µS·cm−1 | mg·L−1 | ||||||||||||
| Detection Limit | 0.5 | 1 | 0.1 | 0.05 | 0.05 | 0.1 | |||||||||
| LF1 | Caldeira da Lagoa das Furnas | Hyperthermal | Min | 87.4 | 3.3 | 0.209 | 576.0 | 5.0 | 28.1 | 18.8 | 20.2 | 97.0 | 2.1 | 20.1 | 11.4 |
| Max | 91.5 | 5.3 | 928.0 | 108.6 | 32.9 | 49.7 | 119.1 | 119.2 | 4.5 | 24.6 | 20.8 | ||||
| Mean | 89.4 | 4.1 | 768.1 | 50.2 | 30.5 | 34.4 | 70.7 | 105.2 | 3.1 | 22.7 | 14.2 | ||||
| Median | 89.1 | 3.8 | 795.0 | 23.6 | 30.5 | 35.5 | 62.4 | 101.9 | 3.0 | 22.7 | 13.5 | ||||
| LF2 | Nascente da Ponte | Cold | Min | 20.6 | 5.2 | 0.187 | 359.0 | 581.8 | 160.4 | 19.2 | 3.8 | 50.4 | 3.1 | 26.6 | 9.0 |
| Max | 22.1 | 5.7 | 379.0 | 787.8 | 350.1 | 26.6 | 32.7 | 65.9 | 3.8 | 31.2 | 12.7 | ||||
| Mean | 21.0 | 5.5 | 366.0 | 653.4 | 245.1 | 22.9 | 14.7 | 55.8 | 3.4 | 28.5 | 10.5 | ||||
| Median | 20.8 | 5.4 | 364.0 | 644.6 | 259.3 | 22.4 | 11.5 | 53.6 | 3.4 | 27.8 | 10.3 | ||||
| LF3 | Miguel Henriques | Cold | Min | 20.4 | 5.2 | 0.212 | 355.0 | 407.6 | 148.8 | 19.9 | 3.8 | 51.0 | 3.2 | 26.9 | 9.4 |
| Max | 21.1 | 5.5 | 376.0 | 736.1 | 243.4 | 25.6 | 17.3 | 66.1 | 3.8 | 31.4 | 11.9 | ||||
| Mean | 20.7 | 5.4 | 364.6 | 556.7 | 191.8 | 22.1 | 10.3 | 57.1 | 3.3 | 29.2 | 10.4 | ||||
| Median | 20.7 | 5.4 | 366.0 | 567.9 | 188.5 | 22.4 | 9.6 | 54.9 | 3.2 | 29.0 | 9.9 | ||||
| LF4 | Água da Prata | Cold | Min | 20.6 | 5.0 | 0.322 | 322.0 | 539.8 | 102.5 | 19.5 | 6.5 | 40.9 | 3.0 | 23.5 | 9.0 |
| Max | 23.0 | 5.3 | 337.0 | 836.6 | 237.3 | 39.1 | 23.1 | 53.0 | 3.7 | 27.5 | 11.8 | ||||
| Mean | 21.4 | 5.1 | 328.4 | 669.9 | 134.3 | 25.2 | 16.7 | 45.4 | 3.2 | 25.4 | 10.4 | ||||
| Median | 21.2 | 5.1 | 329.0 | 618.8 | 119.6 | 23.8 | 16.3 | 43.5 | 3.0 | 25.5 | 10.6 | ||||
| LF5 | Caldeirão | Thermal | Min | 72.1 | 6.0 | 0.091 | 446.0 | 61.2 | 226.9 | 29.1 | 3.8 | 70.4 | 3.7 | 15.9 | 8.8 |
| Max | 75.1 | 6.3 | 468.0 | 188.8 | 325.1 | 36.2 | 23.1 | 91.2 | 4.6 | 18.4 | 12.5 | ||||
| Mean | 73.0 | 6.1 | 455.3 | 108.0 | 253.2 | 32.7 | 9.4 | 78.9 | 4.0 | 17.1 | 10.0 | ||||
| Median | 72.8 | 6.1 | 454.0 | 84.3 | 242.8 | 32.7 | 6.7 | 76.6 | 3.9 | 17.2 | 9.5 | ||||
| LF6 | Água da Prata 2 | Cold | Min | 15.8 | 4.7 | 0.345 | 176.0 | 549.7 | 119.6 | 18.5 | 3.4 | 30.8 | 3.5 | 18.5 | 7.5 |
| Max | 20.2 | 5.5 | 279.0 | 911.0 | 503.9 | 22.0 | 25.0 | 39.9 | 4.1 | 21.5 | 9.4 | ||||
| Mean | 16.6 | 5.1 | 261.7 | 716.0 | 200.2 | 19.9 | 9.7 | 34.4 | 3.7 | 19.9 | 8.2 | ||||
| Median | 16.1 | 5.1 | 276.0 | 722.1 | 156.2 | 19.2 | 7.7 | 32.8 | 3.6 | 19.8 | 7.9 | ||||
| LF7 | Azeda do Rebentão | Cold | Min | 15.6 | 5.0 | 0.356 | 270.0 | 80.5 | 112.9 | 19.5 | 2.6 | 30.7 | 3.6 | 18.1 | 7.5 |
| Max | 16.2 | 5.2 | 280.0 | 1105.0 | 298.9 | 22.4 | 19.2 | 40.1 | 4.4 | 21.6 | 9.7 | ||||
| Mean | 15.9 | 5.1 | 276.9 | 820.5 | 158.2 | 20.9 | 10.5 | 34.1 | 3.8 | 19.6 | 8.2 | ||||
| Median | 16.0 | 5.1 | 279.0 | 915.0 | 132.4 | 20.9 | 11.5 | 32.4 | 3.7 | 19.7 | 8.0 | ||||
| LF8 | Água Santa | Hyperthermal | Min | 86.4 | 7.0 | −0.051 | 720.0 | 12.2 | 333.7 | 54.0 | 6.7 | 144.0 | 0.6 | 18.2 | 5.2 |
| Max | 95.5 | 7.5 | 850.0 | 62.1 | 500.2 | 69.9 | 23.1 | 210.5 | 1.0 | 21.6 | 8.5 | ||||
| Mean | 91.9 | 7.3 | 772.1 | 45.7 | 396.2 | 60.0 | 13.2 | 172.2 | 0.9 | 19.6 | 6.7 | ||||
| Median | 93.2 | 7.3 | 772.0 | 51.3 | 402.6 | 58.9 | 11.5 | 166.7 | 0.9 | 19.4 | 6.6 | ||||
| LF9 | Água da Prata 3 | Cold | Min | 16.3 | 5.0 | 0.248 | 294.0 | 462.8 | 103.7 | 18.1 | 4.2 | 33.7 | 3.4 | 20.1 | 8.0 |
| Max | 20.5 | 5.3 | 301.0 | 818.1 | 203.1 | 23.4 | 20.2 | 43.9 | 4.7 | 23.9 | 11.2 | ||||
| Mean | 17.9 | 5.2 | 296.7 | 598.3 | 147.0 | 20.7 | 12.8 | 37.1 | 4.0 | 21.8 | 9.5 | ||||
| Median | 17.9 | 5.2 | 296.0 | 567.7 | 157.4 | 20.6 | 13.4 | 35.1 | 4.1 | 21.4 | 9.1 | ||||
| LF10 | Azeda | Cold | Min | 16.2 | 5.0 | 0.310 | 275.0 | 861.1 | 129.3 | 18.5 | 3.8 | 30.1 | 3.7 | 17.6 | 7.7 |
| Max | 17.2 | 5.7 | 288.0 | 1085.0 | 190.3 | 21.3 | 16.3 | 38.6 | 4.4 | 21.1 | 9.8 | ||||
| Mean | 16.4 | 5.2 | 279.1 | 961.4 | 159.7 | 19.9 | 8.2 | 33.3 | 4.0 | 19.5 | 8.7 | ||||
| Median | 16.3 | 5.1 | 278.0 | 931.2 | 160.4 | 19.2 | 6.7 | 31.7 | 3.9 | 19.3 | 8.3 | ||||
| LF11 | Tio José de Sousa 1 | Cold | Min | 16.3 | 5.2 | 0.241 | 303.0 | 243.4 | 70.8 | 21.3 | 2.8 | 40.2 | 2.2 | 21.8 | 6.4 |
| Max | 18.4 | 5.9 | 315.0 | 556.2 | 151.3 | 24.9 | 19.2 | 50.6 | 2.7 | 25.8 | 8.0 | ||||
| Mean | 17.0 | 5.4 | 307.7 | 399.2 | 100.4 | 22.9 | 11.0 | 44.0 | 2.4 | 23.4 | 7.1 | ||||
| Median | 16.7 | 5.3 | 308.0 | 406.5 | 98.2 | 22.7 | 10.6 | 42.1 | 2.3 | 23.2 | 6.8 | ||||
| LF12 | Tio José de Sousa 2 | Cold | Min | 15.4 | 5.1 | - | 274.0 | 518.0 | 92.1 | 20.6 | 2.6 | 33.2 | 3.2 | 18.1 | 6.6 |
| Max | 16.2 | 5.9 | 282.0 | 927.1 | 136.6 | 23.8 | 15.4 | 41.5 | 4.0 | 23.5 | 8.6 | ||||
| Mean | 15.8 | 5.4 | 278.6 | 700.5 | 118.0 | 22.0 | 10.1 | 36.8 | 3.6 | 20.4 | 7.7 | ||||
| Median | 15.7 | 5.4 | 279.0 | 717.4 | 124.4 | 21.7 | 10.6 | 37.6 | 3.5 | 19.8 | 7.9 | ||||
| LF13 | Tio José de Sousa 3 | Cold | Min | 15.4 | 5.1 | - | 275.0 | 410.2 | 81.1 | 19.9 | 2.6 | 32.8 | 3.3 | 18.2 | 6.9 |
| Max | 16.2 | 5.7 | 298.0 | 932.8 | 141.5 | 23.1 | 16.3 | 41.4 | 3.9 | 22.0 | 13.3 | ||||
| Mean | 15.8 | 5.4 | 280.7 | 727.8 | 112.7 | 21.2 | 10.0 | 36.2 | 3.7 | 20.3 | 8.5 | ||||
| Median | 15.7 | 5.2 | 278.0 | 748.6 | 113.5 | 21.3 | 9.6 | 35.8 | 3.6 | 20.1 | 8.0 | ||||
| LF14 | Água do Rêgo | Cold | Min | 15.9 | 5.0 | 0.473 | 283.0 | 509.6 | 107.4 | 20.2 | 2.9 | 34.8 | 3.1 | 19.4 | 7.4 |
| Max | 16.8 | 5.3 | 289.0 | 896.7 | 231.8 | 23.8 | 18.3 | 44.1 | 3.7 | 22.8 | 9.1 | ||||
| Mean | 16.3 | 5.2 | 285.1 | 664.4 | 156.2 | 21.4 | 8.9 | 38.9 | 3.4 | 21.3 | 8.4 | ||||
| Median | 16.2 | 5.2 | 285.0 | 690.2 | 123.2 | 20.6 | 8.6 | 37.8 | 3.6 | 21.4 | 8.6 | ||||
| LF15 | Caldeira dos Inhames | Thermal | Min | 59.8 | 5.4 | 0.192 | 225.0 | 49.4 | 56.7 | 19.2 | 13.4 | 30.6 | 4.2 | 16.7 | 8.6 |
| Max | 63.8 | 6.0 | 274.0 | 131.6 | 175.7 | 60.4 | 32.7 | 39.9 | 6.1 | 19.6 | 16.8 | ||||
| Mean | 61.8 | 5.6 | 255.3 | 87.4 | 104.7 | 34.1 | 23.5 | 33.9 | 4.9 | 18.1 | 11.3 | ||||
| Median | 62.4 | 5.6 | 257.0 | 86.3 | 79.9 | 20.2 | 23.1 | 33.7 | 4.7 | 17.8 | 11.4 | ||||
| LF16 | Caldeira dos Vimes | Cold | Min | 17.5 | 5.2 | 0.250 | 264.0 | 237.6 | 109.8 | 19.2 | 3.8 | 31.4 | 3.4 | 16.9 | 6.8 |
| Max | 24.3 | 5.5 | 270.0 | 467.9 | 162.9 | 53.3 | 15.4 | 40.9 | 4.3 | 21.1 | 14.0 | ||||
| Mean | 20.2 | 5.4 | 268.0 | 332.5 | 135.3 | 28.9 | 11.9 | 35.2 | 3.8 | 19.0 | 9.4 | ||||
| Median | 20.3 | 5.4 | 269.0 | 291.8 | 130.5 | 19.9 | 11.5 | 33.1 | 3.8 | 19.1 | 8.4 | ||||
| LF17 | Caldeira do Esguicho | Hyperthermal | Min | 93.1 | 7.5 | −0.152 | 1574.0 | 23.9 | 630.7 | 42.6 | 10.6 | 345.4 | 0.2 | 18.1 | 1.6 |
| Max | 96.5 | 7.9 | 1686.0 | 65.1 | 805.8 | 220.1 | 38.4 | 440.4 | 3.3 | 58.5 | 5.5 | ||||
| Mean | 95.4 | 7.6 | 1631.6 | 41.3 | 696.5 | 127.7 | 21.3 | 371.5 | 1.6 | 28.8 | 3.0 | ||||
| Median | 95.6 | 7.7 | 1628.0 | 35.8 | 672.8 | 141.3 | 19.2 | 359.4 | 1.4 | 20.0 | 2.6 | ||||
| LF18 | Caldeira Asmodeu | Hyperthermal | Min | 88.8 | 7.1 | −0.192 | 2180.0 | 25.8 | 546.6 | 237.9 | 21.1 | 458.6 | 0.2 | 21.1 | 1.2 |
| Max | 92.6 | 7.3 | 2350.0 | 76.6 | 690.5 | 305.3 | 92.2 | 593.4 | 0.9 | 25.2 | 30.9 | ||||
| Mean | 90.8 | 7.2 | 2245.7 | 52.2 | 637.2 | 270.4 | 65.6 | 514.3 | 0.4 | 23.2 | 6.0 | ||||
| Median | 91.3 | 7.2 | 2220.0 | 50.7 | 639.3 | 266.3 | 67.2 | 508.4 | 0.2 | 23.4 | 1.6 | ||||
| LF19 | Caldeira Grande | Hyperthermal | Min | 84.7 | 7.3 | −0.176 | 1767.0 | 1.7 | 610.6 | 30.9 | 6.7 | 428.9 | 0.1 | 19.2 | 1.6 |
| Max | 96.3 | 8.2 | 2050.0 | 41.4 | 868.0 | 312.4 | 84.5 | 538.4 | 0.6 | 22.4 | 13.5 | ||||
| Mean | 89.5 | 7.9 | 1965.6 | 22.1 | 745.2 | 253.8 | 32.5 | 458.6 | 0.3 | 20.2 | 3.5 | ||||
| Median | 88.7 | 8.0 | 1989.0 | 23.1 | 749.7 | 287.6 | 23.1 | 442.6 | 0.2 | 19.9 | 1.9 | ||||
| LF20 | Água Padre José | Thermal | Min | 61.6 | 5.9 | 0.123 | 694.0 | 82.0 | 303.8 | 32.3 | 5.8 | 108.0 | 5.1 | 36.5 | 13.3 |
| Max | 62.8 | 6.3 | 729.0 | 195.6 | 503.3 | 67.5 | 38.4 | 132.3 | 5.9 | 42.5 | 15.7 | ||||
| Mean | 62.3 | 6.1 | 714.0 | 153.0 | 379.6 | 39.2 | 20.3 | 121.6 | 5.5 | 40.2 | 14.7 | ||||
| Median | 62.3 | 6.0 | 716.0 | 161.0 | 357.5 | 34.4 | 17.3 | 122.3 | 5.5 | 40.8 | 14.8 | ||||
| LF21 | Poça da Dona Beija | Thermal | Min | 38.3 | 5.7 | 0.119 | 418.0 | 122.6 | 196.4 | 61.8 | 3.8 | 70.6 | 5.9 | 15.7 | 11.2 |
| Max | 40.2 | 6.0 | 542.0 | 360.0 | 224.5 | 85.2 | 30.7 | 83.1 | 6.4 | 17.8 | 12.4 | ||||
| Mean | 38.9 | 5.8 | 501.3 | 243.7 | 206.2 | 67.5 | 11.8 | 75.0 | 6.2 | 16.8 | 11.7 | ||||
| Median | 38.6 | 5.8 | 526.0 | 256.5 | 201.3 | 63.9 | 7.7 | 75.3 | 6.3 | 16.7 | 11.7 | ||||
| LF22 | Dr. Bruno | Cold | Min | 17.7 | 6.0 | 0.428 | 375.0 | 185.3 | 218.0 | 25.9 | 0.6 | 58.4 | 7.5 | 16.9 | 17.1 |
| Max | 21.5 | 6.3 | 430.0 | 236.5 | 332.5 | 29.8 | 8.6 | 68.5 | 9.7 | 21.2 | 21.9 | ||||
| Mean | 19.8 | 6.1 | 401.9 | 212.4 | 261.2 | 27.6 | 5.7 | 63.8 | 8.4 | 19.0 | 19.4 | ||||
| Median | 19.7 | 6.1 | 405.0 | 221.2 | 248.9 | 26.6 | 7.7 | 62.4 | 8.0 | 19.0 | 19.3 | ||||
| LF23 | Banhos Férreos I | Thermal | Min | 37.2 | 6.2 | 0.222 | 1576.0 | 312.1 | 880.8 | 55.4 | 5.8 | 258.5 | 34.0 | 43.4 | 49.4 |
| Max | 38.6 | 6.3 | 1588.0 | 439.1 | 1213.3 | 58.6 | 61.5 | 298.1 | 39.7 | 50.8 | 57.1 | ||||
| Mean | 37.5 | 6.2 | 1581.8 | 363.6 | 1074.7 | 56.7 | 21.1 | 275.9 | 36.2 | 46.8 | 53.0 | ||||
| Median | 37.2 | 6.2 | 1582.0 | 347.0 | 1146.0 | 56.8 | 11.5 | 276.4 | 36.0 | 46.5 | 53.3 | ||||
| LF24 | Banhos Férreos II | Thermal | Min | 32.6 | 6.5 | - | 1449.0 | 220.5 | 1011.4 | 81.7 | 46.1 | 264.7 | 35.3 | 48.5 | 56.2 |
| Max | 32.6 | 6.5 | 1449.0 | 220.5 | 1011.4 | 81.7 | 46.1 | 264.7 | 35.3 | 48.5 | 56.2 | ||||
| Mean | 32.6 | 6.5 | 1449.0 | 220.5 | 1011.4 | 81.7 | 46.1 | 264.7 | 35.3 | 48.5 | 56.2 | ||||
| Median | 32.6 | 6.5 | 1449.0 | 220.5 | 1011.4 | 81.7 | 46.1 | 264.7 | 35.3 | 48.5 | 56.2 | ||||
| LF25 | Banhos Férreos III | Thermal | Min | 32.2 | 6.1 | - | 1410.0 | 118.3 | 823.5 | 50.4 | 6.1 | 250.6 | 30.4 | 41.4 | 46.3 |
| Max | 37.0 | 6.7 | 1513.0 | 489.2 | 1099.2 | 57.9 | 9.6 | 274.5 | 32.7 | 47.4 | 56.4 | ||||
| Mean | 33.6 | 6.4 | 1449.3 | 249.6 | 945.8 | 54.2 | 7.8 | 260.6 | 31.8 | 43.3 | 50.1 | ||||
| Median | 32.6 | 6.4 | 1437.0 | 195.4 | 930.3 | 54.3 | 7.7 | 258.7 | 31.9 | 42.1 | 48.9 | ||||
| LF26 | Água da Camarça | Cold | Min | 14.4 | 5.7 | - | 184.0 | 11.2 | 76.9 | 16.3 | 0.9 | 21.5 | 4.5 | 8.3 | 5.4 |
| Max | 17.0 | 7.2 | 189.0 | 52.3 | 131.8 | 142.0 | 7.7 | 295.8 | 17.5 | 40.1 | 37.6 | ||||
| Mean | 15.5 | 6.0 | 187.0 | 37.7 | 96.4 | 42.2 | 4.0 | 77.6 | 7.6 | 15.5 | 12.3 | ||||
| Median | 14.7 | 5.8 | 188.0 | 44.6 | 90.3 | 17.4 | 3.8 | 23.6 | 5.2 | 9.5 | 6.1 | ||||
| LF27 | Poça da Tia Silvina | Thermal | Min | 44.0 | 6.2 | 0.243 | 1416.0 | 68.9 | 706.4 | 88.8 | 5.8 | 251.9 | 17.0 | 39.0 | 36.0 |
| Max | 45.2 | 6.5 | 1540.0 | 297.7 | 1032.7 | 134.9 | 23.1 | 314.7 | 19.1 | 44.2 | 40.5 | ||||
| Mean | 44.8 | 6.3 | 1464.7 | 194.2 | 870.6 | 97.5 | 13.2 | 284.7 | 17.9 | 41.5 | 38.1 | ||||
| Median | 45.0 | 6.3 | 1454.0 | 198.8 | 861.3 | 91.9 | 11.5 | 285.2 | 17.9 | 40.7 | 38.2 | ||||
| LF28 | Morangueira | Thermal | Min | 29.5 | 6.2 | - | 1611.0 | 44.0 | 23.1 | 92.3 | 7.7 | 298.8 | 19.3 | 43.7 | 40.8 |
| Max | 35.7 | 6.9 | 1635.0 | 363.9 | 1051.0 | 131.4 | 23.1 | 348.6 | 20.7 | 49.1 | 46.3 | ||||
| Mean | 32.2 | 6.4 | 1620.6 | 248.7 | 783.1 | 99.7 | 12.6 | 323.4 | 20.1 | 46.2 | 43.4 | ||||
| Median | 31.9 | 6.4 | 1615.0 | 291.1 | 876.0 | 95.5 | 11.5 | 323.1 | 20.2 | 46.0 | 43.2 | ||||
| LF29 | Quenturas I | Cold | Min | 15.5 | 5.8 | 0.890 | 194.0 | 22.6 | 92.1 | 17.8 | 3.8 | 19.6 | 3.8 | 8.8 | 4.4 |
| Max | 17.2 | 7.0 | 212.0 | 89.5 | 257.4 | 40.5 | 10.6 | 28.4 | 5.5 | 13.3 | 17.5 | ||||
| Mean | 16.3 | 6.2 | 204.4 | 57.1 | 166.8 | 21.8 | 6.3 | 25.2 | 5.0 | 11.6 | 7.2 | ||||
| Median | 16.1 | 6.0 | 205.0 | 50.2 | 126.9 | 18.8 | 5.8 | 25.9 | 5.2 | 12.3 | 5.7 | ||||
| LF30 | Quenturas II | Thermal | Min | 56.4 | 6.3 | 0.148 | 1294.0 | 124.6 | 681.4 | 66.7 | 7.6 | 98.0 | 5.5 | 17.5 | 12.0 |
| Max | 58.1 | 6.5 | 1353.0 | 309.9 | 840.0 | 77.7 | 141.2 | 257.7 | 15.2 | 51.6 | 36.3 | ||||
| Mean | 57.2 | 6.4 | 1311.7 | 187.7 | 736.5 | 74.4 | 31.7 | 223.5 | 13.5 | 44.1 | 28.9 | ||||
| Median | 57.3 | 6.4 | 1308.0 | 191.1 | 703.3 | 74.6 | 15.4 | 240.9 | 14.9 | 47.6 | 30.2 | ||||
| LF31 | Quenturas III | Thermal | Min | 56.7 | 6.3 | 0.123 | 1310.0 | 137.2 | 14.6 | 73.5 | 5.8 | 90.5 | 5.0 | 16.2 | 11.2 |
| Max | 58.2 | 6.8 | 1348.0 | 251.6 | 818.0 | 78.1 | 30.7 | 263.7 | 15.6 | 52.5 | 33.1 | ||||
| Mean | 57.5 | 6.4 | 1322.9 | 192.3 | 659.8 | 75.9 | 15.0 | 224.8 | 13.6 | 44.1 | 28.3 | ||||
| Median | 57.5 | 6.3 | 1316.0 | 187.5 | 744.8 | 76.3 | 15.4 | 246.1 | 14.8 | 47.1 | 30.4 | ||||
| LF32 | Grutinha I | Thermal | Min | 39.8 | 6.1 | 0.179 | 1474.0 | 36.6 | 766.8 | 85.6 | 5.8 | 276.2 | 14.9 | 35.1 | 31.1 |
| Max | 45.4 | 6.5 | 1490.0 | 474.5 | 889.4 | 90.2 | 15.4 | 327.1 | 16.9 | 40.3 | 49.2 | ||||
| Mean | 41.0 | 6.2 | 1483.7 | 330.9 | 833.3 | 88.2 | 11.8 | 301.0 | 15.8 | 37.3 | 34.9 | ||||
| Median | 40.5 | 6.2 | 1486.0 | 369.8 | 836.3 | 88.0 | 11.5 | 300.5 | 15.8 | 37.1 | 32.6 | ||||
| LF33 | Grutinha II | Thermal | Min | 40.5 | 6.0 | 0.176 | 1196.0 | 147.2 | 729.6 | 76.0 | 5.8 | 225.2 | 12.1 | 33.4 | 26.1 |
| Max | 43.9 | 6.4 | 1468.0 | 438.5 | 819.6 | 89.8 | 24.3 | 294.3 | 14.7 | 39.8 | 30.0 | ||||
| Mean | 41.7 | 6.1 | 1411.9 | 306.7 | 779.7 | 84.5 | 13.3 | 261.2 | 13.8 | 35.9 | 28.8 | ||||
| Median | 40.9 | 6.1 | 1445.0 | 315.7 | 780.2 | 86.6 | 14.9 | 257.9 | 14.0 | 35.6 | 29.2 | ||||
| LF34 | Torno | Thermal | Min | 38.9 | 6.1 | 0.180 | 1390.0 | 110.6 | 370.3 | 89.5 | 5.8 | 252.4 | 13.7 | 30.7 | 27.4 |
| Max | 40.2 | 6.2 | 1421.0 | 476.8 | 870.5 | 93.0 | 19.2 | 306.9 | 15.5 | 34.1 | 30.0 | ||||
| Mean | 39.4 | 6.2 | 1409.7 | 238.0 | 744.3 | 90.8 | 12.8 | 284.0 | 14.5 | 31.9 | 28.7 | ||||
| Median | 39.3 | 6.2 | 1412.0 | 170.5 | 798.5 | 90.5 | 11.5 | 291.6 | 14.4 | 31.3 | 28.4 | ||||
| LF35 | Nostra | Cold | Min | 16.3 | 5.8 | 0.382 | 229.0 | 13.8 | 103.1 | 20.6 | 4.8 | 35.0 | 2.1 | 12.0 | 3.9 |
| Max | 19.1 | 7.2 | 283.0 | 59.8 | 190.3 | 24.9 | 12.5 | 48.8 | 4.4 | 15.5 | 15.6 | ||||
| Mean | 18.0 | 6.5 | 261.5 | 38.0 | 138.5 | 22.7 | 7.5 | 45.2 | 2.9 | 13.6 | 6.6 | ||||
| Median | 18.0 | 6.4 | 264.5 | 38.1 | 126.3 | 22.7 | 7.2 | 46.8 | 2.6 | 13.6 | 4.9 | ||||
| LF36 | Helena | Cold | Min | 14.1 | 5.0 | - | 178.0 | 314.1 | 65.9 | 16.0 | 2.9 | 17.5 | 4.5 | 7.7 | 5.3 |
| Max | 16.1 | 5.6 | 184.0 | 719.1 | 105.5 | 18.8 | 6.7 | 23.1 | 5.3 | 9.0 | 6.8 | ||||
| Mean | 15.2 | 5.3 | 180.8 | 438.8 | 80.8 | 17.2 | 4.6 | 20.1 | 4.8 | 8.3 | 6.3 | ||||
| Median | 15.5 | 5.1 | 181.0 | 399.9 | 78.1 | 17.0 | 3.8 | 20.5 | 4.7 | 8.3 | 6.6 | ||||
| LF37 | Glória Patri | Cold | Min | 14.1 | 6.3 | 0.384 | 199.0 | 9.0 | 84.2 | 17.4 | 3.8 | 21.7 | 4.1 | 9.7 | 4.8 |
| Max | 14.8 | 7.5 | 219.0 | 99.3 | 100.0 | 20.6 | 6.7 | 26.4 | 5.5 | 12.9 | 6.3 | ||||
| Mean | 14.5 | 6.8 | 206.6 | 27.0 | 92.5 | 18.5 | 4.8 | 24.1 | 5.0 | 11.7 | 5.6 | ||||
| Median | 14.5 | 6.7 | 206.0 | 14.0 | 92.7 | 18.1 | 4.8 | 25.0 | 4.9 | 11.6 | 5.7 | ||||
| LF38 | Estrada RQ | Thermal | Min | 45.5 | 6.3 | - | 1398.0 | 61.4 | 576.5 | 150.2 | 8.6 | 117.6 | 10.4 | 15.2 | 36.4 |
| Max | 46.3 | 6.5 | 1404.0 | 109.4 | 747.2 | 155.5 | 13.4 | 208.2 | 18.6 | 28.4 | 70.2 | ||||
| Mean | 45.9 | 6.4 | 1401.0 | 85.4 | 661.8 | 152.8 | 11.0 | 162.9 | 14.5 | 21.8 | 53.3 | ||||
| Median | 45.9 | 6.4 | 1401.0 | 85.4 | 661.8 | 152.8 | 11.0 | 162.9 | 14.5 | 21.8 | 53.3 | ||||
| LF39 | Dizimo | Cold | Min | 13.6 | 6.3 | - | 191.8 | 7.8 | 68.9 | 18.1 | 2.9 | 23.1 | 4.2 | 7.7 | 4.2 |
| Max | 14.6 | 7.2 | 197.5 | 12.7 | 90.9 | 21.7 | 6.7 | 28.8 | 4.9 | 8.7 | 5.1 | ||||
| Mean | 14.3 | 6.6 | 194.3 | 11.2 | 83.7 | 19.8 | 4.8 | 26.1 | 4.4 | 8.2 | 4.6 | ||||
| Median | 14.4 | 6.5 | 194.9 | 11.7 | 87.5 | 19.9 | 4.8 | 26.2 | 4.3 | 8.2 | 4.5 | ||||
| CLag | Soil water, Furnas Lake | Interstitial water | 19.9 | 5.9 | - | 84.3 | - | - | 5.3 | 1.8 | 8.6 | 0.4 | 20.0 | 0.6 | |
| CFut | Soil water, football field | Interstitial water | 22.1 | 6.6 | - | 103.2 | - | - | 6.8 | - | 8.5 | 0.6 | 7.7 | 2.5 | |
| Ref. | Name | Stat. | Li | Be | B | Al | P | V | Mn | Fe | Ni | Zn | As | Rb | Sr | Mo | Sb | Ba | W | Pb |
|---|---|---|---|---|---|---|---|---|---|---|---|---|---|---|---|---|---|---|---|---|
| µg·L−1 | ||||||||||||||||||||
| Detection Limits | 0.5 | 0.5 | 10 | 5.0 | 25 | 0.1 | 0.1 | 3 | 0.1 | 1 | 0.25 | 0.1 | 0.1 | 0.05 | 0.02 | 0.1 | 0.01 | 0.1 | ||
| LF1 | Caldeira da Lagoa das Furnas | Min | 29.8 | 0.9 | 183.2 | 88.7 | 79.4 | 0.5 | 208.8 | 281.0 | 0.5 | 16.8 | 2.1 | 139.0 | 46.2 | 3.0 | 0.6 | 25.3 | 0.1 | 0.3 |
| Max | 125.0 | 2.9 | 261.7 | 2674.6 | 422.8 | 4.3 | 486.2 | 3735.3 | 1.3 | 69.5 | 7.7 | 195.5 | 79.8 | 11.6 | 1.6 | 49.0 | 2.0 | 0.9 | ||
| Mean | 87.6 | 2.0 | 221.2 | 1025.6 | 169.4 | 1.6 | 322.6 | 1928.4 | 0.9 | 33.9 | 3.5 | 177.8 | 57.7 | 5.5 | 1.0 | 37.8 | 0.6 | 0.5 | ||
| Median | 105.4 | 2.0 | 217.7 | 673.1 | 121.4 | 1.6 | 284.9 | 1679.1 | 1.0 | 28.0 | 2.4 | 185.6 | 55.0 | 3.7 | 0.9 | 39.2 | 0.2 | 0.4 | ||
| LF2 | Nascente da Ponte | Min | 14.4 | 2.7 | 19.4 | 526.6 | 93.3 | 0.1 | 796.7 | 5216.1 | 2.2 | 19.7 | 1.6 | 48.2 | 22.8 | 8.5 | 0.0 | 1.3 | 0.2 | 0.2 |
| Max | 18.3 | 5.1 | 33.4 | 1026.6 | 153.8 | 1.8 | 1031.5 | 8449.6 | 2.7 | 37.3 | 2.2 | 52.1 | 65.9 | 10.8 | 0.1 | 1160.7 | 0.2 | 3.0 | ||
| Mean | 16.7 | 3.6 | 29.4 | 688.4 | 115.7 | 0.5 | 873.0 | 5891.6 | 2.3 | 28.6 | 1.9 | 49.5 | 29.9 | 9.3 | 0.0 | 193.7 | 0.2 | 1.2 | ||
| Median | 17.3 | 3.6 | 30.1 | 591.4 | 114.8 | 0.2 | 850.9 | 5503.0 | 2.3 | 26.8 | 2.0 | 49.1 | 24.1 | 9.2 | 0.0 | 8.2 | 0.2 | 0.7 | ||
| LF3 | Miguel Henrique | Min | 14.4 | 2.7 | 20.7 | 539.3 | 91.1 | 0.1 | 827.5 | 5341.3 | 2.1 | 19.5 | 1.6 | 48.4 | 23.5 | 8.7 | 0.0 | 2.0 | 0.2 | 0.2 |
| Max | 18.3 | 5.3 | 32.2 | 1081.2 | 118.6 | 0.7 | 904.8 | 7296.9 | 2.9 | 37.9 | 2.7 | 52.1 | 25.7 | 9.9 | 0.8 | 41.1 | 0.3 | 10.5 | ||
| Mean | 15.9 | 3.5 | 26.5 | 662.8 | 109.2 | 0.3 | 855.2 | 5941.9 | 2.4 | 27.6 | 2.0 | 50.4 | 24.4 | 9.2 | 0.2 | 11.5 | 0.2 | 2.0 | ||
| Median | 16.1 | 3.3 | 26.5 | 584.4 | 112.5 | 0.2 | 845.0 | 5598.7 | 2.4 | 26.5 | 1.9 | 49.8 | 24.3 | 9.2 | 0.0 | 5.2 | 0.2 | 0.6 | ||
| LF4 | Água da Prata | Min | 8.4 | 2.2 | 14.9 | 755.2 | 61.7 | 0.1 | 536.0 | 3511.1 | 3.4 | 8.3 | 0.8 | 40.8 | 23.0 | 3.6 | 0.0 | 2.5 | 0.0 | 0.2 |
| Max | 12.3 | 8.6 | 28.8 | 1660.4 | 99.4 | 0.5 | 723.7 | 4497.3 | 4.6 | 43.3 | 1.5 | 44.2 | 28.5 | 5.8 | 0.0 | 136.2 | 0.2 | 3.1 | ||
| Mean | 10.0 | 3.9 | 22.9 | 999.6 | 78.0 | 0.3 | 610.6 | 3788.2 | 3.9 | 18.5 | 1.2 | 42.7 | 25.4 | 4.8 | 0.0 | 29.5 | 0.1 | 0.8 | ||
| Median | 10.2 | 3.2 | 24.1 | 891.8 | 76.4 | 0.3 | 577.8 | 3709.2 | 3.8 | 11.2 | 1.3 | 42.4 | 25.4 | 4.8 | 0.0 | 7.8 | 0.0 | 0.4 | ||
| LF5 | Caldeirão | Min | 33.1 | 1.5 | 755.1 | 104.0 | 144.4 | 0.1 | 922.7 | 304.9 | 0.2 | 2.8 | 18.3 | 63.7 | 24.0 | 0.1 | 0.1 | 3.1 | 3.2 | 0.3 |
| Max | 40.8 | 3.2 | 911.4 | 800.1 | 263.5 | 0.5 | 1145.4 | 1563.1 | 0.7 | 43.9 | 27.3 | 68.4 | 27.3 | 0.3 | 0.7 | 125.7 | 4.4 | 0.9 | ||
| Mean | 38.7 | 2.3 | 843.1 | 249.8 | 199.7 | 0.2 | 1003.8 | 794.8 | 0.5 | 17.4 | 22.5 | 65.4 | 25.8 | 0.2 | 0.3 | 41.0 | 4.0 | 0.6 | ||
| Median | 40.0 | 2.5 | 841.9 | 176.4 | 196.4 | 0.2 | 943.1 | 600.6 | 0.5 | 13.4 | 22.5 | 65.2 | 25.3 | 0.2 | 0.2 | 30.3 | 4.2 | 0.5 | ||
| LF6 | Água da Prata 2 | Min | 6.9 | 2.3 | 24.1 | 802.9 | 112.9 | 0.1 | 563.3 | 5129.9 | 0.6 | 13.8 | 1.2 | 32.8 | 21.2 | 1.3 | 0.0 | 3.5 | 0.0 | 0.3 |
| Max | 9.2 | 5.4 | 34.6 | 1200.3 | 166.7 | 0.6 | 805.6 | 6706.0 | 1.9 | 43.6 | 2.1 | 35.8 | 23.9 | 1.9 | 0.5 | 87.4 | 0.3 | 2.2 | ||
| Mean | 7.8 | 3.7 | 28.4 | 971.4 | 136.4 | 0.4 | 663.2 | 5435.4 | 1.0 | 27.7 | 1.5 | 34.4 | 22.2 | 1.4 | 0.2 | 18.8 | 0.1 | 0.9 | ||
| Median | 7.5 | 3.2 | 28.3 | 919.8 | 127.3 | 0.3 | 649.1 | 5231.5 | 1.0 | 27.7 | 1.5 | 34.3 | 21.5 | 1.3 | 0.0 | 8.0 | 0.1 | 0.7 | ||
| LF7 | Azeda do Rebentão | Min | 6.6 | 2.1 | 17.8 | 721.1 | 135.1 | 0.2 | 539.8 | 5166.8 | 0.5 | 17.0 | 1.5 | 32.2 | 20.4 | 1.7 | 0.0 | 4.5 | 0.0 | 0.2 |
| Max | 8.7 | 3.0 | 26.7 | 871.9 | 181.9 | 1.4 | 636.7 | 6073.6 | 1.5 | 29.1 | 7.7 | 35.0 | 22.7 | 2.0 | 0.3 | 18.1 | 0.7 | 1.0 | ||
| Mean | 7.5 | 2.6 | 23.9 | 785.6 | 156.3 | 0.6 | 582.9 | 5587.8 | 0.8 | 23.4 | 2.5 | 33.4 | 21.4 | 1.8 | 0.1 | 8.1 | 0.2 | 0.7 | ||
| Median | 7.3 | 2.7 | 25.6 | 764.1 | 157.9 | 0.7 | 581.1 | 5595.3 | 0.7 | 23.9 | 1.6 | 33.1 | 21.1 | 1.8 | 0.0 | 7.3 | 0.0 | 0.7 | ||
| LF8 | Água Santa | Min | 63.2 | 0.9 | 2435.5 | 99.3 | 27.1 | 0.1 | 92.8 | 81.7 | 0.4 | 4.4 | 102.8 | 96.1 | 9.7 | 1.1 | 3.2 | 10.1 | 12.5 | 0.3 |
| Max | 84.2 | 2.8 | 3328.8 | 827.3 | 74.4 | 0.9 | 367.1 | 1440.4 | 0.8 | 41.9 | 157.9 | 117.1 | 14.7 | 2.2 | 5.6 | 199.0 | 16.4 | 1.1 | ||
| Mean | 72.6 | 2.0 | 2851.6 | 336.3 | 38.5 | 0.5 | 195.8 | 463.9 | 0.5 | 19.1 | 127.9 | 106.6 | 12.3 | 1.5 | 4.3 | 45.1 | 14.9 | 0.6 | ||
| Median | 72.6 | 2.2 | 2827.1 | 302.5 | 31.0 | 0.5 | 197.1 | 271.4 | 0.5 | 14.3 | 123.2 | 109.4 | 11.9 | 1.3 | 4.3 | 13.6 | 15.1 | 0.7 | ||
| LF9 | Água da Prata 3 | Min | 7.6 | 2.3 | 25.5 | 761.9 | 62.5 | 0.2 | 591.4 | 2038.6 | 1.2 | 6.5 | 0.3 | 37.5 | 21.9 | 0.3 | 0.0 | 2.0 | 0.1 | 0.3 |
| Max | 11.5 | 4.0 | 68.8 | 890.5 | 81.8 | 0.3 | 761.7 | 2775.9 | 2.4 | 24.2 | 0.8 | 41.3 | 25.7 | 0.6 | 0.1 | 95.1 | 0.1 | 1.1 | ||
| Mean | 9.9 | 3.1 | 49.3 | 821.5 | 70.6 | 0.2 | 657.6 | 2357.6 | 1.8 | 13.6 | 0.4 | 39.2 | 24.1 | 0.5 | 0.0 | 17.4 | 0.1 | 0.6 | ||
| Median | 10.1 | 3.0 | 59.4 | 823.5 | 72.8 | 0.2 | 632.7 | 2339.2 | 1.8 | 10.8 | 0.3 | 39.3 | 24.1 | 0.5 | 0.0 | 5.3 | 0.1 | 0.4 | ||
| LF10 | Azeda | Min | 6.0 | 2.1 | 17.9 | 711.0 | 113.6 | 0.1 | 585.8 | 4823.4 | 0.4 | 19.4 | 0.8 | 39.0 | 22.4 | 0.5 | 0.0 | 3.0 | 0.0 | 0.4 |
| Max | 8.3 | 3.2 | 36.7 | 933.7 | 144.9 | 1.0 | 752.0 | 6925.8 | 2.1 | 43.3 | 1.2 | 42.6 | 25.9 | 1.8 | 0.1 | 67.5 | 0.2 | 1.8 | ||
| Mean | 6.9 | 2.6 | 30.7 | 814.9 | 131.5 | 0.3 | 662.6 | 5761.6 | 1.3 | 31.5 | 0.9 | 40.7 | 23.7 | 0.8 | 0.1 | 19.2 | 0.1 | 0.8 | ||
| Median | 6.9 | 2.6 | 33.9 | 836.7 | 132.6 | 0.2 | 614.7 | 5617.9 | 1.1 | 33.3 | 0.8 | 41.1 | 23.1 | 0.6 | 0.0 | 9.9 | 0.1 | 0.7 | ||
| LF11 | Tio José de Sousa 1 | Min | 5.8 | 1.8 | 24.7 | 568.8 | 27.4 | 0.1 | 526.8 | 30.3 | 2.1 | 34.7 | 0.3 | 40.5 | 16.0 | 2.5 | 0.1 | 4.1 | 0.0 | 0.1 |
| Max | 8.4 | 6.1 | 47.0 | 806.3 | 44.3 | 0.5 | 752.1 | 609.3 | 3.2 | 65.8 | 2.3 | 44.1 | 17.7 | 4.3 | 0.1 | 22.3 | 0.1 | 1.1 | ||
| Mean | 7.2 | 2.8 | 36.0 | 665.6 | 36.3 | 0.2 | 609.9 | 239.2 | 2.6 | 45.2 | 0.7 | 42.0 | 16.8 | 3.7 | 0.1 | 7.9 | 0.0 | 0.5 | ||
| Median | 7.5 | 2.1 | 38.0 | 640.1 | 36.7 | 0.2 | 600.3 | 158.7 | 2.5 | 43.0 | 0.4 | 42.0 | 16.5 | 4.0 | 0.1 | 5.5 | 0.0 | 0.4 | ||
| LF12 | Tio José de Sousa 2 | Min | 5.7 | 2.1 | 24.2 | 725.5 | 29.9 | 0.1 | 482.2 | 1495.6 | 0.3 | 14.3 | 0.3 | 38.0 | 19.1 | 1.7 | 0.0 | 2.9 | 0.0 | 0.1 |
| Max | 7.6 | 3.2 | 30.4 | 953.6 | 69.0 | 0.6 | 676.5 | 4144.6 | 1.6 | 35.0 | 1.2 | 41.9 | 21.2 | 2.7 | 0.5 | 46.4 | 0.2 | 1.9 | ||
| Mean | 6.5 | 2.7 | 27.3 | 820.5 | 46.5 | 0.3 | 535.4 | 2641.9 | 0.8 | 24.1 | 0.6 | 39.7 | 20.4 | 2.2 | 0.2 | 18.3 | 0.1 | 0.6 | ||
| Median | 6.4 | 2.7 | 27.1 | 813.2 | 43.6 | 0.1 | 494.5 | 2238.0 | 0.7 | 21.5 | 0.6 | 39.5 | 20.5 | 2.2 | 0.1 | 13.9 | 0.0 | 0.5 | ||
| LF13 | Tio José de Sousa 3 | Min | 6.4 | 1.8 | 21.3 | 736.1 | 49.5 | 0.1 | 490.9 | 3245.0 | 0.4 | 14.1 | 1.4 | 38.8 | 20.1 | 2.7 | 0.0 | 1.8 | 0.1 | 0.2 |
| Max | 8.3 | 4.4 | 29.8 | 1274.7 | 166.0 | 0.4 | 980.6 | 7831.4 | 2.1 | 36.4 | 2.9 | 40.7 | 26.7 | 4.2 | 0.1 | 12.2 | 0.3 | 4.6 | ||
| Mean | 7.0 | 3.0 | 25.6 | 945.2 | 97.4 | 0.2 | 664.6 | 4776.8 | 1.0 | 23.5 | 2.1 | 40.0 | 21.6 | 3.4 | 0.0 | 7.6 | 0.1 | 1.3 | ||
| Median | 6.8 | 2.6 | 25.8 | 871.1 | 82.9 | 0.2 | 674.2 | 3995.9 | 0.9 | 21.2 | 2.0 | 40.3 | 20.8 | 3.3 | 0.0 | 9.2 | 0.1 | 0.5 | ||
| LF14 | Água do Rêgo | Min | 5.5 | 2.0 | 19.6 | 675.5 | 32.1 | 0.1 | 616.4 | 258.5 | 1.0 | 26.1 | 0.3 | 42.1 | 18.3 | 0.5 | 0.0 | 2.9 | 0.0 | 0.1 |
| Max | 7.8 | 4.1 | 31.8 | 819.1 | 78.5 | 0.4 | 766.4 | 1868.8 | 2.0 | 40.1 | 4.2 | 45.0 | 20.9 | 0.6 | 0.1 | 192.7 | 0.1 | 0.6 | ||
| Mean | 6.8 | 2.7 | 25.5 | 757.7 | 55.3 | 0.2 | 674.3 | 604.4 | 1.5 | 32.8 | 2.2 | 43.6 | 19.3 | 0.6 | 0.0 | 39.5 | 0.0 | 0.4 | ||
| Median | 7.0 | 2.5 | 23.7 | 764.7 | 55.3 | 0.2 | 668.7 | 424.5 | 1.5 | 31.4 | 2.2 | 43.9 | 19.4 | 0.6 | 0.0 | 11.8 | 0.0 | 0.5 | ||
| LF15 | Caldeira dos Inhames | Min | 6.3 | 1.8 | 14.5 | 175.2 | 29.4 | 0.1 | 728.9 | 1044.3 | 0.5 | 7.5 | 0.6 | 40.4 | 20.9 | 0.2 | 0.0 | 2.5 | 0.0 | 0.2 |
| Max | 9.4 | 4.1 | 98.2 | 593.9 | 92.7 | 0.7 | 1896.7 | 1704.0 | 1.0 | 32.7 | 8.8 | 46.0 | 28.9 | 1.5 | 0.3 | 10.8 | 0.4 | 0.6 | ||
| Mean | 7.2 | 2.9 | 30.5 | 258.9 | 59.2 | 0.3 | 1045.1 | 1436.5 | 0.7 | 13.7 | 2.1 | 43.7 | 24.4 | 0.6 | 0.1 | 7.0 | 0.1 | 0.4 | ||
| Median | 6.8 | 2.8 | 18.3 | 214.0 | 57.4 | 0.2 | 938.0 | 1441.6 | 0.6 | 10.2 | 0.8 | 44.3 | 24.2 | 0.4 | 0.0 | 5.1 | 0.1 | 0.4 | ||
| LF16 | Caldeira dos Vimes | Min | 5.7 | 1.9 | 17.9 | 501.9 | 55.7 | 0.1 | 566.7 | 3898.0 | 1.0 | 16.2 | 0.9 | 40.7 | 20.1 | 1.1 | 0.0 | 2.6 | 0.0 | 0.2 |
| Max | 7.4 | 4.2 | 27.8 | 808.1 | 136.4 | 0.2 | 850.4 | 5555.8 | 3.4 | 40.8 | 3.2 | 44.6 | 27.2 | 2.6 | 0.1 | 41.0 | 0.2 | 1.1 | ||
| Mean | 6.4 | 2.7 | 22.2 | 685.6 | 85.5 | 0.2 | 692.1 | 4514.7 | 1.5 | 29.4 | 1.4 | 42.7 | 22.4 | 1.5 | 0.0 | 13.6 | 0.1 | 0.5 | ||
| Median | 6.2 | 2.5 | 22.0 | 724.0 | 82.4 | 0.2 | 657.8 | 4176.3 | 1.2 | 26.9 | 1.2 | 43.2 | 21.3 | 1.4 | 0.0 | 9.1 | 0.1 | 0.4 | ||
| LF17 | Caldeira do Esguicho | Min | 131.4 | 1.3 | 8146.7 | 152.0 | 36.6 | 0.2 | 24.4 | 36.1 | 0.4 | 7.3 | 510.3 | 155.0 | 1.9 | 3.8 | 14.2 | 3.0 | 11.8 | 0.8 |
| Max | 267.2 | 4.8 | 10,345.5 | 435.6 | 4479.0 | 0.6 | 353.3 | 651.9 | 4.3 | 43.0 | 616.9 | 286.7 | 11.7 | 12.2 | 20.1 | 95.7 | 51.6 | 3.9 | ||
| Mean | 209.3 | 2.6 | 8899.2 | 281.0 | 2726.8 | 0.4 | 145.1 | 232.8 | 1.8 | 23.7 | 542.8 | 190.0 | 5.8 | 9.2 | 17.5 | 31.3 | 42.8 | 1.6 | ||
| Median | 212.2 | 2.1 | 8856.4 | 249.7 | 3664.8 | 0.4 | 39.0 | 177.0 | 1.4 | 23.1 | 534.9 | 161.7 | 4.3 | 9.7 | 18.3 | 30.9 | 48.9 | 1.3 | ||
| LF18 | Caldeira Asmodeu | Min | 162.9 | 2.6 | 11,754.7 | 224.7 | 53.5 | 0.4 | 24.6 | 29.3 | 0.6 | 6.3 | 1116.1 | 192.8 | 17.8 | 11.1 | 40.8 | 4.2 | 66.1 | 0.2 |
| Max | 366.9 | 6.4 | 14,258.4 | 632.3 | 92.7 | 6.9 | 502.3 | 1988.8 | 3.2 | 49.1 | 1297.2 | 214.4 | 54.2 | 12.6 | 49.5 | 59.4 | 73.8 | 2.6 | ||
| Mean | 275.1 | 4.4 | 12,559.3 | 411.8 | 73.1 | 1.5 | 171.4 | 865.3 | 1.2 | 20.0 | 1206.4 | 202.3 | 25.0 | 11.8 | 45.6 | 24.2 | 69.6 | 1.5 | ||
| Median | 275.0 | 3.5 | 12,548.4 | 346.3 | 73.1 | 0.6 | 73.7 | 353.2 | 0.7 | 12.4 | 1213.9 | 200.2 | 21.2 | 11.5 | 45.2 | 17.5 | 68.2 | 1.3 | ||
| LF19 | Caldeira Grande | Min | 140.7 | 2.6 | 13,733.0 | 162.2 | 69.6 | 0.7 | 21.4 | 34.6 | 0.5 | 7.1 | 1468.3 | 184.0 | 23.1 | 10.8 | 51.0 | 3.5 | 77.3 | 0.5 |
| Max | 300.4 | 4.4 | 16,860.1 | 314.4 | 69.6 | 2.2 | 337.6 | 781.7 | 1.1 | 27.0 | 1713.9 | 198.0 | 32.5 | 31.9 | 58.9 | 24.4 | 87.1 | 2.6 | ||
| Mean | 243.0 | 3.7 | 14,558.2 | 230.4 | 69.6 | 1.1 | 88.5 | 299.1 | 0.8 | 16.0 | 1589.0 | 191.7 | 25.4 | 16.1 | 54.3 | 15.0 | 82.9 | 1.5 | ||
| Median | 246.1 | 3.8 | 14,358.3 | 231.8 | 69.6 | 0.8 | 51.6 | 294.7 | 0.9 | 15.8 | 1580.3 | 191.9 | 24.7 | 12.8 | 53.1 | 16.5 | 83.7 | 1.4 | ||
| LF20 | Água Padre José | Min | 56.4 | 3.4 | 331.9 | 21.9 | 226.2 | 0.1 | 1224.5 | 2794.1 | 0.3 | 5.0 | 1.9 | 93.1 | 24.3 | 1.6 | 0.1 | 10.7 | 2.8 | 0.3 |
| Max | 66.5 | 6.7 | 548.7 | 348.9 | 271.3 | 1.5 | 1753.5 | 4150.8 | 0.6 | 12.1 | 5.1 | 98.9 | 26.8 | 3.2 | 0.1 | 21.8 | 3.3 | 0.8 | ||
| Mean | 60.7 | 4.9 | 413.3 | 130.1 | 247.8 | 0.5 | 1407.3 | 3393.6 | 0.5 | 8.7 | 3.0 | 95.8 | 25.4 | 2.1 | 0.1 | 14.9 | 3.0 | 0.5 | ||
| Median | 61.9 | 4.8 | 415.7 | 67.5 | 246.6 | 0.3 | 1378.8 | 3348.9 | 0.5 | 9.9 | 2.9 | 95.5 | 25.3 | 1.8 | 0.1 | 14.2 | 2.9 | 0.5 | ||
| LF21 | Poça da Dona Beija | Min | 36.3 | 1.7 | 187.0 | 14.5 | 62.9 | 0.1 | 851.0 | 8352.0 | 0.3 | 4.3 | 26.2 | 50.3 | 34.1 | 2.3 | 0.0 | 5.3 | 0.2 | 0.3 |
| Max | 47.7 | 2.8 | 253.3 | 188.8 | 170.2 | 7.7 | 966.8 | 11,434.9 | 1.9 | 25.4 | 41.3 | 53.9 | 37.2 | 6.2 | 0.1 | 106.1 | 0.8 | 0.9 | ||
| Mean | 40.3 | 2.3 | 211.6 | 113.1 | 136.2 | 1.7 | 901.3 | 10,154.0 | 0.8 | 11.7 | 36.7 | 51.2 | 35.2 | 5.5 | 0.1 | 28.8 | 0.6 | 0.6 | ||
| Median | 39.2 | 2.5 | 207.4 | 124.3 | 147.2 | 0.1 | 894.5 | 10,469.8 | 0.7 | 7.4 | 40.1 | 50.8 | 35.0 | 6.1 | 0.1 | 13.2 | 0.7 | 0.6 | ||
| LF22 | Dr. Bruno/Peideira | Min | 25.1 | 1.6 | 60.1 | 36.3 | 109.7 | 1.0 | 15.4 | 27.8 | 0.4 | 12.9 | 1.3 | 43.6 | 32.4 | 2.0 | 0.1 | 2.7 | 0.0 | 0.2 |
| Max | 30.1 | 6.4 | 114.3 | 1224.5 | 182.0 | 1.3 | 578.1 | 4177.5 | 2.9 | 48.3 | 3.4 | 52.1 | 41.9 | 2.9 | 0.1 | 16.1 | 0.1 | 1.4 | ||
| Mean | 27.1 | 2.8 | 75.0 | 262.2 | 134.8 | 1.1 | 154.4 | 755.1 | 0.9 | 23.6 | 2.0 | 47.6 | 36.4 | 2.6 | 0.1 | 6.3 | 0.1 | 0.5 | ||
| Median | 27.0 | 1.7 | 73.0 | 62.4 | 131.5 | 1.1 | 40.6 | 262.6 | 0.5 | 19.9 | 2.0 | 47.4 | 35.7 | 2.6 | 0.1 | 3.9 | 0.1 | 0.4 | ||
| LF23 | Banhos Férreos I | Min | 141.8 | 4.8 | 237.6 | 25.4 | 45.8 | 0.1 | 539.9 | 43.9 | 0.5 | 8.5 | 10.1 | 101.2 | 88.3 | 8.4 | 0.0 | 7.3 | 0.2 | 0.5 |
| Max | 185.1 | 8.4 | 285.7 | 464.2 | 127.4 | 1.9 | 738.6 | 4803.3 | 1.7 | 35.6 | 13.3 | 109.0 | 92.8 | 8.9 | 0.1 | 20.1 | 0.2 | 1.2 | ||
| Mean | 157.0 | 6.6 | 259.9 | 201.1 | 79.5 | 0.9 | 609.4 | 2020.1 | 0.9 | 18.3 | 11.3 | 105.2 | 90.5 | 8.7 | 0.0 | 14.2 | 0.2 | 0.8 | ||
| Median | 153.4 | 6.9 | 257.2 | 113.9 | 65.2 | 0.7 | 581.8 | 2278.4 | 0.8 | 12.9 | 11.0 | 105.5 | 90.0 | 8.8 | 0.0 | 17.1 | 0.2 | 1.0 | ||
| LF24 | Banhos Férreos II | Min | 136.4 | 5.5 | 244.0 | 146.5 | 226.5 | 1.3 | 553.9 | 1415.5 | 1.7 | 15.2 | 9.0 | 108.5 | 83.3 | 9.6 | 0.0 | 10.2 | 0.2 | 1.3 |
| Max | 136.4 | 5.5 | 244.0 | 146.5 | 226.5 | 1.3 | 553.9 | 1415.5 | 1.7 | 15.2 | 9.0 | 108.5 | 83.3 | 9.6 | 0.0 | 10.2 | 0.2 | 1.3 | ||
| Mean | 136.4 | 5.5 | 244.0 | 146.5 | 226.5 | 1.3 | 553.9 | 1415.5 | 1.7 | 15.2 | 9.0 | 108.5 | 83.3 | 9.6 | 0.0 | 10.2 | 0.2 | 1.3 | ||
| Median | 136.4 | 5.5 | 244.0 | 146.5 | 226.5 | 1.3 | 553.9 | 1415.5 | 1.7 | 15.2 | 9.0 | 108.5 | 83.3 | 9.6 | 0.0 | 10.2 | 0.2 | 1.3 | ||
| LF25 | Banhos Férreos III | Min | 140.9 | 2.0 | 219.2 | 9.9 | 141.1 | 0.1 | 300.9 | 64.2 | 0.2 | 5.6 | 8.5 | 95.2 | 82.3 | 7.7 | 0.0 | 2.3 | 0.1 | 0.4 |
| Max | 162.0 | 8.3 | 288.3 | 327.4 | 316.1 | 2.3 | 616.5 | 5861.1 | 1.0 | 33.4 | 17.9 | 119.7 | 91.9 | 11.3 | 0.1 | 181.1 | 0.3 | 1.4 | ||
| Mean | 150.8 | 6.2 | 249.9 | 99.8 | 242.6 | 0.8 | 460.4 | 3319.8 | 0.5 | 12.8 | 12.8 | 105.4 | 86.8 | 9.5 | 0.1 | 55.5 | 0.2 | 0.7 | ||
| Median | 150.1 | 7.3 | 246.1 | 31.0 | 256.6 | 0.3 | 462.2 | 3677.0 | 0.3 | 6.2 | 12.4 | 103.3 | 86.6 | 9.5 | 0.0 | 19.3 | 0.2 | 0.5 | ||
| LF26 | Camarça | Min | 2.4 | 0.6 | 13.8 | 31.3 | 50.8 | 0.1 | 8.3 | 54.1 | 0.4 | 4.9 | 1.6 | 12.6 | 14.1 | 2.6 | 0.0 | 5.4 | 0.3 | 0.2 |
| Max | 234.5 | 9.5 | 441.5 | 327.5 | 213.0 | 9.5 | 567.4 | 2516.0 | 1.5 | 19.2 | 52.0 | 118.6 | 87.5 | 9.2 | 0.1 | 24.2 | 0.4 | 1.0 | ||
| Mean | 49.6 | 5.0 | 109.0 | 123.2 | 151.9 | 7.1 | 143.5 | 803.7 | 0.8 | 12.8 | 12.0 | 36.0 | 31.2 | 4.4 | 0.1 | 12.2 | 0.4 | 0.6 | ||
| Median | 3.0 | 5.0 | 30.4 | 94.0 | 158.3 | 8.9 | 49.2 | 347.8 | 0.5 | 12.6 | 2.2 | 15.3 | 17.5 | 3.3 | 0.1 | 5.9 | 0.3 | 0.6 | ||
| LF27 | Poça da Tia Silvina | Min | 201.7 | 1.4 | 418.9 | 9.3 | 36.8 | 0.1 | 562.2 | 567.3 | 0.1 | 1.0 | 21.9 | 107.3 | 82.2 | 9.1 | 0.0 | 4.5 | 0.2 | 0.3 |
| Max | 227.9 | 10.1 | 481.3 | 332.4 | 214.8 | 0.5 | 1299.5 | 4175.2 | 1.2 | 38.6 | 63.2 | 130.2 | 99.8 | 10.9 | 0.0 | 230.0 | 0.8 | 1.2 | ||
| Mean | 210.5 | 7.4 | 448.1 | 129.3 | 97.1 | 0.3 | 691.5 | 2486.7 | 0.6 | 14.5 | 45.0 | 116.2 | 89.0 | 9.7 | 0.0 | 42.5 | 0.4 | 0.6 | ||
| Median | 203.8 | 8.3 | 445.5 | 36.3 | 99.4 | 0.3 | 578.1 | 2538.2 | 0.5 | 11.0 | 47.5 | 115.9 | 88.0 | 9.5 | 0.0 | 11.6 | 0.3 | 0.5 | ||
| LF28 | Morangueira | Min | 240.4 | 6.4 | 449.8 | 21.3 | 59.9 | 0.2 | 473.4 | 338.4 | 0.2 | 2.5 | 51.3 | 123.8 | 92.2 | 8.8 | 0.0 | 4.4 | 0.2 | 0.3 |
| Max | 274.2 | 10.4 | 508.1 | 423.3 | 283.8 | 0.2 | 851.2 | 4342.3 | 1.7 | 15.8 | 73.1 | 145.4 | 113.4 | 9.7 | 0.1 | 15.3 | 0.3 | 1.2 | ||
| Mean | 252.7 | 8.6 | 477.2 | 109.2 | 128.1 | 0.2 | 556.9 | 2500.4 | 0.6 | 7.4 | 60.0 | 130.7 | 98.8 | 9.2 | 0.0 | 9.0 | 0.2 | 0.6 | ||
| Median | 246.7 | 9.4 | 477.5 | 49.6 | 89.9 | 0.2 | 513.5 | 2608.5 | 0.5 | 6.9 | 60.0 | 127.6 | 95.8 | 9.2 | 0.0 | 8.9 | 0.2 | 0.5 | ||
| LF29 | Quenturas I | Min | 2.1 | 2.0 | 15.2 | 10.9 | 79.1 | 5.1 | 3.2 | 30.6 | 0.2 | 1.3 | 0.8 | 11.9 | 16.7 | 1.7 | 0.0 | 1.4 | 0.2 | 0.3 |
| Max | 3.8 | 5.0 | 28.0 | 346.1 | 190.3 | 11.2 | 637.7 | 698.3 | 0.6 | 18.8 | 7.1 | 20.2 | 34.4 | 5.6 | 0.2 | 25.9 | 0.8 | 1.0 | ||
| Mean | 2.5 | 3.5 | 22.3 | 110.9 | 144.2 | 8.2 | 128.1 | 312.5 | 0.3 | 9.1 | 2.3 | 16.8 | 24.4 | 3.0 | 0.1 | 8.3 | 0.3 | 0.6 | ||
| Median | 2.3 | 3.5 | 22.3 | 61.3 | 149.4 | 8.8 | 8.7 | 262.9 | 0.3 | 8.9 | 1.5 | 17.0 | 24.2 | 2.7 | 0.1 | 5.1 | 0.3 | 0.6 | ||
| LF30 | Quenturas II | Min | 60.1 | 2.7 | 304.6 | 10.0 | 94.2 | 0.1 | 170.7 | 636.4 | 0.3 | 2.1 | 9.3 | 42.4 | 24.0 | 1.5 | 0.0 | 1.2 | 0.8 | 0.2 |
| Max | 156.6 | 10.5 | 862.0 | 288.3 | 206.8 | 2.4 | 1802.2 | 3582.3 | 2.6 | 86.1 | 24.9 | 140.0 | 82.4 | 5.1 | 0.0 | 41.8 | 2.6 | 1.2 | ||
| Mean | 132.9 | 7.1 | 732.3 | 123.2 | 138.8 | 0.8 | 653.5 | 1229.4 | 0.9 | 25.7 | 21.3 | 113.0 | 65.8 | 4.2 | 0.0 | 14.5 | 2.1 | 0.6 | ||
| Median | 140.8 | 7.6 | 783.4 | 44.4 | 134.9 | 0.3 | 476.1 | 811.9 | 0.6 | 9.5 | 23.7 | 119.7 | 68.8 | 4.6 | 0.0 | 9.2 | 2.2 | 0.5 | ||
| LF31 | Quenturas III | Min | 54.3 | 2.5 | 273.3 | 7.4 | 85.8 | 0.1 | 159.3 | 111.4 | 0.1 | 1.8 | 9.8 | 39.3 | 22.3 | 1.4 | 0.0 | 2.1 | 0.7 | 0.3 |
| Max | 161.0 | 7.5 | 880.8 | 230.0 | 177.1 | 0.6 | 585.7 | 1082.8 | 5.3 | 18.6 | 23.8 | 141.7 | 81.5 | 4.9 | 1.5 | 134.4 | 2.8 | 2.8 | ||
| Mean | 132.5 | 5.7 | 724.4 | 68.1 | 136.0 | 0.3 | 435.7 | 557.3 | 1.0 | 7.8 | 20.3 | 113.7 | 64.9 | 4.2 | 0.3 | 25.7 | 2.0 | 0.9 | ||
| Median | 143.5 | 6.1 | 771.6 | 41.9 | 131.2 | 0.2 | 438.8 | 689.7 | 0.3 | 4.4 | 22.3 | 122.1 | 70.1 | 4.5 | 0.0 | 8.2 | 2.2 | 0.4 | ||
| LF32 | Grutinha I | Min | 193.2 | 10.0 | 410.0 | 105.8 | 114.0 | 0.1 | 809.4 | 4321.7 | 0.2 | 2.8 | 60.7 | 106.2 | 70.4 | 22.2 | 0.0 | 2.2 | 0.4 | 0.2 |
| Max | 228.8 | 13.3 | 466.9 | 397.6 | 286.0 | 0.7 | 1342.6 | 6849.7 | 1.0 | 22.3 | 71.1 | 127.8 | 92.2 | 25.2 | 0.0 | 398.8 | 0.7 | 2.0 | ||
| Mean | 209.2 | 11.7 | 434.7 | 190.0 | 182.0 | 0.3 | 929.5 | 5580.9 | 0.6 | 11.3 | 63.6 | 113.0 | 78.9 | 23.2 | 0.0 | 68.2 | 0.6 | 0.9 | ||
| Median | 209.7 | 11.6 | 429.1 | 149.1 | 172.9 | 0.2 | 852.4 | 5349.6 | 0.7 | 9.3 | 62.1 | 110.7 | 76.4 | 22.9 | 0.0 | 8.0 | 0.6 | 0.7 | ||
| LF33 | Grutinha II | Min | 139.8 | 7.8 | 424.3 | 83.7 | 67.1 | 0.1 | 777.4 | 4741.6 | 0.2 | 3.5 | 41.9 | 96.3 | 62.8 | 14.5 | 0.0 | 1.8 | 0.5 | 0.2 |
| Max | 220.8 | 11.1 | 513.5 | 257.7 | 354.2 | 1.2 | 2032.8 | 6384.8 | 2.5 | 38.4 | 62.1 | 109.7 | 70.2 | 24.7 | 0.1 | 45.8 | 0.8 | 0.9 | ||
| Mean | 180.5 | 9.6 | 455.7 | 149.1 | 187.7 | 0.5 | 1028.0 | 5831.1 | 0.8 | 14.1 | 52.9 | 103.0 | 67.5 | 20.2 | 0.1 | 14.8 | 0.6 | 0.5 | ||
| Median | 193.4 | 9.1 | 444.4 | 146.5 | 173.9 | 0.4 | 873.8 | 5973.1 | 0.5 | 9.0 | 55.2 | 103.9 | 68.6 | 23.9 | 0.1 | 7.7 | 0.7 | 0.4 | ||
| LF34 | Torno | Min | 181.6 | 8.9 | 353.4 | 135.2 | 72.5 | 0.2 | 907.3 | 3116.4 | 0.2 | 2.7 | 51.3 | 101.5 | 58.7 | 26.6 | 0.0 | 2.0 | 0.4 | 0.3 |
| Max | 221.5 | 10.0 | 424.0 | 247.5 | 288.4 | 0.2 | 1013.9 | 7172.1 | 1.1 | 14.5 | 64.4 | 111.9 | 63.3 | 28.4 | 1.0 | 113.0 | 0.6 | 0.8 | ||
| Mean | 195.4 | 9.4 | 391.3 | 167.0 | 141.3 | 0.2 | 961.4 | 5314.6 | 0.5 | 6.9 | 56.8 | 107.0 | 61.1 | 27.6 | 0.4 | 19.8 | 0.5 | 0.5 | ||
| Median | 190.5 | 9.4 | 393.3 | 164.3 | 103.9 | 0.2 | 965.0 | 5604.9 | 0.3 | 5.8 | 57.6 | 107.2 | 62.0 | 27.5 | 0.4 | 5.0 | 0.5 | 0.6 | ||
| LF35 | Nostra | Min | 11.1 | 0.5 | 23.9 | 68.3 | 59.5 | 1.1 | 13.0 | 56.2 | 1.0 | 12.2 | 2.8 | 25.9 | 8.9 | 5.0 | 0.1 | 3.1 | 0.1 | 0.5 |
| Max | 15.1 | 4.6 | 45.7 | 456.7 | 100.6 | 1.7 | 195.6 | 934.7 | 1.5 | 38.9 | 3.4 | 35.1 | 50.5 | 6.8 | 0.2 | 18.8 | 0.2 | 1.0 | ||
| Mean | 14.1 | 1.9 | 35.7 | 234.9 | 78.4 | 1.5 | 75.5 | 276.3 | 1.2 | 22.3 | 3.1 | 30.6 | 17.0 | 5.7 | 0.1 | 7.6 | 0.1 | 0.6 | ||
| Median | 14.6 | 1.4 | 37.6 | 180.2 | 74.5 | 1.6 | 47.4 | 147.2 | 1.1 | 21.0 | 3.1 | 30.6 | 10.4 | 5.6 | 0.1 | 4.8 | 0.1 | 0.5 | ||
| LF36 | Helena | Min | 2.1 | 0.6 | 13.2 | 152.0 | 113.3 | 6.6 | 40.5 | 263.5 | 0.4 | 13.5 | 1.1 | 16.0 | 16.4 | 3.0 | 0.0 | 3.9 | 0.1 | 0.5 |
| Max | 3.6 | 0.9 | 23.7 | 347.7 | 188.5 | 7.7 | 429.7 | 539.5 | 1.0 | 44.0 | 2.1 | 19.3 | 19.5 | 3.7 | 0.2 | 13.6 | 0.5 | 0.8 | ||
| Mean | 3.1 | 0.8 | 18.8 | 230.6 | 157.9 | 7.1 | 176.8 | 392.2 | 0.6 | 22.5 | 1.7 | 17.9 | 17.9 | 3.4 | 0.1 | 8.4 | 0.3 | 0.7 | ||
| Median | 3.4 | 0.9 | 18.9 | 229.2 | 156.3 | 7.2 | 94.0 | 331.6 | 0.6 | 17.4 | 1.5 | 18.0 | 17.7 | 3.4 | 0.1 | 7.1 | 0.3 | 0.8 | ||
| LF37 | Glória Patri | Min | 1.3 | 0.7 | 15.3 | 13.7 | 94.2 | 6.8 | 3.3 | 20.9 | 0.3 | 5.9 | 0.7 | 12.9 | 18.6 | 1.9 | 0.0 | 2.0 | 0.2 | 0.2 |
| Max | 3.2 | 2.1 | 27.7 | 383.7 | 167.7 | 9.5 | 39.8 | 2752.1 | 1.6 | 32.3 | 1.7 | 18.2 | 28.0 | 6.6 | 0.1 | 155.7 | 0.4 | 1.1 | ||
| Mean | 2.1 | 1.2 | 19.2 | 106.2 | 130.6 | 8.5 | 15.1 | 543.7 | 0.6 | 14.0 | 1.0 | 16.6 | 24.6 | 3.1 | 0.1 | 34.3 | 0.3 | 0.5 | ||
| Median | 2.2 | 0.9 | 17.7 | 47.8 | 131.4 | 8.6 | 12.4 | 141.0 | 0.4 | 12.2 | 0.8 | 17.0 | 24.9 | 2.7 | 0.0 | 10.3 | 0.3 | 0.5 | ||
| LF38 | Estrada RQ | Min | 55.3 | 2.7 | 123.1 | 55.8 | 144.9 | 0.1 | 606.5 | 382.6 | 0.4 | 13.9 | 3.2 | 45.3 | 351.5 | 1.3 | 0.0 | 65.6 | 0.1 | 0.5 |
| Max | 94.5 | 6.3 | 206.1 | 72.6 | 144.9 | 0.1 | 1202.8 | 3156.7 | 0.6 | 14.2 | 6.8 | 94.3 | 725.6 | 2.4 | 0.0 | 126.0 | 0.1 | 0.5 | ||
| Mean | 74.9 | 4.5 | 164.6 | 64.2 | 144.9 | 0.1 | 904.6 | 1769.6 | 0.5 | 14.1 | 5.0 | 69.8 | 538.5 | 1.9 | 0.0 | 95.8 | 0.1 | 0.5 | ||
| Median | 74.9 | 4.5 | 164.6 | 64.2 | 144.9 | 0.1 | 904.6 | 1769.6 | 0.5 | 14.1 | 5.0 | 69.8 | 538.5 | 1.9 | 0.0 | 95.8 | 0.1 | 0.5 | ||
| LF39 | Dízimo | Min | 3.6 | 0.6 | 10.4 | 16.1 | 203.3 | 3.9 | 4.1 | 22.6 | 0.4 | 5.6 | 1.4 | 14.3 | 14.3 | 5.9 | 0.0 | 3.1 | 0.1 | 0.3 |
| Max | 4.7 | 0.6 | 22.4 | 165.2 | 226.2 | 4.4 | 23.2 | 1639.9 | 2.5 | 19.1 | 6.1 | 15.6 | 23.2 | 6.6 | 0.2 | 312.5 | 0.3 | 1.4 | ||
| Mean | 4.0 | 0.6 | 16.2 | 71.0 | 214.4 | 4.1 | 9.2 | 500.0 | 1.0 | 13.3 | 2.3 | 15.0 | 16.8 | 6.4 | 0.1 | 64.3 | 0.2 | 0.8 | ||
| Median | 3.8 | 0.6 | 15.7 | 55.1 | 215.3 | 4.2 | 5.7 | 57.5 | 0.7 | 12.9 | 1.5 | 15.0 | 15.8 | 6.5 | 0.0 | 17.6 | 0.1 | 0.8 | ||
| CLag | Soil water, Furnas Lake | 1.86 | 29.8 | 0.9 | 183.2 | 88.7 | 79.4 | 0.5 | 208.8 | 281.0 | 0.5 | 16.8 | 2.1 | 139.0 | 46.2 | 3.0 | 0.6 | 25.3 | 0.1 | |
| CFut | Soil water, football field | 0.55 | 125.0 | 2.9 | 261.7 | 2674.6 | 422.8 | 4.3 | 486.2 | 3735.3 | 1.3 | 69.5 | 7.7 | 195.5 | 79.8 | 11.6 | 1.6 | 49.0 | 2.0 | |
References
- Allard, P. Surveillance géochimique. In Le Volcanisme; Bourdier, J.-L., Ed.; BRGM: Orléans, Franch, 1994; pp. 347–355. (In French) [Google Scholar]
- Inguaggiato, S.; Pecoraino, G.; D’Amore, F. Chemical and isotopical characterisation of fluid manifestations of Ischia Island (Italy). J. Volcanol. Geotherm. Res. 2000, 99, 151–178. [Google Scholar] [CrossRef]
- Varekamp, J.C.; Ouinette, A.; Herman, S.; Bermudez, A.; Delpino, D. Hydrothermal elemental fluxes during the 2000 eruptions of Copahue, Argentina. A bbeehive volcano in turmoilQ. Geology 2001, 29, 1059–1062. [Google Scholar] [CrossRef]
- Tassi, F.; Vaselli, O.; Capaccioni, B.; Macias, J.L.; Nencetti, A.; Montegrossi, G.; Magro, G. Chemical composition of fumarolic gases and spring discharges from El Chichòn volcano, Mexico: Causes and implications of the changes detected over the period 1998–2000. J. Volcanol. Geotherm. Res. 2003, 123, 105–121. [Google Scholar] [CrossRef]
- Shevenell, L.; Goff, F. Addition of magmatic volatiles into the hot spring waters of Loowit Canyon, Mount St. Helens, Washington, USA. Bull. Volcanol. 1993, 35, 489–503. [Google Scholar] [CrossRef]
- Goff, F.; McMurtry, G.M.; Counce, D.; Simac, J.A.; Roldán-Manzo, A.R.; Hilton, D.R. Contrasting hydrothermal activity at Sierra Negra and Alcedo volcanoes, Galapagos Archipelago, Ecuador. Bull. Volcanol. 2000, 62, 34–52. [Google Scholar] [CrossRef]
- Delmelle, P.; Stix, J. Volcanic Gases. In Encyclopedia of Volcanoes, 1st ed.; Sigurdsson, H., Houghton, B., McNutt, S.R., Rymer, H., Stix, J., Eds.; Academic Press: Cambridge, MA, USA, 2000; pp. 803–815. [Google Scholar]
- Hochstein, M.P.; Browne, P.R.L. Encyclopedia of Volcanoes, 1st ed.; Sigurdsson, H., Houghton, B., McNutt, S.R., Rymer, H., Stix, J., Eds.; Academic Press: Cambridge, MA, USA, 2000; pp. 835–855. [Google Scholar]
- Branney, M.; Acocella, V. Calderas. In Encyclopedia of Volcanoes, 1st ed.; Sigurdsson, H., Houghton, B., McNutt, S.R., Rymer, H., Stix, J., Eds.; Academic Press: Cambridge, MA, USA, 2000; pp. 299–315. [Google Scholar]
- Giggenbach, W.F.; Garcia, N.; Londoño, C.A.; Rodriguez, V.L.; Rojas, G.N.; Calvache, V.M.L. The chemistry of fumarolic vapor and thermal-spring discharges from the Nevado del Ruiz volcanic-magmatic hydrothermal system, Colombia. J. Volcanol. Geotherm. Res. 1990, 42, 13–39. [Google Scholar] [CrossRef]
- Giggenbach, W.F. Chemical composition of volcanic gases. In Monitoring and Mitigation of Volcanic Hazards; Scarpa, T., Ed.; Springer: Berlin/Heidelberg, Germany, 1996; pp. 221–256. [Google Scholar]
- Kalacheva, E.; Taran, Y.; Kotenko, T. Geochemistry and solute fluxes of volcano-hydrothermal systems of Shiashkotan, Kuril Islands. J. Volcanol. Geotherm. Res. 2015, 296, 40–54. [Google Scholar] [CrossRef]
- Drever, J.; Stillings, L. The role of organic acids in mineral weathering. Colloids Surf. A Physicochem. Eng. Asp. 1997, 120, 155–167. [Google Scholar] [CrossRef]
- Chiodini, G.; Frondini, F.; Cardellini, C.; Parello, F.; Peruzzi, L. Rate of diffuse carbon dioxide Earth degassing estimated from carbon balance of regional aquifers: The case of central Apennine, Italy. J. Geophys. Res. Solid Earth 2000, 105, 8423–8434. [Google Scholar] [CrossRef]
- Perez-Fodich, A.; Derry, L.A. Organic acids and high soil CO2 drive intense chemical weathering of Hawaiian basalts: Insights from reactive transport models. Geochim. Cosmochim. Acta 2019, 249, 173–198. [Google Scholar] [CrossRef]
- Romero-Mujalli, G.; Hartmann, J.; Hosono, T.; Louvat, P.; Okamura, K.; Delmelle, P.; Amann, T.; Böttcher, M.E. Hydrothermal and magmatic contributions to surface waters in the Aso caldera, Southern Japan: Implications for weathering processes in volcanic áreas. Chem. Geol. 2022, 588, 120612. [Google Scholar] [CrossRef]
- Aiuppa, A.; Allard, P.; D’Alessandro, W.; Michel, A.; Parello, F.; Treuil, M.; Valenza, M. Mobility and fluxes of major, minor and trace metals during basalt weathering and groundwater transport at Mt. Etna volcano (Sicily). Geochim. Cosmochim. Acta 2000, 64, 1827–1841. [Google Scholar] [CrossRef]
- Morell, I.; Pulido-Bosch, A.; Daniele, L.; Cruz, J.V. Chemical and isotopic assessment in volcanic thermal waters: Cases of Ischia (Italy) and São Miguel (Azores, Portugal). Hydrol. Process. 2008, 22, 4386–4399. [Google Scholar] [CrossRef]
- Hem, J.D. Study and Interpretation of the Chemical Characteristics of Natural Water, 3rd ed.; Department of Interior, US Geological Survey Water Supply Paper; US Geological Survey: Reston, VA, USA, 1985; Volume 2254, 255p.
- Miller, J.A. Ground Water Atlas of the United States: Introduction and National Summary; Hydrologic Atlas 730-A, Report; US Geological Survey: Reston, VA, USA, 1999; 15p.
- Nigate, F.; Yenehun, A.; Belay, A.S.; Camp, M.V.; Walraevens, K. Hydrogeochemical processes and groundwater evolution in complex volcanic highlands and alluvio-lacustrine deposits (Upper Blue Nile), Ethiopia. Environ. Sci. Pollut. Res. 2023, 30, 63953–63974. [Google Scholar] [CrossRef]
- D’Alessandro, W.; Calabrese, S.; Bellomo, S.; Brusca, L.; Daskalopoulou, K.; Li Vigni, L.; Randazzo, L.; Kyriakopoulos, K. Impact of hydrothermal alteration processes on element mobility and potential environmental implications at the Sousaki sulfataric field (Corinthia—Greece). J. Volcanol. Geotherm. Res. 2020, 407, 107121. [Google Scholar] [CrossRef]
- Gaillardet, J.; Viers, J.; Dupré, B. Trace elements in river waters. In Treatise on Geochemistry; Drever, J.I., Ed.; Elsevier: Amsterdam, The Netherlands, 2003; Volume 5, pp. 225–272. [Google Scholar]
- Aiuppa, A.; Dongarrà, G.; Capasso, G.; Allard, P. Trace elements on the thermal groundwaters of Culcano Island (Sicily). J. Volcanol. Geotherm. Res. 2000, 98, 1089–1207. [Google Scholar] [CrossRef]
- Calabrese, S.; Randazzo, L.; Daskalopoulou, K.; Milazzo, S.; Scaglione, S.; Vizzini, S.; Tramati, C.D.; D’Alessandro, W.; Brusca, L.; Bellomo, S.; et al. Mount Etna volcano (Italy) as a major “dust” point source in the Mediterranean area. Arab. J. Geosci. 2016, 9, 219. [Google Scholar] [CrossRef]
- Playà, E.; Cendón, D.I.; Travé, A.; Chivas, A.R.; García, A. Non-marine evaporites with both inherited marine and continental signatures: The Gulf of Carpentaria, Australia, at ~70 ka. Sediment. Geol. 2007, 201, 267–285. [Google Scholar] [CrossRef]
- Leybourne, M.I.; Johannesson, K.H. Rare earth elements (REE) and yttrium in stream waters, stream sediments, and Fe–Mn oxyhydroxides: Fractionation, speciation, and controls over REE+ Y patterns in the surface environment. Geochim. Cosmochim. Acta 2008, 72, 5962–5983. [Google Scholar] [CrossRef]
- Johannesson, K.H.; Stetzenbach, K.J.; Hodge, V.F. Rare earth elements as geochemical tracers of regional groundwater mixing. Geochim. Cosmochim. Acta 1997, 61, 3605–3618. [Google Scholar] [CrossRef]
- Dia, A.; Gruau, G.; Olivié-Lauquet, G.; Riou, C.; Molénat, J.; Curmi, P. The distribution of rare earth elements in groundwaters: Assessing the role of source-rock composition, redox changes and colloidal particles. Geochem. Cosmochim. Acta 2000, 64, 4131–4151. [Google Scholar] [CrossRef]
- Möller, P.; Dulski, P.; Bau, M.; Knappe, A.; Pekdeger, A.; Jarmersted, C.S. Anthropogenic gadolinium as a conservative tracer in hydrogeology. J. Geochem. Explor. 2000, 69–70, 409–414. [Google Scholar] [CrossRef]
- Tang, J.; Johannesson, K.H. Rare earth element concentrations, speciation, and fractionation along groundwater flow paths; the Carrizo Sand (Texas) and Upper Floridan aquifers. In Rare Earth Elements in Groundwater Flow Systems; Johannesson, K.J., Ed.; Springer: Berlin/Heidelberg, Germany, 2005; pp. 223–251. [Google Scholar]
- Pereto, C.; Coynel, A.; Lerat-Hardy, A.; Gourves, P.Y.; Schäfer, J.; Baudrimont, M. Corbicula fluminea: A sentinel species for urban Rare Earth Elements origin. Sci. Total Environ. 2020, 732, 138552. [Google Scholar] [CrossRef]
- Shand, P.; Darbyshire, D.P.F.; Love, A.J.; Edmunds, W.M. Sr isotopes in natural waters: Applications to source characterization and water-rock interaction in contrasting landscapes. Appl. Geochem. 2009, 24, 574–586. [Google Scholar] [CrossRef]
- Faure, G. Principles of Isotope Geology, 2nd ed.; John Wiley & Sons: New York, NY, USA, 1986. [Google Scholar]
- Faure, G.; Mensing, T.M. Isotopes, Principles and Applications, 3rd ed.; John Wiley & Sons: Hoboken, NJ, USA, 2005; 897p. [Google Scholar]
- Ishikawa, H.; Ohba, T.; Fujimaki, H. Sr isotope diversity of hot spring and volcanic lake waters from Zao volcano, Japan. J. Volcanol. Geotherm. Res. 2007, 166, 7–16. [Google Scholar] [CrossRef]
- Åberg, G.; Jacks, G.; Hamilton, P.J. Weathering rates and 87Sr/86Sr ratios: An isotopic approach. J. Hydrol. 1989, 109, 65–78. [Google Scholar] [CrossRef]
- Cruz, J.V.; Freire, P.; Costa, A. Mineral waters characterization in the Azores archipelago (Portugal). J. Volcanol. Geotherm. Res. 2010, 190, 353–364. [Google Scholar] [CrossRef]
- Cruz, J.V.; Andrade, C. Natural background groundwater composition in the Azores archipelago (Portugal): A hydrogeochemical study and threshold value determination. Sci. Total Environ. 2015, 520, 127–135. [Google Scholar] [CrossRef]
- Freire, P.; Andrade, C.; Viveiros, F.; Silva, C.; Coutinho, R.; Cruz, J.V. Mineral water occurrence and geochemistry in the Azores volcanic archipelago (Portugal): Insight from an extended database on water chemistry. Environ. Earth Sci. 2015, 73, 2749–2762. [Google Scholar] [CrossRef]
- Woitischek, J.; Dietzel, M.; Inguaggiato, C.; Böttcher, M.E.; Leis, A.; Cruz, J.V.; Gehre, M. Characterization and origin of hydrothermal waters at São Miguel (Azores) inferred by chemical and isotopic composition. J. Volcanol. Geotherm. Res. 2017, 346, 104–107. [Google Scholar] [CrossRef]
- Ferreira, L.; Cruz, J.V.; Viveiros, F.; Durães, N.; Coutinho, R.; Andrade, C.; Santos, J.F.; Acciaioli, M.H. Hydrogeochemistry and strontium isotopic signatures of mineral waters from Furnas and Fogo Volcanoes (São Miguel, Azores). Water 2023, 15, 245. [Google Scholar] [CrossRef]
- Searle, R. Tectonic pattern of the Azores spreading centre and triple junction. Earth Planet. Sci. Lett. 1980, 51, 415–434. [Google Scholar] [CrossRef]
- Gaspar, J.L.; Queiroz, G.; Ferreira, T.; Medeiros, A.R.; Goulart, C.; Medeiros, J. Earthquakes and volcanic eruptions in the Azores region: Geodynamic implications from major historical events and instrumental seismicity. In Volcanic Geology of São Miguel Island (Azores Archipelago); Gaspar, J.L., Guest, J.E., Duncan, A.M., Barriga, F.J.A.S., Chester, D.K., Eds.; Geological Society, London, Memoirs: London, UK, 2015; Volume 44, pp. 33–49. [Google Scholar]
- Guest, J.E.; Gaspar, J.L.; Cole, P.D.; Queiroz, G.; Duncan, A.M.; Wallenstein, N.; Ferreira, T.; Pacheco, J.M. Volcanic geology of Furnas volcano, São Miguel, Azores. J. Volcanol. Geotherm. Res. 1999, 92, 1–29. [Google Scholar] [CrossRef]
- Guest, J.E.; Pacheco, J.M.; Cole, P.D.; Duncan, A.M.; Wallenstein, N.; Queiroz, G.; Gaspar, J.L.; Ferreira, T. The volcanic history of Furnas volcano, São Miguel, Azores. In Volcanic Geology of São Miguel Island (Azores Archipelago); Gaspar, J.L., Guest, J.E., Duncan, A.M., Barriga, F.J.A.S., Chester, D.K., Eds.; Geological Society, London, Memoirs: London, UK, 2015; Volume 44, pp. 125–134. [Google Scholar]
- Andrade, C.; Viveiros, F.; Cruz, J.V.; Coutinho, R.; Silva, C. Estimation of the CO2 flux from Furnas volcanic Lake (São Miguel, Azores). J. Volcanol. Geotherm. Res. 2016, 31, 51–64. [Google Scholar] [CrossRef]
- Carmo, R.; Madeira, J.; Ferreira, T.; Queiroz, G.; Hipólito, A. Volcano-tectonic structures of São Miguel Island, Azores. In Volcanic Geology of São Miguel Island (Azores Archipelago); Gaspar, J.L., Guest, J.E., Duncan, A.M., Barriga, F.J.A.S., Chester, D.K., Eds.; Geological Society, London, Memoirs: London, UK, 2015; Volume 44, pp. 65–86. [Google Scholar]
- Moore, R.B. Volcanic geology and eruption frequency, São Miguel, Azores. Bull. Volcanol. 1990, 52, 602–614. [Google Scholar] [CrossRef]
- Cole, P.D.; Queiroz, G.; Wallenstein, N.; Gaspar, J.L.; Duncan, A.M.; Guest, J.E. An historic subplinian/phreatomagmatic eruption: The 1630 AD eruption of Furnas volcano, São Miguel, Azores. J. Volcanol. Geotherm. Res. 1995, 69, 117–135. [Google Scholar] [CrossRef]
- Jeffery, A.J.; Gertisser, R.; O’Driscoll, B.; Pacheco, J.M.; Whitley, S.; Pimentel, A.; Self, S. Temporal evolution of a post-caldera, mildly peralkaline magmatic system: Furnas volcano, São Miguel, Azores. Contrib. Miner. Pet. 2016, 171, 42. [Google Scholar] [CrossRef]
- Girault, F.; Viveiros, F.; Silva, C.; Thapa, S.; Pacheco, J.E.; Adhikari, L.B.; Bhattarai, M.; Koirala, B.P.; Agrinier, P.; France-Lanord, C.; et al. Radon signature, of CO2 flux constrains at depth of degassing: Furnas volcano (Azores, Portugal) versus Syabru-Bensi (Nepal Himalayas). Sci. Rep. 2022, 12, 10837. [Google Scholar] [CrossRef]
- Viveiros, F.; Cardellini, C.; Ferreira, T.; Caliro, S.; Chiodini, G.; Silva, C. Soil CO2 emissions at Furnas volcano, São Miguel Island, Azores archipelago: Volcano monitoring perspectives, geomorphologic studies, ad land use planning application. J. Geophys. Res. 2010, 115, B12208. [Google Scholar] [CrossRef]
- Caliro, S.; Viveiros, F.; Chiodini, G.; Ferreira, T. Gas geochemistry of hydrothermal fluids of the S. Miguel and Terceira Islands, Azores. Geochim. Cosmochim. Acta 2015, 168, 43–57. [Google Scholar] [CrossRef]
- Matias, D.; Antlauf, M.; Viveiros, F.; Moreno, L.; Silva, C.; Oliveira, S. Monitoring hydrothermal fumaroles in the Azores archipelago—Applications and sources of analytical uncertainties. J. Volcanol. Geotherm. Res. 2024, 450, 108076. [Google Scholar] [CrossRef]
- Hogg, C.; Kiyan, D.; Rath, V.; Byrdina, S.; Vandemeulebrouck, J.; Revil, A.; Viveiros, F.; Carmo, R.; Silva, C.; Ferreira, T. 3-D interpretation of short-period magnetotelluric data at Furnas Volcano, Azores Islands. Geophys. J. Int. 2018, 213, 371–386. [Google Scholar] [CrossRef]
- Pedone, M.; Viveiros, F.; Aiuppa, A.; Giudice, G.; Grassa, F.; Gagliano, A.L.; Francofonte, V.; Ferreira, T. Total (fumarolic + diffuse soil) CO2 output from Furnas volcano. Earth Planets Space 2015, 67, 174. [Google Scholar] [CrossRef]
- Bettencourt, M.L. O Clima dos Açores Como Recurso Natural, Especialmente em Agricultura e Indústria de Turismo; Clima de Portugal 18; INMG: Lisboa, Portugal, 1979; 103p. (In Portuguese) [Google Scholar]
- DROTRH/INAG. Plano Regional da Água. Relatório Técnico; DROTRH-INAG—Direcção Regional do Ordenamento do Território e Recursos Hidrícos and Instituto da Água: Ponta Delgada, Portugal, 2001; 575p. (In Portuguese)
- Marques, R.; Zêzere, J.; Trigo, R.; Gaspar, J.; Trigo, I. Rainfall patterns and critical values associated with landslides in Povoação County (São Miguel Island, Azores): Relationships with the North Atlantic Oscillation. Hydrol. Process. 2007, 22, 478–494. [Google Scholar] [CrossRef]
- Cruz, J.V.; Coutinho, R.M.; Carvalho, M.R.; Oskarsson, N.; Gislason, S.R. Chemistry of waters from Furnas volcano São Miguel, Azores: Fluxes of volcanic carbon dioxide and leached material. J. Volcanol. Geotherm. Res. 1999, 92, 151–167. [Google Scholar] [CrossRef]
- Cruz, J.V.; Silva, M.O.; Dias, M.I.; Prudêncio, M.I. Groundwater composition and pollution due to agricultural practices at Sete Cidades volcano (Azores, Portugal). Appl. Geochem. 2013, 29, 162–173. [Google Scholar] [CrossRef]
- APHA–AWWA–WPCF. Standard Methods for the Examination of Water and Wastewater, 16th ed.; American Public Health Association: Washington, DC, USA, 1985. [Google Scholar]
- Rojano, W.J.S.; Anjos, E.; Duyck, C.B.; Saint’Pierre, T.D. Determination of rare earth elements in environmental samples with high concentrations of barium by quadrupole inductively couples plasma mass spectrometry. Microchem. J. 2019, 149, 104026. [Google Scholar] [CrossRef]
- Zepeda, V.K.; Kamber, B.S.; Ghidan, O.Y.A. Direct accurate Eu anomaly analusis in very high Ba/Eu silicate samples by triple-quadrupole ICP-MP in MS/MS mass shift mode. Chem. Geol. 2024, 647, 121827. [Google Scholar] [CrossRef]
- Armentrout, P.B. Fundamentals of ion-molecule chemistry. J. Anal. At. Spectrom. 2004, 19, 571–580. [Google Scholar] [CrossRef]
- Nelson, B.J.; Wood, S.A.; Osiensky, J.L. Partitioning of REE between solution and particulate matter in natural waters: A filtration study. J. Solid State Chem. 2003, 171, 51–56. [Google Scholar] [CrossRef]
- Evensen, N.M.; Hamilton, P.J.; O’nions, R.K. Rare-earth abundances in chondritic meteorites. Geochim. Cosmochim. Acta 1978, 42, 1199–1212. [Google Scholar] [CrossRef]
- Ferreira, L.; Cruz, J.V.; Viveiros, F.; Durães, N.; Coutinho, R.; Andrade, C.; Santos, J.F. Chemical and 87Sr/86Sr signatures of rainwaters at two active central volcanoes in São Miguel (Azores)—First survey. J. Volcanol. Geotherm. Res. 2024, 447, 108033. [Google Scholar] [CrossRef]
- Bobos, I.; Gomes, C. Mineralogy and Geochemistry (HFSE and REE) of the Present-Day Acid-sulphate types of Alteration from the Active Hydrothermal System of Furnas Volcano, São Miguel Island, The Azores, Archipelago. Minerals 2021, 11, 335. [Google Scholar] [CrossRef]
- Jeffery, A.J. Petrogenesis and Contrasting Eruption Styles of Peralkaline Silicic Magmas from Terceira and São Miguel, Azores. Ph.D. Thesis, Keele University, Staffordshire, UK, 2016. [Google Scholar]
- Fischer, T.; Chiodini, G. Volcanic, Magmatic and Hydrothermal Gases. In The Encyclopedia of Volcanoes, 2nd ed.; Sigurdsson, H., Houghton, B., McNutt, S.R., Rymer, H., Stix, J., Eds.; Academic Press: Cambridge, MA, USA, 2015; pp. 779–797. [Google Scholar]
- Stimac, J.; Goff, F.; Goff, C.J. Intrusion-Related Geothermal Systems. In The Encyclopedia of Volcanoes, 2nd ed.; Sigurdsson, H., Houghton, B., McNutt, S.R., Rymer, H., Stix, J., Eds.; Academic Press: Cambridge, MA, USA, 2015; pp. 799–822. [Google Scholar]
- Nordstrom, D.K.; McCleskey, R.B.; Ball, J.W. Sulfur geochemistry of hydrothermal waters in Yellowstone National Park: IV acid-sulfate waters. Appl. Geochem. 2009, 24, 191–207. [Google Scholar] [CrossRef]
- Varekamp, J.C.; Ouimette, A.P.; Herman, S.W.; Flynn, K.S.; Bermudez, A.; Delpino, D. Naturally acid waters from Copahue volcano, Argentina. Appl. Geochem. 2009, 24, 208–220. [Google Scholar] [CrossRef]
- Drever, J.I. The Geochemistry of Natural Waters: Surface and Groundwater Environments; Prentice Hall: Upper Saddle River, NJ, USA, 1997. [Google Scholar]
- Liotta, M.; D’Alessandro, W.; Arienzo, I.; Longo, M. Tracing the circulation of groundwater in volcanic systems using the 87Sr/86Sr ratio: Application to Mt. Etna. J. Volcanol. Geotherm. Res. 2017, 331, 102–107. [Google Scholar] [CrossRef]
- Booth, B.; Croasdale, R.; Walker, G.P.L. A quantitative study of five thousand years of volcanism on São Miguel, Azores. Philos. Trans. R. Soc. A 1978, 228, 271–319. [Google Scholar]
- Snyder, D.C.; Widom, E.; Pietruszka, A.J.; Carlson, R.W. The role of open-system processes in the development of silicic magma chambers: A chemical and isotopic investigation of the Fogo A trachyte deposit, São Miguel, Azores. J. Petrol. 2004, 45, 723–738. [Google Scholar] [CrossRef]
- Goldstein, S.L.; Jacobsen, S.B. Rare Earth Elements in River waters. Earth Planet. Sci. Lett. 1988, 89, 35–47. [Google Scholar] [CrossRef]
- Elderfield, H.; Upstill-Goddard, R.; Sholkovitz, E.R. The rare earth elements in rivers, estuaries, and coastal seas and their significance to the composition of ocean waters. Geochim. Cosmochim. Acta 1990, 54, 971–991. [Google Scholar] [CrossRef]
- Stille, P.; Gauthier-Lafaye, J.K.A.; Salah, S.; Bracke, G.; Ewing, R.C.; Louvat, D.; Million, D. REE mobility in groundwater proximate ro the natural fission reactor at Bangombé (Gabon). Chem. Geol. 2003, 198, 289–304. [Google Scholar] [CrossRef]
- Wood, S.A. The geochemistry of rare earth elements and yttrium in geothermal waters. In Volcanic, Geothermal, and Ore-Forming Fluids: Rulers and Witnesses of Processes Within the Earth; Simmons, S.F., Graham, I., Eds.; Society of Economic Geologists: Littleton, CO, USA, 2005; Volume 10. [Google Scholar]
- Möller, P. Rare earth elements and yttrium as geochemical indicators of the source of mineral and thermal waters. In Hydrogeology of Crystalline Rocks; Stober, I., Bucher, K., Eds.; Kluwer Academic Press: Rotterdam, The Netherlands, 2000; pp. 227–246. [Google Scholar]
- Göb, S.; Loges, A.; Nolde, N.; Bau, M.; Jacob, D.E.; Markl, G. Major and trace element compositions (including REE) of mineral, thermal, mine and surface waters in SW Germany and implications for water-rock interaction. Appl. Geochem. 2013, 33, 127–152. [Google Scholar] [CrossRef]
- Fulignati, P.; Gioncada, A.; Sbrana, A. Geologic model of the magmatic-hydrothermal system of Vulcano (Aeolian Islands, Italy). Miner. Petrol. 1998, 62, 195–222. [Google Scholar] [CrossRef]
- Santos-Raga, G.; Santoyo, E.; Guevara, M.; Almirudis, E.; Pérez-Zárate, D.; Yáñez-Dávila, D. Tracking geochemical signatures of reare earth elements and trace elements in Spring waters and outcropping rocks from the hidden geothermal system of Acoculco, Puebla (Mexico). J. Geochem. Explor. 2021, 227, 106798. [Google Scholar] [CrossRef]
- Goff, F.; Janik, C.J. Geothermal Systems. In Encyclopedia of Volcanoes, 1st ed.; Sigurdsson, H., Houghton, B., McNutt, S.R., Rymer, H., Stix, J., Eds.; Academic Press: Cambridge, MA, USA, 2000; pp. 817–834. [Google Scholar]

| Reference | Name | 87Sr/86Sr | ||
|---|---|---|---|---|
| [42] | Winter | Summer | ||
| LF1 | Caldeira da Lagoa das Furnas | - | 0.705077 ± 0.000030 | - |
| LF3 | Miguel Henriques | - | 0.705374 ± 0.000028 | - |
| LF8 | Água Santa | - | 0.706185 ± 0.000028 | 0.705370 ± 0.000005 |
| LF10 | Azeda | 0.705368 | 0.705783 ± 0.000018 | - |
| LF18 | Caldeira Asmodeu | 0.705408 | 0.705528 ± 0.000025 | - |
| LF19 | Caldeira Grande | 0.705432 | 0.705363 ± 0.000023 | - |
| LF20 | Padre José | - | 0.705268 ± 0.000028 | - |
| LF25 | Banhos Férreos III | - | 0.705035 ± 0.000028 | - |
| LF26 | Camarça | - | 0.705409 ± 0.000030 | - |
| LF29 | Quenturas I | - | 0.705231 ± 0.000025 | 0.705193 ± 0.000010 |
| LF30 | Quenturas II | 0.705258 | 0.704771 ± 0.000030 | 0.705243 ± 0.000006 |
| LF33 | Grutinha II | - | 0.705278 ± 0.000023 | - |
| LF34 | Torno | 0.705235 | 0.705211 ± 0.000025 | - |
| LF37 | Gloria Patri | - | 0.705212 ± 0.000023 | - |
| LF38 | Estrada RQ | - | 0.705002 ± 0.000021 | - |
| LF40 | Dizimo | - | 0.705750 ± 0.000024 | - |
| CLag | Soil water, Furnas Lake | - | 0.710067 ± 0.000007 | |
| CFut | Soil water, football field | - | 0.709590 ± 0.000008 | |
Disclaimer/Publisher’s Note: The statements, opinions and data contained in all publications are solely those of the individual author(s) and contributor(s) and not of MDPI and/or the editor(s). MDPI and/or the editor(s) disclaim responsibility for any injury to people or property resulting from any ideas, methods, instructions or products referred to in the content. |
© 2025 by the authors. Licensee MDPI, Basel, Switzerland. This article is an open access article distributed under the terms and conditions of the Creative Commons Attribution (CC BY) license (https://creativecommons.org/licenses/by/4.0/).
Share and Cite
Ferreira, L.; Cruz, J.V.; Viveiros, F.; Durães, N.; Andrade, C.; Almeida, C.; Cabral, N.; Coutinho, R.; Santos, J.F. Hydrogeochemical Signatures and Processes Influencing Mineral Waters at Furnas Volcano (São Miguel, Azores). Water 2025, 17, 898. https://doi.org/10.3390/w17060898
Ferreira L, Cruz JV, Viveiros F, Durães N, Andrade C, Almeida C, Cabral N, Coutinho R, Santos JF. Hydrogeochemical Signatures and Processes Influencing Mineral Waters at Furnas Volcano (São Miguel, Azores). Water. 2025; 17(6):898. https://doi.org/10.3390/w17060898
Chicago/Turabian StyleFerreira, Letícia, José Virgílio Cruz, Fátima Viveiros, Nuno Durães, César Andrade, Carlos Almeida, Nuno Cabral, Rui Coutinho, and José Francisco Santos. 2025. "Hydrogeochemical Signatures and Processes Influencing Mineral Waters at Furnas Volcano (São Miguel, Azores)" Water 17, no. 6: 898. https://doi.org/10.3390/w17060898
APA StyleFerreira, L., Cruz, J. V., Viveiros, F., Durães, N., Andrade, C., Almeida, C., Cabral, N., Coutinho, R., & Santos, J. F. (2025). Hydrogeochemical Signatures and Processes Influencing Mineral Waters at Furnas Volcano (São Miguel, Azores). Water, 17(6), 898. https://doi.org/10.3390/w17060898