Article

Changes in Groundwater Vulnerability Due to Land Reclamation in Mining Areas: An Assessment Using the DRASTIC Method

by
Ewa Krogulec
1,*,
Przemysław Bukowski
2,
Katarzyna Niedbalska
2,
Katarzyna Sawicka
1,
Joanna Trzeciak
1 and
Sebastian Zabłocki
1
1
Faculty of Geology, University of Warsaw, Żwirki i Wigury Street, 93, 02-089 Warsaw, Poland
2
Central Mining Institute-National Research Institute, Gwarków Square, 1, 40-166 Katowice, Poland
*
Author to whom correspondence should be addressed.
Water 2025, 17(5), 702; https://doi.org/10.3390/w17050702
Submission received: 15 January 2025 / Revised: 13 February 2025 / Accepted: 25 February 2025 / Published: 28 February 2025

Abstract

:
Reclaiming land after mining activities and ensuring environmental protection are mandatory aspects of the decommissioning process for mining sites. Groundwater assessments, particularly those evaluating vulnerability to contamination using the DRASTIC rank method, are critical tools for guiding and controlling reclamation efforts. By analysing changes in hydrogeological and environmental factors, as well as parameter classes through sensitivity analyses, the DRASTIC method can be optimised to predict the effects of reclamation. Results indicate that reclamation typically decreases groundwater vulnerability, as evidenced by a shallower water table, reduced recharge volume, groundwater flow within new waste rock formations, changes in soil types, lower slopes, and reduced conductivity. Vulnerability changes during reclamation vary spatially, including both decreases and localised increases. Reclamation planning should prioritise groundwater vulnerability assessments to ensure effective land use and environmental protection. Modifications to groundwater-monitoring networks, especially in areas prone to flooding and significant surface changes, are also essential for comprehensive reclamation management.

1. Introduction

1.1. Land Reclamation Processes

Land reclamation is generally understood as the process of restoring or improving disturbed lands for productive use. According to Britannica [1], it includes irrigation of arid areas, soil improvement, drainage of wetlands, and restoration of mined lands. The term varies regionally: in the U.S., it refers to land restoration; in Canada, it denotes reconversion to productive use; and in Oceania, it is known as land rehabilitation [2].
There are a few main directions and reasons why land reclamation is needed:
-
Reclamation of arid land—In the western United States, extensive reclamation efforts, led by the United States Bureau of Reclamation, focus on irrigation through the construction and maintenance of dams, canals, and pumping systems. Notable projects include over 600 dams such as the Grand Coulee Dam on the Columbia River and Hoover Dam on the Colorado River. Similar reclamation activities are also being undertaken in Israel, Egypt, Middle Eastern countries, India, Mexico, Peru, Russia, and China, with historical projects dating back to the mid-19th century in the Great Salt Lake basin and California.
-
Reclamation of swampy lands—In areas where the land is rendered unfit for agricultural production, even where the wet soil condition is only temporary, the water needs to be removed by various drainage systems by ditches, drains, or wells. The water removal method depends on the permeability of the soil and underlying strata and the main drainage base elevation. An example can be the Everglades of Florida, the lower Mississippi valley, or projects found in England, near Minsk, Belarus, New Zealand, Australia, and others.
-
Reclamation of coastal areas—Areas where offshore lands or tidal marshes are covered by shallow water. Construction of dikes parallel to the shoreline, drainage of the area between the dikes and the coastline, closing the mouth of tidal estuaries, polder constructions or ground raising is practised to obtain coal. The greatest achievements were in the Netherlands (7000 km2), England, and also in the Carolinas and Georgia in the United States. Others are known in China (over 13,500 km2), Hong Kong, Dubai, and the Gran Chaco region of Paraguay [3].
-
Reclamation of mine spoils—Areas where mineral deposits lie near the surface, leading to surface mining practices in regions like the United States, England, Serbia, and others, targeting deposits like phosphates, gypsum, gravel, limestone, copper, iron, coal, and more. Historically, lands were often abandoned after exploitation, with no prospects for future development. This issue was addressed in 1950 when states such as Pennsylvania, West Virginia, Ohio, and Indiana passed laws requiring the restoration of strip-mined areas. Eastern Europe saw a similar trend in surface mine reclamation in the late 20th century. The main goals of reclaiming tailing dump areas include reforestation, creating grazing lands, and developing recreational areas.
-
Reclamation of eroded, infertile, and “new” lands—Areas where soil erosion is severe, caused by lack of vegetation, and sediment susceptibility to erosion driven by climate factors. Such cases are known from Atri, Italy, southern Virginia, and southwestern South Dakota.
In Poland, reclamation is typically associated with the decommissioning of open-pit mines, regulated by the Geological and Mining Law Act [4], and includes measures to restore the land to its productive state as outlined in the Act on Protection of Agricultural and Forestry Land [5].

1.2. Groundwater Vulnerability in Reclamation Process

Reclamation should be regarded as a process that is planned, designed, and implemented at all stages of the activity, so it must be controlled, verified, and corrected in relation to the initial strategy if the effect of the actions taken is unsatisfactory [6,7,8]. In terms of real impact on the elements of the natural environment, it requires control mechanisms, and in the case of groundwater, commonly performed assessments of groundwater’s vulnerability to contamination can be a tool to support the course and control of the reclamation process [9,10,11,12]. Among the commonly used methods for vulnerability assessment for mining areas, the rank-based DRASTIC method [13] in its original and revised formulations is still applicable [14]. The degree of risk of groundwater contamination and its spatial variability are derived from the combination of class values and weights assigned to the main factors influencing groundwater vulnerability to contamination [15,16]. The application of the DRASTIC procedure allows the selection of particularly sensitive areas, but also the control of input parameters. It also makes it possible to assess the impact of remediation with parameters changing as a result of remediation [17]. At different stages of mining activity, there is a change in groundwater vulnerability, including during the reclamation stage [18]. It is indicated that aquifer vulnerability assessments should be carried out at least once every six to twelve months for proper management of water resources in mining areas [8].
In reclamation involving the filling of the rock mass through Carboniferous waste rock, it is necessary to monitor the chemical state of water, where there is the possibility of an increase in the threat to groundwater quality from waste rock dumps through the formation of acid mine water [19]. The practical aspect of assessing the change in vulnerability as a result of pit reclamation is the specific methodological indications for carrying out monitoring of the groundwater environment, targeted to the specificities of mining areas, where materials overlying coal deposits are often high in iron sulphides, so under the well-oxide conditions present in loose material, highly acid conditions may develop. The acid constituents will be removed by leaching in years, so there is a need to form water-retaining benches and use pine trees to reforest spoils high in sulphides because of the acid tolerance of these trees [20].
Vulnerability assessment is a versatile tool used to verify the degree of groundwater risk. Previous experience of researchers with applied methods for assessing groundwater vulnerability indicates that in areas of mining activity, modification of methods by incorporating additional parameters and data that take into account the characteristics of the mining regions can be successfully applied [21]. The DRASTIC rank method for assessing intrinsic vulnerability [13] is considered a standard tool used in water resource management due to its popularity and is used in many countries for this purpose [15,22,23]. The choice of this method for the study area was possible after taking into account the factors that change the vulnerability assessment in terms of the transformation of the rock mass properties and hydrogeological conditions.
The main objective of this study was to assess the vulnerability for the completed land reclamation phase of the excavation pit, which is to be filled with Carboniferous waste rock, together with the gradual decommissioning of the mine drainage system. The reclamation process is currently underway, and the deposition level reached is 240 m a.s.l., with a target of 255 m a.s.l. on average. This is a good time to determine in advance how the planned direction of reclamation will change the vulnerability of groundwater to pollution in relation to the assessment of vulnerability made at the stage of declining pit exploitation [16]. At the same time, this assessment is the basis for the subsequent effective management of the region’s water resources.

2. Methodology

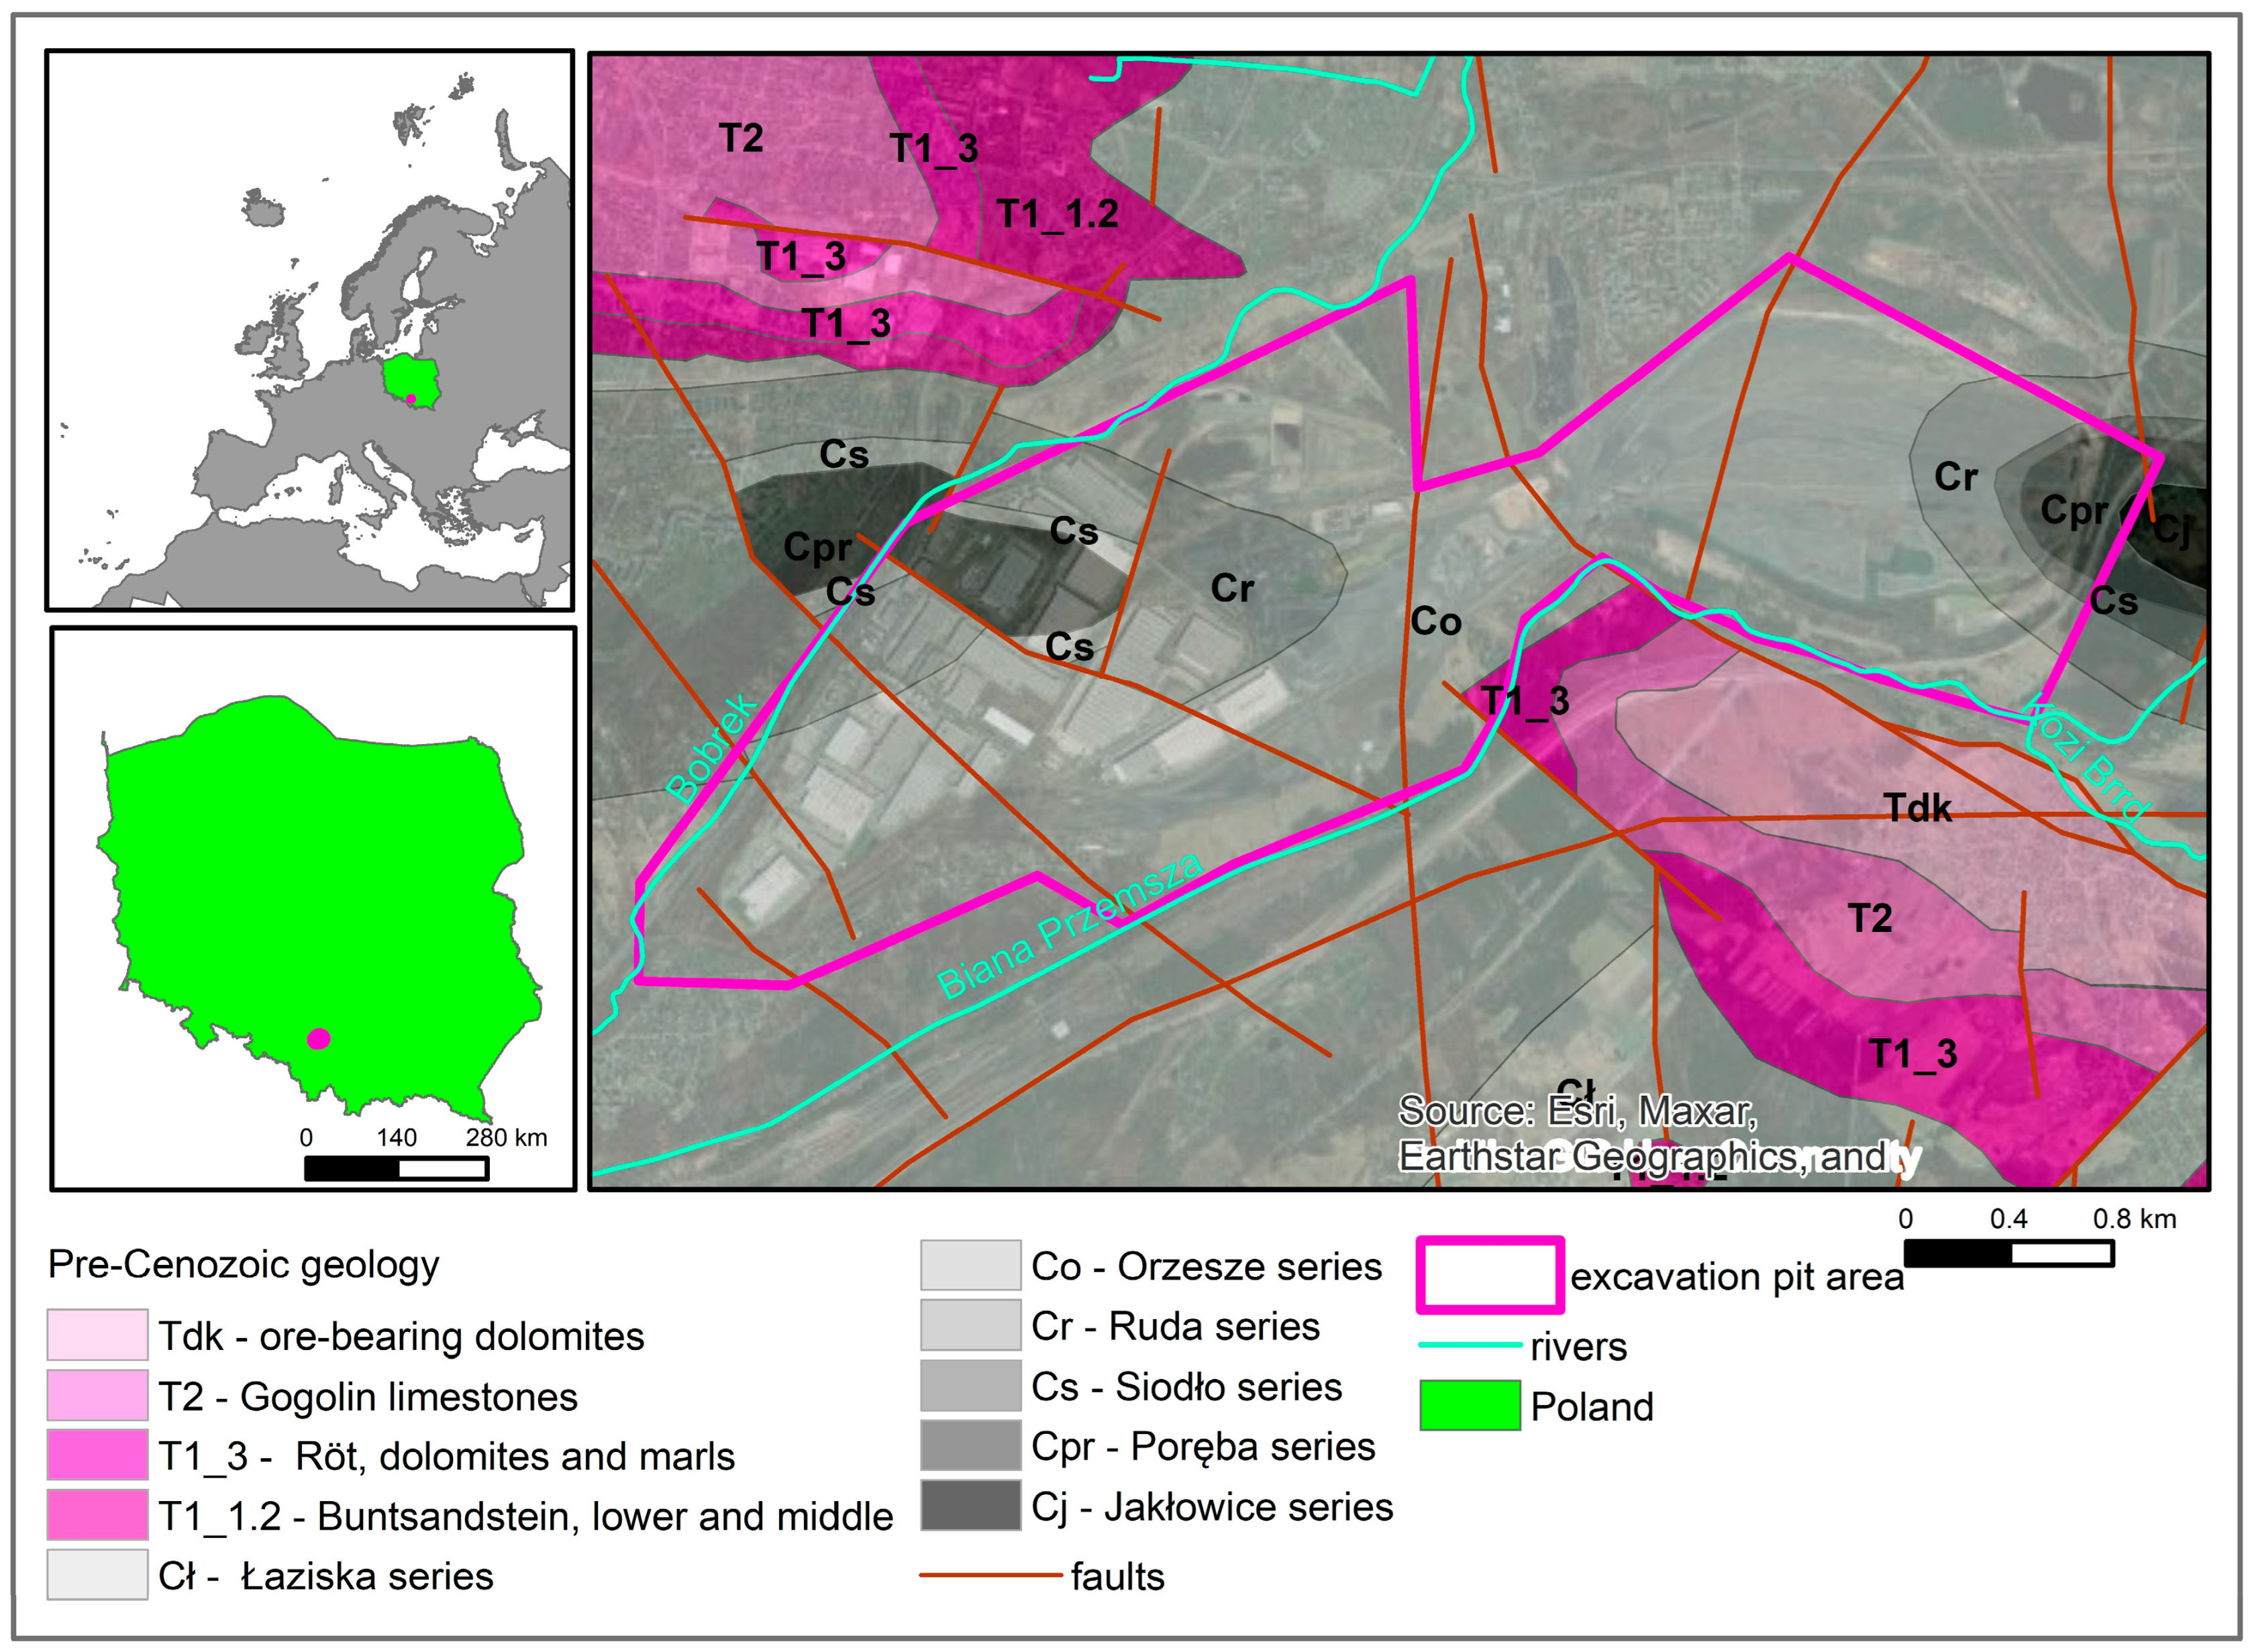
2.1. Hydrogeology of the Area

The study area is located in southern Poland, in the Śląskie Voivodship, in the town of Sosnowiec. The excavation area of the open-pit Quaternary frac sand mine consists of two fields with a total area of 5.58 km2. At present, the excavation is being recultivated in order to fill it completely with waste rock created during the exploitation of hard coal in the mines of the area. The spatial range of the vulnerability analysis is wider, at 8.84 km2 including coal storage, municipal waste landfill, and areas directly adjacent to the open pit, where the impact from underground and surface mining overlaps. The area belongs to the catchment area of the Biała Przemsza River, which is a receiver of water coming from the drainage system of the open pit with the main drainage ditch and other drainage ditches, which are successively shortened at the reclamation stage [24]. The area is located in the Variscan block, which lies between Mesozoic structures in the north and the Sudets and Carpathian Mountains in the south [25]. The Upper Silesian Coal Basin is built by Upper Carboniferous formations lying on the surface and locally covered by Triassic and Quaternary formations (Figure 1).
The study area is characterised by complex hydrogeological conditions due to coal mining from Carboniferous strata, and sand mining in an open-pit mine. The influence of these facilities extends to all three aquifers: the Quaternary, Carboniferous, and locally, the Triassic on the boundary of the open pit [16].
The Quaternary aquifer is made up of variously grained sands with inset gravels. It is described in more detail in Hydrogeological Map of Poland 1:50,000 by Cudak et al. [27] and Górnik [28]. The map documents the hydrodynamic conditions that occurred during the exploitation of sands and gravels under conditions of a developed withdrawal. The water table stabilised at 222 m a.s.l. in the centre of the quarry, while the Biała Przemsza River is located at 242–250 m a.s.l. Under these conditions, the Quaternary aquifer reached thicknesses of 1 to 7 m in the central part, while at the boundaries and beyond, aquifers reached thicknesses of up to 50 m. After the reclamation process, it is assumed that the water table will be rebuilt to a level of 263 m a.s.l. in the north with the water table declining southwards to the drainage base, to the Biała Przemsza River valley (Figure 2). The Carboniferous aquifer is associated with sandstone overburden lying within the siltstone–siltstone series of strata of the Orzesze, Załęże, Ruda and Siodło, with varied hydrogeological parameters [24,29,30].
The fracture–pore Carboniferous horizons transmit water. Recharge is by infiltration through permeable Quaternary strata or directly through permeable deposits of the productive Carboniferous series. The fracture–pore Carboniferous horizons remain in hydraulic contact with Quaternary strata, so merged aquifers may occur where there is contact of permeable productive Carboniferous series with permeable Quaternary deposits.

2.2. DRASTIC Method

The vulnerability assessment was conducted for two scenarios, before [16] and after reclamation, using the standard DRASTIC method. The seven DRASTIC parameters were calculated based on available hydrogeological, geological, and topographical data. The pre-reclamation scenario was developed using data from the excavation phase when the dewatering system was in operation, maintaining a lowered groundwater table. The post-reclamation scenario was determined based on predicted changes in hydrogeological conditions, including the rise of the groundwater table, reduced infiltration, and deposition of waste rock in the excavation area.
The DRASTIC method was used to assess vulnerability, without adding new parameters. The original seven criteria used were considered to be sufficient to describe the hydrogeological environment, both during the open-pit mining phase and after the reclamation process (Table 1). The parameters of D (depth to groundwater), R (recharge), A (aquifer media), S (soil), T (topography), I (impact of the vadose zone), and C (conductivity) make up the final vulnerability index, for which a discretisation of the space into a 50 m × 50 m block was used, so 3543 blocks were calculated in each layer.
The determination of parameter values for both scenarios, before and after reclamation, has been compiled in Table 1.

3. Results

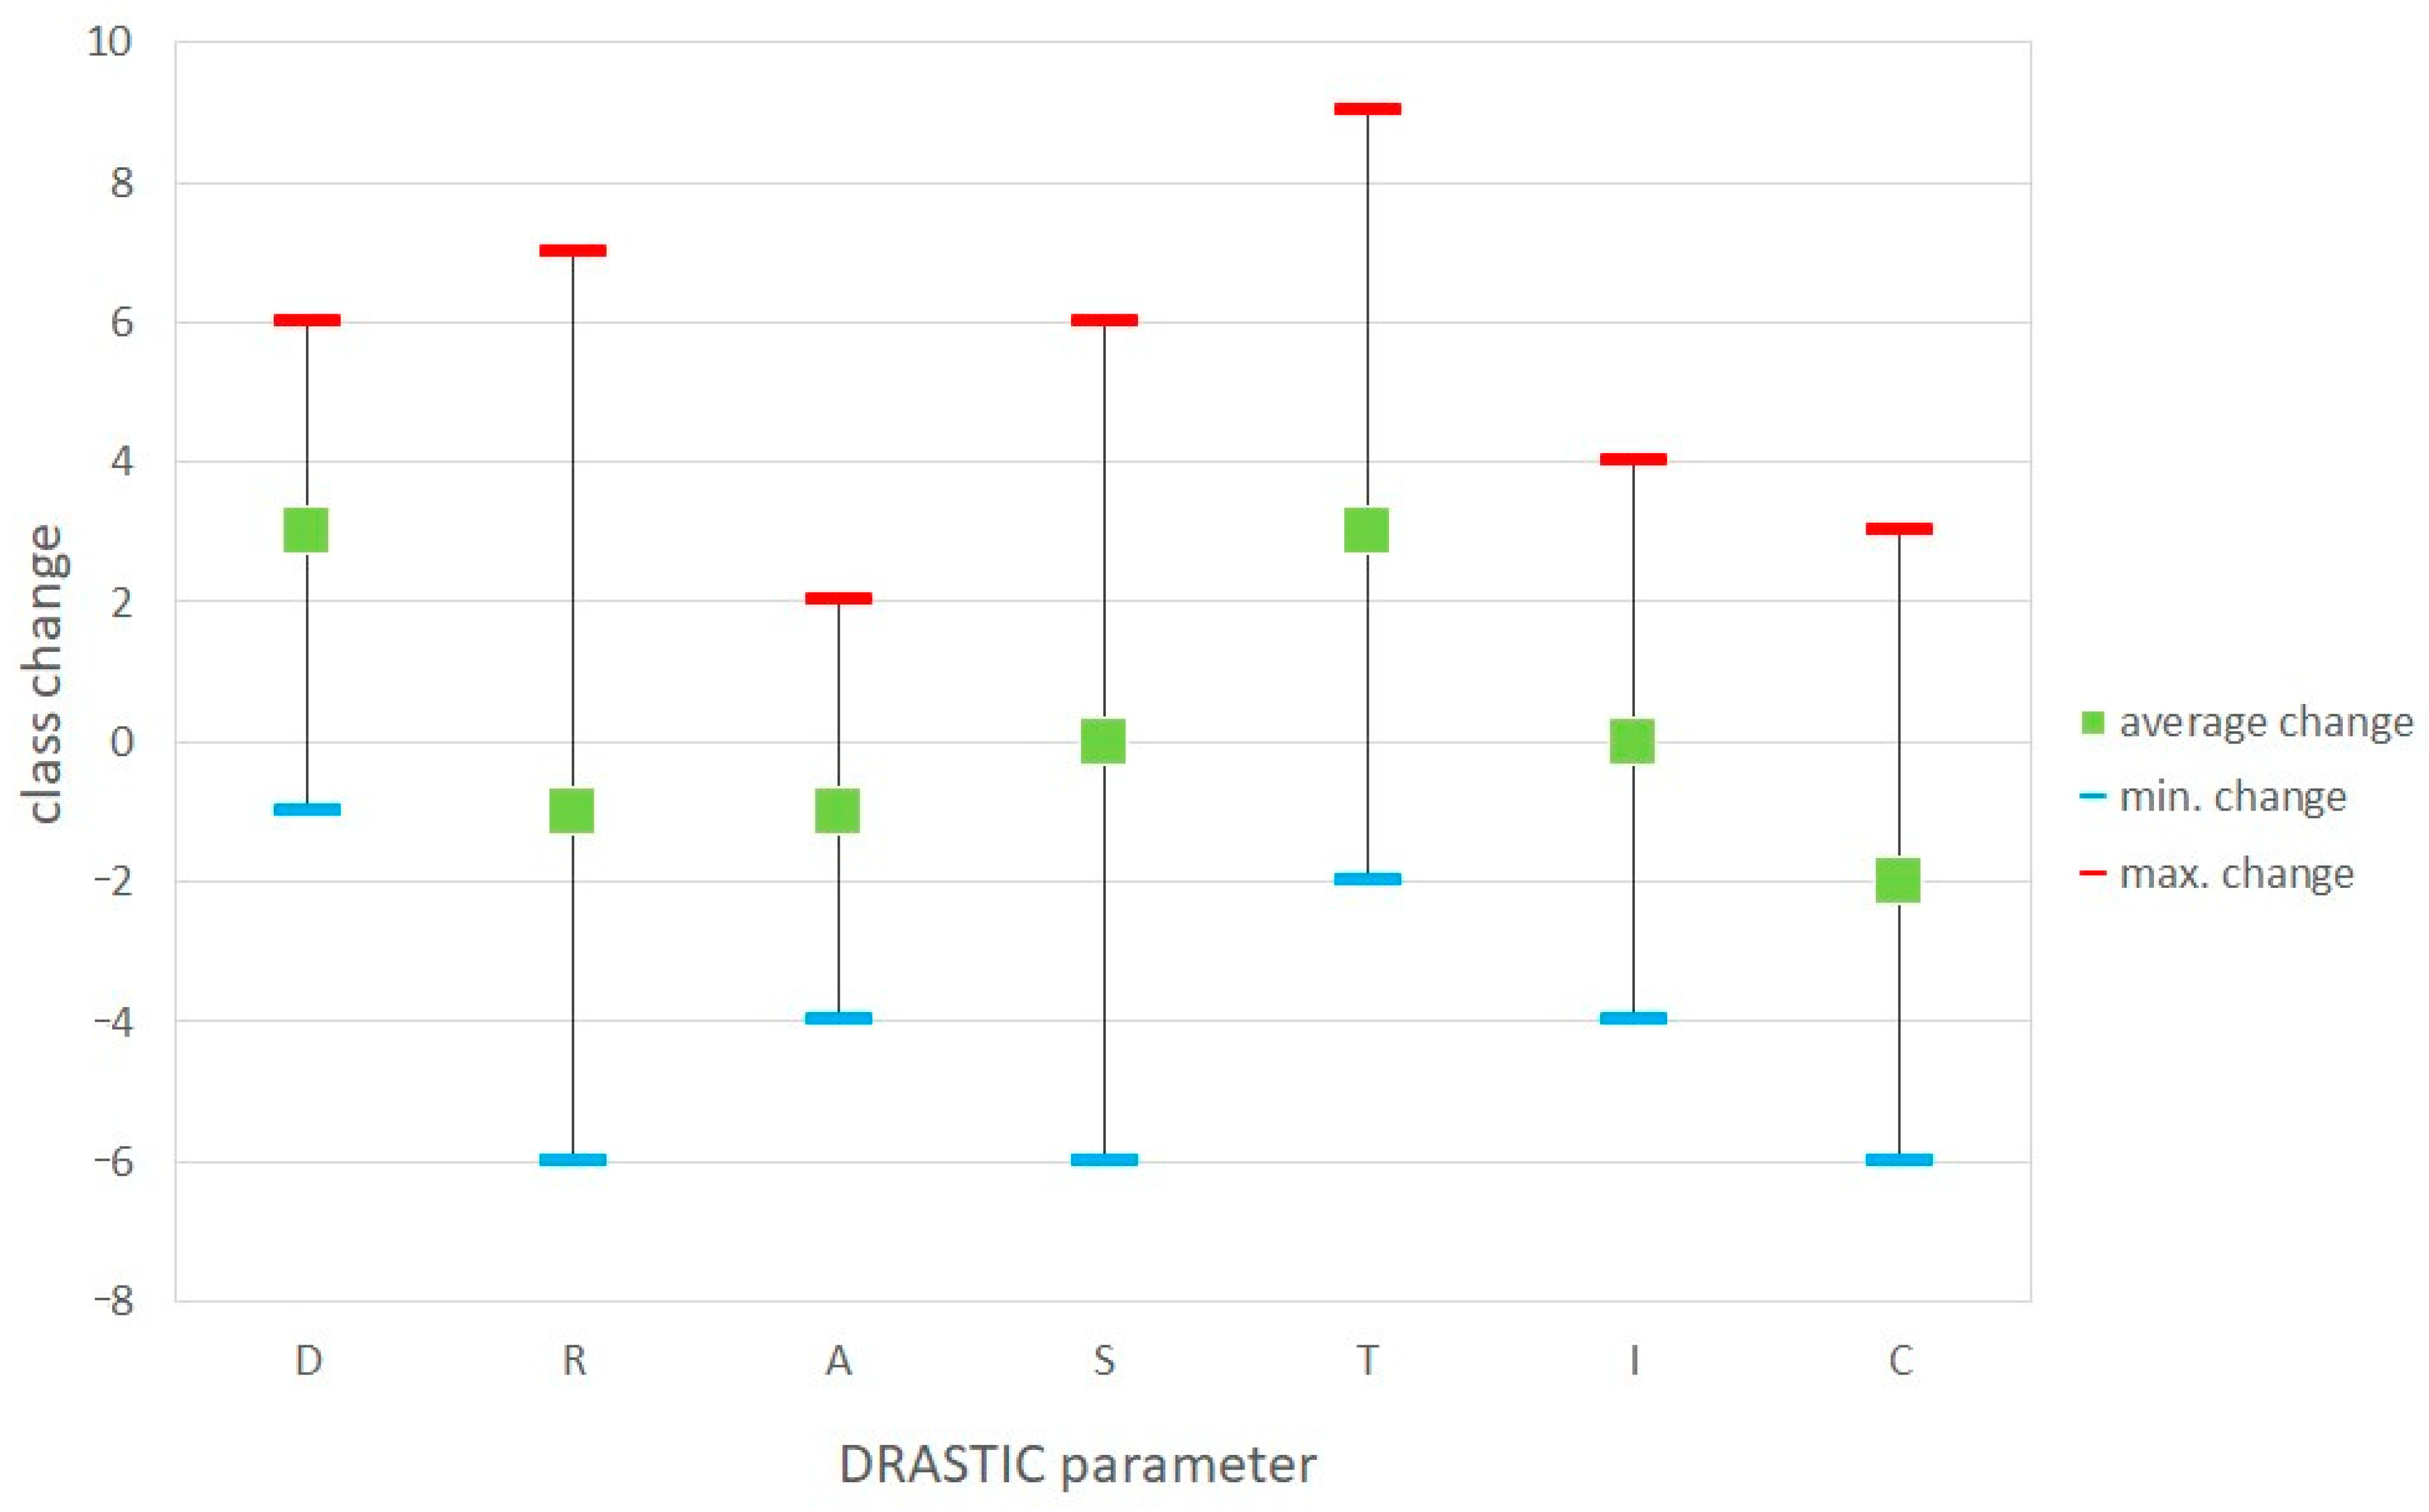
3.1. Change in Parameter Class
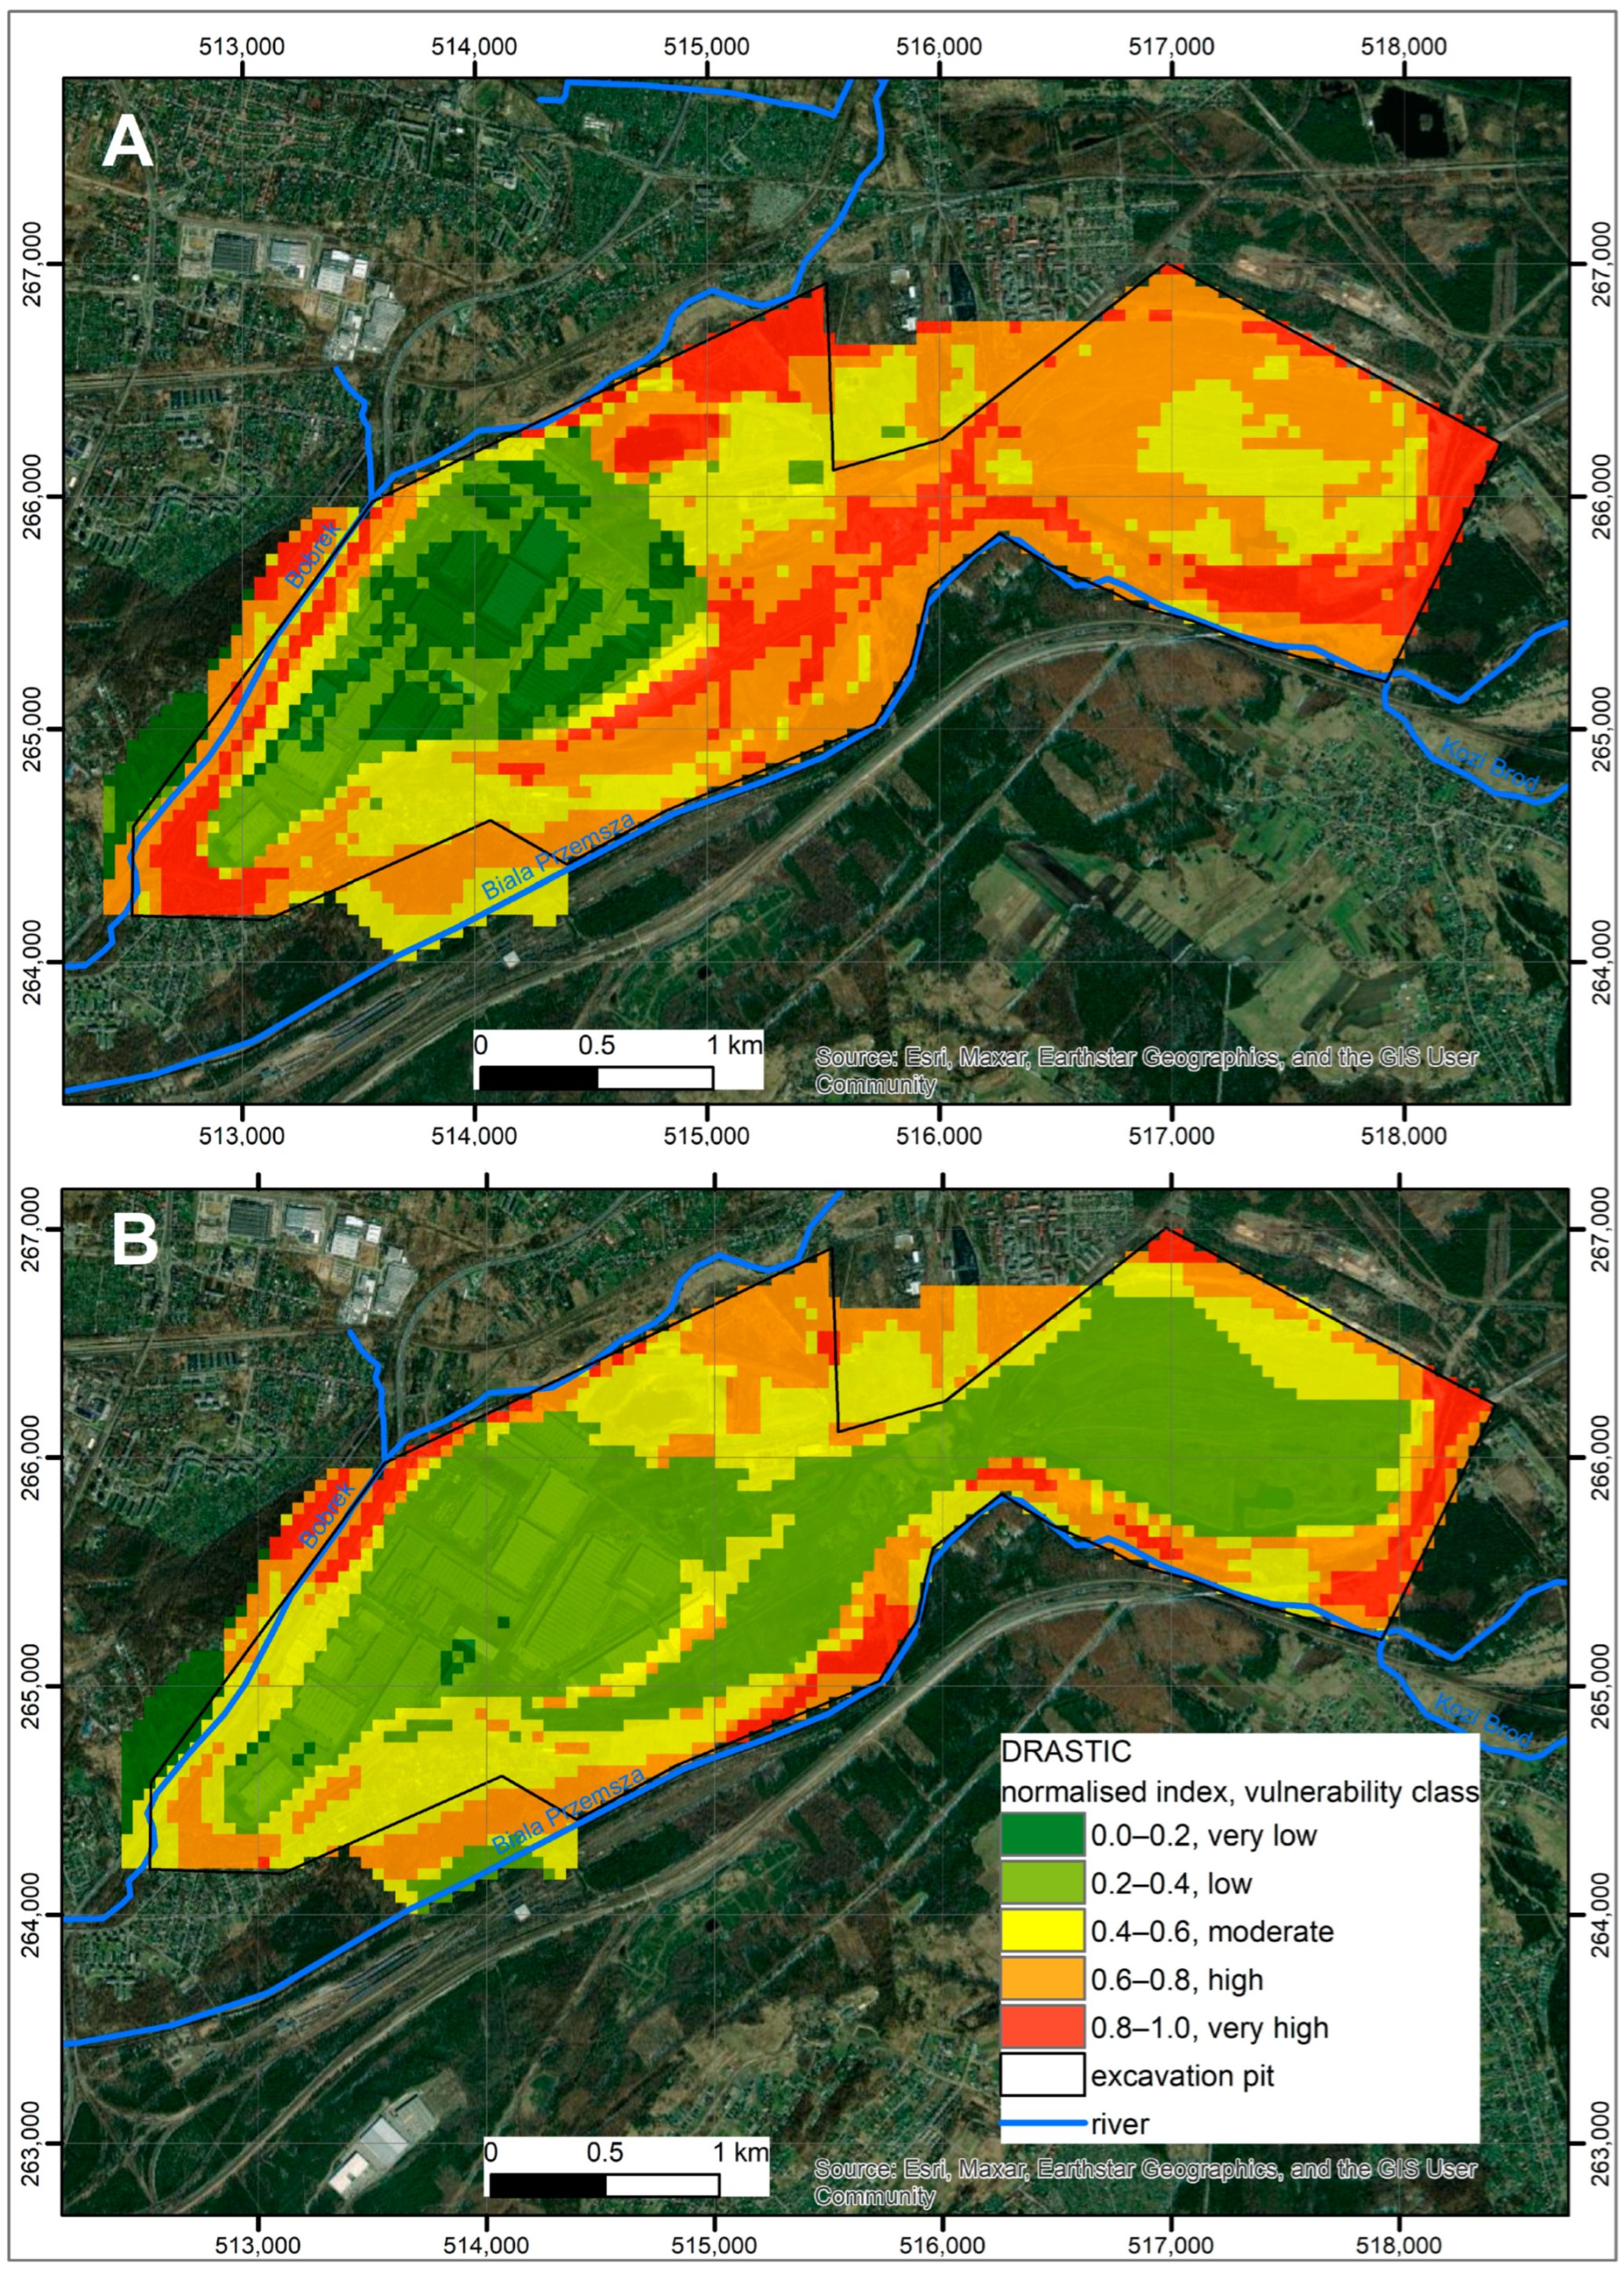
Based on the available data, the possible changes in parameters after reclamation were thoroughly characterised to better relate to the results specific to the studied area. The groundwater table of the first aquifer occurred during the mining stage in a range from 222.5 m a.s.l. in the central part of the excavation pit near the sump and pumping station no. 6 to 252.5 m a.s.l. in the western part. The DEM was used for groundwater depth calculation. Results ranged from surface water to 49.51 m b.g.l., at an average value of 14.5 m b.g.l. The post-restoration scenario for the area resulted in a change in groundwater table location from 263 m a.s.l. in the northeast to 242 m a.s.l. in the southwestern part of the area. The depths obtained ranged from −4.96 m to 7.18 m, with a mean value of 2.14 m. Before reclamation, around 25% of the area was covered by class 7, where the depth is 5–10 m b.g.l., and 23% was class 6 with a depth in the range of 5–10 m b.g.l. After reclamation, when the groundwater table was raised, it was found that flooding occurred along the southern edge and northwest of the current pit. The largest area was occupied by the class with the highest rank of 10–36% of the area, and the second-largest area of 31.8% was occupied by the class of 2–5 m. As a result of the reclamation, there was a change in the classes of the D parameter, narrowing its variability from classes 3–10 to 7–10 (Figure 3, Figure 4 and Table 2). In almost the entire area, there was an increase in class, which is synonymous with a decrease in the depth to the water table. In an area of 26.14%, there was an increase of three classes, four classes in 24.41%, and two classes in 23.22% (Table 2).
Infiltration recharge prior to the reclamation process fell within the range of variation from 58.4 to 328.5 mm/year, with an average value of 159 mm/year. Values exceeding 210 mm/year were in the class no. 10, which covered 25.5% of the surface; 23.2% was covered by class 2 with recharge at 50–70 mm/year. After reclamation, recharge changed from 69.35 mm/year to 233.6 mm/year and formed the basis for distinguishing eight classes of the R parameter. The lowest recharge values occurred within the previously reclaimed part of the pit from 80.3 to 105.85 mm/year. In contrast, the highest recharge ranging from 143.35 to 233.6 mm/year occurred on the southeastern periphery. Class 4 occupied 42.4% of the area, where infiltration reached values of 90–110 mm/year. The change in the magnitude of infiltration recharge went both ways, although a greater proportion of the area was associated with a decrease in infiltration recharge of up to six classes (Figure 3 and Figure 4). Approximately 28% of the area was affected, and the maximum change was a shift of the R parameter by five classes. The areas with a decrease of one class of the R parameter had the highest percentage share—this is 25.69%; a similar share of 25.15% also applied to an increase of one class.
The lithology of the aquifer evolved due to strong anthropogenic impacts within the range of the exploitation pit. The spatial scope of fluvioglacial sands and gravels was permanently narrowed, and in the new unit, gangue rocks were introduced, so the groundwater table made contact with the gangue rock deposited in the excavation pit. In some areas, the sands and zwitterions have been completely removed by mining, leaving the bedrock of the Upper Carboniferous as an aquifer medium. Class no. 8 dominated before reclamation, comprising sands, gravels with gangue rocks, and Aeolian sands (62.1%), followed by class no. 10, comprising fluvioglacial sands and gravels (34.7%). After reclamation, it was assumed that, within the boundaries of the reclaimed pit, the flow would occur in an aquifer composed of Quaternary sands and gravels at the bottom, which had not been excavated due to the Carboniferous series on top, above the bedrock that would be deposited as a result of reclamation. Class 8, i.e., the co-occurrence of sands, gravels, and bedrock (43.3%), was dominant, followed by class 10, which included fluvioglacial sands and gravels (26.2%), and class 6, i.e., deposited bedrock (21.9%). The majority of the area remained within the range of no change (71.28%), with an increase of two classes affecting only 0.82% (Figure 3 and Figure 4).
There were numerous areas with different soil types distinguished. On a previously technically reclaimed area, there was a lack of soil cover due to the development. Initial soils occurred on a reclaimed communal waste dump, with some initial soils on fluvioglacial sands and gravel. Lack of soil cover was also found within the coal storage site, on an exploitation site of fluvioglacial sands and gravel, and the active communal waste dump. Class no. 10, no soil cover, occurred on 26.8% of the surface. The second class was represented by Podzols and Entic Podzols soils, reaching up to 23.9%. After reclamation, the basis for the development of the layer was detailed within the boundaries of the excavation with new subdivisions. It was assumed that soil of an initial character would be formed there, and that the soil-forming process of the target soil type would be significantly extended over time. The largest area of 39.4% is occupied by class 8, i.e., the initial soils in the reclamation area, followed by class 7 covering 16.6% of the area within the occurrence of Podzols soils. Changes in the classes of the S parameter occurred in both directions in terms of a decrease of six classes as well as an increase of six classes. In an area of 58.26%, there was no change at all, and the largest decrease of two classes occurred in an area of 19.81%. The remaining changes did not exceed 1–2% (Figure 3 and Figure 4).
The DEM raster with a resolution of 100 × 100 m presented the situation at the time of sand mining. It was transformed into a slope map expressed in percentages and divided into 10 classes. Class no. 10, flat areas with slopes lower than 1%, covered 24.5% of the surface; the second class with larger slope values was class no. 9 with slopes of 1–2%, which covered 19.6% of the surface; and class no. 8 with slopes of 2–3% covered 11.9% of the surface. After reclamation within the boundaries of the planned reclamation, target levels of pit filling were set. The predominant areas were flat areas with a slope of no more than 1%, and as class 10 covered 78.4% of the area, only at the edge of the pits were the slopes higher, up to a maximum of 4% (Table 2). The range of the T parameter narrowed considerably from a range of classes 1–10 to 7–10. Changes usually involve an increase of several classes, with the highest proportion recorded for an increase of one class (17.67%) and two classes (11.89%). The largest change, by nine classes, applied to 9.71% of the area (Figure 3 and Figure 4).
The lithology of the vadose zone was set as follows: in the northern and eastern parts of the excavation pit, clay within fluvioglacial sands and gravels occurred; within the excavation pit, areas with only gangue rock occurred; and along the northern site, deposits of anthropogenic origin such as communal waste and coal from deep mining were also present. Within the river valleys, there were fluvial sands and gravels with fluvial muds and silts. Class no. 6, including the gangue rock, comprised 39.5% of the surface. Clean fluvioglacial and fluvial sands and gravels occurred in class no. 10 (21.3%). Information on the technical reclamation of the pits was used to describe the vadose zone after reclamation. Within the excavations, areas with only waste rock were distinguished, assuming their homogeneity and similar lithological formation. Class 6, waste rock, occupied 51.2% of the area. Formations with good permeability, sands, and gravels and areas with water occurring on the surface were class 10 (16.8% of the area). The range of variation in the classes of parameter I remained the same. The change was an increase in class by a maximum of four classes and a decrease also by four classes (Figure 3 and Figure 4). In an area of 80.46%, nothing changed, while the largest area-wide change was a shift of four classes downwards in an area of 11.16%. The remaining changes do not exceed 3% each (Table 2).
Data on the hydraulic conductivity were the basis for distinguishing six classes before the reclamation process. The values varied between 3 and 29 m/d. The largest surface area was covered by class no. 3 in the C range of 4–8 m/d (47%), followed by class no. 4 in the range of 8–12 m/d (22.5%) and class no. 5, i.e., 12–16 m/d (18.9%). After the reclamation process, the division into six classes was maintained, but the values varied from 0.75 m/d to 28 m/d. The areas filled with pit rock had the lowest conductivity from 0.75 to 2.5 m/d. Class 2 with a range of conductivity up to 2 m/d (58.8% of the area) had the largest area, followed by class 2 in the range of 2–4 m/d (12.9% of the area) and Class 3, or 4–8 m/d (12.8% of the area). The change in parameter C refers to a decrease of a maximum of six classes and increases in some areas by four classes (Figure 3 and Figure 4). Only in 17.29% of the areas was there no change. There was usually a change from one class to a lower class; the largest areas were associated with a decrease of two classes (37.89%) and three classes (19.47%) (Table 2).
Changes in the class values of individual parameters varied considerably. After analysing the area share of each class, it was found that the overall class of D and T parameters increased the most, by an average of three classes (Figure 4). This is due to the fact that there was an increase in class over virtually the entire area, while the decrease in class was slight and spatially limited. The C parameter showed a change of an average of two classes downward after the reclamation process, due to the replacement of sand and gravel formations with gangue rock, which has very poor permeability parameters. The minimum and maximum values of the R parameter, −6 and 7, respectively, are far apart, and its average value is −1, which means that changes in the recharge value in the downward direction dominate. Statistically, in the area, the S and I parameters did not change: the average value of the changes was zero, which is due to the large class deviations toward changes with both positive and negative values. The smallest class divergence occurred for the A parameter, where class values increased by a maximum of two and decreased by four (Figure 4).

3.2. DRASTIC Index

A comparison of results before and after reclamation revealed significant changes in groundwater vulnerability. The primary difference resulted from the rise in the groundwater table and changes in the vadose zone structure, which reduced the soil’s ability to filter contaminants. In previously drained areas, vulnerability significantly decreased, whereas in regions where groundwater levels reached the surface (e.g., river valleys and flood-prone zones), an increase in vulnerability was observed. The result of the DRASTIC method is the spatial distribution of natural vulnerability to pollution emitted from the land surface (Figure 5). In the GIS-based analyses, ranges of areas with particular groundwater vulnerability classes were determined after normalisation of the DRASTIC index into five equal intervals as follows (Table 3): 0–0.2—very low class; 0.2–0.4—low class; 0.4–0.6—moderate class; 0.6–0.8—high class; and 0.8–1.0—very high class.
The contribution of particular classes was variable. Before reclamation, the very-low-vulnerability class covered 10.9% of the surface in the previously reclaimed part of the excavation pit. The low class represented 11% and the medium-vulnerability class covered 22.5% of the area. The high-vulnerability class covered 38.6% of the surface within the excavation pits and river valleys, and the very high class occurred in the central part, in the marginal part of the river valley, beyond the excavation pit, and in the south and north parts, on the surface of 16.9%. After reclamation, the very low class covered a much smaller area, only 2.35% in the western part of the site, including a section of the Boberek river valley, and individual computational blocks in the area already developed after the reclamation of part of the pit. The low class, on the other hand, covered a much larger area, occurring on 44.54% of the site, including within the previously reclaimed part of the pit to the west and also in the central part of the pits planned to be filled with waste rock. The medium class covered a smaller area than before reclamation: 27.42% in the outlying areas of the excavation pit. The high-vulnerability class also covered a smaller area, 20.01% of the area, in the peripheral areas where there were outcrops of fluvioglacial sands and gravels not included in the reclamation process. The very-high-vulnerability class was also present in the peripheral areas of the infilled quarry in the southern part and along the river valley, covering a total of 5.69% of the area—less than before reclamation (Figure 5).

3.3. Sensitivity Analysis and DRASTIC Optimisation

The sensitivity analysis [39] was performed for two scenarios: before [16] and after land reclamation. In the first case, the weights for parameters A, S, T, and I were underestimated relative to the original weights proposed by Aller et al. [13]. The largest difference concerned the A and I parameters, around 4%, which corresponds to one point. The original weights were too high for the C, I, and R parameters. After land reclamation, there were significant changes. The A, S, T, and I parameters were still overestimated relative to the effective weights, but these were not large changes, while the effective weight of the D parameter appeared to be much more significant than before reclamation: it changed from 4.50 to 6.87 with an original weight of 5. The analysis shows that the new weights still indicate the same D and I parameters as the most significant in the vulnerability assessment with this variation in input parameters. In the initial assumptions, too much weight was given to the R and C parameters, for which the greatest overestimation was found. For parameter R, there was a decrease in weight from 3.64 to 2.85 with an original of 4, and for parameter C from 1.84 to 0.82 with an original weight of 3, making it the least relevant in the resulting dataset (Table 4).
Following the sensitivity analysis calculations, the DRASTIC index was recalculated using the resulting effective weights for the periods before and after land reclamation. The optimised DRASTIC index was related to the normalised values and classified into the same five classes as before. As a result of the optimisation, the area share of the different classes changed (Figure 6). In the variant before reclamation, there was a significant decrease in the share of the very low class. The increase in the share mainly concerned the low class (8%) and the high and moderate classes (about 3% each). In the post-reclamation variant, optimisation resulted in a significant decrease in the area of the low class from 44.54 to 18.73%, while the share of the moderate class (by about 16%) and high class (by about 8%) increased. When comparing the share of vulnerability classes of the optimised DRASTIC, the biggest differences are the decrease in the area occupied by the very high class (12%) and the high class (13) and the increase in the area of the moderate class (by 25%) (Table 5).

4. Discussion

This study focuses on the impact of land reclamation on groundwater vulnerability rather than solely assessing groundwater vulnerability in degraded coal mining areas. The research specifically examines how reclamation efforts alter hydrogeological conditions and influence the vulnerability index. This distinction is crucial for understanding the long-term environmental implications of land reclamation for groundwater protection. The vulnerability results after land reclamation were compared with those obtained by Krogulec et al. [16], determined under conditions before land reclamation, when the drainage system maintained the depression cone with the lowest hydraulic head at min. 222.5 m a.s.l. Reclamation will significantly affect all parameters of the DRASTIC method, with the most significant changes being the following:
D—lower depths to the water table resulting mostly in increases of three classes, and the formation of flooded areas.
R—a decrease in infiltration recharge from 158 mm/year to 119 mm/year on average due to the increased thickness of the vadose zone and its greater isolation by less permeable formations; mostly one class lower.
A—a change in the lithology of the aquifer; rebuilding the groundwater table will result in groundwater occurring in waste rock; mostly four classes lower.
S—completion of the formation of the land surface through the use of humus at the stage of technical reclamation will stimulate the formation of new soil types—initial soils, which were previously in areas without soil cover; mostly 2 classes lower.
T—a change in ground elevation from 225 to 255 m a.s.l. in the central part of the excavation; in the marginal parts, ground slopes reduce from >9% to 4%; mostly one class higher.
I—during the exploitation phase, the vadose zone assumed small thicknesses of the order of 0–5 m in the central part of the excavation and up to 20 m in the marginal parts; it was formed by sands and gravels; after reclamation, its thickness will decrease to max. 8 m and it will be formed by waste rock; mostly four classes lower.
C—the waste rock filling the excavation will be characterised by a significantly lower conductivity (<2 m/d) and will shape the flow rate in the newly formed aquifer, which results in mostly two classes lower.
The resultant layers of the vulnerability assessment during the exploitation and post-reclamation phases were compared with each other to quantify the changes (Figure 7). The range of changes shows that in some areas, there has been a decrease in vulnerability, i.e., the index difference takes on negative values, and in some areas, there has been an increase in vulnerability, expressed as positive values. The decrease in susceptibility applies to the reclaimed area, basically the central part of the area where the drainage systems were located. In total, this is about 67% of the area, which means that, in general, the adopted direction of reclamation will result in an increase in the protective capacity of the aquifer against the seepage of contaminants from the ground surface.
However, there will be an increase in vulnerability in approximately 33% of the area. These are areas in the western part that have been reclaimed and developed previously. There, the increase in vulnerability will occur mainly as a result of the groundwater table rising to the target level after the drainage system stops. The second area with an increase in vulnerability occurs in the south and northeast, where flood plains will form as a result of rising groundwater tables. In these areas, the increase in the vulnerability index occurs within a range of 0.2–0.4 to 0.6 at the maximum, meaning a change of at least one class or even two. The changes shown above relate to the results of the DRASTIC method using theoretical weights. The use of effective weights to optimise the results resulted in the described differences between the reclamation and exploitation phases being slightly smaller. The largest changes concern the areas with a decrease in vulnerability index in the range −0.2–0 in 45% of the area, while a larger area of increase in vulnerability was found, from 33% to 36%, which mainly concerns the floodplain area.
The optimisation procedure for the two phases of excavation pit development found different values for the effective weights obtained. For the mining period, the parameter D was determined to be overestimated with a weight of 4.5, while after reclamation, it was found to have an effective weight of 6.87. The second most significant parameter is still the influence of the lithology of the vadose zone with a value that changed from 5.82 to 5.51. In the case of the parameters R and C, the significant decrease in the effective weight should be associated with an increase in the weight of the parameter D. The parameters S and T remain the least changed and least significant.
The completion of exploitation and dewatering of an excavation pit is most often connected with the necessity to modify the existing groundwater-monitoring network, for the adaptation of the range and scope of observations to the new hydrogeological situation. Groundwater monitoring in the area of the reclaimed site should include the possibility of studies on both the quantitative and chemical status of the waters. Monitoring of the groundwater table level is particularly important in areas where flooding is possible. In this situation, a periodic lack of vadose zones and temporary saturation of waste rock with acid mine water may lead to increased dissolution or diffusion of chemicals from rocks and pore fluids and their further migration in the groundwater stream all the way to the drainage base [40,41,42].
It is recommended that areas with a high vulnerability index value and those regions for which an increase in the vulnerability index has been shown in relation to the period prior to land reclamation be subjected to special monitoring. For this purpose, a new organisation of the monitoring network was proposed (Figure 8), in which five piezometers were left, PZ-3, PZ-5, PZ-12, PZ-13, and PZ-14, as their location was convergent with the established monitoring objective. The monitoring network was supplemented by six new piezometers, Re6, Re7, Re8, Re9, Re10, and Re11, for proper monitoring of the western and southern parts of the study area. Justification for the location of the newly created piezometers is provided below.
Re6—The previously reclaimed and already developed western area should be observed for changes in groundwater table levels, which will be significant in this area. In addition, there may be strong chemistry transformations associated with the dissolution processes of waste rock minerals in the newly created saturation zone (formerly the vadose zone).
Re7–9—These are piezometers located in the zone of groundwater inflow to the drainage zone after the groundwater table has risen and the waste rock has been washed away. The location will facilitate the determination of whether there may be a change in surface water chemistry, particularly acidification and increased salinity.
Re10—The piezometer will allow the observation of groundwater levels and chemistry beneath the bottom of the municipal landfill, where there may be increased migration of contaminants specific to the landfill.
Re11—The piezometer will be located in a previously unmonitored area where a flooding area will be created within the river valley, resulting in the potential for direct overflow of water flowing through the bedrock into surface water.
The extent of groundwater chemical status investigations should be relevant to potential pollutants that may affect water quality in the monitored aquifer. In situ testing of indicator parameters such as pH, specific electrolytic conductivity, and redox potential is therefore necessary. The optimum range of laboratory testing should include pollution indicators such as sulphur compounds (S2−, SO42−), chlorides, sodium, and potassium, and the metals As, Hg, Pb, Ni, Cr, Cd, Zn, Fe, and Mn. These are the components most commonly found in leachates from rocks associated with coal mining [43,44].

5. Conclusions

An area of highly transformed hydrogeological environment associated with mining activities was used to study the natural vulnerability using the DRASTIC method, where all parameters can be dynamic due to changes over time. By defining changes in the factors describing hydrogeological and environmental conditions, it was possible to determine whether vulnerability in an area would decrease as a result of reclamation. The assessment carried out showed the following:
  • Reclamation will significantly affect all the parameters of the DRASTIC method. These will primarily be the following: a decrease in the depth to the water table, a decrease in the magnitude of recharge, the formation of groundwater flow in waste rock, the formation of new soil types, a decrease in land slopes, and a decrease in the value of the hydraulic conductivity. The largest changes involved a decrease in the number of D and T parameter classes after reclamation from eight to four. The largest areas were affected by changes in the A and I parameters, which were associated with a decrease in their values by four classes.
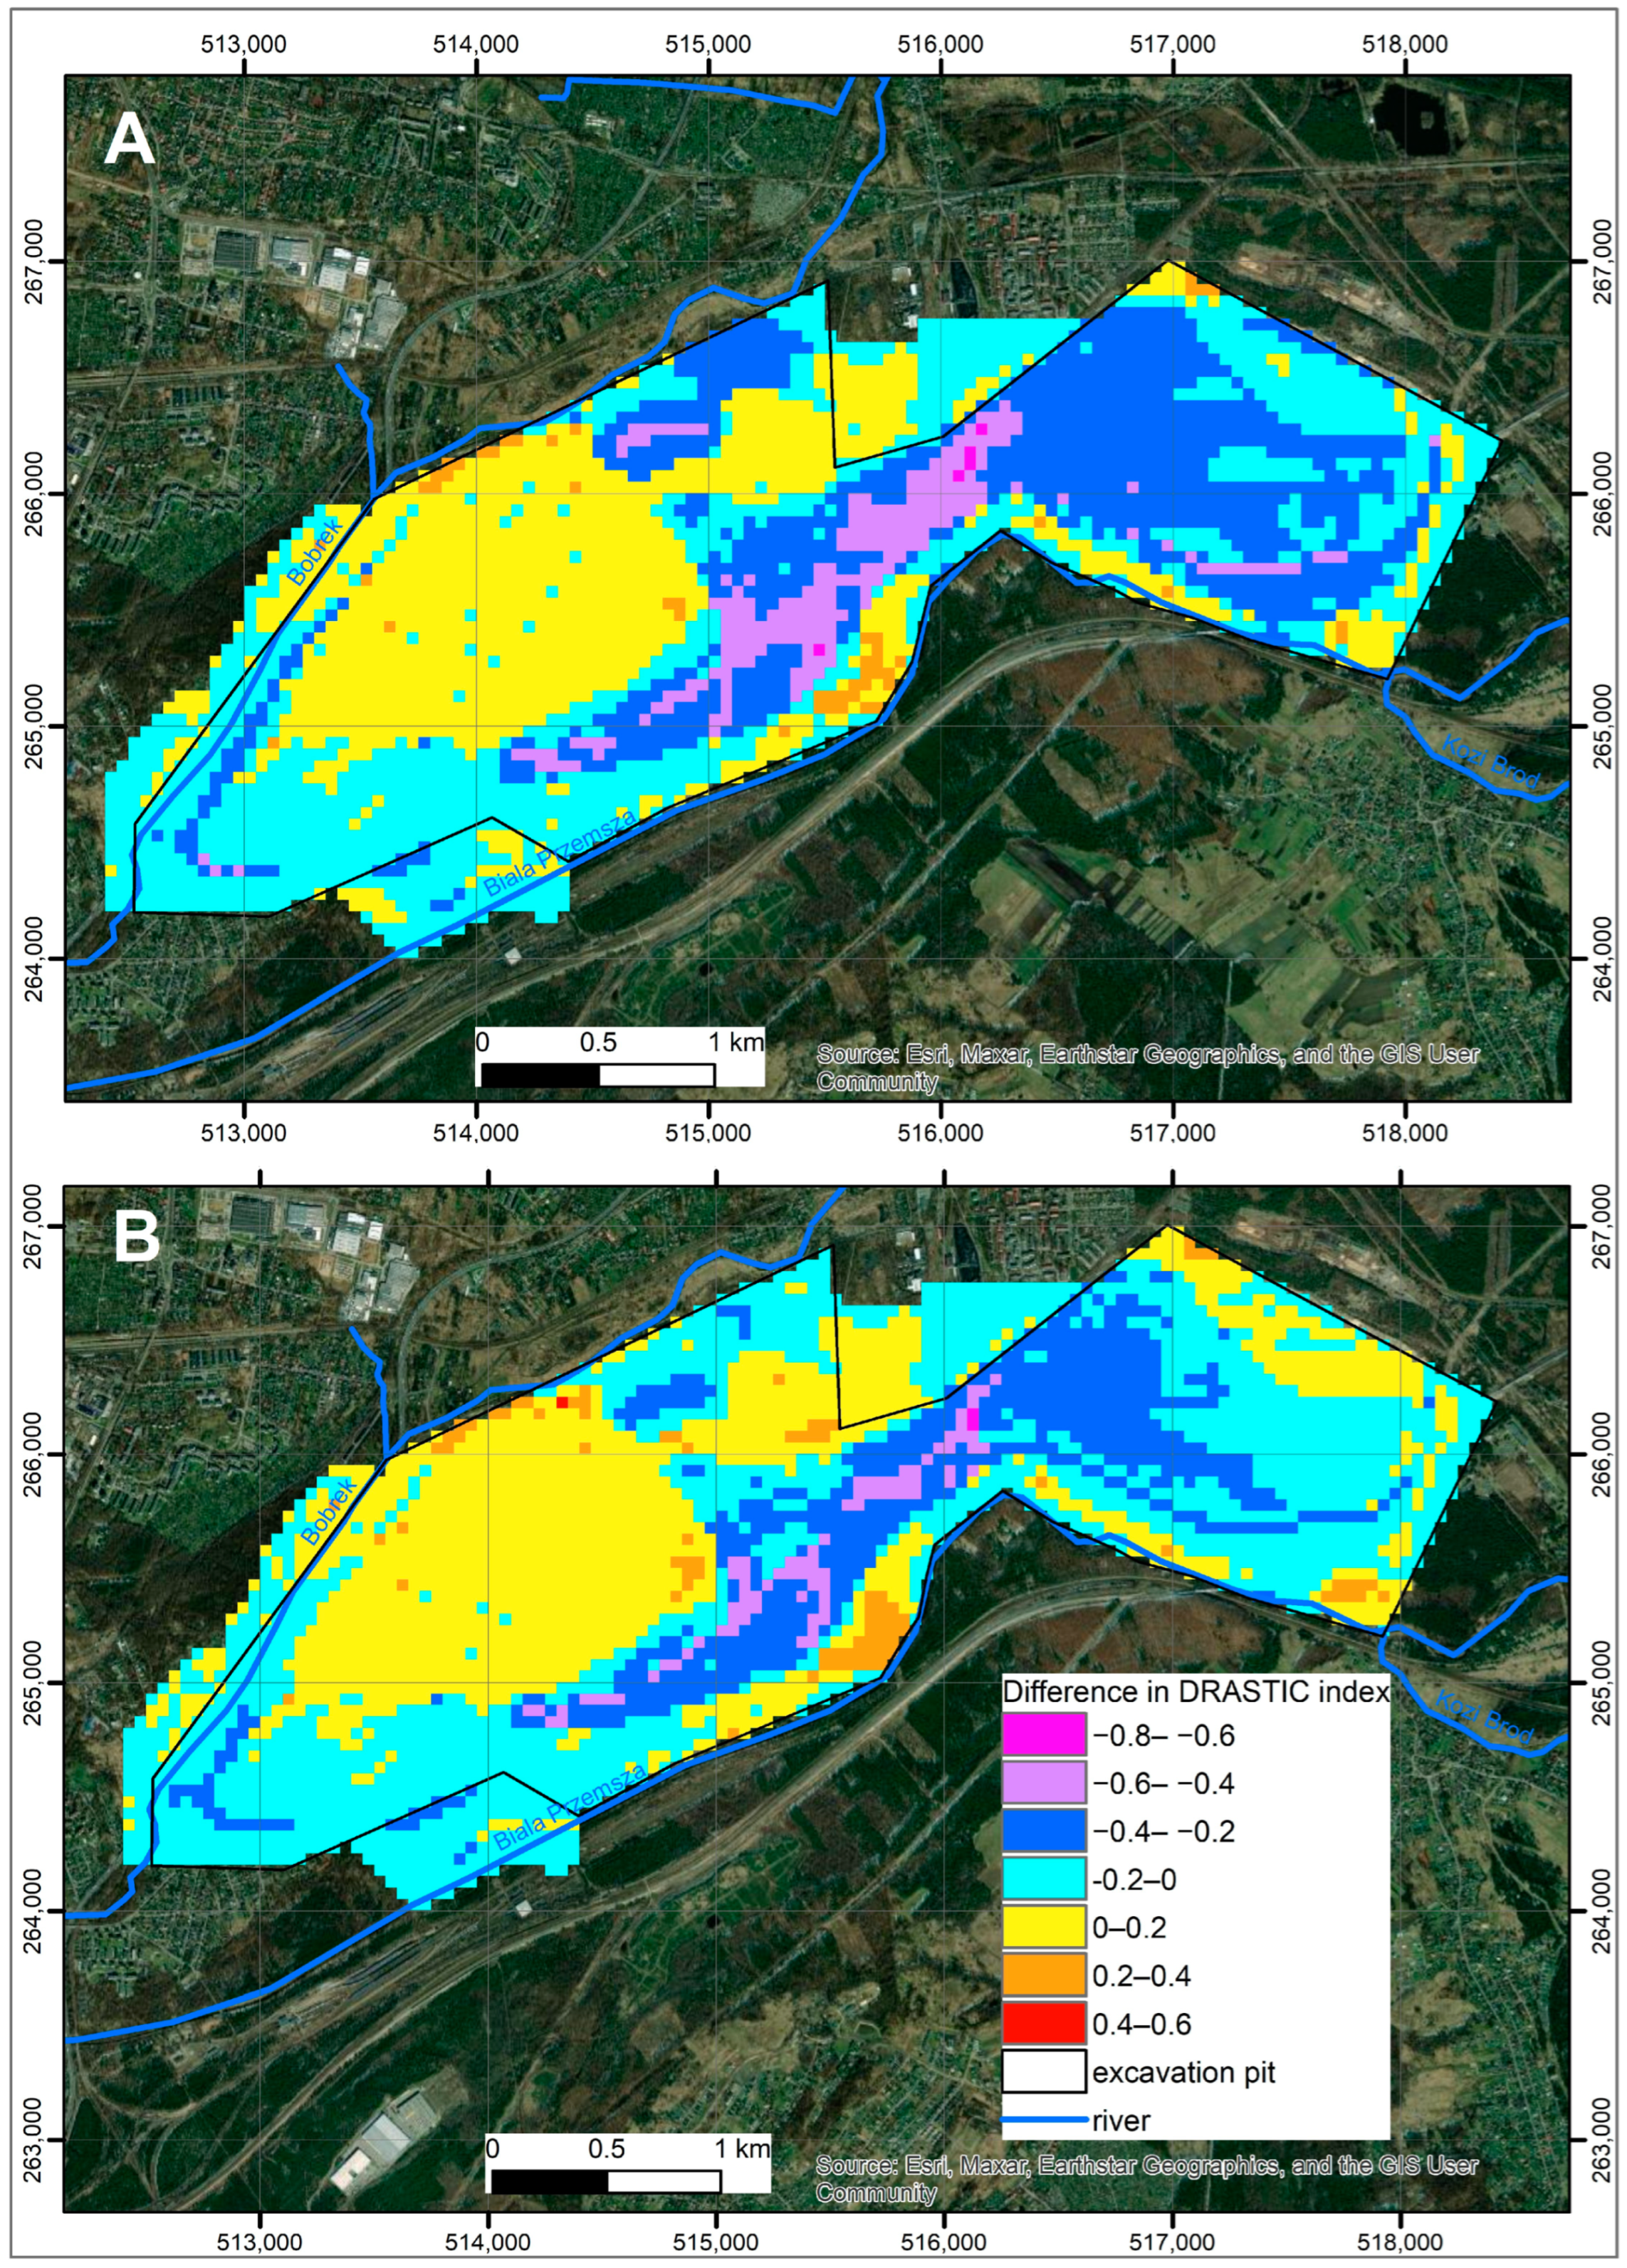
  • The extent of change in vulnerability in relation to the exploitation phase includes both a decrease and an increase in vulnerability. The decrease in vulnerability over approximately 67% of the area relates to the central part where the drainage systems are located. The adopted reclamation direction will result in a reduction in the risk of pollution seepage from the surface. For 31% of the area, there will be a reduction in the vulnerability index by at least one class, and for 6% by at least two classes.
  • There will be an increase in vulnerability in approximately 33% of the area, in previously reclaimed areas, and where floodings will form as a result of rising groundwater tables. In these areas, there will be a change of at least one class.
  • The optimisation procedure in the two development phases revealed different values for the effective weights obtained, indicating the need to recalculate them in each case for the subsequent variants. After the reclamation, it was found that the effective weight of the D parameter is significantly higher, while the S and T parameters remain the least changed and least significant.
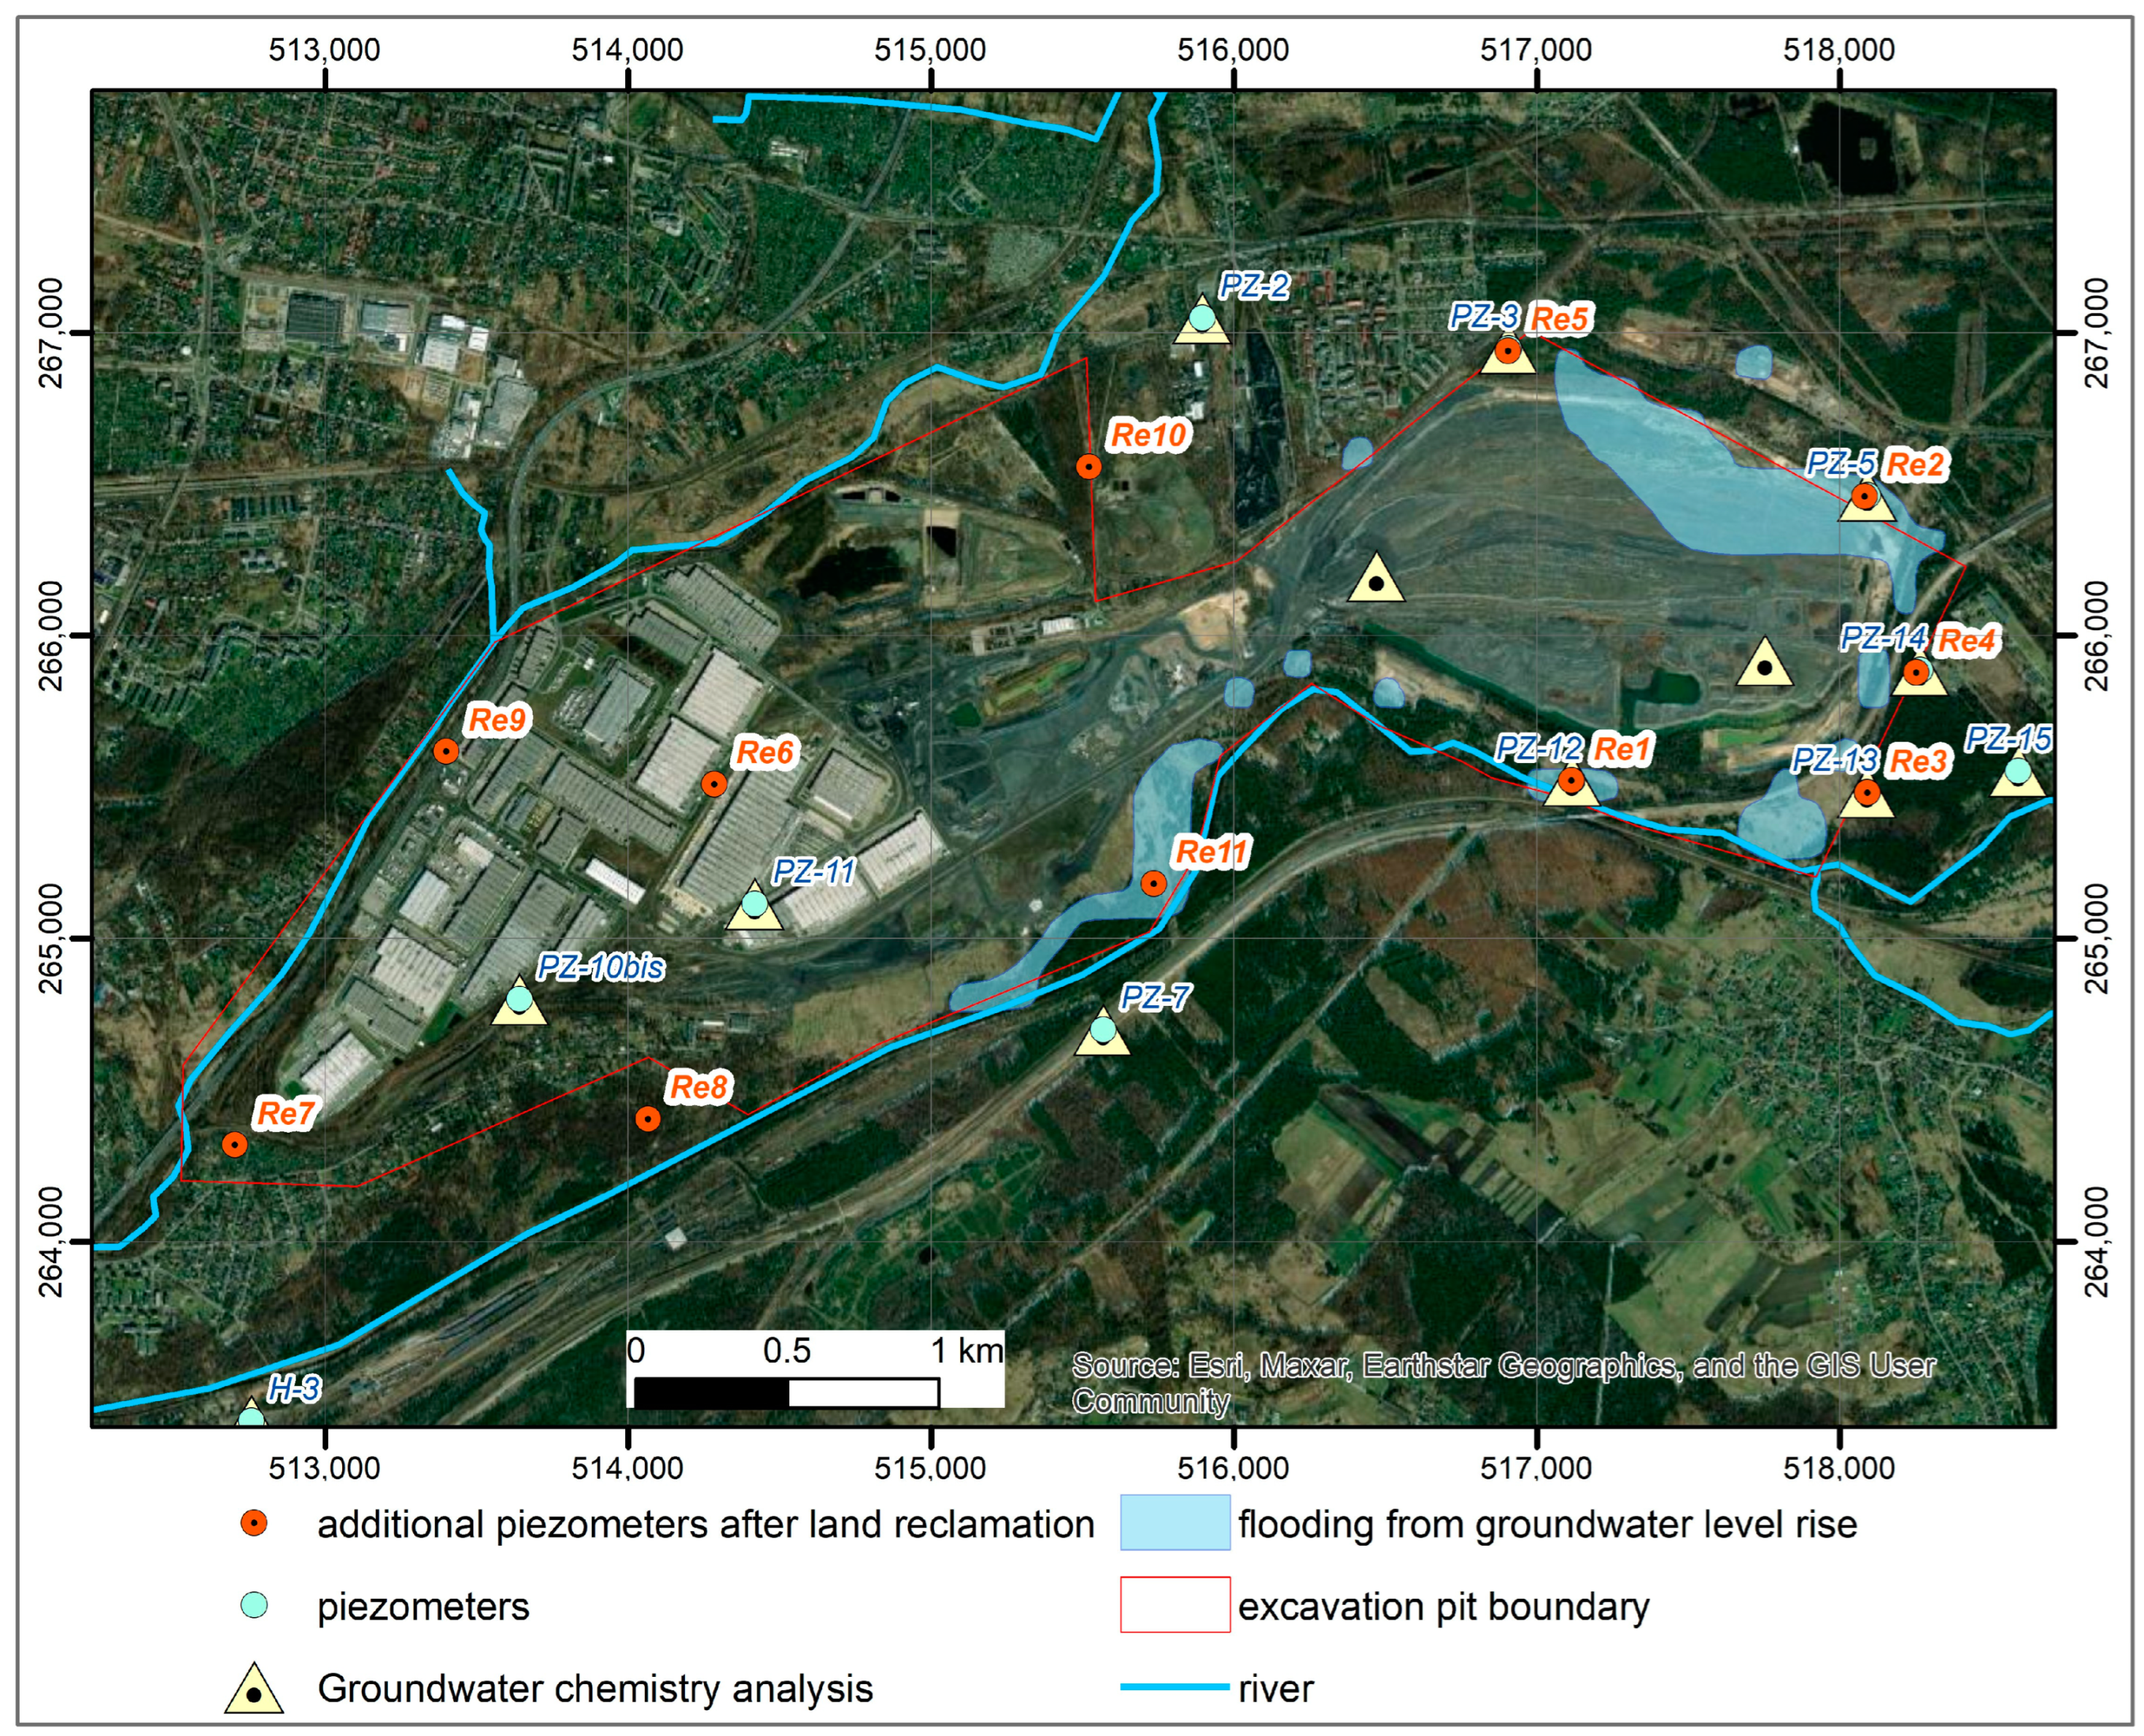
  • The planned reclamation requires modification of the existing groundwater-monitoring network. In the case under consideration, monitoring of the quantitative and chemical status of groundwater is particularly important in areas where flooding is possible, which may lead to increased dissolution or diffusion of chemicals from rocks and pore fluids and their further migration in the groundwater stream. A modification of the existing monitoring network is planned for this situation.

Author Contributions

Conceptualization, E.K., P.B., K.S., J.T. and S.Z.; Software, S.Z.; Validation, J.T. and S.Z.; Formal analysis, E.K., K.N., K.S., J.T. and S.Z.; Investigation, P.B., K.S., J.T. and S.Z.; Resources, P.B., K.N. and S.Z.; Data curation, K.N.; Writing—original draft, E.K. and S.Z.; Supervision, P.B. All authors have read and agreed to the published version of the manuscript.

Funding

This research was conducted as part of the statutory research of the University of Warsaw and Central Mining Institute-National Research Institute. No external funding was received for this study. The APC was covered by the University of Warsaw.

Data Availability Statement

The data used in this study are classified as geological information and are subject to legal restrictions in accordance with Polish legal regulation. Due to legal constraints, these data cannot be publicly shared. Additionally, other relevant data, were obtained from publicly available sources cited in the References Section.

Conflicts of Interest

The authors declare no conflict of interest.

References

  1. Britannica, The Editors of Encyclopaedia. “Land Reclamation”. Encyclopedia Britannica. 10 August 2023. Available online: https://www.britannica.com/science/land-reclamation (accessed on 26 June 2024).
  2. Powter, C. Glossary of Reclamation and Remediation Terms Used in Alberta; Government of Alberta: Edmonton, AB, USA, 2002; ISBN 0-7785-2156-7.
  3. Available online: https://rics-stage21.adobecqms.net/uk/en/modus/natural-environment/land.html (accessed on 26 June 2024).
  4. Geological and Mining Law. Act of 9 June 2011. Journal of Laws 2011, No. 163, Item 981. Available online: https://isap.sejm.gov.pl/DetailsServlet?id=WDU20110001050 (accessed on 10 January 2025).
  5. Act on Protection of Agricultural and Forestry Land. Act of 3 February 1995. Journal of Laws 1995, No. 16, Item 78. Available online: https://isap.sejm.gov.pl/DetailsServlet?id=WDU19950160078 (accessed on 10 January 2025).
  6. Bukowski, P.; Bromek, T.; Augustyniak, I. Using the DRASTIC system to assess the vulnerability of groundwater to pollution in mined areas of the upper Silesian Coal Basin. Mine Water Environ. 2006, 25, 15–22. [Google Scholar] [CrossRef]
  7. Witkowski, A.; Kowalczyk, A. Assessment of vulnerability to pollution or the degree of threat to groundwater in coal mining areas in the GZW. In Selected Problems of Geological and Hydrogeological Investigations for Mining and Energy Industries; Bukowski, P., Ed.; Wydawnictwo GIG: Katowice, Poland, 2012; pp. 107–121. [Google Scholar]
  8. Tiwari, A.K.; Singh, P.K.; De Maio, M. Evaluation of aquifer vulnerability in a coal mining of India by using GIS-based DRASTIC model. Arab. J. Geosci. 2016, 9, 438. [Google Scholar] [CrossRef]
  9. Góra, S.; Szczepański, A. Feasibility of selected methods for assessing vulnerability of the ground and water environment in the north-eastern part of the Upper Silesian Coal Basin. Biul. Państwowego Inst. Geol. 2009, 436, 115–120. [Google Scholar]
  10. Haque, E.; Reza, S.; Ahmed, R. Assessing the vulnerability of groundwater due to open pit coal mining using DRASTIC model: A case study of Phulbari Coal Mine, Bangladesh. Geosci. J. 2018, 22, 359–371. [Google Scholar] [CrossRef]
  11. Haładus, A.; Bukowski, P.; Krogulec, E. Assessment of groundwater vulnerability to pollution in the GZW area. Przegląd Gor. 2013, 1, 51–56. [Google Scholar]
  12. Bukowski, P.; Krogulec, E.; Haładus, A. Characterisation of the main area geotypes of groundwater vulnerability assessments. Przegląd Geol. 2020, 68, 226–232. [Google Scholar] [CrossRef]
  13. Aller, L.; Bennett, T.; Lehr, J.H.; Petty, R.J.; Hackett, G. DRASTIC: A Standardized System for Evaluating Ground Water Pollution Potential Using Hydrogeologic Settings; EPA-600/2-87-035, EPA; US Environmental Protection Agency: Washington, DC, USA, 1987.
  14. Singh, V.; Karan, S.; Samadder, S.R. Landfll site selection in a mining dominated area using a fuzzy AHP and DRASTIC vulnerability based multicriteria decision analysis: A case study of Dhanbad, India. Environ. Monit. Assess 2023, 195, 1172. [Google Scholar] [CrossRef]
  15. Karan, S.; Samadder, S.R.; Singh, V. Groundwater vulnerability assessment in degraded coal mining areas using the AHP–Modified DRASTIC model. Land Degrad. Dev. 2018, 29, 2351–2365. [Google Scholar] [CrossRef]
  16. Krogulec, E.; Bukowski, P.; Niedbalska, K.; Trzeciak, J.; Zabłocki, S. Groundwater vulnerability to pollution in degraded coal mining areas: Modifying the DRASTIC method using the factor of exploitation impact on land surface. Geol. Geophisics Environ. 2023, 49, 313–334. [Google Scholar] [CrossRef]
  17. Bromek, T.; Bukowski, P. Assessing the permeability of backfill materials used for mine shaft decommissioning. Przegląd Gor. 2002, 11, 18–23. [Google Scholar]
  18. David, K.; Timms, W.; Mitra, R. Groundwater Vulnerability and Pollution Risk Assessment; Imprint CRC Press: Leiden, The Netherlands, 2020; ISBN 9780367822927. [Google Scholar]
  19. Li, K.; Gu, Y.; Li, M.; Zhao, L.; Ding, J.; Lun, Z. Spatial analysis, source identification and risk assessment of heavy metals in a coal mining area in Henan, Central China. Int. Biodeterior. Biodegrad. 2018, 128, 148–154. [Google Scholar] [CrossRef]
  20. Fungaro, D.A.; Izidoro, J.C. Remediação da drenagem ácida de mina usando zeólitas sintetizadas a partir de cinzas leves de carvão. Quim Nov. 2006, 29, 735–740. [Google Scholar] [CrossRef]
  21. Civita, M. Le carte della vulnerabilità degli acquiferi all’inquinamento: Teoria e pratica. Quad. Tec. Prot. Ambient. Sez. “Prot. Acque Sotter. 1994, 31, 633–643. [Google Scholar]
  22. Wenyong, W.; Shiyang, Y.; Honglu, L. Groundwater Vulnerability Assessment and Feasibility Mapping Under Reclaimed Water Irrigation by a Modified DRASTIC Model. Water Resour. Manag. 2014, 28, 1219–1234. [Google Scholar] [CrossRef]
  23. Ghosh, A.; Tiwari, A.K.; Das, S. A GIS based DRASTIC model for assessing groundwater vulnerability of Katri Watershed, Dhanbad, India. Model. Earth Syst. Environ. 2015, 1, 11. [Google Scholar] [CrossRef]
  24. Kropka, J.; Witkowski, A.; Waligóra, J.; Rubin, H.; Kaźmierczak, J. Hydrogeological Documentation Defining Hydrogeological Conditions in Connection with the Alteration of the Dewatering for the Extraction of Sand in an Open Pit CTL Maczki-Bór S.A.; Unpublished Work; University of Silesia: Sosnowiec, Poland, 2013. [Google Scholar]
  25. Stupnicka, E. Regional Geology of Poland; Wydawnictwa Uniwersytetu Warszawskiego: Warszawa, Poland, 1997. [Google Scholar]
  26. Rubin, K.; Rubin, H.; Cabała, J. Expert Assessment of the Impact of Waste Used for Land Reclamation of the “Bór Wschód” Field on Groundwater Reservoirs, in Particular on the Chrzanów Reservoir (GZWP Chrzanów) at the Stage of Filling the Pit with Prognosis of Impact After Filling; University of Silesia, Faculty of Earth Sciences: Sosnowiec, Poland, 2006. [Google Scholar]
  27. Cudak, J.; Razowska-Jaworek, L.; Brodziński, I. GIS Database Hydrogeological Map of Poland in the Scale 1:50 000, Occurrence and Hydrodynamics, Sheet Jaworzno (944); Państwowy instytut Geologiczny—Państwowy Instytut Badawczy: Warszawa, Poland, 2005. [Google Scholar]
  28. Górnik, M. GIS Database Hydrogeological Map of Poland in the Scale 1:50 000, Occurrence and Hydrodynamics, Sheet Katowice (943); Państwowy instytut Geologiczny—Państwowy Instytut Badawczy: Warszawa, Poland, 2006. [Google Scholar]
  29. Gajowiec, B.; Siemiński, A. Hydrogeological Map of Poland on a Scale of 1:50 000; Sheet Jaworzno (944; incl. explanatory notes); Państwowy Instytut Geologiczny: Warszawa, Poland, 1997. [Google Scholar]
  30. Wagner, J.; Chmura, A. Hydrogeological Map of Poland in the Scale 1:50 000; Katowice Sheet (943; incl. explanatory notes); Państwowy Instytut Geologiczny: Warszawa, Poland, 1997. [Google Scholar]
  31. Niedbalska, K.; Haładus, A.; Bukowski, P.; Augustyniak, I.; Kubica, J. Modelling of changes of hydrodynamic conditions in the aqutic environment of the Maczki-Bór sand pit due to the fact of planned closure of mining operations (NE part of Upper Silesian Coal Basin—Poland). In Proceedings of the 11th International Mine Water Association Congress: Mine Water-Managing the Challenges, Aachen, Germany, 4–11 September 2011. [Google Scholar]
  32. Niedbalska, K. Forecasting the Hydrodynamic Effects of Open Pit Decommissioning by Example CTL Maczki-Bór. Doctoral Thesis, Główny Instytut Górnictwa, Katowice, Poland, 2022. [Google Scholar]
  33. Niedbalska, K.; Bukowski, P.; Haładus, A. Modelling of Changes in Groundwater Flow Conditions in the Vicinity of a Sublevel Tailings Storage Facility as a Tool for Verifying the Concept of Its Decommissioning and Protection of Waters Against Pollution; Krawiec, A., Jamorska, I., Eds.; Modele Matematyczne w Hydrogeologii: Toruń, Poland, 2014. [Google Scholar]
  34. Wilanowski, S. Detailed Geological Map of Poland in the Scale 1:50,000, Sheet 943—Katowice; Polish Geological Institute—National Research Institute (PGI-PIB): Warsaw, Poland, 2016. Available online: https://www.pgi.gov.pl/wydawnictwa-geologiczne-pig-pib/atlasy-i-mapy/434-szczega-mapa-geologiczna-polski-w-skali-150-000 (accessed on 11 January 2025).
  35. Kurek, S.; Paszkowski, M.; Preidl, M. Detailed Geological Map of Poland in the Scale 1:50,000, Sheet 944—Jaworzno; Polish Geological Institute—National Research Institute (PGI-PIB): Warsaw, Poland, 1991. Available online: https://www.pgi.gov.pl/wydawnictwa-geologiczne-pig-pib/atlasy-i-mapy/434-szczega-mapa-geologiczna-polski-w-skali-150-000 (accessed on 11 January 2025).
  36. IUNG. 2023. Available online: www.iung.pl (accessed on 11 January 2024).
  37. Available online: http://mapy.geoportal.gov.pl (accessed on 25 January 2024).
  38. GUGIK. 2023. Available online: www.gugik.gov.pl (accessed on 11 January 2024).
  39. Babiker, I.S.; Mohammed, M.A.A.; Hiyama, T.; Kato, K. A GIS—Based DRASTIC model for assessing aquifer vulnerability in Kakamigahara Heights. Gifu Prefecture central Japan. Sci. Total Environ. 2005, 345, 127–140. [Google Scholar] [CrossRef]
  40. Bauerek, A.; Bebek, M.; Frączek, R.; Paw, K.; Kasperkiewicz, W. Variability in chemical composition of acidic surface runoff water from an active mining waste heap representing sediments. Przegląd Geol. 2017, 65, 450–458. [Google Scholar]
  41. Wang, X.; Gao, Y.; Jiang, X.; Zhang, Q.; Liu, W. Analysis on the Characteristics of Water Pollution Caused by Underground Mining and Research Progress of Treatment Technology. Adv. Civ. Eng. 2021, 2021, 9984147. [Google Scholar] [CrossRef]
  42. Adamovic, D.; Ishiyama, D.; Kawaraya, H.; Ogawa, Y.; Stevanovic, Z. Geochemical characteristics and groundwater pollution in mining areas. Groundw. Sustain. Dev. 2022, 16, 100719. [Google Scholar] [CrossRef]
  43. Sarga-Gaczyńska, M. Dynamics of Pollutant Load Generation at Mining Waste Sites and Its Impact on the Aquatic Environment. Doctoral Dissertation, AGH, Kraków, Poland, 2007; p. 157. Available online: https://winntbg.bg.agh.edu.pl/rozprawy/9935/full9935.pdf (accessed on 11 January 2025).
  44. Nordstrom, D.K. Baseline and premining geochemical characterization of mined sites. Appl. Geochem. 2015, 57, 17–34. [Google Scholar] [CrossRef]
Figure 1. Location of the study area and its pre-Quaternary geology on the background of World Imagery (July of 2024) [26].
Water 17 00702 g001
Figure 2. Groundwater contours based on groundwater flow modelling results [31,32]: (A) during excavation pit dewatering; (B) after land reclamation.
Water 17 00702 g002
Figure 3. Changes in parameter class of DRASTIC method after land reclamation scenario.
Water 17 00702 g003
Figure 4. Class changes after reclamation.
Water 17 00702 g004
Figure 5. DRASTIC index: (A) before land reclamation; (B) after land reclamation.
Water 17 00702 g005
Figure 6. Optimised DRASTIC index: (A) before land reclamation; (B) after land reclamation.
Water 17 00702 g006
Figure 7. Difference in vulnerability index between the end of reclamation and the exploitation phase: (A) DRASTIC with original weights; (B) DRASTIC with effective weights.
Water 17 00702 g007
Figure 8. Proposition of groundwater-monitoring network modification after land reclamation.
Water 17 00702 g008
Table 1. DRASTIC parameter sources.
During Mining StageAfter Land Reclamation
D—Depth to groundwaterGroundwater flow scenario modelling studies developed by Niedbalska et al. [31,33] and Niedbalska [32]Groundwater flow scenario modelling studies developed by Niedbalska et al. [31,33] and Niedbalska [32]
R—RechargeGroundwater flow scenario modelling studies developed by Niedbalska et al. [31,33] and Niedbalska [32]Groundwater flow scenario modelling studies developed by Niedbalska et al. [31,33] and Niedbalska [32]
A—Aquifer mediaGeological descriptions of lithological units from the detailed geological map of Poland [34,35] and cross-sections [24].Reclamation project [24]
S—SoilMap of soil genetic types at the scale of 1:500,000 [36], the detailed geological map of Poland at the scale of 1:50,000 [34,35] and analysis of a high-resolution orthophotomap [37]After the technical land reclamation phase, the assumption was made that the landfill would be built by initial soils, and the rest of the area could slightly be changed based on reclamation projects [24] and future land use changes
T—TopographyDigital Elevation Model—DEM raster (Head Office of Geodesy and Cartography [38])Digital Elevation Model—DEM raster (Head Office of Geodesy and Cartography [38]) supplemented by projected DEM based on reclamation project [24]
I—Impact of vadose zoneThe detailed geological map of Poland at the scale of 1:50,000 [34,35], profiles of piezometers from the observation network in the excavation pit, and hydrogeological cross-sections [24]Reclamation project [24]
C—ConductivityGroundwater flow scenario modelling studies developed by Niedbalska et al. [31,33] and Niedbalska [32]Groundwater flow scenario modelling studies developed by Niedbalska et al. [31,33] and Niedbalska [32]
Table 2. Changes in parameter classes.
ParameterClass Range Before ReclamationClass Range After ReclamationClass Difference Value After ReclamationArea [ha]Area [%]
D3–107–10−10.750.08
024.252.75
1104.511.84
220523.22
3230.7526.14
4215.524.41
5697.82
6333.74
R2–103–10−682.259.32
−534.753.94
−429.53.34
−3153.2517.36
−23.750.42
−1226.7525.69
0108.512.29
122225.15
291.02
38.250.93
40.250.03
52.250.25
72.250.25
A2–102–10−4125.7514.25
−2120.513.65
0629.2571.28
27.250.82
S3–103–10−63.750.43
−5121.36
−43.50.40
−316.51.88
−2174.2519.81
−121.52.44
0512.558.26
168.57.79
28.750.99
322.752.59
43.750.43
5151.71
6171.93
T1–107–10−22.250.25
−135.54.02
0225.7525.57
115617.67
210511.89
359.256.71
452.55.95
545.255.13
635.253.99
738.254.33
8424.76
985.759.71
I2–102–10−498.511.16
−313.251.50
−20.250.03
−10.250.03
0710.2580.46
118.752.12
224.52.78
30.250.03
416.751.90
C2–71–7−64.50.51
−522.752.57
−4106.2512.03
−317219.47
−2334.7537.89
−125.252.86
0152.7517.29
141.54.70
223.252.63
30.50.06
Table 3. Vulnerability class area of DRASTIC before and after land reclamation.
Normalised Index, Vulnerability ClassClass Area for DRASTIC Before Reclamation [%]Class Area for DRASTIC After Reclamation [%]Change of Class Area
0.0–0.2, very low10.92.35−8.55
0.2–0.4, low11.144.5433.44
0.4–0.6, moderate22.527.424.92
0.6–0.8, high38.620.01−18.59
0.8–1.0, very high16.95.69−11.21
Table 4. Theoretical and effective weights of the DRASTIC parameters.
ParameterTheoretical WeightEffective Weight Before Land ReclamationEffective Weight After Land Reclamation
[-][%][-][%][-][%]
D521.744.5019.586.8728.85
R417.393.6415.812.8511.96
A313.043.9817.303.5014.72
S28.702.119.192.018.45
T14.351.114.821.446.05
I521.745.8225.315.5123.15
C313.041.847.990.823.46
Table 5. Vulnerability class area of optimised DRASTIC before and after land reclamation.
Normalised Index, Vulnerability ClassClass Area for Optimised DRASTIC Before Reclamation [%]Class Area for Optimised DRASTIC After Reclamation [%]Change of Class Area
0.0–0.2, very low2.41.98−0.42
0.2–0.4, low19.118.73−0.37
0.4–0.6, moderate17.843.2125.41
0.6–0.8, high41.728.49−13.21
0.8–1.0, very high19.07.58−11.42
Disclaimer/Publisher’s Note: The statements, opinions and data contained in all publications are solely those of the individual author(s) and contributor(s) and not of MDPI and/or the editor(s). MDPI and/or the editor(s) disclaim responsibility for any injury to people or property resulting from any ideas, methods, instructions or products referred to in the content.

