Abstract
The Weining Plain is in the semi-arid northwest region of China, with groundwater as its main source for various purposes. This research provided a detailed investigation into the groundwater exploitation status in the Weining Plain, analyzed the groundwater quality for different purposes, and estimated the groundwater recharges using water budget analysis with end member mixing analysis. The entropy water quality index was applied to assess the overall quality of drinking water, and the industrial water quality index and several agricultural water quality indicators were used for the assessment of groundwater quality for industrial and agricultural uses. The findings showed that the groundwater recharge in the research area primarily comes from irrigation infiltration and leakage of the irrigation canal system which account for approximately 50–60% of the total groundwater recharge. The overall drinking water quality is poor, with over 80% being of moderate to poor quality and requiring treatment. A large proportion of the groundwater in the research area is suitable for irrigation. However, groundwater has a corrosive effect on boilers, and there is a high risk of boiler scaling and foaming. Only 12.41% of the water samples have good water quality for industrial use, and the treatment of the water quality for industrial uses is needed. This study can help local decision-makers understand the availability of groundwater resources in the Weining Plain and manage groundwater resources reasonably.
1. Introduction
In arid and semi-arid regions, groundwater and surface water play an irreplaceable and crucial role. They serve as an important source of water for agricultural irrigation and drinking water supply, which strongly guarantees food and water security in these regions [1]. Groundwater quality is relatively cleaner and safer compared to surface water, and it can be used for a variety of applications including potable, industrial, and agricultural uses [2,3]. However, China’s freshwater resources are scarce in terms of groundwater quality and quantity in arid regions, and managing groundwater resources effectively is needed to safeguard the fragile natural balance in these areas. Owing to the negative effects of human activities on the environment, soil pollution can occur, which in turn has an impact on the groundwater quality [4]. Unscientific groundwater utilization and management have also caused environmental problems such as groundwater pollution, groundwater over-exploitation, groundwater depletion, ground subsidence and ground fissures, seawater intrusion, soil secondary salinization, and desertification [5], all of which are constraining the economic and social sustainability.
To cope with the above-mentioned disastrous groundwater-related problems, many governments, organizations, and individual scientists around the world have put their effort into finding solutions or establishing legislative frameworks in the hope that these problems could be totally solved or at least partially alleviated. Many scholars studied the impacts of climate change on groundwater resources. For instance, Cheng et al. [6] utilized a coupled distributed hydrological model to evaluate the impact that climate change has on the process of groundwater recharge in the inland river basins of northwest China. They found that significant increases in precipitation and runoff have led to a pronounced increase in groundwater recharge over the past 50 years. Similarly, Ashraf et al. [7] used a SWAT hydrological model to investigate the groundwater recharge in the Lower Ravi River Basin (LRRB) of Pakistan, and their research indicated that the measure of groundwater recharge showed fluctuations in relation to climate changes. Green et al. [8] further emphasized that climate change significantly alters precipitation patterns and evaporation rates, thereby affecting groundwater recharge processes globally. To understand and ensure the sustainability of groundwater resources and manage them reasonably, some scholars have estimated the recharge of regional groundwater. Cook et al. [9] used a four terminal mixed analysis to distinguish the concepts of environmental groundwater, circulating groundwater, river recharge, etc., in order to estimate the recharge of the circulating groundwater. Nina et al. [10] used isotope profiling to study the water flux through permeable zones and the consequent groundwater recharge in the Mediterranean mountainous area. There are also some scholars focusing on the effects of human activities on groundwater. For instance, Chuko and Abdissa [11] studied the effects of land cover and climate variability on groundwater using the Wet Spas model. Shen et al. [12] and Post et al. [13] also evidenced that mining and industrial activities would influence groundwater quality. Foster and Chilton [14] highlighted the global significance of aquifer degradation due to human activities, particularly the impact of agricultural practices on groundwater quality through the excessive use of fertilizers and pesticides. The World Health Organization (WHO) formulated the Water Safety Plan (WSP) to remove health risks from drinking water by applying a comprehensive approach to assessing and managing risk, which has obtained worldwide approval. Many scholars have also evaluated groundwater quality and risks related to human health. For example, Wang and Li [15] conducted risk assessments on water quality and human health of groundwater in Hua County, China during the rainy and dry seasons. The results revealed that the area with poor water quality gradually increased, and the level of health risk in the dry season was higher than in the rainy season. Subba Rao et al. [16] evaluated the groundwater quality in rural areas of India and assessed the potential risks of groundwater to human health using a health risk model. All these studies will be helpful in groundwater protection and management. However, most studies only focus on a single aspect of groundwater issues (such as only considering water quality or recharge) or rarely use multiple methods for comprehensive analysis. This study considered these two limitations and conducted a more comprehensive study on the water quality and recharge situation in the study area by integrating multiple methods.
Formed by the Yellow River, the Weining Plain is the second-largest alluvial plain within Ningxia, China. Situated in the upper reaches of the Yellow River, aquifer media in this area feature high permeability, making groundwater vulnerable to external contamination. This area is a key development region along the Yellow River. These years, many industrial plants have been introduced into this area, bringing along huge groundwater demand and serious groundwater pollution. In addition, as a main irrigation farming area in Ningxia, the Weining Plain also faces extensive and intensive agricultural activities, imposing more stress on groundwater. Therefore, regional groundwater analysis and assessment can help understand the availability of groundwater resources and manage the groundwater system reasonably. The purposes of this research are (1) to assess the groundwater quantity by estimating groundwater recharge and (2) to assess the suitability of groundwater for drinking, irrigation, and industrial purposes. This study will be beneficial to local policymakers in terms of regional groundwater conservation and governance, and it will also draw the attention of international academics conducting comparable research.
2. Materials and Methods
2.1. Study Area
2.1.1. Location and Climate
The Weining Plain is in the central and western part of the Ningxia Hui Autonomous Region (Figure 1). It is in the east longitude 105°00′00″–105°58′00″ and north latitude 37°2′00″–37°47′00″, covering about 1008 km2 [17]. The Yellow River crosses the plain from southwest to northeast. Geographically, it has a topography that is elevated in the west and low in the east, high in the north and south and low in the center. The alluvial plain is distributed on both sides of the Yellow River and extends as a belt [17,18]. The research area possesses a continental monsoon climate where rainfall is relatively limited and evaporation is high. The annual average temperature and rainfall are 8.9 °C and 179.4 mm, respectively. Rainfall predominantly occurs in the months of June to September and accounts for about 74% of the annual rainfall. Annually, the average evaporation is 1828.6 mm.
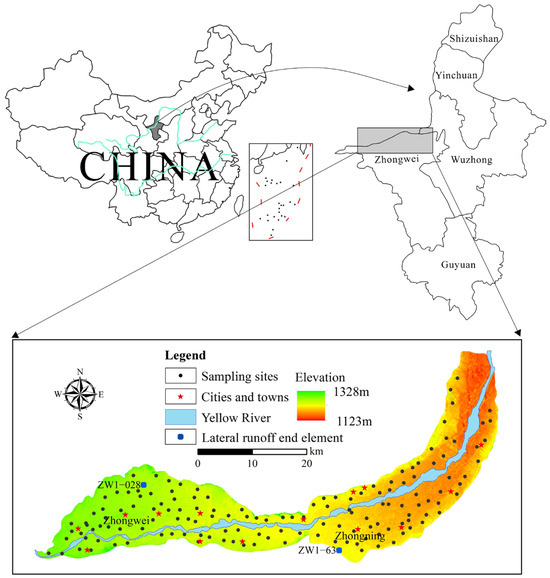
Figure 1.
Location of the study area and groundwater sampling points.
2.1.2. Hydrogeological Settings
As a Yellow River alluvial plain, the Weining Plain has accumulated a substantial thickness of loose fluvial sediments since the Quaternary period. These sediments generally exhibit unconformable or pseudo-conformable interaction with the underlying strata [19]. For the study area, groundwater predominantly flows from the northern and southern margins to the central Yellow River. Regionally, groundwater to the north of the Yellow River runs from northwest to southeast, yet to the south, runs from southwest to northeast (Figure 2) [19,20].
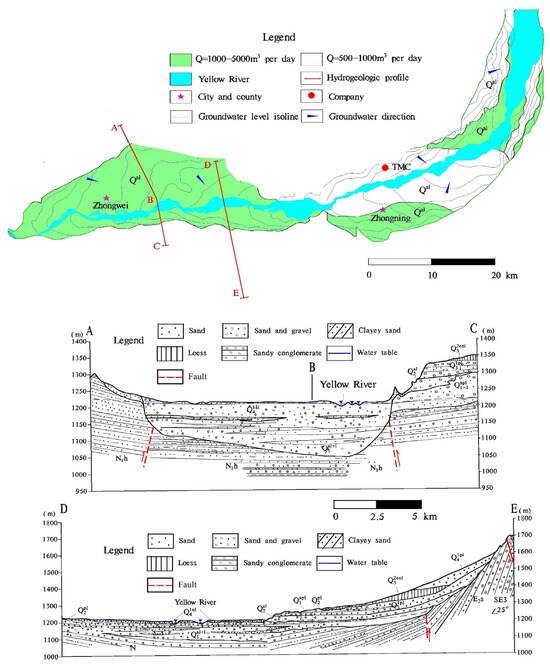
Figure 2.
Hydrogeological map and cross-sections.
The groundwater level depth in the low hills of the northern part of the study area ranges from 5.0 to 30 m, while in most areas of the alluvial plains, the water level depth is less than 5.0 m. The alluvial aquifer on the north bank of the Yellow River has strong permeability, with a hydraulic conductivity of 6–12 m/d; The hydraulic conductivity of the alluvial aquifer on the south bank is 5.5–8.5 m/d, and the permeability gradually decreases from upstream to downstream on both banks of the Yellow River [20]. The groundwater flow rate in the plain is approximately 0.028–0.060 m/d.
The Yellow River alluvial plain in the central part of the study area features highly productive aquifers characterized by substantial thickness, loose lithology, and abundant recharge sources [20]. The estimated specific yield of the single well in the Zhongwei Plain (the western portion of the study area) ranges from 199.58 to 4845.31 m³/day, while in the Zhongning Plain (the eastern portion of the study area), the water yield of a single well is within the range of 946–6781 m3/day. The phreatic aquifer’s thickness is in the range of 6–48 m, with the depth of the water table ranging from 1–5 m. The groundwater table depth exhibits a declining trend with the Yellow River approaching. The aquifer lithology predominantly consists of clayey sand, fine sand, gravel, and pebbles, providing favorable conditions for the infiltration of both irrigation water and rainfall.
Groundwater recharge within the Weining Plain mostly stems from several sources, including atmospheric precipitation infiltration, lateral runoff from the northern and southern mountainous areas, river water percolation, agricultural irrigation infiltration, and canal water leakage. Among these, irrigation water infiltration and canal water leakage account for around 60% of the total groundwater recharge. Due to prolonged irrigation practices, the groundwater table depth in the Weining Plain is relatively shallow, causing evaporation to be a substantial means of phreatic water discharge. In addition to evaporation, phreatic water also discharges into drainage ditches and the Yellow River within the plain. Furthermore, with the advancement of industrial modernization and urbanization, artificial groundwater extraction has become an increasingly notable discharge pathway [20]. The hydrogeological profile of the Weining Plain is illustrated in Figure 2.
2.2. Data Collection and Analysis
During the investigation, 145 groundwater samples were collected from hand-pumped wells and boreholes. During sample collection, containers were washed 3 to 4 times by the water to be sampled. Sample locations were recorded with a portable GPS, and the positions are shown in Figure 1.
After collection, they were immediately fixed with buffer solutions and sealed to avoid exposure to air. After that, they were shipped to the lab and placed in fridges at 4 °C until analysis. The sampling approach, procedures, and preservation conformed to the standards [21]. The pH was measured on-site by a portable pH meter (CT-6023, Shenzhen Kodida Electronics Co., Ltd., Shenzhen, China), while other parameters were analyzed at the laboratory of Ningxia Environmental Monitoring Center. The standard analytical methods recommended by the Ministry of Health of PRC and the Standardization Administration of PRC were followed [22]. Na⁺ and K⁺ were analyzed using a flame photometer, and the titrimetric method was applied to measure Ca2+, Mg2+, total hardness (TH), and HCO3−. Total dissolved solids (TDS) were measured gravimetrically after drying at 180 °C. NO3-N, SO42−, Cl−, and F− were determined via ion chromatography; NH4-N and NO2-N were determined by spectrophotometry; and trace metals (Cu, Al, Mn, Zn and Cr6+) were analyzed by ICP atomic emission spectrometry (ICAP6300, Thermo Fisher Scientific, Waltham, MA, USA).
18O was analyzed using the CO2 equilibrium method, and 2H was measured using the zinc reduction method. The measurement results are conveyed as the deviation from the V-SMOW standard [23] (Equation (1)). Test accuracy for δ18O and δ2H were ±0.9‰ and ±0.2‰, respectively.
where, R is the ratio of 18O/16O or 2H/H in the sample and standard.
To guarantee data accuracy, the percentage of ion charge balance error (%CBE) was used to test the reliability of the analyses (Equation (2)). The calculations revealed that the %CBE of all samples was between −3.09% and 2.96%, indicating accurate and reliable physicochemical analyses.
where %CBE is the percentage of ion charge balance error, and TC and TA are total cation concentration and total water anion concentration.
2.3. Estimation Method for Groundwater Recharge
This study mainly used groundwater budget calculation (groundwater balance analysis) and end member mixing analysis method to evaluate the groundwater recharge.
2.3.1. Water Balance Analysis
Based on the analysis of the groundwater recharge and discharge in this area over multiple years, the groundwater budget equation can be set up as Equation (3).
where μ represents the specific yield of the phreatic aquifer, F denotes the recharge area, and Δh is the change in groundwater level within the period of Δt. Qrecharge is the total groundwater recharge, and Qdischarge is the total amount of groundwater discharged.
2.3.2. End Member Mixing Analysis (EMMA)
EMMA was originally proposed by Christophersen et al. [24] and Hooper [25]. It has become a widely used method for quantifying the rates at which different recharge sources contribute to groundwater, e.g., [26]. This method operates under the following assumptions: (1) groundwater represents a mixture of multiple water sources, (2) the groundwater mixing process is nonlinear and driven by hydrodynamic forces, (3) the tracers used possess conservatism, and (4) different recharge sources exhibit distinct tracer concentrations.
Conservative tracers such as chlorides and stable isotopes of hydrogen and oxygen were employed in this research to gauge the contributions of diverse recharge sources to groundwater. In the Weining Plain, the principal groundwater recharge sources are the Yellow River (irrigation and canal leakage both originate from the Yellow River), atmospheric precipitation, and lateral runoff. Therefore, these sources are represented as three end members in the analysis: Yellow River water recharge (Yw), precipitation infiltration (p), and lateral runoff recharge (l). The end member mixing analysis equations are described as Equations (4)–(6):
where, fYw, fp, and fl are the proportions of recharge from the Yellow River, precipitation, and lateral runoff, respectively.
If groundwater samples are within the triangle formed by Yellow River water, precipitation, and lateral runoff, the groundwater comes from the mixing of these three sources. But if a sample is outside, it’s mainly recharged by two sources, with little or no input from the third. Then, draw a new triangle by linking the sample point (a “special point”) outside the first triangle to the two closest sources. To find the contribution rates of these two sources, draw a perpendicular from the special point to the line between the two chosen sources. The contribution rates are inversely related to the distances from the perpendicular to each source.
2.4. Methods for Drinking Water Quality Assessment
This research applies the entropy-weighted water quality index (EWQI) to achieve overall water quality evaluation. By objectively weighing hydrochemical parameters, this method can transform large water quality datasets into comprehensive water quality scores [27]. It has five steps: first, construct an initial matrix relying on the physical and chemical data of the water sample. And carry out standardization processing, paying attention to the differences in units and orders of magnitude of each indicator. Next, calculate and utilize information entropy to obtain the weights of each indicator. Then calculate the quality evaluation scale qj for parameter j. The final step is to determine the numerical value of EWQI. This method determines the weights of various water quality parameters through information entropy, reducing the influence of human subjectivity and making the evaluation results more objective and scientific. Figure 3 illustrates the processes of calculating the EWQI.

Figure 3.
Procedures of EWQI in water quality assessment.
By the EWQI method, groundwater quality is categorized into the subsequent five levels listed in Table 1 [15,28]:

Table 1.
Water quality classifications standard based on EWQI.
2.5. Methods for Irrigation Water Quality Assessment
The chemical components present in irrigation water sources must be maintained within the recommended standards; otherwise, it may lead to a decrease in crop yield and soil structure degradation. When there are significant changes in the quality indicators of certain irrigation water, it is advisable to evaluate these indicators to determine whether they are suitable for irrigation. These indicators include sodium percentage (Na%), sodium adsorption rate (SAR), residual sodium carbonate (RSC), permeability index (PI), etc. The equations for these indicators are (Equations (7)–(10)) [29,30,31,32]:
where all ions are expressed in meq/L. The indicators introduced above all represent the possible sodium hazard by irrigation. But irrigation can also induce a salinity hazard, and a salinity hazard is usually assessed by TDS. When the TDS content in irrigation water is above a certain limit, the irrigation water can lead to a salinity hazard (Table 2).
Table 2.
Classification standards for irrigation water quality.
2.6. Methods for Industrial Water Quality Assessment
The water quality requirements for industries vary considerably between areas, industrial types, and processes [33]. Therefore, a comprehensive water quality assessment for industrial uses is hard to achieve. In this study, groundwater quality was primarily appraised for industrial boiler use. The scale effect is assessed with the total scale (H0) and a hard scale coefficient (Ki), and corrosion is usually assessed with a corrosion coefficient (Kc). The foaming effect was assessed using the foaming coefficient (F), which can be calculated as Equations (11)–(13) [34,35].
where Hn is the amount of hard scale, and SS and C represent the amounts of suspended substances and colloids, respectively. All ions in the equations are meq/L. Table 3 shows the classification of water according to the above indices.
Table 3.
General boiler water quality evaluation index.
In addition, the industrial water quality index (IndWQI) was adopted to assess the overall industrial water quality. It can be computed by Equations (14)–(16) [35].
where, i is the number of physicochemical and chemical parameters (1, 2, …n); j is the number of the factors/components calculated using principal component and factor analysis (1, 2, …k); Wi symbolizes the integrated weights considering the contribution of each physicochemical parameter and suitability coefficient calculated using Equations (11)–(13); Fj indicates the eigenvalue of component j, Li denotes the loading (in absolute value) of parameter i by component j; Qi is the water quality assessment scale; ca denotes the actual value of the parameter; vi is the ideal value, vs is the guideline value. All guideline values are taken from the National Standard of the People’s Republic of China (GB/T 1576-2018) [36] and references [35,37,38,39].
Based on the IndWQI results, industrial water quality can be finally classified as follows: IndWQI < 50 is excellent, 50 ≤ IndWQI < 100 is good, 100 ≤ IndWQI < 150 is poor, 150 ≤ IndWQI < 200 is extremely poor, and IndWQI > 200 is unsuitable.
3. Results and Discussion
3.1. Status of Groundwater Utilization in the Weining Plain
There are generally two groundwater exploitation modes in the Weining Plain: centralized abstraction and distributed groundwater exploitation. Centralized groundwater abstraction includes the exploitation of public groundwater sources and from centralized motor-pumped wells owned by industrial enterprises [20]. Distributed groundwater exploitation refers to groundwater exploitation through self-owned hand-pumping wells for domestic use in rural areas and through distributed motor-pumped wells for agricultural use over the entire plain. Based on the investigation, total groundwater exploitation over the plain is 8703.5 × 104 m3, of which centralized exploitation accounts for 83.69%, with the other 16.31% for distributed exploitation.
There are 131 centralized exploitation wells over the plain, yielding groundwater of 5614.26 × 104 m3/year (Table 4). Among these wells, 17 wells belong to the public urban water supply system, and the others all belong to private wells owned by industrial enterprises and/or public facilities (Table 4). The Zhongwei water source has 8 wells and the Zhongning water source has 9 wells. These public wells yield groundwater of 823.5 × 10⁴ m3/year, accounting for 14.67% of the total centralized exploitation (Table 4). The wells owned by Zhongwei railway station and Zhongwei Hospital are used for yielding domestic water at a rate of 102.2 × 10⁴ m3/year. Yinhai Industrial Park, located in Zhongning County, has three wells mainly for various industrial uses. In addition to these typical industrial enterprises and/or public facilities, there are also many small industrial enterprises, owning 107 centralized exploitation wells in total with a groundwater exploitation amount of 4469.56 × 104 m3/year.
Table 4.
Amounts of centralized groundwater exploitation in the Weining Plain.
The distributed groundwater exploitation in the Weining Plain can be classified into three types. The first type is drinking water projects supported by the local government. There are 28 and 32 drinking water projects in Zhongwei and Zhongning, respectively. These drinking water projects are established mainly to meet the requirements of domestic uses of rural residents. According to the survey, these 60 drinking water projects distributed in the plains supply about 135 × 104 m3 of groundwater annually, supporting and meeting the needs of 146,000 residents, 48,000 large livestock (cows, horses, and pigs, etc.), and 196,000 small livestock (hens, ducks, and geese, etc.). The second type is groundwater production by hand-pumping wells. In places that drinking water projects cannot cover, a hand-pumping well is the most common groundwater-yielding equipment. The last type is groundwater production for irrigation. There are 151 agricultural irrigation wells, with an annual groundwater extraction of 644 × 104 m3. The total annual exploitation of distributed groundwater in Weining Plain is 1419 × 104 m3.
The amounts of groundwater used in different sectors vary a lot in the study area. The industrial sector consumes most of the groundwater exploited, while the agricultural sector consumes the least. Figure 4 illustrates the proportions of groundwater usage in industrial, domestic, and agricultural sectors. According to the survey, industrial production consumes about 6466 × 104 m3 of groundwater, accounting for 74.29 %. Because the irrigation of agricultural land in the study area is heavily dependent on the Yellow River water rather than groundwater, the groundwater used for agricultural irrigation is only 644 × 104 m3, accounting for only 7.40 %. Only in areas where surface water is inconvenient, groundwater irrigation will be used. Less than 20% of the remaining groundwater is used for household purposes.

Figure 4.
Proportion of groundwater usage in different sectors.
3.2. Estimation of Groundwater Recharge
3.2.1. Groundwater Recharge and Discharge Status
Estimating groundwater recharge is an important task in groundwater resource assessment and management. In the Weining Plain, the main sources of groundwater recharge consist of atmospheric precipitation infiltration, agricultural irrigation infiltration, canal system leakage, and lateral inflow. Table 5 showcases the detailed outcomes of the water balance calculations.
Table 5.
Table of water balance calculation results.
Rainfall in the Weining Plain is relatively limited, and groundwater recharge occurs only when rainfall exceeds 10 mm at each rainfall event. Consequently, the concept of “effective rainfall” is used to represent the fraction of rainfall that significantly contributes to groundwater recharge. The effective rainfall is calculated as the product of total rainfall and the effective rainfall coefficient [40]. Calculations indicate that the rainfall infiltration recharge of the study area amounts to 2.569 × 10⁷ m3/a, accounting for 7.80% of the total recharge. Agricultural irrigation infiltration recharge refers to the percolation process where irrigation water passes through the vadose zone and enters the aquifer. The estimated irrigation infiltration recharge in the study area is 1.3271 × 10⁸ m3/a, contributing 40.31% to the total groundwater recharge. Canal system leakage recharge occurs when irrigation water is drawn from the Yellow River and infiltrates the subsurface from canals before reaching farmland. This source contributes 8.926 × 10⁷ m3/a, accounting for 27.11% of total recharge. Lateral inflow recharge is calculated based on the variations in hydraulic conductivities, aquifer thickness, and hydraulic gradients along the plain boundaries. The lateral inflow recharge is estimated to be 8.157 × 10⁷ m3/a, representing 24.78% of the overall recharge.
Groundwater discharge in the Weining Plain occurs via evaporation, lateral runoff, drainage ditch discharge, and artificial extraction. The corresponding discharge volumes are 5.504 × 10⁷ m3/a (17.23%), 7.185 × 10⁷ m3/a (22.49%), 1.1963 × 10⁸ m3/a (37.46%), and 7.289 × 10⁷ m3/a (22.82%), respectively. The total annual recharge of the groundwater aquifer in the Weining Plain is 3.2923 × 10⁸ m3/a, while the total annual discharge is 3.1941 × 10⁸ m3/a. The relative balance difference over one hydrological year is 1.51%, indicating that the groundwater system in the study area is in a state of relative equilibrium.
The water budget calculation reveals that the primary sources of groundwater recharge within the study area are canal system leakage and agricultural irrigation infiltration, both of which originate from Yellow River water. Consequently, groundwater recharge sources can be categorized into three main types: Yellow River water recharge, rainfall infiltration recharge, and lateral runoff recharge. Their respective contributions to the total recharge are 67.42%, 7.80%, and 24.78%.
3.2.2. Estimation of Contribution Ratio of End Members
Groundwater budget analysis can provide initial results of groundwater recharge estimation. In this study, end member mixing models set up using stable isotopes were also adopted to supplement the discussion on groundwater recharge. Based on the budget estimation, end member analysis considers Yellow River water, rainfall, and lateral runoff as the groundwater recharge sources. The three end members can form a triangular shape, and the groundwater samples are plotted in the same figure (Figure 5). According to groundwater flow direction, the upstream groundwater sample ZW-028 (Figure 1) was selected as the lateral inflow end member. Figure 5a shows that the largest portion of the groundwater sample points, except a few, are plotted within the triangular area defined by the three end members, indicating that atmospheric precipitation, Yellow River water, and lateral groundwater inflow are reasonable groundwater recharge sources for groundwater in the study area.

Figure 5.
End member mixing diagram of Cl− and δ18O: (a) Weining Plain, (b) Zhongwei Plain, and (c) Zhongning Plain.
According to the end member mixing models, the average contribution of the three end members to the groundwater is 51.99%, 20.92%, and 27.09%, respectively, and the principal source of recharge is the Yellow River water, which is consistent with the water balance calculation results. However, when the difference is compared with the conclusions drawn from the water balance calculation, the contribution of atmospheric precipitation is relatively larger based on the end member mixing analysis and the contribution of the Yellow River water is slightly reduced, which may be explained by the following reasons. First, the water balance method involves the estimation of several parameters [41], and the uncertainty of the precipitation infiltration coefficient will have a great impact on the calculation of atmospheric precipitation recharge. Second, the water balance method pays more attention to the balance of water in the whole system, and it will take into account the interconversion and mutual influence between different recharge sources. However, the end member mixing analysis may not fully take into account the chemical interactions among the recharge sources [42]. For instance, before the river water or precipitation reached the water table, the infiltrated water might have had some chemical reactions with the soil, but the end member mixing analysis did not consider these reactions, which induced the calculation uncertainty.
In addition, Figure 5b, c showed the end member mixing in the western Zhongwei Plain and the eastern Zhongning Plain, respectively, with ZW-028 and ZW-63 (Figure 1) as the groundwater lateral inflow end members in the two regions, respectively. Calculations showed that the average contributions of the three end members, Yellow River water, atmospheric precipitation, and lateral inflow, to the groundwater recharge were 49.55%, 25.10%, and 25.34%, respectively, for the western Zhongwei Plain, and 56.37%, 25.59%, and 18.04%, respectively, for the eastern Zhongning Plain. There is a certain difference in the contribution rate of groundwater recharge between the eastern and western parts, which may be due to the large span of the Weining Plain between the east and west, differences in regional aquifers and rock types, and differences in groundwater environments. In contrast, the thickness of the Quaternary sediments in the Zhongwei Plain is greater than that in the Zhongning Plain [40], and the thicker Quaternary sediment layer provides a good transport channel for lateral flow. Its complex internal aquifer structure and greater thickness allow lateral flow to be exchanged and recharged between different aquifers, which is conducive to increasing the extent and amount of groundwater recharge from lateral flow. In addition, many factors including differences in vegetation and land use and meteorological factors also have some influence on groundwater recharge [43]. However, for the entire Weining Plain, Yellow River water plays the most important role as a source of groundwater recharge.
3.3. Assessment of Groundwater Quality
3.3.1. Statistical Analysis and Spatial Distribution of Water Quality Parameters
The selected groundwater pollutants were statistically analyzed to assess the general pollution status in the study area, and the results are summarized in Table 6. The table indicates that several pollutants are present at elevated levels in the groundwater, with the primary pollutants being SO42−, Cl−, F−, TDS, TH, NO3-N, NO2-N, Na, and Mn. The ratios of samples beyond the permissible limit (RSBLs) for these contaminants all exceed 15%, with SO42−, Mn, and TH showing a particularly high ratio (>50%). These parameters are considered primary pollutants. The RSBLs for CODMn, pH, NH4-N, NO2-N, Pb, and Cr6+ are significantly lower than those of the primary pollutants, typically under 5%. As such, they are considered minor pollutants in this study. The spatial distribution of some of the pollutants was further analyzed and was illustrated in Figure 6.
Table 6.
Statistical analysis of main water quality parameters in the plain.

Figure 6.
Spatial distribution of major groundwater quality parameters. (a) SO42−, (b) Mn, (c) TH, (d) NO3-N.
The concentration of SO42− in the groundwater ranges from 43.2 to 2113 mg/L, with an average value of 362.45 mg/L (Table 6). Based on the national drinking water standards [44], the permissible limit for SO42− in drinking water is 250 mg/L, above which it may pose threats to human health. The standards also classify groundwater quality into five grades: excellent, good, medium, poor, and extremely poor. As shown in Figure 6a, the concentration of SO42− is generally high in most areas of the study area. The distribution area of poor and extremely poor water covers about 85% of the total plain area. Elevated concentrations are particularly noticeable along the boundaries of the study area, near riverbanks, and in the northeast of the study area, which may be ascribed to mineral dissolution and inflows of poor-quality water from these boundaries. The older geological formations along the northern and eastern borders, such as Tertiary formations containing soluble gypsum, contribute to these elevated SO42− levels. When groundwater with high SO42− content flows into the Quaternary alluvial plain through the boundaries, it leads to a decline in water quality in the plain [20,45]. For example, the alluvial plain is bordered to the south by Nanshantaizi, where Quaternary groundwater is of poor quality and has high SO42− levels, which will further deteriorate the water quality in the plain due to groundwater inflows along the southern boundary. Additionally, localized high SO42− concentrations in the alluvial plain may be due to intense evaporation, particularly in areas where groundwater is shallow (water level depth less than 3 m), leading to increased concentrations of major ions, including SO42−. Groundwater near Zhongwei, Rouyuan, Enhe, Yuding, and Mingsha shows lower SO42− concentrations, likely due to adequate recharge by fresh water and deeper groundwater levels.
The content of Mn in groundwater is high due to geological conditions. Table 6 shows that Mn concentrations range from 0.05 to 4.20 mg/L, with an average of 0.405 mg/L. The allowable limit for Mn in drinking water, according to both Chinese standards and WHO guidelines [46], is 0.1 mg/L, making 50.34% of the samples unfit for drinking owing to the high Mn content. Figure 6b indicates that Mn concentrations are relatively high in many areas, particularly near Yuding Township. The distribution area of poor and extremely poor water covers about 90% of the total plain area. In addition to natural geological processes, human activities significantly contribute to Mn contamination. The northeast area of Yuding Township has an industrial zone known for the Tianyuan Manganese Industry, and higher Mn concentrations were observed, indicating anthropogenic pollution [40].
TH serves as a significant indicator of groundwater quality. The data in Table 6 reveal TH concentrations ranging from 145 to 2302 mg/L, with an average of 604.4 mg/L. According to the national drinking water quality standards, the highest tolerable TH level is 450 mg/L. Figure 6c demonstrates that most parts of the plain have poor water quality with TH values above 450 mg/L, and in some areas, TH levels even exceed 550 mg/L, indicating very hard water. Poor and extremely poor water occupy about 96% of the total plain area. Areas such as Baima, southeast Yuding Township, western Zhongning, Changle, and Xuanhe have particularly high TH levels. Industrial activities in these regions, including factories in the southwest of Zhongning County and south of Changle Town, are likely to influence the elevated hardness levels [40].
Agriculture is a major economic activity in the Weining Plain, promoting intensive and extensive use of fertilizers and pesticides that severely impact groundwater quality [20,40,47]. Table 6 shows significant nitrate (NO3-N) contamination, with concentrations of 2.50 to 793 mg/L. The highest permissible concentration of NO3-N in drinking water is 20 mg/L, and the maximum recorded concentration is 39.65 times above this limit, with an RSBL value of 22.07%. Figure 6d illustrates that NO3-N pollution is relatively severe in the areas north of Mingsha, Changle, Yinshuiqiao, and the southern boundary of the plain, resulting in poor water quality. The distribution of medium-quality water covers about 60% of the total area of the plain, indicating the water is acceptable for drinking purposes in these areas. However, the areas with poor and very poor water quality in terms of nitrate are associated with high human health risks if the contaminated water is consumed. In the region near Mingsha and Baima is the discharge zone of the regional hydrogeological basin, the elevated nitrate concentrations may be due to evaporation and concentration processes.
3.3.2. Groundwater Quality for Drinking Purposes
A comprehensive assessment of water quality for the purpose of drinking was conducted using the EWQI method, which utilized nine key indicators: pH, Cl−, SO42−, NO3−, Mn, F−, TH COD, and TDS. The assessment results revealed that 4 water samples were classified as good quality, 74 as medium quality, 45 as poor quality, and 22 as extremely poor quality, accounting for 2.76%, 51.03%, 31.03%, and 15.18% of the total water samples, respectively. A zonation map illustrating the spatial distribution of the overall drinking water quality is shown in Figure 7.

Figure 7.
Comprehensive assessment of groundwater quality for drinking purposes using the EWQI method.
As presented in Figure 7, groundwater in many parts of the region has poor quality and requires treatment for safe drinking purposes. Moderate groundwater quality was observed in areas such as Zhongwei, Rouyuan, Yongkang, Enhe, Shikong, and Mingsha. The areas in the south of Rouyuan, Changle, and eastern Yuding displayed extremely poor groundwater quality. As discussed previously, these regions are typically associated with significant industrial land use, resulting in increased amounts of manganese in the groundwater [40]. The poor groundwater quality in most areas of the alluvial plains is primarily attributed to geogenic factors, such as high levels of sulfate and TH, which may result from the dissolution of sulfate and carbonate minerals [48]. The background concentrations of Mn, TDS, and TH in the groundwater are inherently high. Furthermore, human activities remarkably influence the degradation of groundwater quality. Agricultural practices contribute to rising groundwater levels and increased evaporation. All these factors conjunctively induce poor quality in the study area [20].
3.3.3. Groundwater Suitability for Irrigation
Irrigation water quality plays a crucial role in influencing soil structure and plant growth, thus requiring thorough suitability assessments for effective irrigation. According to TDS, 131 out of 145 groundwater samples were rated excellent, 11 were rated good, 2 were rated medium, and 1 was rated poor, accounting for 90.34%, 7.59%, 1.38%, and 0.69%, respectively (Table 7). Groundwater rated as excellent and good ratings is proper for irrigation and is unlikely to cause soil salinization. Water with a medium rating should be used with caution, considering irrigation method, water volume, and crop type. Poor-quality groundwater is not suitable for irrigation. The analysis shows that most areas in the study region have excellent and good groundwater quality, suitable for irrigation, while a small number of areas have slightly poorer water quality, making them unsuitable for irrigation.
Table 7.
Evaluation results of irrigation water quality.
SAR, RSC, %Na, and PI were employed to evaluate the risk of alkali damage caused by irrigation water [49]. As shown in Table 7, SAR evaluations showed all samples to be excellent, indicating a low risk of sodic damage. RSC evaluation results indicated that only 1 sample was unsuitable for irrigation, with the remainder deemed suitable. %Na evaluation results revealed that 44.83% of the samples were fully suitable for irrigation, 51.72% were marginally suitable, and 3.45% were not suitable. PI evaluations showed that 2.07% of the samples were fully suitable, 95.86% were marginally suitable, and 2.07% were not suitable. Although the indicators varied, in general, the groundwater within the study area is generally suitable for irrigation, with only some local areas presenting unsuitable conditions.
The Wilcox plot (Figure 8a) classifies samples based on %Na and EC into five zones [20,50]. Most water sample points fall within Zones I, II, and III, comprising approximately 71% of the total. The Wilcox plot suggests that groundwater in most regions meets the irrigation standards without causing significant salt or alkali damage. In the USSL plot [51], the horizontal axis represents salinity hazard while the vertical axis represents alkali damage. Both the salinity hazard and alkali damage were classified into 4 categories. The USSL plot (Figure 8b) shows that 109 water samples were in the C2S1, C3S1, and C3S2 areas, indicating that their water quality meets or marginally meets the requirements for irrigation. Proper irrigation systems will prevent salt and alkali damage to soil and crops. However, 36 water samples were in areas likely to cause salt or alkali damage, with 2 samples in the C4S4 zone being highly problematic and unsuitable for irrigation [20].

Figure 8.
Diagrams showing irrigation water quality: (a) Wilcox diagrams and (b) USSL diagrams.
In summary, the groundwater in the plain generally meets the irrigation water quality standards and will not lead to soil salinization or crop damage with the application of reasonable irrigation practices. However, practical considerations, such as groundwater availability and extraction difficulty, must be addressed. In areas with significant extraction challenges, groundwater may not be suitable for irrigation.
3.3.4. Suitability for Industrial Uses
The industrial water quality evaluation results indicate the presence of significant amounts of boiler scale in all 145 groundwater samples. Specifically, 4.83% of the samples contain hard scale, 46.21% contain soft to hard scale, and 48.97% contain soft scale. Hard scale is primarily composed of carbonates, sulfates, and silicates of alkaline earth metals, which can be attached firmly to the inner surfaces of boilers and are difficult to remove. In contrast, soft scale consists of suspended solids and colloidal substances and can be more easily removed through washing [52]. Most boiler scales fall within the soft to hard scaling and soft scaling categories, suggesting that pre-treatment and softening of boiler feed water are advisable [53].
The calculation of the corrosion and foaming coefficients reveals that 68.28% of the water samples are non-corrosive, while 31.72% show corrosive or mildly corrosive properties. Foaming in water is linked to saponification reactions involving sodium (Na+), potassium (K+), oil, and total suspended solids (TSS) [54,55]. Approximately 90% of the water samples exhibit foaming, indicating a need for boiler water refreshment.
Based on the IndWQI calculations, on the whole, the groundwater quality in the area under study is poor for industrial purposes. Specifically, 20.69% of the samples are unsuitable for industrial use, 24.14% have extremely poor water quality, 42.76% are rated poor, and only 12.41% meet the standard for good water quality (Table 8).
Table 8.
Evaluation results of IndWQI.
In summary, the groundwater in the Weining Plain generally has a high boiler scale and poses a foaming risk, likely due to elevated concentrations of calcium and sodium [56]. Additionally, the corrosive nature of the water can reduce the lifespan of boilers and potentially lead to hazardous situations, including the risk of explosion. As a result, it is vital to improve the quality of groundwater used for boiler feed water, as it is currently unsuitable for direct use in boilers.
3.4. Groundwater Protection Strategies
The groundwater in the Weining Plain is vital for the region, but its shallow depth and high permeability aquifer make it prone to pollution [54]. An assessment of groundwater quality in the Weining Plain reveals that overall water quality is poor, necessitating improvements in both drinking and industrial water quality. To protect and sustainably develop groundwater resources in this area, the following recommendations are proposed:
Improving Agricultural Irrigation Practices: Efficient irrigation systems should be implemented in agricultural activities, and existing irrigation channels should be modernized to enhance water resource utilization efficiency. Additionally, given the extensive agricultural activities in the region, studies have highlighted significant nitrate pollution in the Weining Plain [35,57], which mainly comes from manure, sewage, and agricultural practices [40]. To address this issue, fertilizers, pesticides, and farmyard manure must be used rationally to prevent excessive nitrate nitrogen contamination in groundwater.
Strengthening Industrial and Mining Pollution Controls: Once contaminated, groundwater resources are challenging to remediate [5]. Therefore, in industrial and mining areas, it is critical to improve water recycling efficiency and upgrade sewage treatment technologies. Government authorities should enhance water quality and quantity monitoring, enforce regulations, and establish a robust groundwater environmental monitoring system to mitigate pollution risks.
Managing Groundwater Exploitation: Groundwater is a finite resource. Overexploitation can lead to declining groundwater levels, reduced or ceased springs, saltwater intrusion, and overall water quality deterioration [5,58]. To prevent these issues, groundwater extraction must be controlled and conducted in a planned manner, ensuring sustainable use and minimizing ecological and environmental impacts caused by overuse.
4. Conclusions
This study aimed to comprehensively understand the situation regarding groundwater recharge and groundwater quality in the Weining Plain, providing basic information for groundwater management and protection in the area. Groundwater recharge was estimated using groundwater budget analysis and end member mixing analysis. In addition, 145 groundwater samples were collected, and groundwater suitability for drinking, industrial and agricultural purposes was evaluated using the EWQI, IndWQI, and other water quality indicators. The main conclusions drawn are as follows:
- (1)
- The source of groundwater recharge in the Weining Plain is mainly Yellow River water, accounting for over half of the total recharge. However, compared with the groundwater budget calculation, the proportion of Yellow River water recharge derived from the end member mixing method is small (67.42% for groundwater budget calculation and 51.99% from the end member mixing method), the proportion of atmospheric precipitation recharge is large (7.80% and 20.92%, respectively). This may be due to the fact that the method neglects the interconversion and mutual influence between different recharge sources.
- (2)
- The results of EWQI show that good, moderate, poor, and extremely poor water quality account for 2.76%, 51.03%, 31.03%, and 15.18% of the total evaluated water samples, respectively. The overall groundwater quality in plain areas is poor. The areas in the south of Rouyuan, Changle, and eastern Yuding displayed extremely poor groundwater quality and need to be treated as drinking water. Groundwater quality in the Weining Plain basically meets the irrigation water quality standards and will not cause serious saline-alkali damage. However, groundwater has a corrosive effect on the boilers in the research area, and there is a high risk of scaling and foaming. The IndWQI method shows that only 12.41% of the water samples possess good water quality for industrial use.
Although this research gives an overall evaluation of groundwater recharge and water quality in the Weining Plain, certain limitations remain. Firstly, the groundwater environment is dynamic and subject to continuous change. This study analyzed a single set of sampling data, without considering the variations in groundwater conditions across seasons or multiple years. To address this limitation, it is essential to strengthen groundwater monitoring systems, promote data sharing, and conduct more extensive research that captures temporal changes. Secondly, the groundwater system is a complex and dynamic entity, with its state being influenced by a wide range of natural and anthropogenic factors. This study did not discuss all potential influencing variables, such as climate change and land use changes. Future research should integrate these aspects to furnish a more thorough and comprehensive perception of groundwater systems and their responses to environmental and human-induced changes. However, the results of this study still have significant implications for groundwater management and protection in the Weining Plain and can also provide a reference for similar regions in China and other parts of the world facing similar groundwater issues.
Author Contributions
Research conceptualization, M.G., J.K. and P.L.; data curation, M.G., J.K. and P.L.; methodology, M.G.; writing—original draft, M.G. and P.L.; writing—review and editing, M.G. and P.L.; supervision, P.L. All authors have read and agreed to the published version of the manuscript.
Funding
This research was jointly supported by the National Natural Science Foundation of China (42472316) and the National Key Research and Development Program of China (2023YFC3706901).
Data Availability Statement
All processed data generated or used during the study appear in the submitted article. Raw data may be provided upon reasonable request from the corresponding author.
Conflicts of Interest
The authors declare no conflicts of interest.
References
- Masmoudi, T.; Benakcha, M.; Abdennour, M.A.; Bouzekri, A.; Amrane, A.; Alcala, F.J. Groundwater quality evaluation for drinking and agricultural purposes. A case study in semi-arid region (Zab El-gharbi SE-Algeria). Desalin. Water Treat. 2024, 319, 100476. [Google Scholar] [CrossRef]
- Omeka, M.E.; Egbueri, J.C.; Unigwe, C.O. Investigating the hydrogeochemistry, corrosivity and scaling tendencies of groundwater in an agrarian area (Nigeria) using graphical, indexical and statistical modelling. Arab. J. Geosci. 2022, 15, 1233. [Google Scholar] [CrossRef]
- Subba Rao, N.; Das, R.; Sahoo, H.K.; Gugulothu, S. Hydrochemical characterization and water quality perspectives for groundwater management for urban development. Groundw. Sustain. Dev. 2024, 24, 101071. [Google Scholar] [CrossRef]
- Wagh, V.; Mukate, S.; Muley, A.; Kadam, A.; Panaskar, D.; Varade, A. Study of groundwater contamination and drinking suitability in basaltic terrain of Maharashtra, India through PIG and multivariate statistical techniques. J. Water Supply Res. Technol. Aqua 2020, 69, 398–414. [Google Scholar] [CrossRef]
- Jasechko, S.; Seybold, H.; Perrone, D.; Fan, Y.; Shamsudduha, M.; Taylor, R.G.; Fallatah, O. Rapid groundwater decline and some cases of recovery in aquifers globally. Nature 2024, 625, 715–721. [Google Scholar] [CrossRef] [PubMed]
- Cheng, W.J.; Feng, Q.; Xi, H.Y.; Yin, X.; Cheng, L.; Sindikubwabo, C.; Zhang, B.; Chen, Y.; Zhao, X. Modeling and assessing the impacts of climate change on groundwater recharge in endorheic basins of Northwest China. Sci. Total Environ. 2024, 918, 170829. [Google Scholar] [CrossRef]
- Ashraf, S.; Ali, M.; Shrestha, S.; Hafeez, M.A.; Moiz, A.; Sheikh, Z.A. Impacts of climate and land-use change on groundwater recharge in the semi-arid lower Ravi River basin, Pakistan. Groundwater Sustain. Dev. 2022, 17, 100743. [Google Scholar] [CrossRef]
- Green, T.R.; Taniguchi, M.; Kooi, H.; Gurdak, J.J.; Allen, D.M.; Hiscock, K.M.; Treidel, H.; Aureli, A. Beneath the surface of global change: Impacts of climate change on groundwater. J. Hydrol. 2011, 405, 532–560. [Google Scholar] [CrossRef]
- Cook, P.G.; Dogramaci, S. Estimating Recharge from Recirculated Groundwater with Dissolved Gases: An End-Member Mixing Analysis. Water Resour. Res. 2019, 55, 5468–5486. [Google Scholar] [CrossRef]
- Nina, K.; Christoph, K.; Adriana, B.; Christos, C. Groundwater recharge estimation in Mediterranean mountain environments by isotope profiles–Partitioning of macropore and matrix flow. J. Hydrol. 2024, 637, 131352. [Google Scholar] [CrossRef]
- Chuko, F.W.; Abdissa, A.G. Impact of land-use dynamics and climate change scenarios on groundwater recharge in the case of Anger watershed, Ethiopia. Heliyon 2023, 9, e18467. [Google Scholar] [CrossRef] [PubMed]
- Shen, Z.; Zhang, Q.; Chen, D. Varying effects of mining development on ecological conditions and groundwater storage in dry region in Inner Mongolia of China. J. Hydrol. 2021, 597, 125759. [Google Scholar] [CrossRef]
- Post, D.A.; Crosbie, R.S.; Viney, N.R.; Peeters, L.J.M.; Zhang, Y.Q.; Herron, N.F.; Wilkins, A.; Janardhanan, S.; Karim, F.; Aryal, S.K.; et al. Impacts of coal mining and coal seam gas extraction on groundwater and surface water. J. Hydrol. 2020, 591, 125281. [Google Scholar] [CrossRef]
- Foster, S.S.D.; Chilton, P.J. Groundwater: The processes and global significance of aquifer degradation. Philos. Trans. R. Soc. London. Ser. B Biol. Sci. 2003, 358, 1957–1972. [Google Scholar] [CrossRef] [PubMed]
- Wang, Y.H.; Li, P.Y. Appraisal of shallow groundwater quality with human health risk assessment in different seasons in rural areas of the Guanzhong Plain (China). Environ. Res. 2022, 207, 112210. [Google Scholar] [CrossRef] [PubMed]
- Subba Rao, N.; Sunitha, B.; Adimalla, N.; Chaudhary, M. Quality criteria for groundwater use from a rural part of Wanaparthy District, Telangana State, India, through ionic spatial distribution (ISD), entropy water quality index (EWQI) and principal component analysis (PCA). Environ. Geochem. Health 2020, 42, 579–599. [Google Scholar] [CrossRef]
- He, S.; Li, P.Y.; Su, F.M.; Wang, D.; Ren, X.F. Identification and apportionment of shallow groundwater nitrate pollution in Weining Plain, northwest China, using hydrochemical indices, nitrate stable isotopes, and the new Bayesian stable isotope mixing model (MixSIAR). Environ. Pollut. 2022, 298, 118852. [Google Scholar] [CrossRef] [PubMed]
- Han, Q.Q. Analysis of Hydrogeological Conditions and Groundwater Chemical Characteristics in Weining Plain, Ningxia. Sci. Technol. Inf. 2012, 9, 444–459. (In Chinese) [Google Scholar]
- Liu, L.N.; Wu, J.H.; He, S.; Wang, L. Occurrence and Distribution of Groundwater Fluoride and Manganese in the Weining Plain (China) and Their Probabilistic Health Risk Quantification. Expo. Health 2022, 14, 263–279. [Google Scholar] [CrossRef]
- Li, P.Y. Research on Groundwater Environment Under the Influence of Human Activities: A Case Study of Weining Plain in Ningxia. Ph.D. Thesis, Chang’an University, Xi’an, China, 2014. (In Chinese). [Google Scholar]
- APHA. Standard Methods for the Examination of Water and Wastewater, 21st ed.; American Public Health Association: Washington, DC, USA, 2005. [Google Scholar]
- GB/T5750-2006; Standard Examination Methods for Drinking Water. Ministry of Health of PRC, Standardization Administration of PRC; Standards Press of China: Beijing, China, 2006. (In Chinese)
- IAEA. Vienna Standard Mean Ocean Water (V-SMOW): Definition and Distribution; International Atomic Energy Agency: Vienna, Austria, 1968. [Google Scholar]
- Christophersen, N.; Neal, C.; Hooper, R.P.; Vogt, R.D.; Andersen, S. Modelling streamwater chemistry as a mixture of soilwater end members—A step towards second-generation acidification models. J. Hydrol. 1990, 116, 307–320. [Google Scholar] [CrossRef]
- Hooper. Modeling Streamwater Chemistry as a Mixture of Soilwater End member-An Application to the Panola Mountain Cachmenrt, GEORGIA, U.S.A. J. Hydrol. 1990, 116, 321–343. [Google Scholar] [CrossRef]
- Peng, T.R.; Huang, C.C.; Chen, J.E.; Zhan, W.J.; Chiang, W.; Chang, L.C. Evaluating the relative importance of groundwater recharge sources in a subtropical alluvial plain using tracer-based ternary end member mixing analysis (EMMA). Water Res. Manag. 2016, 30, 3861–3878. [Google Scholar] [CrossRef]
- Qiao, J.; Zhu, Y.; Jia, X.; Shao, M.; Niu, X.; Liu, J. Distributions of arsenic and other heavy metals, and health risk assessments for groundwater in the Guanzhong plain region of China. Environ. Res. 2020, 181, 108957. [Google Scholar] [CrossRef] [PubMed]
- Wang, D.; Wu, J.H.; Wang, Y.H.; Ji, Y.J. Finding High-Quality Groundwater Resources to Reduce the Hydatidosis Incidence in the Shiqu County of Sichuan Province, China: Analysis, Assessment, and Management. Expo. Health 2020, 12, 307–322. [Google Scholar] [CrossRef]
- Adimalla, N.; Venkatayogi, S. Geochemical characterization and evaluation of groundwater suitability for domestic and agricultural utility in semi-arid region of Basara, Telangana State, South India. Appl. Water Sci. 2018, 8, 44. [Google Scholar] [CrossRef]
- Pradeep, T.; Sampathkumar, V.; Nallasamy, J.L.; Shanmugamoorthy, M.; Sudalaimuthu, G.; Veerasamy, S.; Periyasamy, M.; Murugasamy, M.V. Evaluation of groundwater quality for irrigation purposes in hard rock terrain of Southern India using water quality indices modelling. Desalin. Water Treat. 2024, 318, 100397. [Google Scholar] [CrossRef]
- Ragunath, H.M. Groundwater; Wiley: New Delhi, India, 1987. [Google Scholar]
- Doneen, L.D. Notes on Water Quality in Agriculture; Water Science and Engineering Paper 4001; Department of Water Sciences and Engineering, University of California: Davis, CA, USA, 1964. [Google Scholar]
- Li, Y.H.; Zhou, J.Z.; Wang, G.R.; Ma, K.; Zhang, Z.P. Analysis of the Development Trends of Industrial Water Treatment Technology. Front. Environ. Prot. 2021, 11, 135–141. (In Chinese) [Google Scholar] [CrossRef]
- Liu, Z.C.; Li, G.H.; Zhu, K. Hydrogeology of Water Supply, 3rd ed.; China Architecture and Building Press: Beijing, China, 1998. [Google Scholar]
- Nsabimana, A.; Li, P.Y. Hydrogeochemical characterization and appraisal of groundwater quality for industrial purpose using a novel industrial water quality index (IndWQI) in the Guanzhong Basin, China. Geochemistry 2023, 83, 125922. [Google Scholar] [CrossRef]
- GB/T 1576-2018; National Standards of the People’s Republic of China for Industrial Boiler Water Quality. Ministry of Environmental Protection of the P.R. China; China Environmental Science Press: Beijing, China, 2018. (In Chinese)
- Piyathilake, I.D.U.H.; Ranaweera, L.V.; Udayakumara, E.P.N.; Gunatilake, S.K.; Dissanayake, C.B. Assessing groundwater quality using the Water Quality Index (WQI) and GIS in the Uva Province, Sri Lanka. Appl. Water Sci. 2022, 12, 72. [Google Scholar] [CrossRef]
- Mangestiyono, W.; Sutrisno, S.; Mrihardjono, J. Pipe Blockage Prediction of Shell and Tube Heat Exchanger under Linear and Cross Flow Operation. Mater. Today Proc. 2019, 13, 132–136. [Google Scholar] [CrossRef]
- Shah, M.; Patel, H.; Viramgama, P.; Varanava, D.; Maheshwari, D. Characterization and assessment of groundwater aquifers from Bakreshwar and Tantloi geothermal fields for its industrial applications. Groundwater Sustain. Dev. 2021, 12, 100535. [Google Scholar] [CrossRef]
- He, S. Research on the Response of Groundwater Environment in Weining Plain to Climate Factors and Changes in Land Use/Cover Patterns; Chang’an University: Xi’an, China, 2022. (In Chinese) [Google Scholar]
- Wang, F.G.; Wang, Y.H.; Jiang, M.; Wang, H.; Pan, H.L.; Wu, M.J.; Cao, Y.Q. Water circulation condition and calculation of water balance in Tianchi Lake of the Changbai Mountains. Sci. Geogr. Sin. 2023, 43, 1291–1298. [Google Scholar] [CrossRef]
- Cartwright, I.; Cendón, D.; Currell, M.; Meredith, K. A review of radioactive isotopes and other residence time traces in understanding groundwater recharge: Possibilities, challenges, and limitations. J. Hydrol. 2017, 555, 797–811. [Google Scholar] [CrossRef]
- Dubois, E.; Larocque, M.; Brunner, P. Impact of land cover changes on Long-Term Regional-Scale groundwater recharge simulation in cold and humid climates. Hydrol. Process. 2023, 37, e14810. [Google Scholar] [CrossRef]
- GB5749-2006; Standards for Drinking Water Quality. Ministry of Health of PRC, Standardization Administration of PRC; Standards Press of China: Beijing, China, 2006. (In Chinese)
- Jiang, C.L.; Cheng, L.L.; Li, C.; Zheng, L.G. A hydrochemical and multi-isotopic study of groundwater sulfate origin and contribution in the coal mining area. Ecotoxicol. Environ. Saf. 2022, 248, 114286. [Google Scholar] [CrossRef] [PubMed]
- WHO. Guidelines for Drinking Water Quality. 2011. Available online: https://iris.who.int/handle/10665/44584 (accessed on 24 January 2025).
- Chen, J.; Wu, H.; Qian, H.; Gao, Y.Y. Assessing nitrate and fluoride contaminants in drinking water and their health risk of rural residents living in a semiarid region of Northwest China. Expo. Health 2017, 9, 183–195. [Google Scholar] [CrossRef]
- Zhang, Y.; Xu, M.; Li, X.; Qi, J.; Zhang, Q.; Guo, J. Hydrochemical characteristics and quality assessment of groundwater in the Yinchuan Plain, China. Environ. Earth Sci. 2020, 79, 127. [Google Scholar] [CrossRef]
- Benaissa, M.; Gueroui, Y.; Guettaf, M.; Boudalia, S.; Bousbia, A.; Ouartsi, A.; Maoui, A. Hydrochemical characterization and evaluation of irrigation water quality using indexing approaches, multivariate analysis, and GIS techniques in K’sob Valley, Algeria. J. Afr. Earth Sci. 2024, 219, 105385. [Google Scholar] [CrossRef]
- Wilcox, L.V. The Quality of Water for Irrigation Use; US Dept of Agriculture Tech Bull 1962: Washington, DC, USA, 1948. [Google Scholar]
- United States Salinity Laboratory (USSL). Diagnosis and Improvement of Saline and Alkali Soils. In Agriculture Handbook 60; US Dept of Agriculture (USDA): Washington, DC, USA, 1954; pp. 69–81. [Google Scholar]
- Walid, M.; Saber, E.; Hussam, J. Assessment of Scale Removal by Chemical and Underbalance Mechanical Treatments. In Proceedings of the International Conference on Industrial Engineering and Operations Management, Rabat, Morocco, 11–13 April 2017; Available online: https://ieomsociety.org/ieom2017/papers/329.pdf (accessed on 24 January 2025).
- Zhu, Y.J. Research on the Harm of Poor Water Quality to Boilers and Boiler Water Treatment Measures, China. Equip. Eng. 2020, 5, 144–145. [Google Scholar]
- Chaabane, S.; Riahi, K.; Hamrouni, H.; Thayer, B.B. Suitability assessment of grey water quality treated with an upflow-downflow siliceous sand/marble waste filtration system for agricultural and industrial purposes. Environ. Sci. Pollut. Res. 2017, 24, 9870–9885. [Google Scholar] [CrossRef] [PubMed]
- Wu, H.; Chen, J.; Qian, H.; Zhang, X.D. Chemical Characteristics and Quality Assessment of Groundwater of Exploited Aquifers in Beijiao Water Source of Yinchuan, China: A Case Study for Drinking, Irrigation, and Industrial Purposes. J. Chem. 2015, 2015, 726340. [Google Scholar] [CrossRef]
- Li, X.Y.; Gao, Y.Y.; Qian, H.; Wu, H. Groundwater vulnerability and contamination risk assessment of the Weining Plain, using a modified DRASTIC model and quantized pollution loading method. Arab. J. Geosci. 2017, 10, 469. [Google Scholar] [CrossRef]
- Ma, B.Q.; Huang, T.M.; Li, J.; Li, Z.B.; Yin, L.; Zhang, F.; Pang, Z. Tracing nitrate source and transformation in a semiarid loess aquifer with the thick unsaturated zone. Catena 2021, 198, 105045. [Google Scholar] [CrossRef]
- Mohammed, Y.J.; Mustapha, N.; Soumia, A. Impact of overexploitation of groundwater along the irrigated perimeter of Tadla, Oum Errabia Basin, Morocco. Desalin. Water Treat. 2020, 195, 201–212. [Google Scholar] [CrossRef]
Disclaimer/Publisher’s Note: The statements, opinions and data contained in all publications are solely those of the individual author(s) and contributor(s) and not of MDPI and/or the editor(s). MDPI and/or the editor(s) disclaim responsibility for any injury to people or property resulting from any ideas, methods, instructions or products referred to in the content. |
© 2025 by the authors. Licensee MDPI, Basel, Switzerland. This article is an open access article distributed under the terms and conditions of the Creative Commons Attribution (CC BY) license (https://creativecommons.org/licenses/by/4.0/).