Abstract
Groundwater recharge sources and residence times in the Sulaimani–Warmawa Sub-basin, located in the Kurdistan Region of Iraq, were assessed through an integrated hydrogeological, hydrochemical, and isotopic investigation. The study area, located around Sulaimani City, is characterized by a semi-arid climate with precipitation predominantly occurring during winter and early spring. Hydrochemical results indicate groundwater types ranging from Ca–HCO3 to Mg–Ca–HCO3, accompanied by a progressive increase in electrical conductivity along the regional flow path. Stable isotope signatures (δ2H and δ18O) show that groundwater is primarily recharged by winter precipitation derived from both Eastern Mediterranean and Persian Gulf air masses. Two groundwater groups were identified based on isotopic composition and tritium content: recently recharged groundwater and older groundwater, represented by two samples. Tritium values ranging from 0.8 to 4.9 TU correspond to minimum residence times from less than 10 years to approximately 40 years. Higher tritium concentrations near recharge zones reflect recent infiltration, whereas lower values indicate older groundwater with limited modern recharge. The piston flow model provided the best fit for tritium data, suggesting limited mixing and relatively rapid subsurface flow. Samples with higher salinity likely reflect reduced flushing in low-permeability zones, resulting in elevated dissolved solids. Hydraulic-data-based estimated groundwater flow velocities yielded lower values compared to tritium-based estimates, implying preferential flow in karstified formations. The relatively short groundwater residence times mean there is high vulnerability to contamination, emphasizing the need for careful land-use planning and groundwater protection strategies.
1. Introduction
Groundwater is a crucial source of fresh water, particularly in semi-arid regions and developing countries where clean water resources are scarce. In many regions, the demand for water is increasing due to population growth leading to an imbalance in the availability of clean drinking water. The problem of the imbalance in the supply and demand of clean drinking water is being intensified by several factors, including climate change, a significant rise in industrial activities, and the increasing consumption of water for agricultural and household purposes [1,2]. To effectively address the water supply and demand issues in these regions, it is important to use application of environmental isotopes, or hydrogeological analysis, or age dating groundwater, rather than scientific knowledge. This can be achieved by establishing a comprehensive understanding of the recharge processes, the residence time of the groundwater, and renewability of the groundwater resources [3]. However, due to the complexity of the hydrogeological systems, this process can face significant challenges [4].
Many studies have been conducted using environmental tracers, such as stable and radioactive isotopes, for determining the sources of groundwater recharge and its residence time [5,6]. For instance, Kpegli et al. [7] developed a groundwater-flow model for southern Benin in West Africa. In another study, the hydrogeochemistry and isotopes (2H, 3H, and 18O) were used to identify water–rock interactions in karst water systems in the Pingyi-Feixian Region in China [8]. Several additional studies have been carried out in different regions of the world. These studies have employed environmental tracers to identify the source and origin of groundwater, for example, in Piraquara de Fora Bay, Brazil [9], the Yucatan Peninsula, Mexico [10], and south-eastern Brazil [11].
Recharge zones can potentially be determined by analyzing stable isotopes in conjunction with hydrogeological and hydrogeochemical data [12,13]. By comparing the δ2H and δ18O isotope ratios, along with other hydrogeochemical data, the relationship between the surface and groundwaters of rivers and lakes can be determined [14,15]. For example, isotopic fractionation in water caused by evaporation and condensation allows tracing of the water’s origin and mixing history [6,16]. Furthermore, the residence period and the presence of percolation-favourable zones may be determined by correlating isotopic data with the mineralization of groundwater [17,18].
So far, only a limited number of studies have been conducted on groundwater ages in the Kurdistan Region of Iraq. However, stable isotope analysis has recently been carried out in the area of interest [19]. Nevertheless, research using tritium (3H) to examine the relationship between rain, surface, and groundwater was still lacking in this area.
Tritium (3H), the heaviest hydrogen isotope, is naturally produced and also generated through nuclear weapons testing [9,20,21]. Annual releases of 3H at approximately 10 TBq were also reported by [22,23] for pressured water reactors in Korea and China, respectively. Tritium (3H) has been utilized for various purposes, such as the determination of water mixing, groundwater recharge, and assessing the flow velocity and residence time of groundwater in aquifers [6,21].
Tritium can be used to date groundwater, assuming that the initial tritium content is known. However, this is not always the case, and simultaneous application of tritium and 3He is used for dating because 3H is the product of tritium decay [6,20].
The area of study is the Sulaimani–Warmawa Sub-basin (SWSB), located in the Kurdistan Region of Iraq near Sulaimani City (Figure 1A). From a hydrological viewpoint, it is a sub-basin that is a part of the Sulaimani-Sharazoor basin in the Sulaimani Governorate [24]. It is a semiarid area with a Mediterranean climate, and most of the precipitation falls in the winter months. Groundwater is a vital water resource in the area, given that most streams are perennial and typically experience declining water levels and reduced discharge during late summer. From an economic viewpoint, the region is important because of its huge oil reserves, and several towns are booming due to the oil industry. The main city located inside the SWSB is Sulaimani, with approximately 790,000 inhabitants mostly dependent on groundwater for water supply. The Sub-basin has been studied by [19], and the principal processes responsible for groundwater chemistry evolution have been identified.
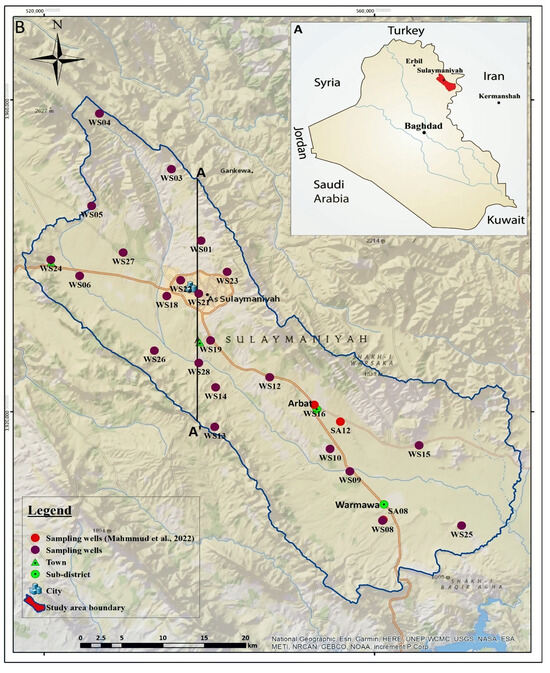
Figure 1.
(A) Location of the study site, (B) position of sampling points (WS); samples from [19] labelled SA are also included. A-A′ is a cross-section in Figure 2.
This study had two main objectives: (1) to determine the possible sources and timing of recharge, and (2) to estimate the groundwater flow velocities, residence times, and groundwater vulnerability to contamination by using an integrative approach comprising hydrogeological, hydrogeochemical, and isotopic data. These objectives should enhance the understanding of local aquifer dynamics and contribute to sustainable water resource management and environmental conservation in the Iraqi Kurdistan.
2. Geology and Hydrogeology
The study area, known as the Warmawa-Sulaimani Sub-basin (SWSB), is located in the High Folded Zone. The SWSB is a part of the Sulaimani-Sharazoor basin in the Sulaimani Governorate, Kurdistan Region of Iraq (Figure 1A,B). The study area covers approximately 1500 km2. Stevanovic and Markovic [24] stated that the region is characterized by a hot, dry summer, and a cold winter. The winter in the area is cold, and most of the precipitation occurs during this season, with a maximum of over a hundred mm in January [25]. The mean annual precipitation, air temperature, and evaporation are 668.5 mm, 21 °C, and 2298.8 mm, respectively. The Tanjero River is the principal river in the basin and usually becomes dry in August until the beginning of the new precipitation period.
The outcropping geological units comprise early Cretaceous, Tertiary, and Quaternary sedimentary deposits [26,27]. The oldest unit of the Early Cretaceous age is the Balambo Formation, which is composed of radiolarian limestone with thin and well-bedded sections. In addition to the Qamchuqa and Kometan formations, which consist of massive grey dolomite and dolomitic limestone, as well as white-weathered and light-grey, thin-bedded, and locally silicified limestone. The Late Cretaceous formations are characterized by Bluish-grey marl and marly limestone of the Shiranish Formation and Silty marl, siltstone, shale, sandstone, conglomerate, and sandy or silty organic detrital limestone of the Tanjero Formation. The sequence is followed by alternating flysch and carbonate sediments of the Kolosh, Sinjar Gercus, and Pila Spi Formations. The Quaternary sedimentary deposits are composed of alluvial fans and floodplain sediments around the Tanjore River and its tributaries: gravel, sand, silt, mud, sandy, and silty clay soil (Table 1 and Figure 2).

Table 1.
Geological formations in the study area, after [19,25,26,27,28].
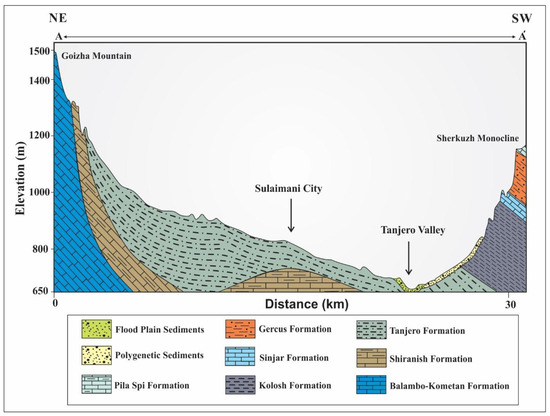
Figure 2.
Geological cross-section of the study area modified after [19,29].
According to the lithology and hydrogeologic characterization, five types of aquifers exist in the Sulaimani–Warmawa Sub-basin [19,24,30,31] (Figure 3). Detailed hydrogeological characteristics are available in Table 2. The Karstic-fissured aquifer (KFA) is represented by Balambo, Qamchuqa, Pila Spi, and Sinjar formations, which are mostly composed of limestone, dolomite, dolomitic limestone, and chalky marl. Qamchuqa aquifer is a well karstified and highly fissured, thick, semi-confined aquifer underlain by Sarmord formation (aquiclude). The Kometan aquifer (KA) is represented by the Kometan Formation, which is mostly composed of limestone [19,32]. Kometan formation is well karstified with confined to semi-confined conditions and overlain by Shiranish formation [24]. The aquifer is composed of carbonate rocks and contains a large amount of groundwater, varying in space and time.
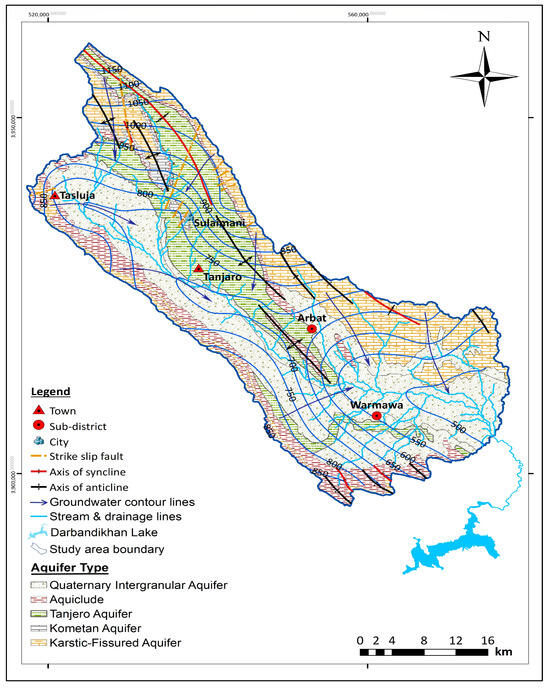
Figure 3.
Hydrogeological map and groundwater flow pattern in the study area, modified after [19,24,30,31].
Table 2.
Hydrogeological characteristics of the aquifers in the study area [24,32,33,34,35].
Aquicludes are represented by Shiranish, Kolosh, and Gercus Formations [19,28].
The Tanjero Formation is the principal, widespread, and main productive aquifer in the study area in terms of quality and quantity of groundwater [19,30,34]. In addition, the Quaternary Intergranular Aquifer (QIA) is represented by Quaternary deposits, which are mostly composed of sand, silt, rock fragments, pebbly, sandy, silty, and clayey, and cover large parts of the study area [19,30,36].
General direction of groundwater flow is from the mountains in the north and northwest towards Sulaimani and the Tanjero River (Figure 3), which later drains into Darbandikhan Lake in the southeast [19].
3. Material and Methods
In this study, a total of 25 groundwater samples were analyzed to improve understanding of groundwater dynamics in the region. Ten groundwater samples were collected from existing boreholes during fieldwork conducted in April 2022, with the objective of filling spatial data gaps identified in a previous study by [19]. The field parameters, including pH, electrical conductivity (EC), and temperature, were measured in the field after pumping several well volumes. The water wells were pumped and on-site measurements of pH, EC, and temperature were taken using portable meters. Wells were purged to remove stagnant water, and samples were collected using a flow-through cell to prevent contamination. Values of pH, EC, and temperature were determined with calibrated instruments, and data accuracy was ensured through calibration and validation with laboratory standards. The groundwater samples have been taken for the determination of main cations, anions, and trace elements, as well as for the stable isotope (2H and 18O) analyses. Collected samples for cation and trace element analyses were filtered in the field by the 0.45 mm Millipore filters, acidified using Ultrapure HNO3, and stored in 50 mL HDPE bottles. Cation and trace element measurements were conducted in the analytical facilities of Charles University in Prague by using the ICP-MS technique. The analytical error of each solution analysis was less than 2%. The anion concentrations were measured using HPLC and Dionex ICS, San Jose, CA, USA. The ferrous iron was determined by titration with potassium dichromate. Alkalinity values were obtained through HCl titration using the Gran plot to determine the endpoint. The QA/QC was carried out according to established protocols. About 10% of samples were examined twice, and the obtained results were consistent. The newly collected data were merged with some samples from the previous study of [19] and used for interpretation.
The measurements of 2H and 18O isotopes were conducted at the Czech Geological Survey in Prague, Czech Republic using a LWIA 3000 laser analyser, Los Gatos Research (San Jose, CA, USA). The accuracy of the analysis was 0.4‰ for δ2H and 0.12‰ for δ18O. The data were standardized by the international standard (V-SMOW) and presented using standard δ-notation [20]. Also, in this case, stable isotope data of 3 samples were merged with data from the previous study by [18] and used for interpretation.
In addition, 13 groundwater samples were taken for tritium analysis in March 2022, plus one rainfall sample (composite sample of several rains in a single day) and one sample of surface water from the Tanjero River inside Sulaimani City. The 3H analyses were performed in the Mediterranean Environment and Modelling of Agro-Hydrosystems (EMMAH) of the University of Avignon in France. A Quantulus 1220 ultra-low liquid scintillation spectrometer, Wallac Oy, Turku, Finland. was used to measure the amount of tritium present in the groundwater samples after electrolytic enrichment by low-level liquid scintillation counting with the detection level in the order 1TU.
The following equation was used for calculation of groundwater apparent age [21],
where at is the measured tritium activity in a sample and a0 is its initial activity.
t = −17.93 ln at3H/a03H
The piston flow tritium model TracerLPM [35] was adapted for the study area by applying Equation (2):
where
Cs(t) = C0 e −ƛt
Cs(t): concentration of tritium at time t at which the analysis was performed [TU];
C0: initial concentration [TU];
λ: tritium decay constant [t − 1];
T: period of time between recharge and analysis [t].
The piston flow model assumes that the recharged water shows only limited mixing and preserves its isotopic signature [37]. The model relies on restrictive assumptions that tracer transport occurs mostly by advection and that no/or limited mixing takes place [38]. A thorough evaluation of their impacts on piston flow age estimates is limited by the deficiency of data and the lack of supporting evidence, such as detailed solute transport modelling. However, the tracer-derived piston flow ages are reasonable for limited available data.
The programme Statistica 13.3 was used to analyze the data and create graphs. The USGS GW_Chart Calibration Plots were used to produce the Piper Diagram, and ArcGIS. 10.7.1 was used to create the maps.
4. Results
4.1. Principal Ions and Trace Elements
In general, the Ca-HCO3 groundwater type is transformed into the Mg-Ca-HCO3 groundwater type with increasing EC along the flow path as observed in the Piper diagram (Figure 4), but there are some outliers with very high Na, SO4, and Cl concentrations. The parameters of water chemistry are given in Table 3. The pH values range from 7.29 (WS09) to 8.02 (WS08) and the average pH value is 7.64. Values of electrical conductivity range from 422 to 1217 μS/cm, with an average of 824.8 μS/cm. The average value of Ca is 103 mg/L with concentrations from 52.2 to 174 mg/L. Concentrations of Mg are from 11.6 to 39.9 mg/L, averaging 22.6 mg/L. Concentrations of Na are from 6.76 to 45.8 mg/L, with an average of 21.3 mg/L, and concentrations of K are from 0.39 to 3.66 mg/L, with an average of 1.32 mg/L. Concentrations of HCO3 are from 204 to 418 mg/L with an average of 325 mg/L. Concentrations of SO4 are from 14 to 184 mg/L, averaging 69.1 mg/L. Concentrations of Cl are from 5.36 to 66.8 mg/L, averaging 36.1 mg/L. Concentrations of Sr are up to 1.72 mg/L, as expected for the groundwater chemistry dominated by the dissolution of carbonates. The principal geogenic contaminant is Ba, with a concentration of up to 0.65 mg/L, previously identified by [18], but concentrations of other geogenic contaminants (e.g., As and F) are low. These results are comparable with the study of [19], but several samples collected in the study have significant concentrations of Na, SO4, and Cl.
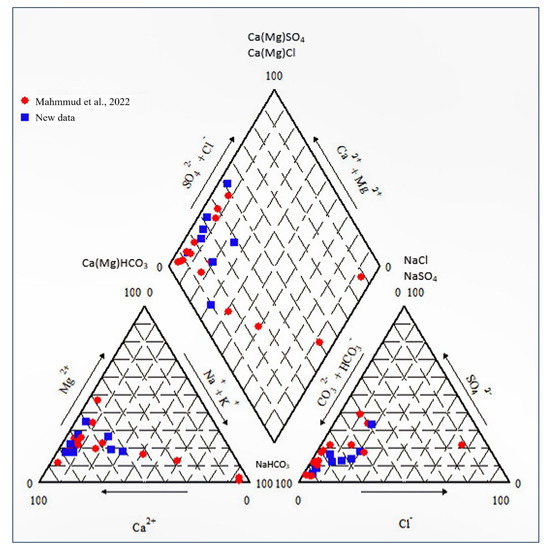
Figure 4.
Piper diagram for new samples and data of [19].
Table 3.
Water chemistry data of samples collected in April 2022.
4.2. Stable Isotopes
The groundwater samples from the Sulaimani–Warmawa Sub-basin for stable isotopic compositions is summarized in Table 4 and Figure 5. Several factors such as air temperature and humidity, geographic location (longitude and latitude), altitude, and distance from the ocean are influencing the isotopic composition of local rainwater [39,40,41]. Groundwater samples from the study area strongly differ from the global meteoric water line (GMWL) (Figure 5). It has been interpreted in detailed atmospheric studies as the mixing of precipitation from the Eastern Mediterranean, dominating in Spring, and the Persian Gulf, with a possible later contribution of vapour from the highly evaporated Caspian Sea [19,42]. This interpretation is based on that the local groundwater line (GWL) for this study (δ2H (‰) = 5.1245*δ18O + 0.1265‰) is not very close to the Mediterranean Meteoric Water Line (δ2H‰ = 8 × δ18O + 22‰) [43].
Table 4.
Stable isotopes in groundwater samples from the Sulaimani–Warmawa Sub-basin, Kurdistan Region, Iraq, sampling in April 2021.
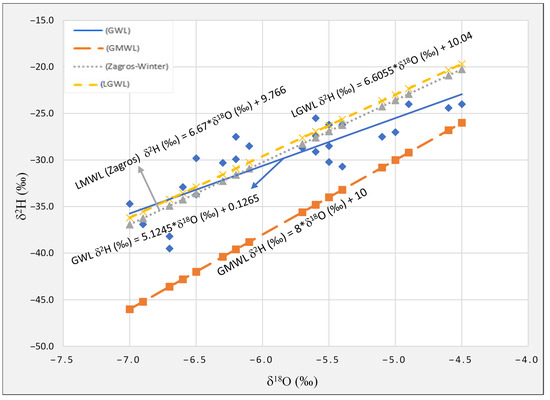
Figure 5.
Diagram of δ2H vs. δ18O, LGWL is the groundwater line from previous study [19], LMWL is the local meteoric water line for winter precipitation in Zagros [42], GWL is the local groundwater line for this study, and GMWL is the global meteoric water line (see text for discussion).
The isotopic composition ranges from −6.7‰ to −4.5‰ for δ18O and from −38.2‰ to −24.0‰ for δ2H in the samples collected around Sulaimani City and the surrounding area. The most positive δ18O value in our dataset is −4.5‰ (Table 4). A previous study reported a more negative value (δ18O = −7.0‰) for a sample collected at the highest altitude (1224 m a.s.l.) in the recharge area, while the most positive value (δ18O = −5.5‰) was found close to Sulaimani [19]. The groundwater line (GWL) for this study is δ2H (‰) = 5.1245*δ18O + 0.1265‰ (Figure 5). This groundwater line also has a lower slope and intercept than the global meteoric water line (GMWL) (Figure 5) and a lower slope than the local groundwater line (LGWL) determined in the previous study, i.e., 5.124 compared to 6.605 [19]. The local GWL for the groundwater samples in the study area also has a lower slope and intercept than the meteoric water lines (LMWLs) for winter precipitation in Zagros, slope 6.67 [42], and yearly LMWL for Zagros with a slope of 6.80 [44]. It might indicate some evaporation impact during infiltration. In relation to the LMWL created by [45] with regression equation δ2H‰ = 7.9*δ18O + 20, in the north of the study area, it can be concluded that precipitation that recharges the aquifers in the study area originates from different vapour masses.
The stable isotopes serve as a spatio-temporal tracer, reflecting both relief and time changes [46]. In this regard, the altitude effect was evaluated using the local isotopic gradient (LIG). This was based on the relation between the elevation of the water samples and δ18O and δ2H (Figure 6). The relation shows depletion of δ18O and δ2H in groundwater with altitude, with gradients of −0.29‰ and −1.5‰ per 100 m, respectively, but R2 values are relatively low. The most depleted samples are SA24 and SA03 reflecting the higher altitudes and winter recharge. In contrast, WS25 and WS09 are the least depleted groundwater samples reflecting probably a lower altitude and a warmer period of recharge.
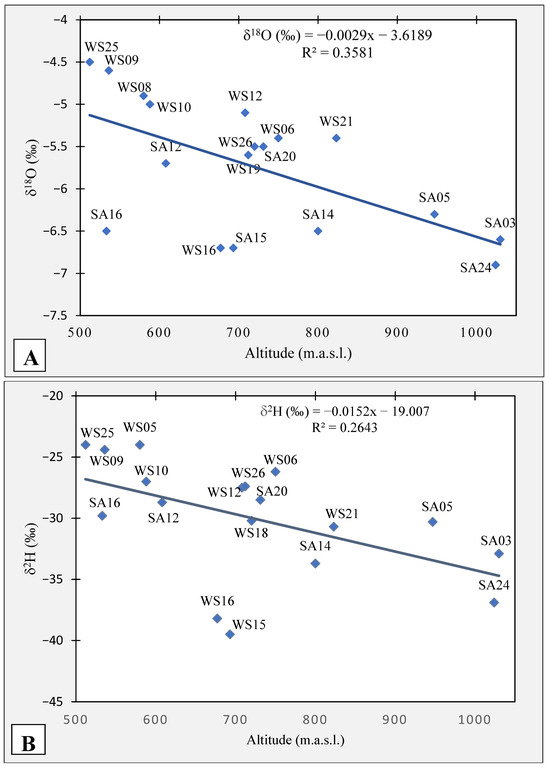
Figure 6.
Local isotopic gradient (LIG) indicating the altitude effect. (A) LIG for δ18O and (B) LIG for δ2H.
Deuterium excess values in this study range from 11.6 to 17.7, suggesting infiltration of precipitation under relatively more humid conditions in winter months. They are smaller compared to the previous study values from the same region where they were in the range from 13.9 to 22.1, suggesting more contribution of the water vapour from the Mediterranean region [19].
4.3. Tritium
The results of the tritium analysis for groundwater samples, one rainfall sample and one water sample from Tanjero River in Sulaimani City, with calculated minimum groundwater ages are shown in Table 5 and in Figure 7.
Table 5.
Tritium analysis results and calculated minimum age of groundwater using 7.3 TU in rain as initial concentration; N/A—not available.
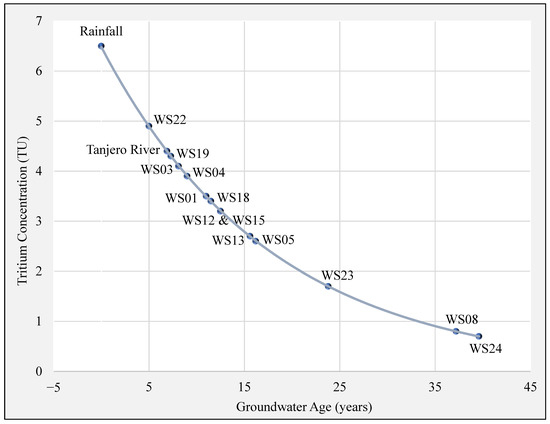
Figure 7.
Tritium concentration calculations using Piston flow model (see text).
The tritium value of the rain sample in Sulaimani City was 7.3 TU, the tritium for the Tanjero River sample in Sulaimani City was 4.4 TU, and the mean values of the groundwater samples were 3.2 TU for the Quaternary Intergranular Aquifer, 3.55 TU for the Tanjero aquifer, and 2.7 and 0.7 TU for the Karstic-Fissured Aquifer and Aquiclude, respectively, Table 5. The tritium concentration in the water well samples was within less than 0.8 to 4.9 TU. In general, there were higher values close to the catchment boundaries (except for wells WS23 and WS24) and lower values in the lowlands.
The tritium value of the rain sample in Sulaimani City (7.3 TU) was not used as input value for the piston flow model. Instead, a value of 6.5TU (with an average error of 0.9 TU) was estimated by modelling based on IAEA-NUCLEUS isoscape modelling [47].
5. Discussion
The flow system at Sulaimani is a gravity flow system with most recharge in the mountains around the basin with altitudes more than 1200 m [19]. The principal process responsible for the formation of Ca-HCO3 groundwater chemistry is the dissolution of carbonates, as indicated by increasing δ13C(DIC) values and 87Sr/86Sr ratio values in the direction of flow [18]. However, there are several “pockets” of groundwater with high Na, SO4, and Cl concentrations, probably caused by limited flushing and the presence of stagnating groundwater.
The new stable isotope data are more variable than the data based on the [19] study, and their lower slope (5.124 compared to 6.605) may indicate some evaporation during recharge.
Motzer [48] suggested that the tritium values in groundwater below 0.8 TU indicate old/sub-modern groundwater (originating before 1950).
In reference to this, only highly mineralized samples WS14 and WS24 show old age originating before 1950, and the others are a mix of modern and old groundwaters. Sample WS14 is from the Quaternary intergranular aquifer, and WS24 is from the aquitard. Tritium concentrations remain almost constant or decrease slightly with depth down to 125 m (4.9 TU) and then decrease with the depth until they reach the value of 1.7 TU at a depth of 450 m (Figure 7). There are several possible ages of groundwater for most of the groundwater samples, from around 10 years up to at least 40 years old. Groundwater samples that are classified as modern are relatively shallow groundwaters (WS03, WS04, WS15, WS18, and WS22), and they are from an unconfined aquifer. On the other hand, samples from higher depths show older ages, and they are supposed to be from confined aquifers, similar to the finding of [49]. The presence of higher tritium concentration at shallower depths suggests that the groundwater was recharged by recent precipitation compared to the samples which show the mixing with the older groundwater in the deeper parts of the flow system [50].
Groundwater samples classified as modern are relatively shallow (Figure 8). Samples of modern groundwater ages are in proximity to the outcrop area and in the shallowest part of the aquifer system. For groundwater samples with mixed ages, most of the sampling sites are relatively shallow and located near the outcrop area. The two mixed samples that are farthest from the outcrop are from relatively shallow wells. Some wells near the outcrop are classified as pre-modern, but groundwater ages can be pre-modern near the outcrop where the aquifer is confined.
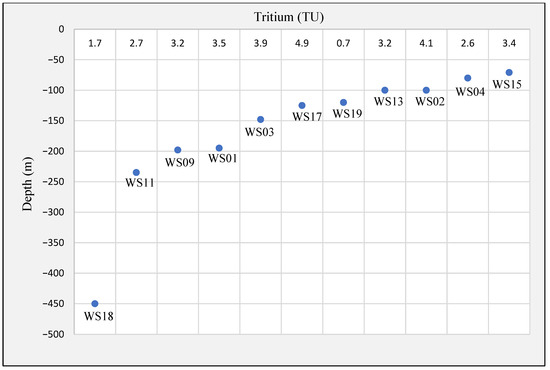
Figure 8.
Depth distribution of tritium in groundwater.
The older water sample (WS14), with the minimum tritium concentration of ≤0.8 TU, is characterized by very high mineralization of Na-SO4-Cl groundwater type, which can be interpreted as a consequence of limited flushing in a stagnating zone of relatively low permeability (Figure 9). Based on the observed good fit for the piston model, it can be assumed that the recharged water is transported mostly by advection with only a limited impact of dispersion [44,51].
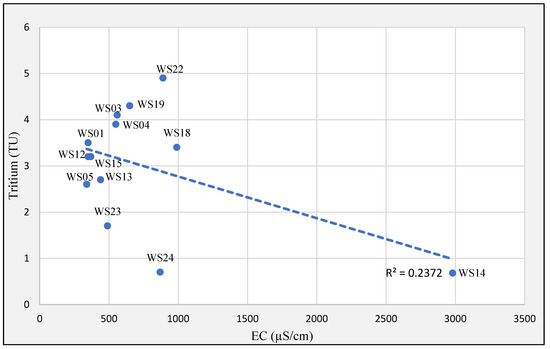
Figure 9.
Relations between tritium and EC.
To evaluate temporal variation in tritium values, previous studies on tritium value ranges within the studied basin have been addressed. Hamamin and Ali [52] examined tritium values in the groundwater of the Basara basin, which is located west of the study area. Their findings indicate that tritium concentrations in spring and well samples during 2013 ranged from 5.5 to 7.0 TU, which is more than the tritium values in the current study. Another study was conducted by [53] in the Halabja Basin southeast of the study area in 2018, and it was found that the tritium concentration in the spring and the well samples ranged from 2.28 to 4.28 TU, and there was 4.8 TU in precipitation. It is noticeable that the temporal trend of tritium concentration in the groundwater of the area is decreasing with time, which is also revealed globally in numerous studies [54,55].
Velocities calculated on the basis of tritium data and residence times were selected on profiles compared with velocities calculated on the basis of the hydraulic data in Table 2 and typical carbonate porosities reported in [56]. All velocities based on the hydraulic data were lower compared to the velocities based on the tritium data, i.e., on profile WS01-WS23 64 m/y compared to 390 m/y, on profile WS22-WS18 160 m/y compared to 333 m/y, and on profile WS19-WS12 50 m/y compared to 1600 m/y. A possible explanation may lie in the presence of preferential flow zones within the karstified rocks, and in the fact that the hydraulic data in Table 2 are derived from pumping tests, which do not necessarily capture the heterogeneous nature of the aquifer [56,57]. For this reason, we consider velocities based on tritium data more reliable. Maximum difference is on the profile WS19-WS12 in the axis of the valley where a high degree of karstification can be expected.
Tritium and δ18O values show only a limited positive correlation in different groundwaters (Figure 10). Enriched waters in terms of δ18O correspond to modern waters with higher concentrations of tritium. The outcropping of the aquifer in some parts of the study area [29,30] may lead to some evaporation of recharged water and its isotopic enrichment [58]. The water samples can be divided into two major groups, Group I: recharged by recent infiltrations of precipitation and group II: recharged in the past. Most measured samples belong to group I, except samples WS14 and WS24 which belong to group II. Sample WS24 is from aquitard and reflects older recharge in limited flow zones [30].
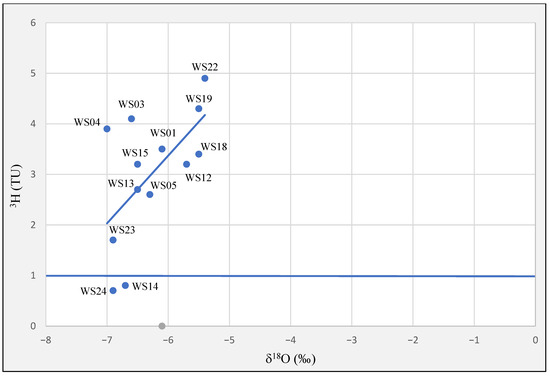
Figure 10.
Relations between tritium and δ18O showing two principal groundwater groups in the study area.
6. Conclusions
This study provides new insights into groundwater recharge mechanisms, flow dynamics, and vulnerability of groundwater in the Sulaimani–Warmawa sub-basin. Hydrochemical and isotopic data demonstrate that recharge predominantly occurs in high-elevation karstified zones, with groundwater evolving from the Ca–HCO3 type to the Mg–Ca–HCO3 type along the flow path as a result of progressive water–rock interaction. The observed altitude-related depletion in stable isotopes and low-slope groundwater line confirm winter-dominated recharge under semi-arid climatic conditions, with limited influence from evaporation.
Tritium concentrations distinguish recently recharged groundwater from older more mineralized groundwater stored in lower-permeability zones. The good fit for the piston flow model results, based on tritium concentrations, indicate limited mixing and preferential flow through heterogeneous karstic formation. Importantly, residence times are relatively short (less than a decade in recharge-proximal areas), highlighting rapid flow pathways and elevated vulnerability of drinking-water sources around Sulaimani to surface-derived contamination.
These findings emphasize the need for active groundwater protection strategies focused on recharge-zone land-use control, nitrate monitoring, and managed groundwater abstraction. Future work should include multilevel sampling and establishment of a regional tritium precipitation record to refine age estimates and improve understanding of vertical flow components. Long-term isotope monitoring is recommended to detect hydrochemical shifts associated with climate variability and increasing anthropogenic pressures.
Author Contributions
All authors contributed to the study’s conception and design. R.M. was responsible for data collection and analysis, map figure preparation, contributed to data interpretation, and writing. O.S. contributed to data interpretation, review, editing, and provided supervision. O.M. was involved in data analysis, writing, editing, and interpretation. H.M. contributed to the review and editing of the manuscript. B.Č. and I.J. were responsible for isotope analysis. All authors have read and agreed to the published version of the manuscript.
Funding
The Geology Department, Palacky University Olomouc and the Department of Geosciences-Environment, University of Tours in France covered the tritium analysis fee.
Data Availability Statement
The original contributions presented in this study are included in the article. Further inquiries can be directed to the corresponding authors.
Acknowledgments
The authors would like to thank Martin Mihaljevič from Charles University in Prague for conducting groundwater chemical analyses. We also appreciate the financial support provided by GéHCO and the Department of Geosciences-Environment, University of Tours in France for the tritium analysis. Additionally, they thank the AgES Institute—UMR EMMAH, Hydrogeochemistry Laboratory, Avignon University for their work on the tritium analysis. The authors are also grateful for the contribution of Stefan Terzer-Wassmuth from Isotope Hydrology Section, International Atomic Energy Agency, Vienna International Centre for providing the data of tritium in precipitation.
Conflicts of Interest
The authors declare no conflicts of interest.
References
- Scanlon, B.R.; Healy, R.W.; Cook, P.G. Choosing appropriate techniques for quantifying groundwater recharge. Hydrogeol. J. 2003, 10, 18–39. [Google Scholar] [CrossRef]
- Vairavamoorthy, K.; Gorantiwar, S.D.; Pathirana, A. Managing urban water supplies in developing countries: Climate change and water scarcity scenarios. Phys. Chem. Earth 2008, 33, 330–339. [Google Scholar] [CrossRef]
- Mahlknecht, J.; Schneider, J.F.; Merkel, B.J.; Navarro de León, I.; Bernasconi, S.M. Groundwater recharge in a sedimentary basin in semi-arid Mexico. Hydrogeol. J. 2004, 12, 511–530. [Google Scholar] [CrossRef]
- Batlle-Aguilar, J.; Banks, E.W.; Batelaan, O.; Kipfer, R.; Brennwald, M.S.; Cook, P.G. Groundwater residence time and aquifer recharge in multilayered, semi-confined, and faulted aquifer systems using environmental tracers. J. Hydrol. 2017, 546, 150–165. [Google Scholar] [CrossRef]
- Cook, P.G.; Böhlke, J.K. Determining timescales for groundwater flow and solute transport. In Environmental Tracers in Subsurface Hydrology; Springer: Boston, MA, USA, 2000; pp. 1–30. [Google Scholar]
- Cook, P. Introduction to Isotopes and Environmental Tracers as Indicators of Groundwater Flow; The Groundwater Project: Guelph, ON, Canada, 2022; p. 79. Available online: https://gw-project.org/books/introduction-to-isotopes-and-environmental-tracers-as-indicators-of-groundwater-flow/ (accessed on 1 August 2025).
- Kpegli, K.A.R.; Alassane, A.; van der Zee, S.E.; Boukari, M.; Mama, D. Development of a conceptual groundwater flow model using a combined hydrogeological, hydrochemical and isotopic approach: A case study from southern Benin. J. Hydrol. Reg. Stud. 2018, 18, 50–67. [Google Scholar] [CrossRef]
- Liu, C.; Wang, W.; Zhang, G.; Zhu, H.; Wang, J.; Guo, Y. Hydrochemical and isotope (18O, 2H, and 3H) characteristics of karst water in central Shandong Province: A case study of the Pingyi–Feixian Region. Minerals 2022, 12, 154. [Google Scholar] [CrossRef]
- De Carvalho Gomes, F.; Godoy, J.M.; de Carvalho, Z.L.; de Souza, E.M.; Silva, J.I.R.; Lopes, R.T. Tritium (3H) as a tracer for monitoring the dispersion of conservative radionuclides discharged by the Angra dos Reis nuclear power plants in the Piraquara de Fora Bay, Brazil. J. Environ. Radioact. 2014, 136, 169–173. [Google Scholar] [CrossRef]
- Cejudo, E.; Ortega-Almazán, P.J.; Ortega-Camacho, D.; Acosta-González, G. Hydrochemistry and water isotopes of a deep sinkhole in north Quintana Roo, Mexico. J. S. Am. Earth Sci. 2022, 116, 103846. [Google Scholar] [CrossRef]
- Oliveira, M.S.; Neves, M.A.; Caxito, F.A.; Moreira, R.M. 18O, 2H, and 3H isotopic data for understanding groundwater recharge and circulation systems in crystalline rock terrain of southeastern Brazil. J. S. Am. Earth Sci. 2022, 116, 103794. [Google Scholar] [CrossRef]
- Sukhija, B.S.; Reddy, D.V.; Nagabhushanam, P.; Bhattacharya, S.K.; Jani, R.A.; Kumar, D. Characterisation of recharge processes and groundwater flow mechanisms in weathered–fractured granites of Hyderabad (India) using isotopes. Hydrogeol. J. 2006, 14, 663–674. [Google Scholar] [CrossRef]
- Tweed, S.O.; Weaver, T.R.; Cartwright, I. Distinguishing groundwater flow paths in different fractured-rock aquifers using groundwater chemistry: Dandenong Ranges, southeast Australia. Hydrogeol. J. 2005, 13, 771–786. [Google Scholar] [CrossRef]
- Clark, I.D.; Fritz, P. Environmental Isotopes in Hydrogeology; CRC Press: Boca Raton, FL, USA, 2013. [Google Scholar]
- West, A.G.; February, E.C.; Bowen, G.J. Spatial analysis of hydrogen and oxygen stable isotopes (“isoscapes”) in groundwater and tap water across South Africa. J. G eochem. Explor. 2014, 145, 213–222. [Google Scholar] [CrossRef]
- Klein, E.S.; Baltensperger, A.P.; Welker, J.M. Complexity of Arctic Ocean water isotope (δ18O, δ2H) spatial and temporal patterns revealed with machine learning. Elem. Sci. Anthr. 2024, 12, 00127. [Google Scholar] [CrossRef]
- Salameh, E. Using environmental isotopes in the study of the recharge–discharge mechanisms of the Yarmouk catchment area in Jordan. Hydrogeol. J. 2004, 12, 451–463. [Google Scholar] [CrossRef]
- Wang, F.; Chen, H.; Lian, J.; Fu, Z.; Nie, Y. Seasonal recharge of spring and stream waters in a karst catchment revealed by isotopic and hydrochemical analyses. J. Hydrol. 2020, 591, 125595. [Google Scholar] [CrossRef]
- Mahmmud, R.; Sracek, O.; Mustafa, O.; Čejková, B.; Jačková, I.; Vondrovicová, L. Groundwater geochemistry evolution and geogenic contaminants in the Sulaimani–Warmawa Sub-basin, Sulaimani, Kurdistan Region, Iraq. Environ. Monit. Assess. 2022, 194, 352. [Google Scholar] [CrossRef]
- Clark, I. Groundwater, Geochemistry and Isotopes; CRC Press, Taylor & Francis Group: Boca Raton, FL, USA, 2015; p. 438. [Google Scholar]
- Kendall, C.; McDonnell, J.J. (Eds.) Isotope Tracers in Catchment Hydrology; Elsevier: Amsterdam, The Netherlands, 1998; 839p. [Google Scholar]
- Son, J.K.; Kim, H.G.; Kong, T.Y.; Ko, J.H.; Lee, G.J. Radiological effluents released and public doses from nuclear power plants in Korea. Radiat. Prot. Dosim. 2013, 155, 517–521. [Google Scholar] [CrossRef]
- Yang, D.J.; Chen, X.Q.; Li, B. Tritium release during nuclear power operation in China. J. Radiol. Prot. 2012, 32, 167. [Google Scholar] [CrossRef]
- Stevanović, Z.; Marković, M. Hydrogeology of Northern Iraq, Vol. 2: General Hydrogeology and Aquifer Systems; Food and Agriculture Organization of the United Nations: Rome, Italy, 2004; p. 264. [Google Scholar]
- Stevanović, Z.; Marković, M. Hydrogeology of Northern Iraq, Climate, Hydrology, Geomorphology, Geology, Vol. 1; Field Documents; Food and Agriculture Organization of the United Nations: Rome, Italy, 2003. [Google Scholar]
- Karim, K.H.; Ali, S.S. Origin of dislocated limestone blocks on the slope side of Baranan (Zirgoez) Homocline: An attempt to outlook the development of western part of Sharazoor Plain. Al-Kindy J. Geosci. 2004, 3, 5–20. [Google Scholar]
- Omar, A.A.; Lawa, F.A.; Sulaiman, S.H. Tectonostratigraphic and structural imprints from balanced sections across the north-western Zagros fold–thrust belt, Kurdistan Region, NE Iraq. Arab. J. Geosci. 2015, 8, 8107–8129. [Google Scholar] [CrossRef]
- Sissakian, V.K.; Fouad, S.F. Geological map of Iraq, scale 1:1,000,000, 2012. Iraqi Bull. Geol. Min. 2015, 11, 9–16. [Google Scholar]
- Kareem, A.; Mustafa, O.; Merkel, B. Geochemical and environmental investigation of the water resources of the Tanjero area, Kurdistan Region, Iraq. Arab. J. Geosci. 2018, 11, 461. [Google Scholar] [CrossRef]
- Mustafa, O. Impact of Sewage Wastewater on the Environment of Tanjero River and Its Basin with Sulaimani City, NE-Iraq. Master’s Thesis, University of Sulaimani, Sulaimani, Iraq, 2006. [Google Scholar]
- Ali, S.S. Geology and Hydrogeology of Sharazoor-Piramagroon Basin in Sulaimani Area, Northeastern Iraq. Ph.D. Thesis, University of Belgrade, Belgrade, Serbia, 2007; p. 317. [Google Scholar]
- Hamamin, D.F.; Qadir, R.A.; Ali, S.S.; Bosch, A.P. Hazard and risk intensity maps for water-bearing units: A case study. Int. J. Environ. Sci. Technol. 2018, 15, 173–184. [Google Scholar] [CrossRef]
- Studio Galli Ingegneria (SGI). Hydrogeological Study for the Governorate of Around the Center of the City, Final Report; Studio Galli Ingegneria: Kurdistan Region, Iraq, 2011; p. 200. [Google Scholar]
- Mustafa, O.; Merkel, B. Classification of karst springs based on discharge and water chemistry in Makook karst system, Kurdistan Region, Iraq. Freiberg Online Geosci. 2015, 39, 1–24. [Google Scholar]
- Qaradaghy, R.A.Q. Vulnerability and Risk Intensity Maps of Groundwater Aquifers in Sulaymaniah Sub-Basin, Iraqi Kurdistan Region. Master’s Thesis, University of Sulaimani, Sulaimani, Iraq, 2015; p. 136. [Google Scholar]
- Directorate of Groundwater of Sulaimani (DoGWS). Ministry of Agriculture and Water Resources, Kurdistan Regional Government, Kurdistan Region, Iraq; 2020. Available online: https://gov.krd/moawr (accessed on 1 May 2020).
- Jurgens, B.C.; Böhlke, J.K.; Eberts, S.M. TracerLPM (Version 1): An Excel® Workbook for Interpreting Groundwater Age Distributions from Environmental Tracer Data; 4-F3; U.S. Geological Survey: Reston, VA, USA, 2012. [Google Scholar]
- Hinkle, S.R.; Shapiro, S.D.; Plummer, L.N.; Eurybiades, B.; Widman, P.K.; Casile, G.C.; Wayland, J.E. Estimates of Tracer-Based Piston-Flow Ages of Groundwater from Selected Sites—National Water-Quality Assessment Program, 1992–2005; Scientific Investigations Report 2010-5229; U.S. Geological Survey: Reston, VA, USA, 2010; p. 90. [Google Scholar]
- Al-Charideh, A.R. Environmental isotope study of groundwater discharge from the large karst springs in west Syria. Environ. Earth Sci. 2011, 63, 161–182. [Google Scholar] [CrossRef]
- Mazor, E. Chemical and Isotopic Groundwater Hydrology; Marcel Dekker: New York, NY, USA, 2004. [Google Scholar]
- Mook, W.G. Environmental Isotopes in the Hydrological Cycle: Principles and Applications. Vol. 1: Introduction: Theory, Methods, Review; International Hydrological Programme IHP-V: Paris, France, 2001; pp. 1–165. [Google Scholar]
- Mohammadzadeh, H.; Eskandari Mayvan, J.; Heydarizad, M. The effects of moisture sources and local parameters on the 18O and 2H contents of precipitation in the west of Iran and the east of Iraq. Tellus B Chem. Phys. Meteorol. 2020, 72, 1–15. [Google Scholar] [CrossRef]
- Gat, J.R.; Carmi, I. Evolution of the isotopic composition of atmospheric waters in the Mediterranean Sea area. J. Geophys. Res. 1970, 75, 3039–3048. [Google Scholar] [CrossRef]
- Osati, K.; Koeniger, P.; Salajegheh, A.; Mahdavi, M.; Chapi, K.; Malekian, A. Spatiotemporal patterns of stable isotopes and hydrochemistry in springs and river flow of the upper Karkheh River Basin, Iran. Isot. Environ. Health Stud. 2014, 50, 169–183. [Google Scholar] [CrossRef]
- Mustafa, O.; Merkel, B.; Weise, S. Assessment of hydrogeochemistry and environmental isotopes in karst springs of Makook Anticline, Kurdistan Region, Iraq. Hydrology 2015, 2, 48–68. [Google Scholar] [CrossRef]
- Guglielmi, Y.; Vengeon, J.; Bertrand, C.; Mudry, J.; Follacci, J.; Giraud, A. Hydrogeochemistry: An investigation tool to evaluate infiltration into large moving rock masses (case study of La Clapière and Séchilienne alpine landslides). Bull. Eng. Geol. Environ. 2002, 61, 311–324. [Google Scholar] [CrossRef]
- Terzer-Wassmuth, S.; Araguás-Araguás, L.J.; Copia, L.; Wassenaar, L.I. High spatial resolution prediction of tritium (3H) in contemporary global precipitation. Sci. Rep. 2022, 12, 10271. [Google Scholar] [CrossRef] [PubMed]
- Motzer, W. Tritium age dating of groundwater. Hydrovisions 2007, 16, 236. [Google Scholar]
- Lindsey, B.D.; Jurgens, B.C.; Belitz, K. Tritium as an Indicator of Modern, Mixed, and Premodern Groundwater Age; U.S. Geological Survey: Reston, VA, USA, 2019; pp. 2019–5090. [Google Scholar]
- Kashiwaya, K.; Muto, Y.; Kubo, T.; Ikawa, R.; Nakaya, S.; Koike, K.; Marui, A. Spatial variations of tritium concentrations in groundwater collected in the southern coastal region of Fukushima, Japan, after the nuclear accident. Sci. Rep. 2017, 7, 12578. [Google Scholar] [CrossRef] [PubMed]
- Shapiro, S.D.; Plummer, N.; Busenberg, E.; Widman, P.K.; Casile, G.C.; Wayland, J.E.; Runkle, D.L. Estimates of Tracer-Based Piston-Flow Ages of Groundwater from Selected Sites: National Water-Quality Assessment Program, 2006–2010; U.S. Geological Survey: Reston, VA, USA, 2012; pp. 2012–5141. [Google Scholar]
- Hamamin, D.F.; Ali, S.S. Hydrodynamic study of karstic and intergranular aquifers using isotope geochemistry in Basara Basin, Sulaimani, northeastern Iraq. Arab. J. Geosci. 2013, 6, 2933–2940. [Google Scholar] [CrossRef]
- Abdullah, T.; Ali, S.; Al-Ansari, N.; Knutsson, S. Possibility of groundwater pollution in Halabja Saidsadiq hydrogeological basin, Iraq, using modified DRASTIC model based on AHP and tritium isotopes. Geosciences 2018, 8, 236. [Google Scholar] [CrossRef]
- Morgenstern, U.; Daughney, C.J.; Leonard, G.; Gordon, D.; Donath, F.M.; Reeves, R. Using groundwater age and hydrochemistry to understand sources and dynamics of nutrient contamination through the catchment into Lake Rotorua, New Zealand. Hydrol. Earth Syst. Sci. 2015, 19, 803–822. [Google Scholar] [CrossRef]
- Telloli, C.; Rizzo, A.; Salvi, S.; Pozzobon, A.; Marrocchino, E.; Vaccaro, C. Characterization of groundwater recharge through tritium measurements. Adv. Geosci. 2022, 57, 21–36. [Google Scholar] [CrossRef]
- Ford, D.; Williams, P. Karst Hydrogeology and Geomorphology, 2nd ed.; John Wiley & Sons: Chichester, UK, 2007. [Google Scholar]
- Scanlon, B.R.; Mace, R.E.; Barrett, M.E.; Smith, B. Can we simulate regional groundwater flow in a karst system using equivalent porous media models? Case study, Barton Springs Edwards Aquifer, USA. J. Hydrol. 2003, 276, 137–158. [Google Scholar] [CrossRef]
- Hamani, A.H.H.; Adamou, M.M.; Sandao, I.; Hado, H.A. Physico-chemical and isotopic (18O, 2H, and 3H) characterization of the Upper Dallol Maouri Watershed (Niger). Open J. Geol. 2022, 12, 613–639. [Google Scholar] [CrossRef]
Disclaimer/Publisher’s Note: The statements, opinions and data contained in all publications are solely those of the individual author(s) and contributor(s) and not of MDPI and/or the editor(s). MDPI and/or the editor(s) disclaim responsibility for any injury to people or property resulting from any ideas, methods, instructions or products referred to in the content. |
© 2025 by the authors. Licensee MDPI, Basel, Switzerland. This article is an open access article distributed under the terms and conditions of the Creative Commons Attribution (CC BY) license (https://creativecommons.org/licenses/by/4.0/).