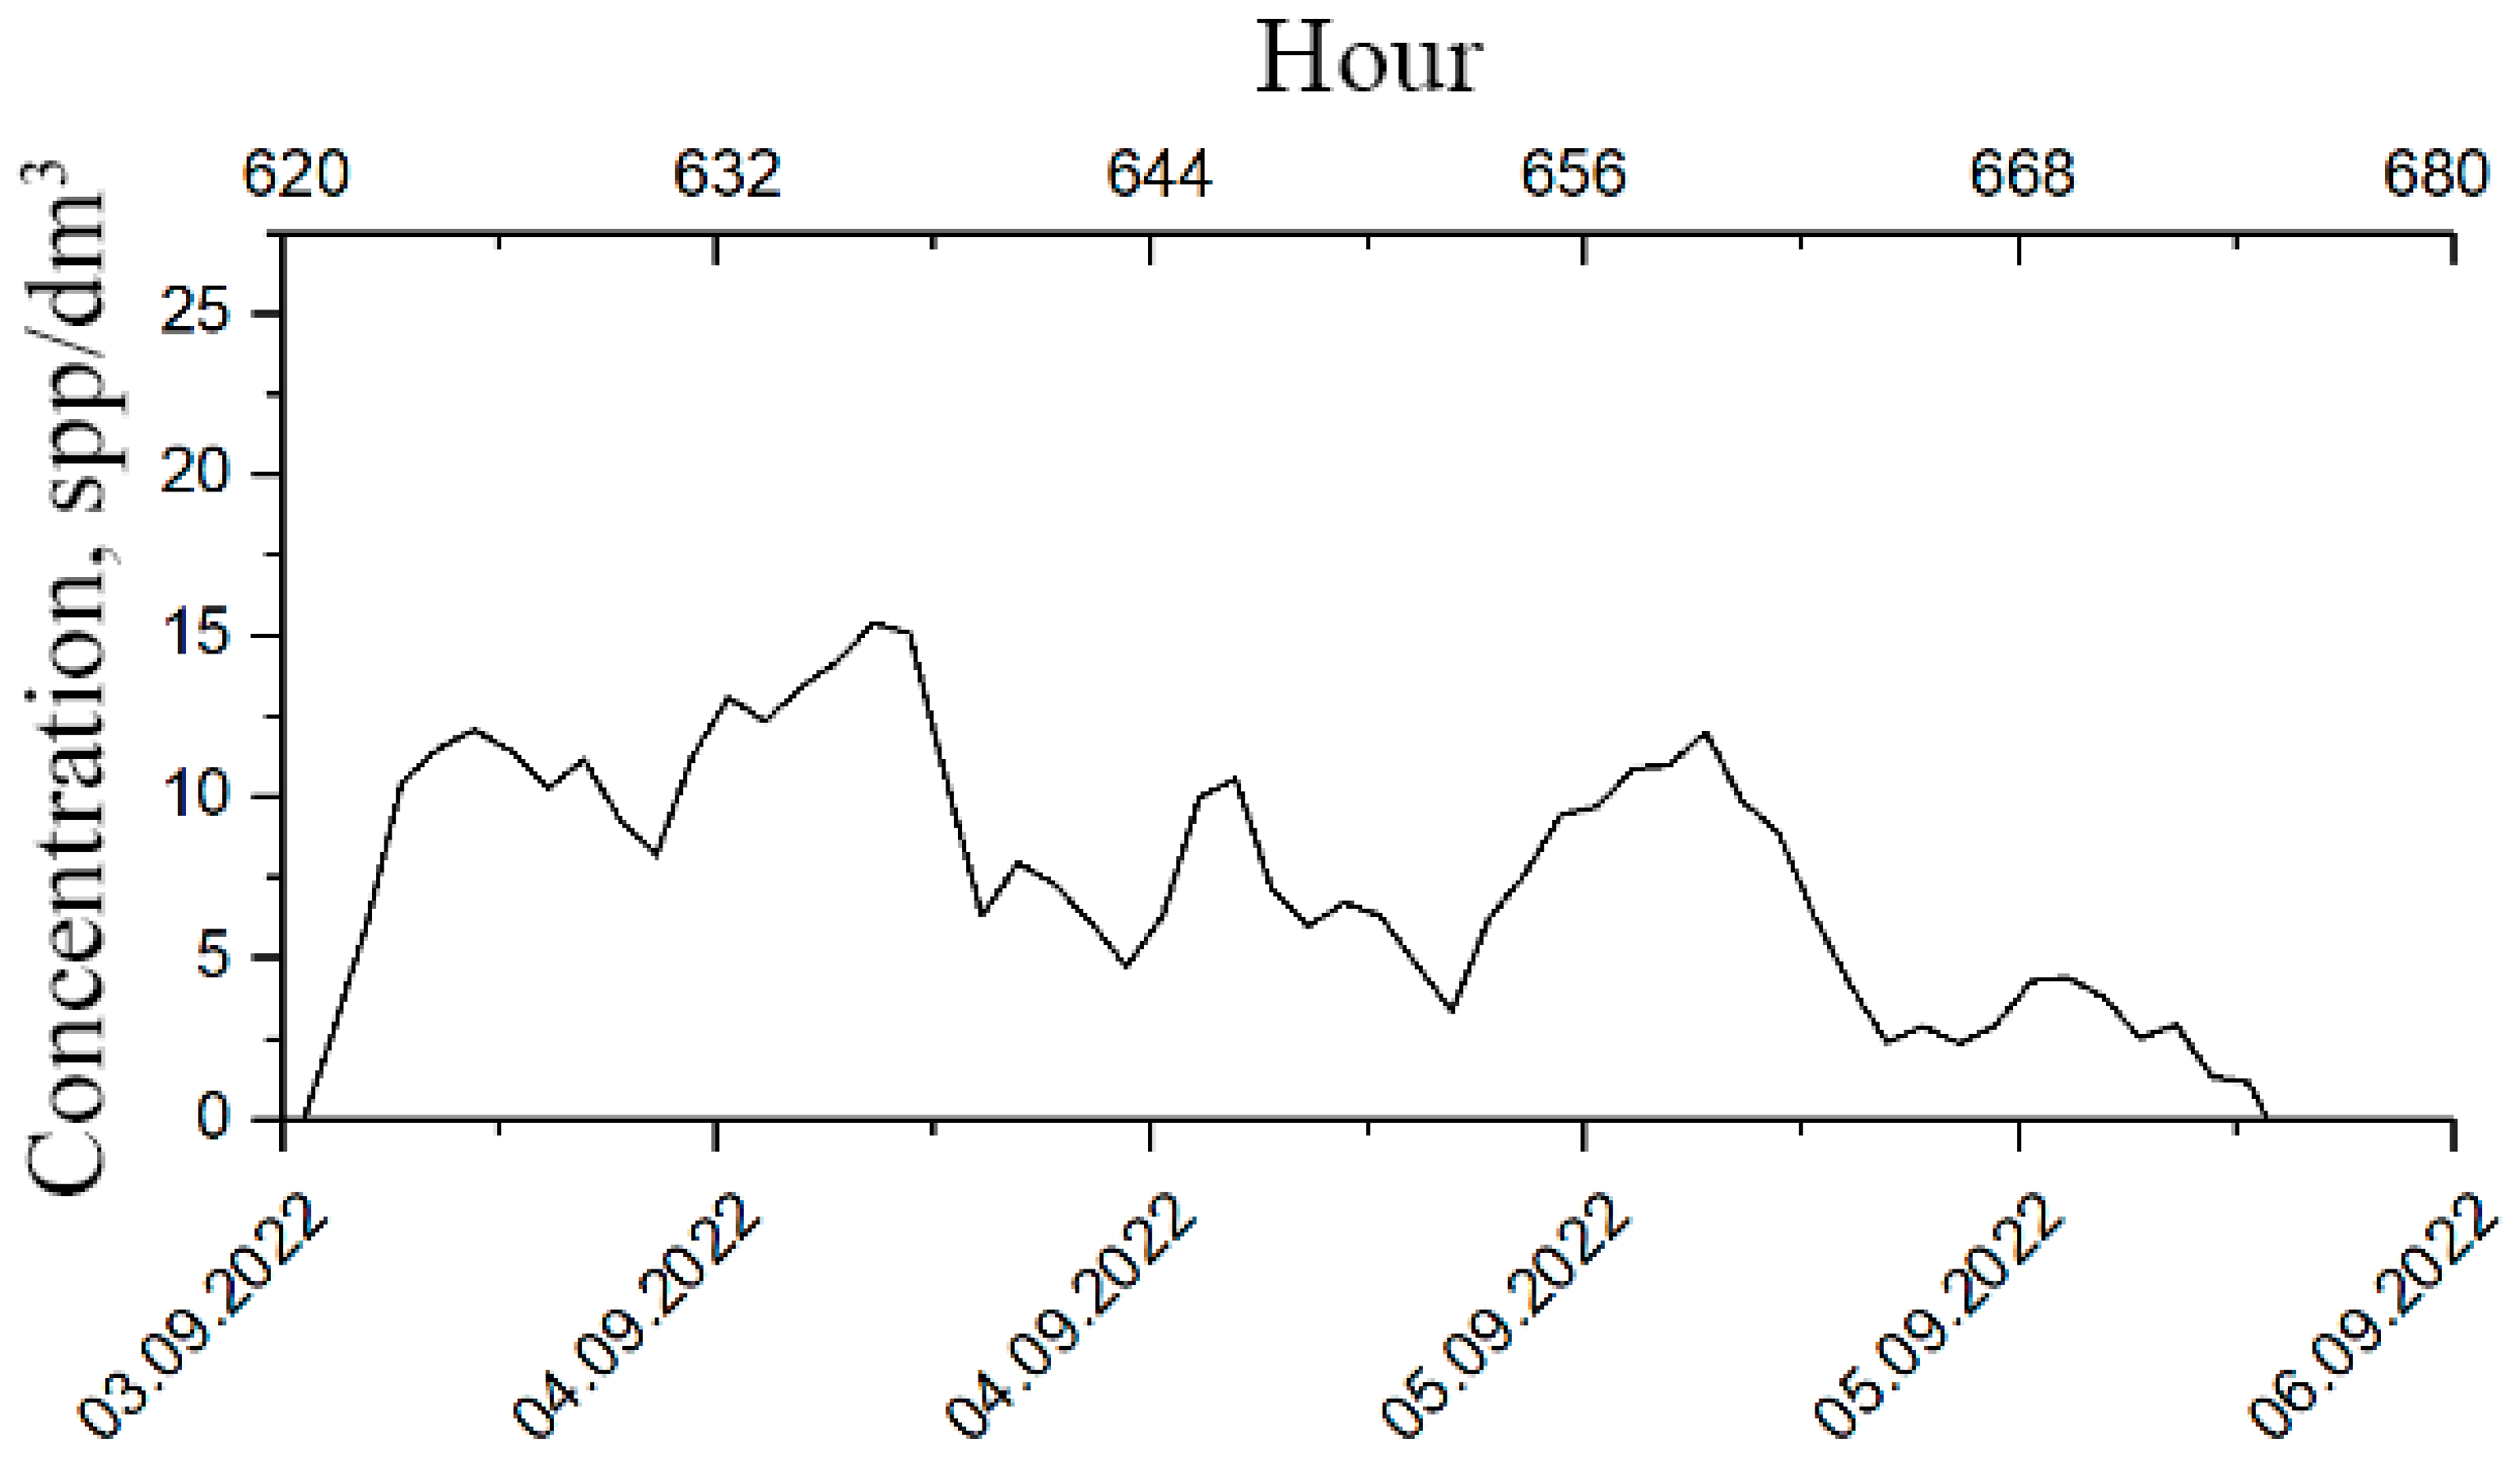
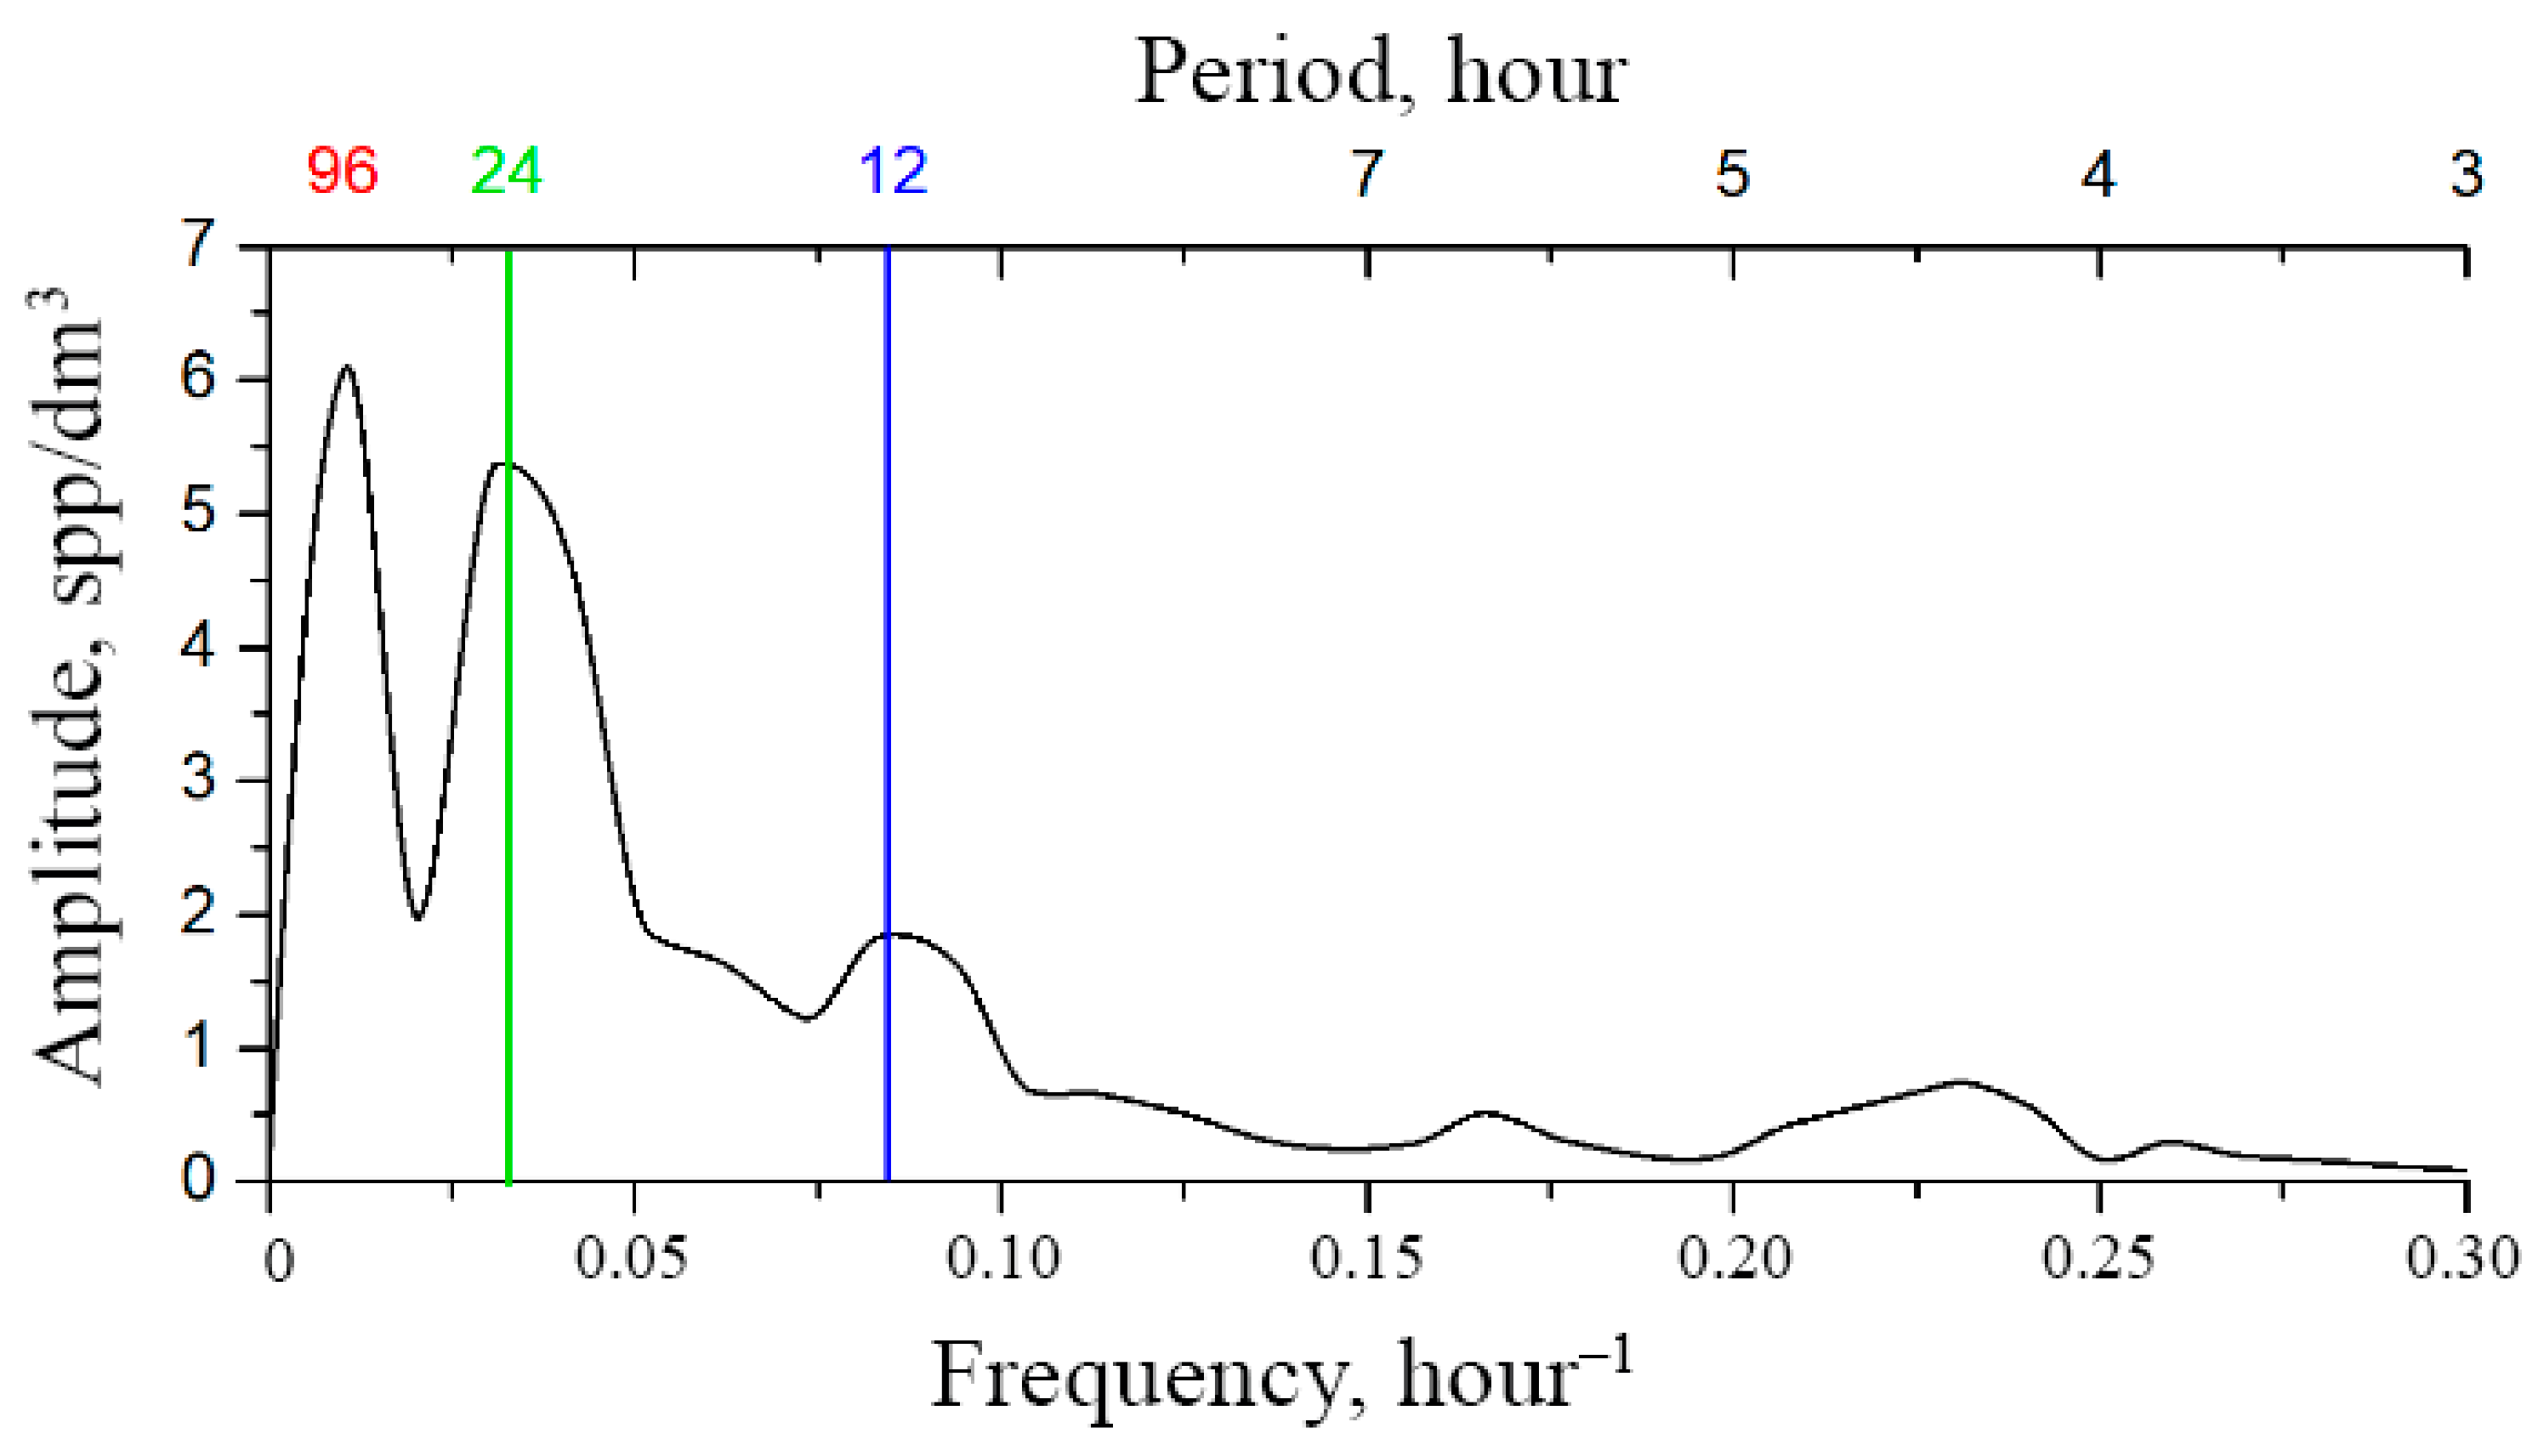
Abstract
The measurements of plankton concentration performed on various-scale registration systems are quite different from each other. This work shows that these differences are caused by the spatiotemporal structure of plankton biocenosis, as well as the features of data processing methods that take into account the scale of measurements of the corresponding methods and registration tools. Hence, this leads to the modality and periodicity of the measured plankton concentration time series, whose parameters are consistent with environmental factors. Such modality and periodicity are studied in this work by analyzing the data obtained through a natural digital holographic experiment. The paper suggests the metrics of modality and periodicity of digital holographic data characterizing their informational value. It also shows the role of the segmentation of monitoring time series at the bioindication station. The proposed approach makes it possible to link the time scales of observations with the spatial scales of the studied plankton groups. Thus, we are able to determine the spatiotemporal frameworks of bioindication estimates, reasonably plan the measurement experiments, and correctly compare the data obtained using different tools.
1. Introduction
The traditional assessment methods of plankton concentration, such as plankton network sampling, provide valuable data but are characterized by significant spatial and temporal averaging. This averaging results in a loss of information on meso- and submesoscale variability (of the order of hours and tens of meters), which is critical for nutritional dynamics, behavioral responses, and operational bioindicational monitoring. In situ digital holography is a promising differential method that makes it possible to record plankton concentrations with high temporal resolution at a fixed point, which opens up new opportunities for analyzing short-term rhythms and modalities in distribution.
Biocenosis of oceans, seas, and inland waters is characterized by inhomogeneity of organism distribution in space [1]. This is especially typical for plankton concentrations, since plankton is the most numerous representative of biocenosis and is present in almost any water area. Additionally, we can observe such basic elements of the inhomogeneity of distribution of plankton concentrations as layering and mosaic structure (spotting) [2].
Layering (vertical zonation, stratification) occurs when different types of plankton live at different depths depending on illumination, temperature, and nutrition [3].
Mosaic structure (fractal structure, spotting) is characterized by the fact that groups of organisms are concentrated inside certain areas (spots) according to certain features, including behavioral [4]. Such grouping represents spatial patterns of the horizontal distribution of individuals typical for various species. The presence of such horizontal patterns is quite critical for biocenosis, since it ensures more rational and efficient use of various types of habitats. Individuals forming such groups are characterized by high survival rates and use food resources most efficiently. This leads to an increase in the diversity of species in the biocenosis, contributing to its stability and vitality.
Measurements of plankton concentrations both in inland waters and in seas should consider migrations and active movements of plankton organisms [5,6,7].
These movements occur with diel and annual frequency, while diel is considered the largest synchronous biomass migration in the world. Some studies note that the temporal structure of migrations is not reduced to these two harmonics and light synchronizing stimuli acting in the vertical direction, but there are other reasons for plankton number change caused by structural spatial variations, including horizontal pattern [8,9,10,11,12,13,14,15,16].
Migrations may cause the confinement of some organisms to certain layers of water, or a mosaic of fractal structure can be disrupted and their spatial distribution will significantly change. The biotic stimuli for such changes include seasonal, age-related, reproduction-related, nutrition, and protection from enemies.
Spatiotemporal variability of plankton is shown as characteristic rhythms (modalities) covering a wide range of scales: from short-term (<1 day) and mesoscale (days, kilometers) changes associated with behavior and turbulence to synoptic (weeks) and seasonal (months) fluctuations controlled by large-scale physical processes [8,9,10,11,12,13,14,15,16,17,18,19,20,21,22].
These quite static and slow time-varying components of spatial inhomogeneity (layering and spotting) are influenced by variability associated with both fast and slow time-varying environmental factors (wind currents, tides, anthropogenic impacts, etc.). All this affects the results of plankton concentration measurements and contributes to the fact that the variabilities of the corresponding plankton groups are correlated with each other [23].
One of the reasons for the mosaic structure of the spatial distribution of plankton is associated with predators that consume it. This obviously introduces some adjustments to the spatiotemporal inhomogeneity of plankton concentrations, but this effect is quite stable over time and does not destroy the fractal structure of plankton concentrations if the biocenosis is fully developed [24,25,26,27,28,29,30,31].
In particular, the structuring role of currents in the inhomogeneity of plankton distribution is well known [32,33,34,35,36,37,38,39,40,41]. The interaction of currents and turbulence as a result of such interaction contributes to the transport of organisms. Thus, there are two transfer mechanisms—advection and diffusion [42].
It is well known that the inhomogeneous distribution of plankton individuals is mainly caused by turbulence [43,44].
The average component of a flow ensures the advective transfer of plankton, including from spot to spot in a mosaic structure, thus performing an averaging role. Due to the fact that its vector changes its direction, the fluctuating turbulent component of the flow destroys the spotted structure, thus capturing (engaging in the vortex) a portion of plankton from a subsequent spot. This fosters the change in plankton concentrations in both horizontal and vertical directions [45]. Therefore, the characteristic scales associated with turbulent structures should be reflected in characteristic frequencies (harmonics) of spatial–frequency variability spectra of plankton concentrations along with other drivers of variability [46,47,48].
This study shows that the periodicity of concentrations of mesoscale and submesoscale duration (~several hours) is also associated with processes within turbulent structures. This paper proposes and studies the mechanisms of the influence of the habitat (water) state on the structure of biocenosis and the variability of plankton concentrations. For this purpose, long time series of plankton concentration are measured and analyzed using a submersible digital holographic camera (DHC) at its location. The variety of scales of the mechanisms of action leads to modalities in these time series of measurements. These modalities are caused and controlled by different habitat parameters and require different methods for their identification to achieve the required spatial and temporal resolution in plankton concentration distributions. In this article, window editing and segmentation of the time series of the DHC data are considered as such methods. This is the major focus of this article.
2. Methods and Tools
2.1. Model Description
The general practice of oceanographic studies is the use of research vessels to measure spatiotemporal distributions of water area parameters, including plankton concentrations. A research vessel goes to a given point of the water area with known spatial coordinates (station), then a measuring tool (probe) is lowered over the side using a ship winch to perform a vertical scanning of the water column with further registration of the necessary hydrophysical and/or hydrochemical and/or hydrobiological characteristics, accompanied by readings over time and depth. If the research vessel tows a net, then the distance traveled is also measured.
After some time, the research vessel moves to another station and the cycle repeats. Once the programs of the station are completed, the system compiles maps showing the spatial inhomogeneities of data and the dynamics of their temporal changes. However, both the immersion cycle and the transition times create a time period (about several hours) that does not allow taking a single pattern of all the data. Therefore, spatial distributions always have a time averaging factor measured on the scale of hours.
The movement of the research vessel also causes some uncertainties in the coordinates of the vessel in all six degrees of freedom due to wave oscillations. In addition to the fact that, together with wind drifts, this makes it difficult to work on the high seas, there might be errors in determining the spatial coordinates and hence the space data will also be averaged. The averaging scale is measured in tens of meters or more.
Various agitation and wave motion compensation systems are proposed to overcome this. However, they are not universal, since there is no empirical wave motion formula for all practical marine operations. The study [49] describes the compensation system, which is based on an electrically driven marine winch in real sea conditions with high compensation accuracy. But the equation of motion for a system with five degrees of freedom can only be built using a quite laborious and lengthy calibration procedure performed in real open sea conditions, which, therefore, is relevant only here and now. The moment of spatial averaging also occurs when these conditions deviate from the calibration conditions.
Such spatial and temporal averaging is an integral feature of measurements from the research vessel and leads to the fact that a systematic component of variability of meso- and submesoscale duration results from measurements of plankton concentrations. This duration is a critical component of the ecological forecast, since it is associated with the most important vital process of plankton nutrition and its disturbance.
If we fix the hydrobiological probe at the bottom station at a fixed distance from the bottom, we will choose the study option that in this work is called a stationary bioindication station. An optical–electronic device (DHC) for determining plankton concentrations is fixed at a stationary bioindication station at one point and registers the total concentration of plankton in the DHC working volume (or, if necessary, plankton concentration by taxa) and its variability in the form of a time series. Plankton is transferred through the DHC working volume in two ways—by natural plankton movements and under the influence of currents. The most well-known plankton movement is vertical migration (diel), which is the main, but not the only, component of the circadian rhythm.
Figure 1 schematically shows the sampling pattern for two plankton sampling methods: traditional net scanning from the research vessel with catching of plankton individuals in the entire water column and “virtual” non-contact sampling by recording holograms at a bioindication station in a small working volume of the DHC and then numerically obtaining information on the size, shape, location in space, and concentration of plankton particles and their recognition.
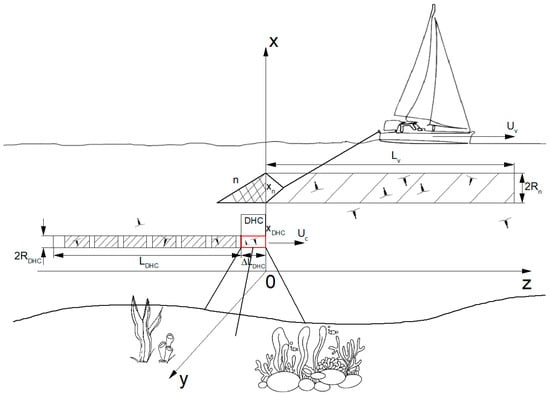
Figure 1.
Sampling scheme for determining plankton concentrations using net catching n and time averaging at stationary bioindication station of the DHC. Red box shows working volume of the DHC.
Scanning by a net with a large aperture from the research vessel. When taking samples using a net n towed by a research vessel , the sampling is formed continuously by extracting a sample with a volume , where —area of the net inlet, —path traveled by the net during sampling. Then the mean concentration in the sampled volume will equal the following:
Here we introduce the following designations:
- —speed of the research vessel (if the vessel is in place and the net is lifted vertically, then this will be the speed of the net movement),
- —time passed by the research vessel (net) for path ,
- —plankton concentration at a point with coordinate at time ,
- —changes in plankton concentration due to turbulence (t) during net transportation—assessment of spatial variability,
- —natural changes in the concentration of plankton as a result of migrations (m) during net transportation—assessment of temporal variability.
If we take 2 h as an estimate of the time interval for the transition from station to station and the sampling is quite quick, i.e.,
and we can accept , then we have the following ratio:
where the first term indicates that the sampling to determine the mean value of plankton in the water area is formed as a result of spatial averaging (does not depend on the moment of time at ), and the second term indicates the fluctuations in concentrations during transportation, i.e., averaged variability along the sampling length .
It is clear that, with a sufficiently large spatial sampling scale (usually ), the concentration averaged over the spatial sampling reaches a stationary value (does not change when increases), which is taken as an estimate of plankton concentration for this water area. In this case, the random component associated with variability should tend to 0 with a sufficient sampling size. Thus, an estimate of the sufficiency of the spatial sampling length is the expression
as a consequence,
This means that, as soon as we collected the plankton by the net, spatial averaging had already happened and it was no longer possible to obtain information on the internal variability. It is clear that the sample in spatial averaging is integral.
Registration in a small working volume at the bioindication station. A series of readings is formed at the bioindication station for temporal averaging with discrete sampling. Contrary to the previously used designation we added the index here to emphasize once again that this series is formed using the current c, the average speed of which is indicated as . Similar to (1), we can write the following ratio:
Here, —number of volumes (hourly readings) used to average over the sampling. The remaining designations are similar to those used for spatial averaging, only the index is replaced by c.
Here we introduce the following designations:
- —DHC entrance pupil area,
- —DHC working volume length,
- —equivalent length of the path “traveled” by the DHC working volume during time of M measurements,
- —average current velocity,
- —current time for path ,
- —concentration of plankton at the point of the DHC location with the coordinate at the moment of time ,
- —changes in the concentration of plankton under the influence of turbulence (t) caused by the current passing through/around the DHC—assessment of spatial variability,
- —natural changes in the concentration of plankton as a result of migrations (m) during measurements using the DHC—assessment of temporal variability.
In fact, this is the averaging over volume with length , but existing at different time intervals. At the same time, the reading per DHC exposure is recorded on a small spatial scale (Figure 2). Thus, holograms were used to form one of the M readings. The recording time between them is short compared to the time the current passes through the DHC working volume.

Figure 2.
DHC scheme. —working volume length, —diameter of the entrance pupil, if it is round, or the length of one side, if it is square. 1—laser diode, 2—output end of the single-mode fiber, 3—Galileo expander, 4—field lens, 5,5′—portholes, 6—CMOS camera, 7—computer.
Here, for ease of comparison, we assumed that the DHC pupil is round, although a rectangular pupil is more often used due to the more rational use of the matrix capabilities.
Thus, in this case the large-volume integrated sampling is formed from temporary differential readings on the basis of the operating volume length due to a set of readings, where the size of this averaging volume is defined as —number of measurement readings.
Similar to the spatial sampling formed by the net, here, when determining the sufficient length of the temporal sampling , there is an estimate from above the current situation where the ratios are guaranteed to be satisfied:
which are similar to Expression (4). Since it is true for the ergodic process that, starting from a certain value, the averaging result does not depend on the sampling, with a sufficient implementation length it is possible to write the following for a small neighborhood of the same coordinate of the measuring station:
Note here that many researchers emphasize a significant difference in the measured values of plankton concentrations when differential and integral methods are used [50,51,52].
If we do not consider the regular component of diurnal variability [53], but talk only about the average concentration, then Equality (8) is true if the following conditions are met:
- and are large enough to consider and as limit concentrations, which the respective sums tend to when the sampling size increases. This happens when the fluctuating component tends to 0, i.e., Ratios (4), (6) are satisfied;
- directions of vectors and may not coincide in the case of the stable biocenosis of the fractal structure spot and measurements inside it;
- averaging times and must be large enough for the fluctuation part to be equal to 0. Note that for this is set by selecting the parameter ;
- sampling shall be performed in one layer (tier).
The differential nature of samples recorded at the bioindication station makes it possible to form a time series of plankton concentration measurements, followed by its integral processing and frequency analysis of the temporal variability of plankton concentrations in order to obtain information on the modes of this variability and its spatial scales.
2.2. Marine Experiment and Data Processing Methods
This work uses data obtained at the bioindication station using a submersible digital holographic camera (DHC) [54].
In comparison with other methods of zooplankton study, a hydrobiological probe equipped with the DHC and installed for continuous operation allows obtaining information on the number, shape, and size of particles in the studied volume in real-time monitoring conditions. Figure 2 shows the operating principle of the DHC based on the in-line Gabor scheme.
The laser diode (1) radiation emitted from the output end of the optical fiber (2) passes the expander (3). In this case, a parallel beam is formed, which is partially scattered when falling on particles in the studied volume, thus forming an object wave, and partially passes without scattering and forms a reference wave. As a result of coherent interaction of these waves, an interference pattern is formed, which is registered on the CMOS camera matrix (6) and recorded in the computer memory (7) as a two-dimensional array of intensities representing a digital hologram. The lens (4) makes it possible to match the transverse size of the beam illuminating the volume with particles and the size of the matrix but at the same time performs a scale transformation. The image of the particle volume is then reconstructed numerically in layers from the digital hologram. For this purpose, the hologram illumination is numerically simulated by a reconstructing wave, the wave front of which is not necessarily similar to the reference wave. Then, the field and intensity distributions in cross-sections of the studied volume are calculated successively at different distances using the diffraction integral [55].
The presence of sealed portholes (5 and 5′) allows dipping the DHC into aqueous media and recording a hologram of the water volume with particles suspended in the water, which is called the working volume. The length of this working volume is determined by the distance between the portholes, and the cross-sectional area is determined by the size of the entrance pupil . Depending on the position of the CMOS camera matrix, the pupil can be round, so that the projection of the matrix is described around the pupil of the lens (4), or square—if the projection of the matrix is inscribed in this pupil. In the first case, the cross-sectional area is taken equal to and, in the second, to .
During the expedition in the Barents Sea (in the waters of Zelenetskaya Bay, Russia, at the experimental training site of the Murmansk Marine Biological Institute of the Russian Academy of Sciences (MMBI RAS)), the DHC was set on a long-term stationary moorage at a depth of ~20–25 m about 4 m from the bottom level. Thus, N = 20 holograms of the working volume of seawater with plankton were recorded with an interval of 1 s to form an hourly reading. The working volume recorded per exposure was 0.12 dm3 for a square pupil with an area 228 mm2, 494 mm. A 2048 × 2048 pixel matrix was used in this experiment. The pixel size of the entrance pupil, taking into account the increase in the digital holographic process, was 7.37 × 7.37 µm.
The corresponding sensors were placed at the station to verify changes in the time series with the natural variability of the habitat factors (pressure, temperature, conductivity, dissolved oxygen, upper illumination). Data taken from Russian weather forecast sites were used to assess the importance of weather factors, such as wind direction, sunrise–sunset, and phases of the Moon.
Digital holograms were transmitted to the coastal computing station through the fiber-optic communication line (FOCL) to process the hologram flow and, if necessary, to classify plankton by taxa, to determine plankton concentration in the working volume, and to form a time series of measured plankton characteristics.
Digital holograms were processed using specialized software that implements a Fresnel-transform-based numerical image reconstruction algorithm [56,57]. Threshold segmentation was used to identify and count plankton organisms [58]. Taxonomic identification was not performed within this study, while the total number of zooplankton was analyzed. The concentration of plankton () in the working volume for each hologram was calculated using the formula: , where —number of organisms identified on a hologram, and 0.12 dm3—sample volume.
The long-term monitoring experiment lasted from 23 July to 24 September 2022. During this time, we recorded a continuous series of plankton concentrations, which lasted for 32 days, starting from August 6 (Figure 3a).
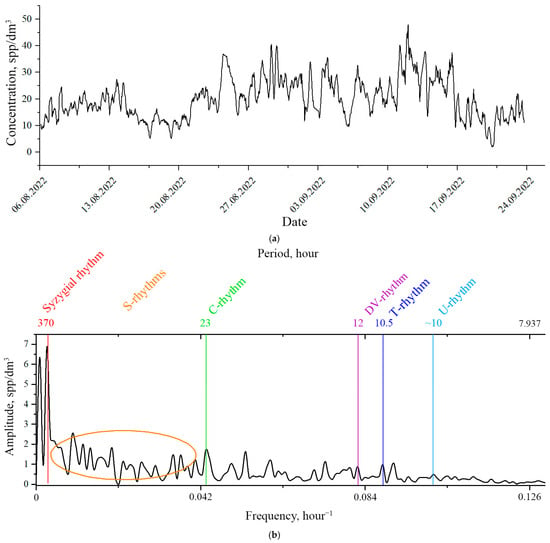
Figure 3.
Results of plankton concentration monitoring measurements in the DHC working volume at the bioindication station on the Barents Sea at the point with coordinates 69°07′7.9″ N 36°04′10.9″ E: (a)—time series of plankton concentration, (b)—Fourier image of the time series of plankton concentration. Orange ellipse—range of structuring rhythms.
The experimental plankton concentration measurement is presented as follows:
where —average concentration determined by the processing of N = 20 holograms recorded every hour in the working volume 0.12 dm3, Δ—error of the average for the readings calculated in a standard way for 20 data taking into account the significance level p = 5%.
Figure 3a shows the mean concentrations . The mean error for all readings was Δ ssp/dm3.
Figure 3b illustrates the structure of temporal variability of zooplankton, alongside the Fourier spectrum of the time series.
In the given spectrum it is possible to determine the spectral ranges (bands) of characteristic temporal rhythms (modes) of zooplankton in a particular water area as follows:
- band of diurnal (microscale) rhythms, whose time scale of changes is measured in hours, frequency range—1/10 h−1–1/3 h−1;
- band of diurnal (mesoscale) rhythms, whose time scale of changes is measured in tens of hours, frequency range—1/50 h−1–1/10 h−1;
- band of synoptic rhythms, whose scale of changes is measured in months, seasons, frequency range—less than 1/50 h−1;
- area of seasonal rhythms, whose scale of changes is measured by seasons, years, frequency range—less than 1/50 h−1.
It is well known that the Fourier spectrum is decomposed according to characteristic harmonic functions (modes), therefore, the above rhythms will be called modes.
Here, we are talking about spatiotemporal modalities due to the fact that the mentioned spectral ranges of temporal variability of plankton concentrations are determined by the size of hydrobionts, the laws of their behavior [41,42], and interaction with environmental factors and therefore change in various spatial localization areas (spotted plankton structure).
The concentration of animals inside the spatial localization is corrected by the rhythm of the drivers—hydrophysical fields with a certain spatial distribution and temporal component in their formation. In this case, the temporal components of plankton variability and the driver coincide, i.e., the influences are synchronized.
Variability of spatial inhomogeneities of plankton concentrations can be classified by the following scales [17,18,19,20]:
- Small-scale inhomogeneities. Spatial dimensions range from tens of centimeters to meters within a spot of the fractal structure. They are caused by small-scale turbulence, movements of crustaceans, and biotic processes of diurnal duration typical for different taxa of the population.
- Mesoscale inhomogeneities. Spatial dimensions range from hundreds of meters to kilometers. They are determined by the characteristic size of the fractal structure spot. Inhomogeneities of this type are generated by biotic interactions of diurnal duration initiated by the illumination factor. They are adjusted by inertial and tidal movements in the ocean and diurnal fluctuations in the intensity of the thermodynamic interaction of the ocean and atmosphere. Behavioral responses and plankton biocenosis strategies can be observed at the mesoscale.
- Synoptic inhomogeneities. Spatial dimensions of the drivers are the characteristic scale of the variability of hydrophysical fields in the ocean, which ranges from tens to hundreds of kilometers. The time scale of their existence ranges from several days to months. Such inhomogeneities in the distribution of temperature and salinity are associated with the existence of vortex formations in the ocean. Plankton fields still occupy hundreds of meters and kilometers, but the morphometric characteristics of the population and spatial localization in the form of a fractal structure with elements of synchronization of plankton properties inside the spots change under the influence of hydrophysical fields.
- Large-scale inhomogeneities. The estimates of horizontal dimensions for the inhomogeneities of this scale range from hundreds to thousands of kilometers. The elements of the large-scale structure of hydrophysical fields are characterized by different scales of temporal variability—seasonal, interannual, and intercentury. Under the influence of these drivers, not only does the fractal structure change but also the taxonomic composition of plankton biocenoses [21,22].
In this characterization of modalities we were limited to horizontal estimates, since the sample of plankton concentrations in the DHC working volume is formed in the horizon, although vertical migrations (diel) are also present in the diurnal band rhythm.
Modality (i.e., identification of spectral components of concentrations with spatial drivers in their formation) allows establishing the cause of the rhythm, its contribution to the variability of plankton concentrations, and the scale of this influence. The analysis of the rhythm variability of plankton concentrations and the revealed irregularities in modality makes it possible to diagnose the cause and disturbances in the structure of causal relationships within plankton biocenosis.
Registration of plankton concentration time series is a long process that delays processing needed to obtain the analytics. Therefore, the diagnostic problem can be limited to the diurnal variability range, i.e., mesoscale short-term phenomena, which are the most interesting for diagnostic purposes. Thus, by dividing the series of observations into time segments presented for analysis, we automatically select the modality of variability. For example, for a segment of a time series lasting several days, this is mesoscale variability of plankton concentrations.
Figure 3b shows the spectral lines of the following rhythms:
- S—structuring rhythms associated with turbulence (~25–300 h);
- C—circadian rhythm (~23–25 h), solar synchronization;
- DV—diurnal variability rhythm (~12 h), basic nutrition;
- T—tidal rhythm (10.5–13 h), tidal synchronization of the DV rhythm;
- U—first ultradian rhythm caused by fractional nutrition.
These rhythms are critical to build the model of variability of plankton biocenosis.
For qualitative spectral analysis and identification of these lines it is required to know the trend—the average concentration at a given place, which is influenced by S rhythms. By identifying the trend line of the time series of plankton concentrations, we filter (eliminate) the structural variability (S rhythm) and mark the long-term variability of synoptic and large-scale modality. Thus, if we exclude this trend from the monitoring results, we obtain a simplified model of biocenosis taking into account the rhythm generated by the interaction of C and T rhythms.
An example of trend identification in a particular experiment is presented in the next section of this paper. The main mathematical method used to process the results of a digital holographic experiment according to the differential measurements of the time series of plankton concentrations is averaging over time by window editing of these series in accordance with the following formula:
In this case, the window length, as well as the row length, is a filtering parameter of the time frequencies generated by the variability drivers. Therefore, the optimization of this duration is directly related to the formation conditions of the initial series and the considered concept of its modalities.
3. Results and Discussion
3.1. Synoptic Band Modalities in Plankton Concentrations
Recall that these are modalities caused by synoptic phenomena. They are characterized by temporal scales—days, months, seasons.
Table 1 shows the wind directions from the weather archive at the moorage site from 6 August to 24 September 2022 and their correspondence to the rhythms (modes) of the Fourier spectrum of the time series of plankton concentration measurements for these days. Indeed, the movements of the spots of the mosaic structure of plankton are associated, among other things, with wind direction. During continuous measurements of plankton concentrations using the DHC, the time series of measurements apparently contain time scales (modes) associated with wind durations in the corresponding directions and their repeatability. In Table 1 these time scales are compared with the modes observed in the Fourier spectrum of this time series during the observation period (Figure 4) at the moorage site in the Barents Sea.

Table 1.
Duration of wind directions during time series formation.
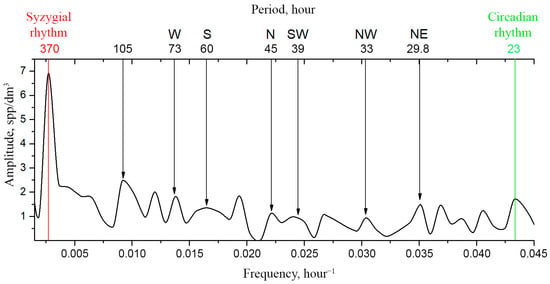
Figure 4.
Fourier amplitude spectrum of the time series of plankton concentration recorded by the DHC during the moorage period. Arrows show the lines of some S rhythms. Letters indicate traditional wind directions corresponding to these S rhythms. The line with a period of 105 h reflects the average recurrence interval of the west wind direction prevailing during the moorage period.
Note that the west wind was predominant during the observation period and it was observed with an average interval of 4.15 days, which in Figure 4 corresponds to the mode (rhythm) of 105 h (4.2 days).
Thus, the comparison of the data in Table 1 and Figure 4 makes it possible to detect a correlation between the wind direction and rhythms present in the spectrum that are not circadian, tidal, etc. It is logical to refer them to S rhythms (structuring), since the wind leads to the formation of turbulent energy-bearing vortex structures and the movement (structuring) of the mosaic structure through the moorage site and, hence, through the measuring volume of the DHC. As for the turbulence due to structuring rhythms, we do not exclude other abiotic factors of plankton concentration variability, except for wind, which may include the phenomena in the thermocline, convective transfer, upwelling, seiches, and wind-induced currents. We observe the influence of these factors in the S-band rhythms not identified in Figure 4.
Note that the periods of S rhythms are more than a day, i.e., their value fits within the interval between the circadian rhythm (23 h in a given situation) and the mode of syzygial tides—370 h.
It is advisable to use a circadian rhythm (C) to obtain information on the behavioral responses of plankton. In this case, it is necessary to eliminate the unnecessary information on tidal (T) and structuring (S) rhythms from the Fourier spectrum of plankton concentration. We can determine the average characteristics of plankton within the averaging time by averaging the readings of the time series recorded by the measuring device with a small measuring base, which is the DHC. This time averaging is equivalent to space averaging, according to Boltzmann’s ergodic hypothesis [59], if it is performed within the ergodicity interval determined from the condition of the S rhythm loss on the edited time series.
The duration of the time series should be sufficient for such averaging. A feature of such sufficiency is the elimination of the S rhythm and all other rhythms with times shorter than the period of syzygial tides and longer than the circadian rhythm. The use of averaging with the correct window size eliminates the component of variability in Formula (6), which is associated with the change in plankton concentration due to turbulence (t) during measurements. Figure 5 shows examples of the dependence of the S rhythm amplitude on the duration of the averaging window.

Figure 5.
Dependence of S rhythm amplitude on averaging window duration: 60 h (a) and 105 h (b).
The graphs in Figure 5 show that, in order to calculate the trend of plankton concentrations, when it is necessary to filter the S rhythm and not lose information about the C rhythm, it is advisable to use a window no more than 72 h (three days) in length.
Figure 6a shows the trend line for the considered series calculated based on the 72 h window processing of differential readings of plankton concentrations using the DHC.
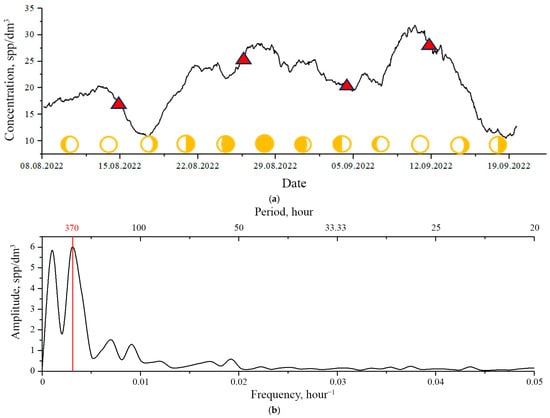
Figure 6.
Long-term modality of plankton concentrations at the moorage site, determined from the condition of the S rhythm loss and comparison with the results of net catching according to the accepted method of integral sampling (marked with a red triangle): (a)—trend of plankton concentrations of the time series from Figure 3a, (b)—Fourier transform (spectrum) of the trend. The red vertical line shows the syzygial rhythm line. The yellow circles show phases of the Moon.
The experimental DHC measurements of plankton concentrations are presented as follows:
where —average concentration determined by the processing of N = 20 holograms recorded every hour in the working volume 0.12 dm3 with the window duration of M = 72 h, Δ—error of the average for the readings calculated in a standard way for 1440 data taking into account the significance level p = 5%.
The black line in Figure 3a represents the mean concentrations . The mean error for all samples was Δ ssp/dm3.
The data obtained using the standard integrated plankton sampling (red triangles in Figure 6) are also shown here. A small Juday net was used (inlet diameter—18 cm, mesh size of the filter cloth—168 µm) as a catching tool. Sampling was carried out in the layer from the bottom to the surface from the berth. The plankton sample was poured from the plankton glass into a 1 L plastic container and fixed with a 40% solution of formalin neutralized with sodium tetraborate, the final concentration in the sample being 4%. The samples were processed in the laboratory. The laboratory analysis of samples was performed according to standard methods: three subsamples with a volume of 2–3 mL were taken from each sample (the volume of subsamples depended on the number of organisms), which were analyzed in a Petri dish (depending on the size of zooplankters) using an MBS-10 stereoscopic microscope (with magnifications ×16, ×32, or ×56) (LOMO, Leningrad, Russia). The organisms were identified to class, genus, and, if possible, species. The results of the quantitative analysis of three samples were averaged and recalculated in spp/dm3 taking into account the volume of filtered water, assuming 100% filtration efficiency of the net. The mean concentrations thus determined are shown in Figure 6 with red triangles. The mean error did not exceed 20%.
The comparison of results of integral and differential methods shows good compliance with experimental data.
Figure 6b shows a Fourier image of the trend line illustrating the filtering efficiency of S rhythms and diurnal and ultradian rhythms.
3.2. Mesoscale Band Modalities in Plankton Concentrations
Recall that these modalities have time scales—tens of hours, several days—and the scale of diurnal modalities is in hours.
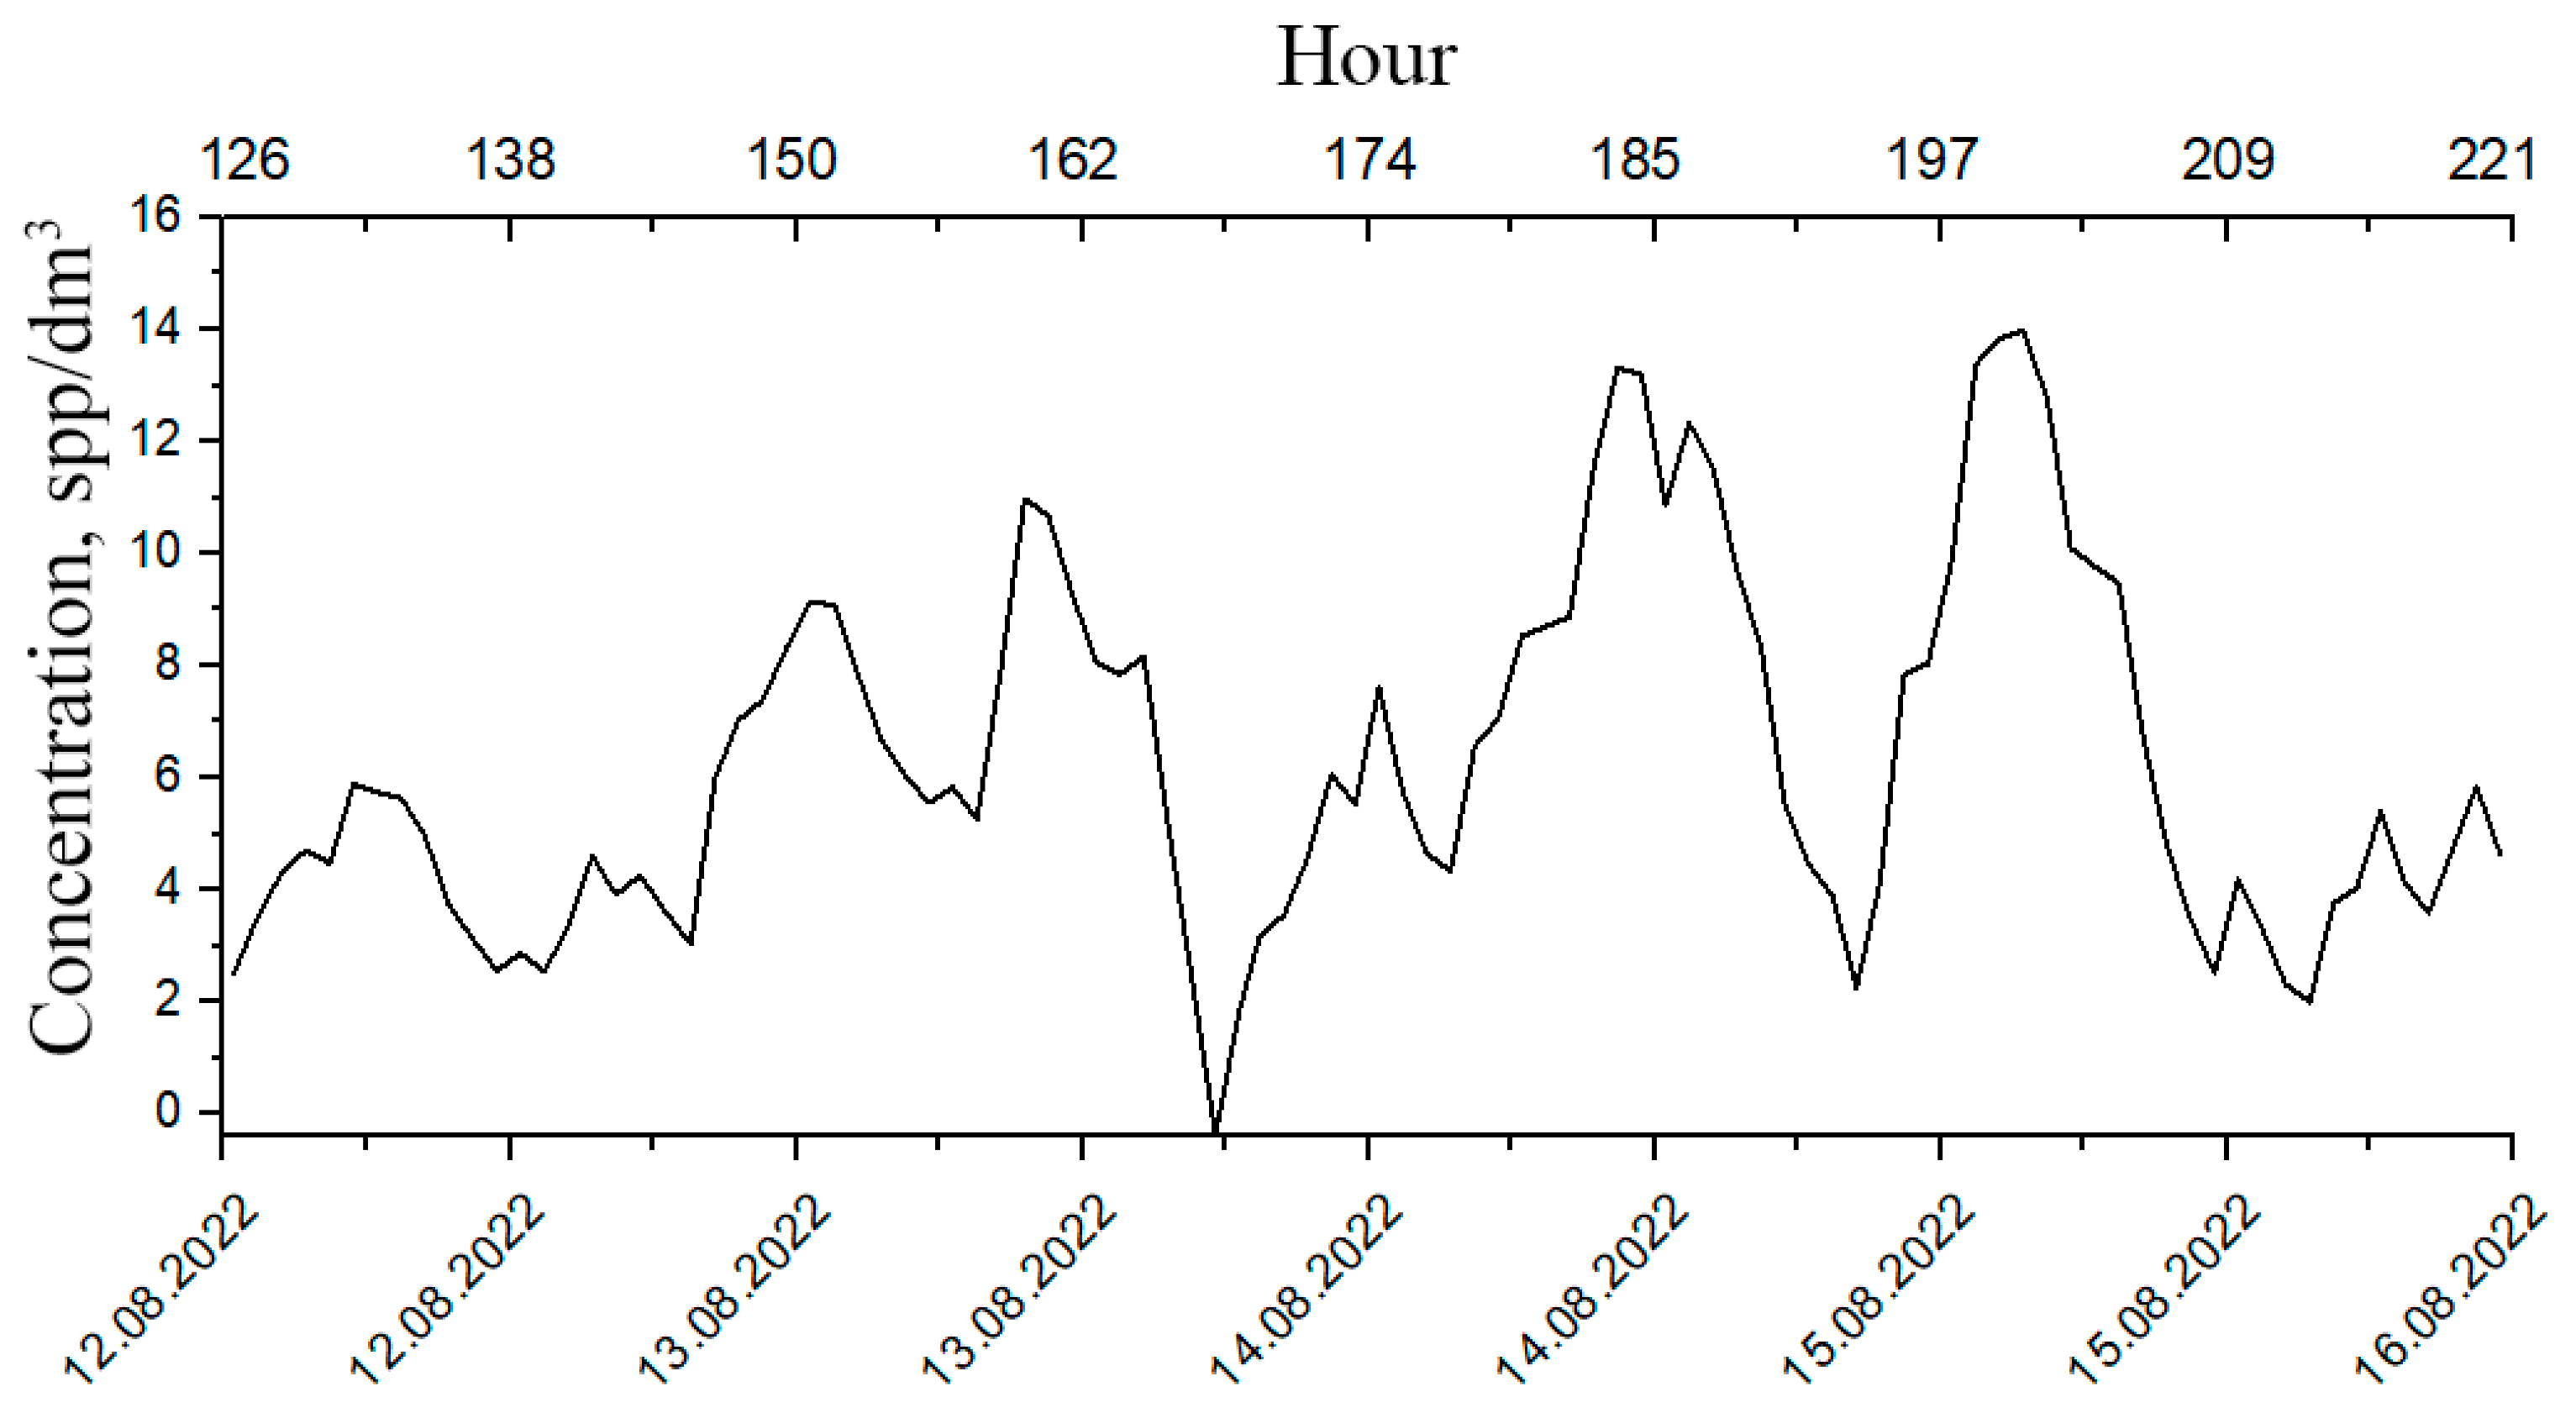
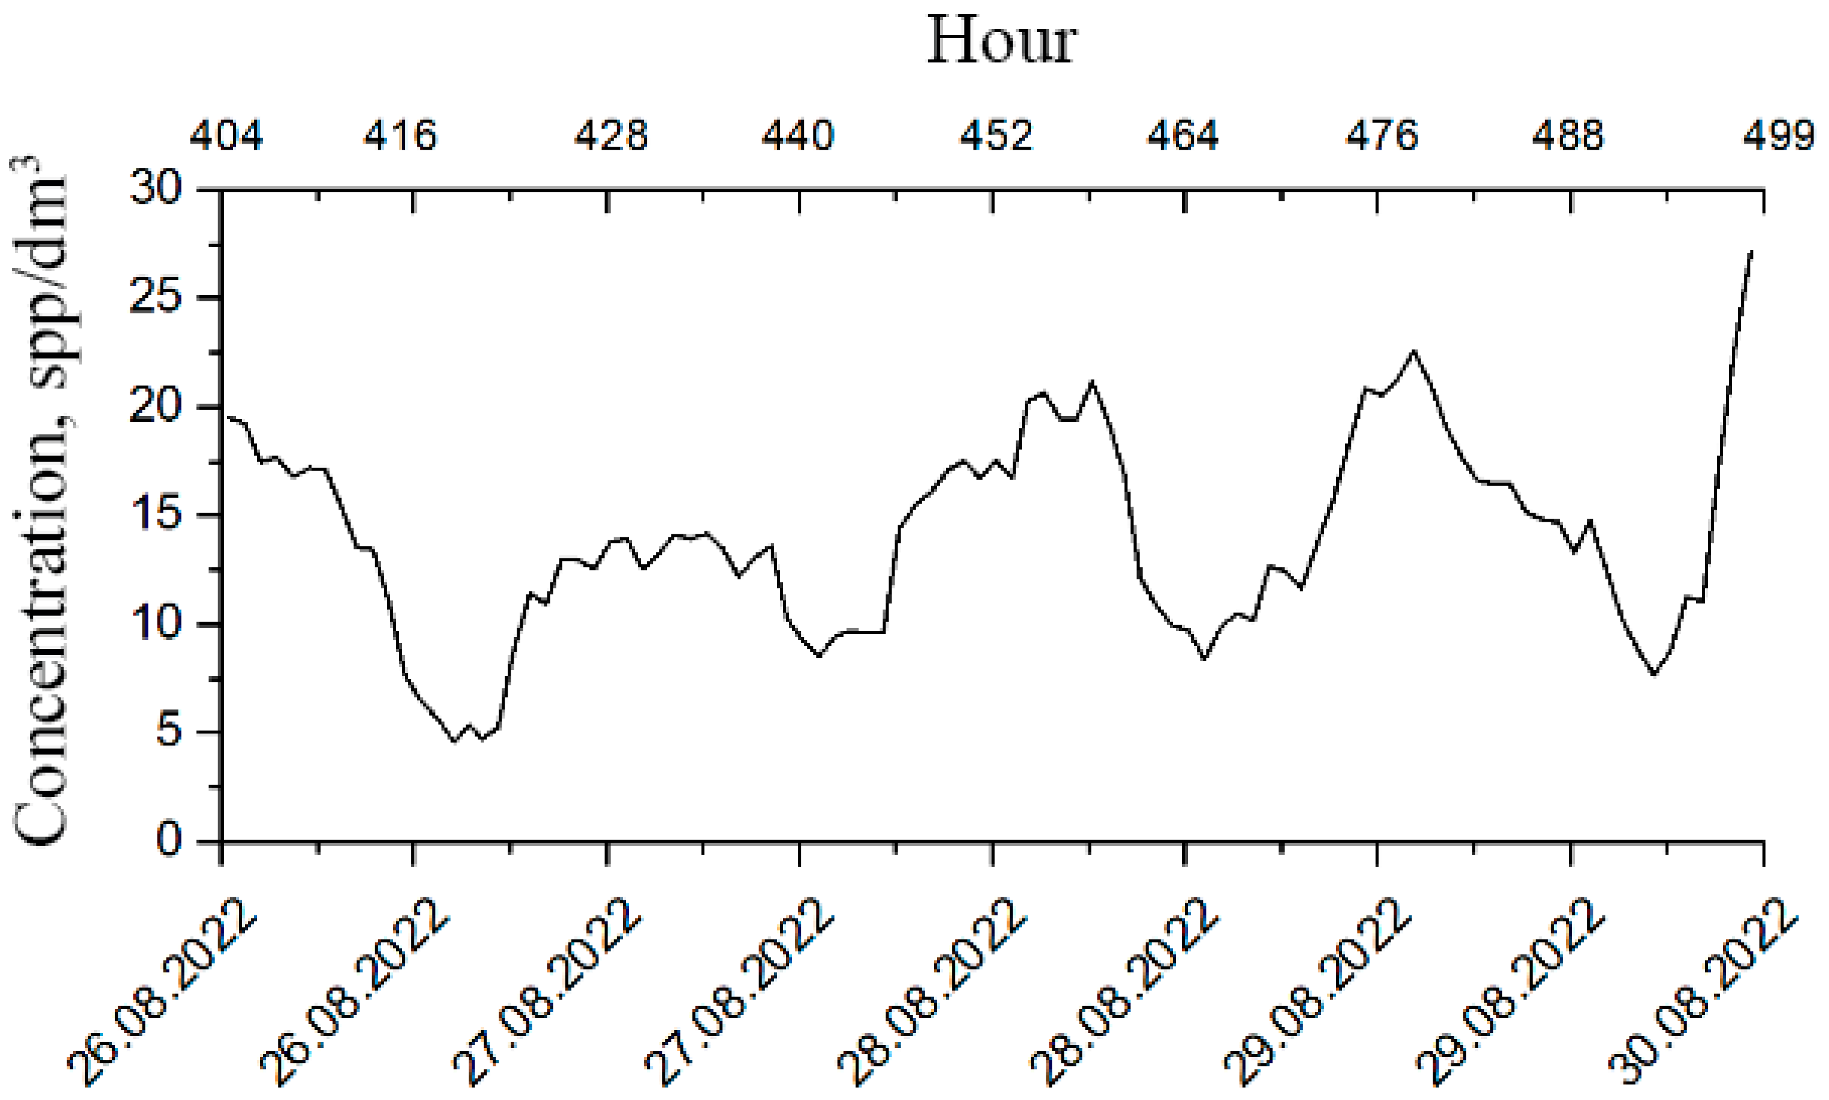
These modalities are particularly interesting since the behavioral responses of plankton change within these time scales, which means that it is possible to determine the deterioration of its well-being at an early stage. Therefore, it is advisable to use the segments of plankton concentration time series for the analysis of plankton behavioral responses (Figure 7).
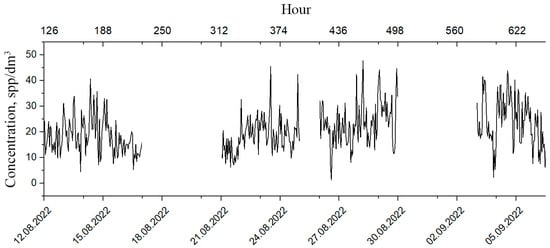
Figure 7.
Segmented time series of plankton concentrations.
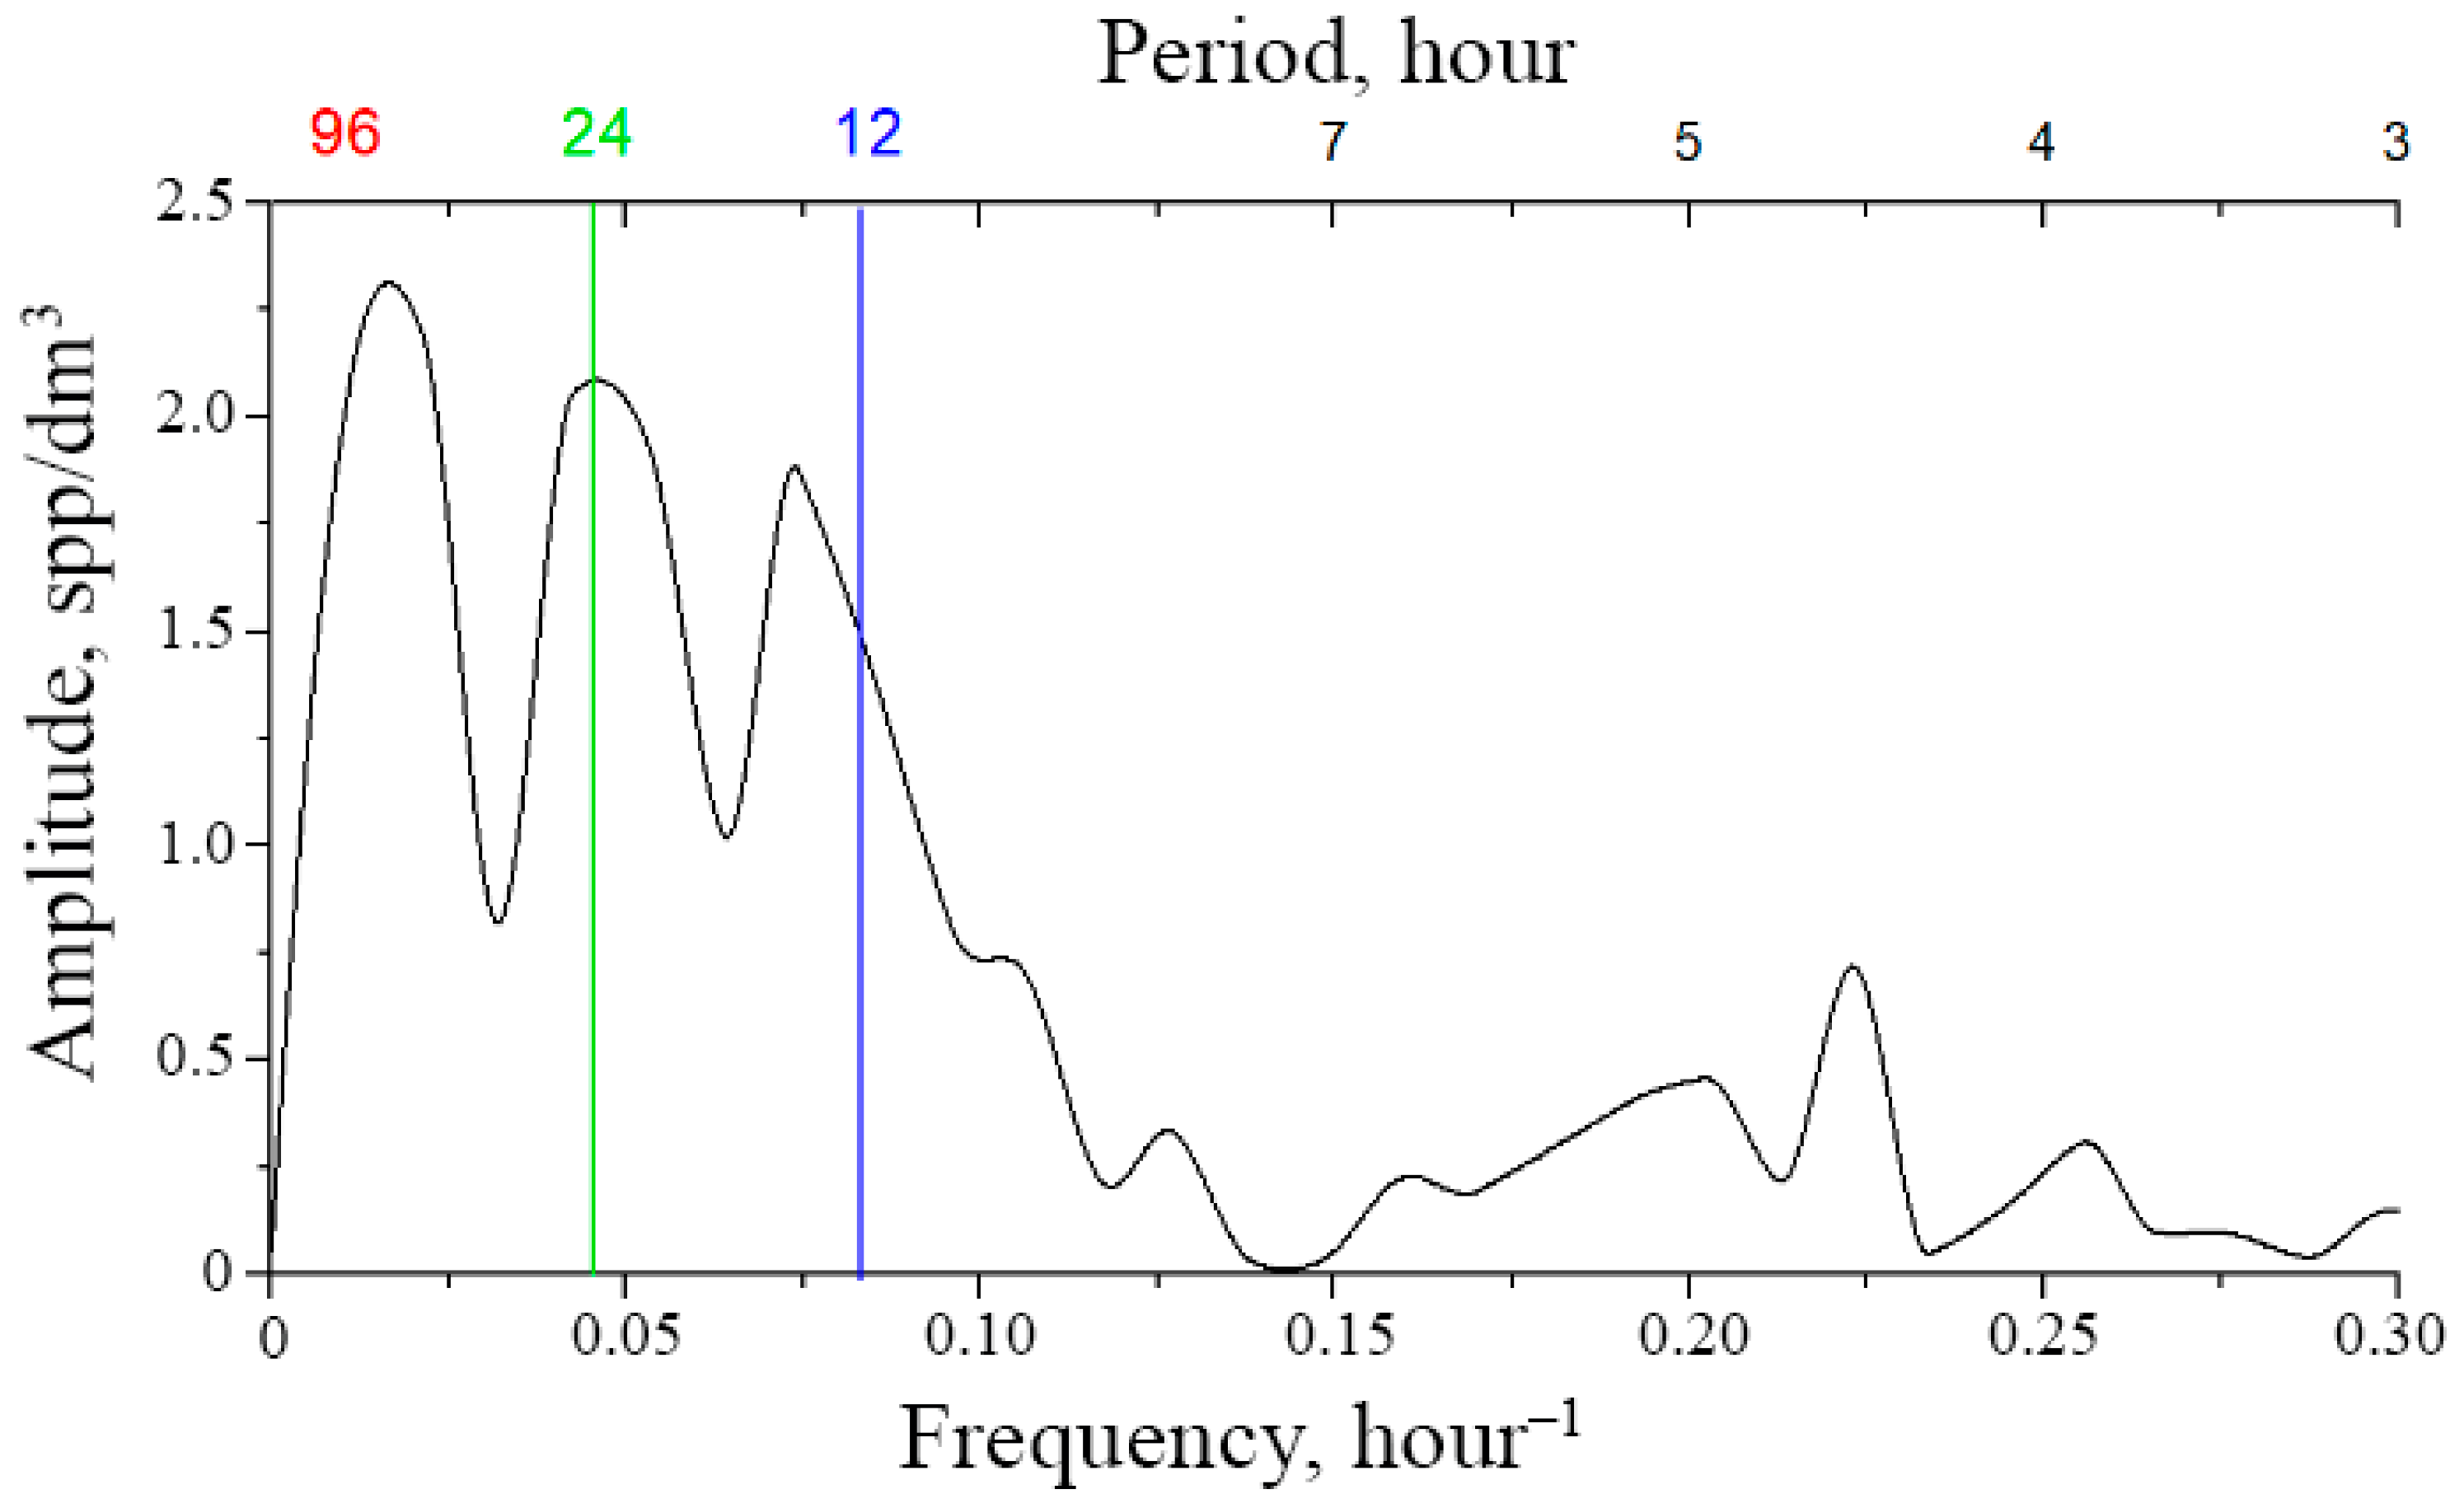
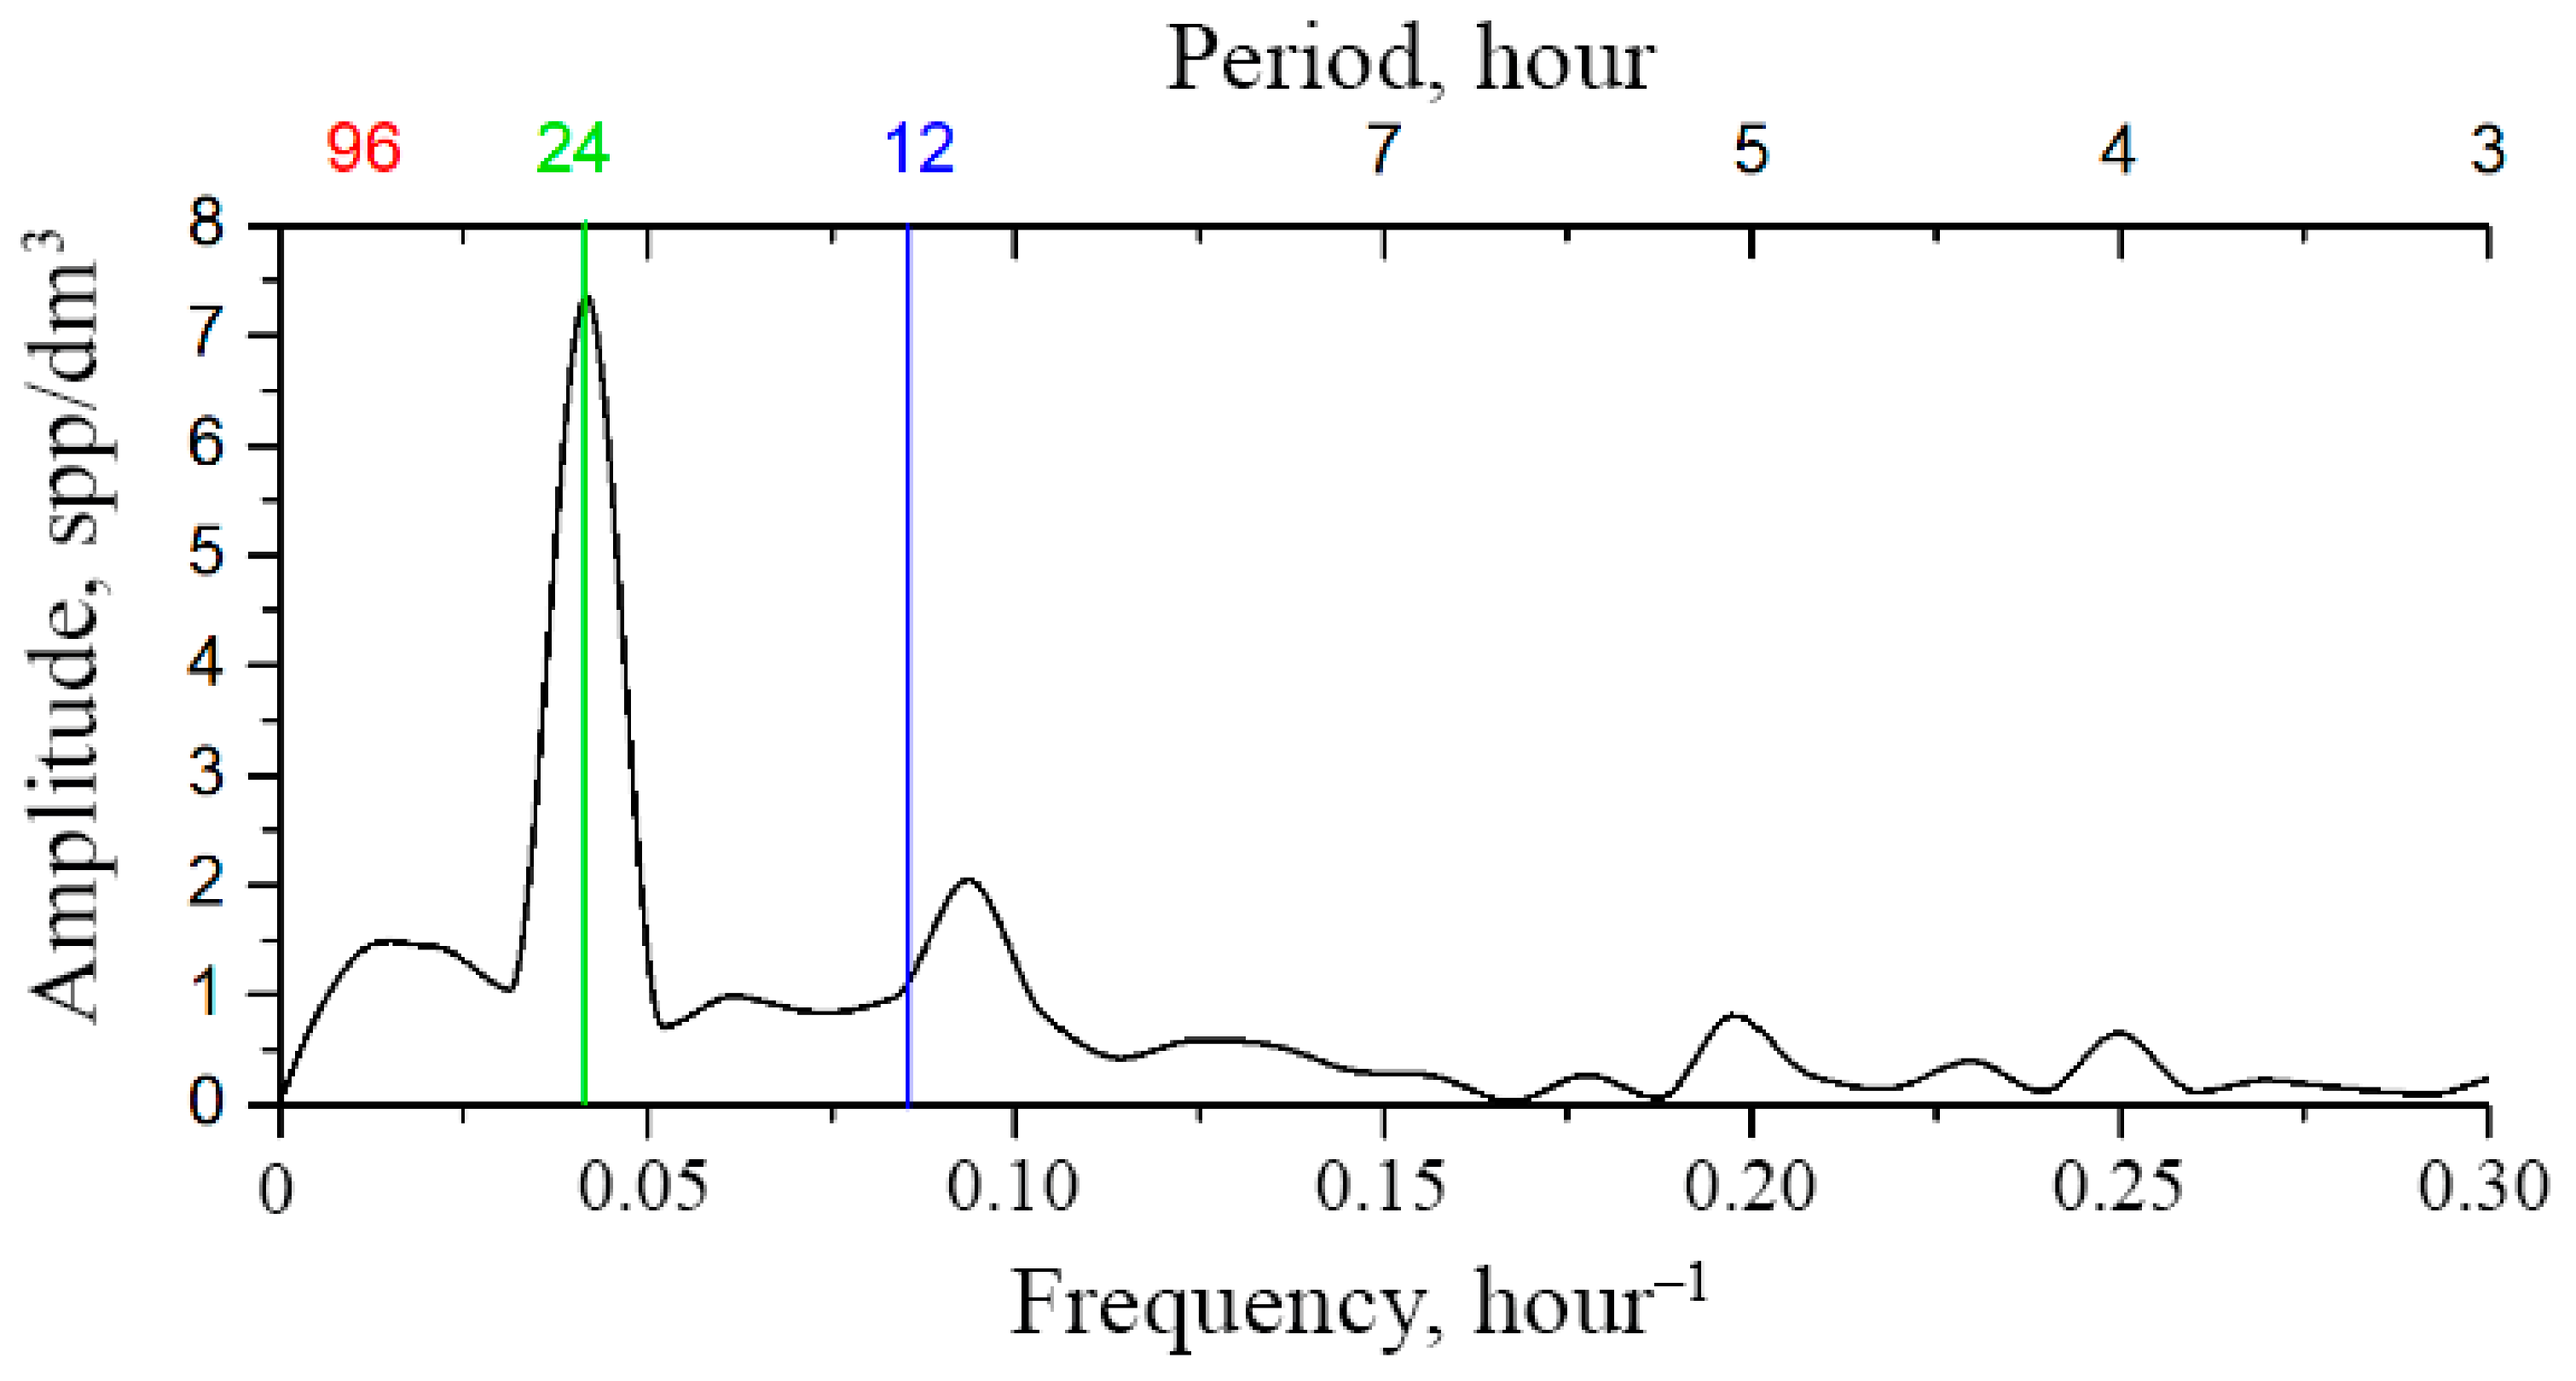
Moreover, the shorter the segment, the less time is required for its analysis but, on the other hand, the longer the interval, the more reliable the result. The compromise represents an optimization task, where a lot depends on the knowledge of the functional law of the systematic component of variability. This law requires functional interpolation within segments, which can be performed based on the Fourier analysis. For the mesoscale modality considered here, this law is based on the circadian line of the spectrum, the tidal line, and the diurnal variability line to be identified within each segment of the original time series (Figure 3a). Since the original series contains too many high-frequency emissions and microscale variability, it is advisable to perform window editing to discriminate against high frequencies. Figure 8 shows the dependencies of diurnal band rhythm amplitudes on window duration, confirming filtering capabilities of window editing.
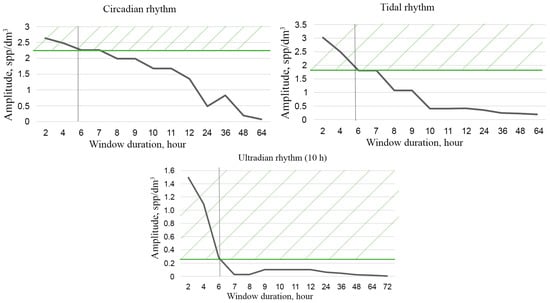
Figure 8.
Dependence of the amplitude of diurnal band rhythms on window duration during window editing of time series of plankton concentration. Green hatching shows the loss of the amplitude of the corresponding rhythms when processed by a 6 h window.
The optimal window size for filtering high-frequency rhythms and identifying the circadian rhythm is a 6–8 h window, since the loss of the amplitude of the ultradian rhythm is ~80%, and the amplitudes of the circadian and tidal rhythms remain almost unchanged (Figure 8). These changes are 20% and 30%, respectively, and are shown by green hatching on the graphs. The results of mesoscale sample processing after optimal filtration are shown in Table 2.

Table 2.
Segmented sampling of plankton concentrations by moorage site after filtration.
Here, the experimental DHC measurements of plankton concentrations are as follows:
where —average concentration determined by the processing of N = 20 holograms recorded every hour in the working volume 0.12 dm3 with the window duration of M = 8 h, Δ—error of the average for the readings calculated in a standard way for 160 data taking into account the significance level p = 5%.
Table 2 shows figures where a black line in the second column indicates the average concentrations . The mean error for all readings was Δ ssp/dm3.
These graphs show that, by averaging the time signal according to the sliding window method and improving the experimental statistics, it is possible to effectively influence the spatial frequency spectrum of the time signal (Figure 3), thus weakening its non-informative parts, i.e., to directly influence the modalities of some plankton concentrations adopted for analysis. In this case, this method may be more convenient than classical filtering using the Fourier images.
3.3. Correlation of Temporal Modalities with Spatial Scales for Bioindication Purposes
Modality and possibilities of differential time series make it possible to obtain information on different spatial scales from the same set of plankton concentration data. Equally important is the spatial scope of estimates associated with modality and understanding the reasons behind the variability. This requires the use of the ratio known as the “frozen turbulence hypothesis”, which was first introduced by G.I. Taylor—one of the founders of the statistical theory of turbulence. It states the relationship between the (temporal) and (spatial) scales of phenomena generated by turbulence [60,61,62,63].
Here, —average current velocity. Such an estimate can be used to study the pollutant transfer, as well as to determine the range of action of bioindication estimates obtained on the basis of data on native plankton.
The duration of the window required to eliminate the S rhythm is an estimate of the time scale (interval) of the ergodicity of the water area , which for the established water area (Zelenetskaya Bay of the Barents Sea) is taken as ~72 h.
According to [64], the average current velocity for the water area at the moorage site is cm/s. So, the results of the concentration estimates are valid for the distance
which is an estimate from below the spatial scale of the long-term modality . It is the minimal distance in which the results of the integral sampling (using the net) and the window processing of the differential time series of plankton concentrations will coincide to identify the trend line. The results of this experiment are shown in Figure 6a, which demonstrates a good correlation between the results of plankton concentration measurements by net catching and the determination of the trend line based on the results of the bioindication station studies with the DHC.
At the same time, relying on the fact that spatial inhomogeneities are the result of behavioral strategies of zooplankton related to nutrition [42], we can use window processing times to identify diurnal modality rhythms as diagnostic, i.e., in Formula (6) we accept M = 8. This allows assessing the spatial scale acting on the formation of one hourly reading of the time series
This is an estimate from below the spatial scale of the short-term modality in the mesoscale time range or the region of space (pixel) for which for a given time the plankton concentration measurement is valid. When we choose the position of the bioindication station relative to the source of potential contamination, and serve as the most important parameters that determine the response rate of the system.
At least three days are needed to detect the circadian rhythm of variability determined by spectral transformation, and then we get the following:
which is an estimate from above the spatial scale of the short-term modality in the mesoscale time range. This is required in order to understand the size of the nearest water area, for which changes in the circadian rhythm recorded by the Fourier analysis on three-day segments will mean a deterioration of the well-being of the ecosystem, for example, due to pollution.
Continuous monitoring of the circadian rhythm in 10-day segments, due to the good spectral resolution of the circadian rhythm line for h, involves plankton grouping with a spatial scale of several spots of fractal structure (100 km). Changes in the circadian rhythm recorded by the Fourier analysis on such segments will mean the stability of the observed pollution. This spatial scale indicates behavioral disorders that affected the existing fractal structure, which forms the basis for the vital function of zooplankton. Such influences will compete with synoptic impacts, which can be destructive for the established biocenosis and indicate a possible environmental disaster.
It is clear that the given estimates contribute to the average velocity direction.
4. Conclusions
Registration of plankton at the bioindication station in a small working volume of the DHC makes it possible to register the time series of plankton concentrations. The sampling presented in such rows is temporal and differential, which may virtually be turned into an integral one through window editing of hours. Thus, is a parameter that determines the modalities and scales of spatial–temporal variability.
In particular, the characteristic scales associated with turbulent structures are reflected as the structuring rhythms in the 27–350 h band. Time averaging of plankton concentrations in the region of transition from mesoscale modality to synoptic modality is determined on a time scale ~72 h ( based on the loss of S rhythms in the averaged time series. This time scale has a spatial scale 20 km, which is an estimate of the ergodicity distance, i.e., the distance at which the concentrations presented in the averaged time series almost coincide with the results of integral sampling.
Time averaging of plankton concentrations of mesoscale modality with the parameters ( allows estimating the mesoscale distance of influence in the formation of hourly readings of the time series .
Segmentation of differential time series can also be used to determine the spatiotemporal estimates. So, by choosing the duration of the series of measurements for analysis, we automatically select the volume of plankton grouping within the bioindication studies.
When the processing results show the time series of plankton concentrations of the spectral line of regular diurnal variability for at least three days, the bioindicative estimates are valid for plankton grouping with a length coinciding with the synoptic modality distance (i.e., ~ 20 km).
Such estimates are important since they make it possible:
- to clarify spatial and temporal scales of the studied phenomena;
- to determine the effective range of estimates and understand the sampling volumes required for clear informative results within a particular modality;
- to reasonably plan the measurement experiment and interpret the data obtained using different-scale measuring tools;
- to study the processes of pollution propagation.
Author Contributions
Conceptualization, V.D. and I.P.; methodology, V.D. and I.P.; software, A.D.; validation, I.P., D.K., and A.D.; formal analysis, I.P.; investigation, A.D.; resources, V.D.; data curation, I.P. and A.D.; writing—original draft preparation, I.P. and D.K.; writing—review and editing, V.D.; visualization, D.K.; supervision, I.P.; project administration, I.P.; funding acquisition, V.D. All authors have read and agreed to the published version of the manuscript.
Funding
This study was supported by the Development Program of Tomsk State University (Priority 2030).
Data Availability Statement
Dataset available on request from the authors.
Conflicts of Interest
The authors declare no conflicts of interest.
Abbreviations
The following abbreviations are used in this manuscript:
| DHC | Digital Holographic Camera |
| CMOS | Complementary Metal–Oxide–Semiconductor |
| MMBI RAS | Murmansk Marine Biological Institute of the Russian Academy of Sciences |
| FOCL | Fiber-Optic Communication Line |
References
- Steele, J.H. (Ed.) Spatial Pattern in Plankton Communities; Springer: Boston, MA, USA, 1978; ISBN 978-1-4899-2197-0. [Google Scholar]
- Robinson, K.L.; Sponaugle, S.; Luo, J.Y.; Gleiber, M.R.; Cowen, R.K. Big or Small, Patchy All: Resolution of Marine Plankton Patch Structure at Micro- to Submesoscales for 36 Taxa. Sci. Adv. 2021, 7, eabk2904. [Google Scholar] [CrossRef]
- Mojica, K.D.A.; van de Poll, W.H.; Kehoe, M.; Huisman, J.; Timmermans, K.R.; Buma, A.G.J.; van der Woerd, H.J.; Hahn-Woernle, L.; Dijkstra, H.A.; Brussaard, C.P.D. Phytoplankton Community Structure in Relation to Vertical Stratification along a North-South Gradient in the Northeast Atlantic Ocean. Limnol. Oceanogr. 2015, 60, 1498–1521. [Google Scholar] [CrossRef]
- Marguerit, C.; Schertzer, D.; Schmitt, F.; Lovejoy, S. Copepod Diffusion within Multifractal Phytoplankton Fields. J. Mar. Syst. 1998, 16, 69–83. [Google Scholar] [CrossRef]
- Balvert, S.F.; Duggan, I.C.; Hogg, I.D. Zooplankton Seasonal Dynamics in a Recently Filled Mine Pit Lake: The Effect of Non-Indigenous Daphnia Establishment. Aquat. Ecol. 2009, 43, 403–413. [Google Scholar] [CrossRef]
- Dalpadado, P.; Arrigo, K.R.; van Dijken, G.L.; Skjoldal, H.R.; Bagøien, E.; Dolgov, A.V.; Prokopchuk, I.P.; Sperfeld, E. Climate Effects on Temporal and Spatial Dynamics of Phytoplankton and Zooplankton in the Barents Sea. Prog. Oceanogr. 2020, 185, 102320. [Google Scholar] [CrossRef]
- Longobardi, L.; Dubroca, L.; Margiotta, F.; Sarno, D.; Zingone, A. Photoperiod-Driven Rhythms Reveal Multi-Decadal Stability of Phytoplankton Communities in a Highly Fluctuating Coastal Environment. Sci. Rep. 2022, 12, 3908. [Google Scholar] [CrossRef] [PubMed]
- Bandara, K.; Varpe, Ø.; Wijewardene, L.; Tverberg, V.; Eiane, K. Two Hundred Years of Zooplankton Vertical Migration Research. Biol. Rev. 2021, 96, 1547–1589. [Google Scholar] [CrossRef]
- Kvile, K.; Prokopchuk, I.P.; Stige, L.C. Environmental Effects on Calanus Finmarchicus Abundance and Depth Distribution in the Barents Sea. ICES J. Mar. Sci. 2022, 79, 815–828. [Google Scholar] [CrossRef]
- Häfker, N.S.; Connan-McGinty, S.; Hobbs, L.; McKee, D.; Cohen, J.H.; Last, K.S. Animal Behavior Is Central in Shaping the Realized Diel Light Niche. Commun. Biol. 2022, 5, 562. [Google Scholar] [CrossRef]
- Bandara, K.; Varpe, Ø.; Maps, F.; Ji, R.; Eiane, K.; Tverberg, V. Timing of Calanus Finmarchicus Diapause in Stochastic Environments. Ecol. Modell. 2021, 460, 109739. [Google Scholar] [CrossRef]
- Varpe, Ø.; Jørgensen, C.; Tarling, G.A.; Fiksen, Ø. The Adaptive Value of Energy Storage and Capital Breeding in Seasonal Environments. Oikos 2009, 118, 363–370. [Google Scholar] [CrossRef]
- Varpe, Ø.; Jørgensen, C.; Tarling, G.A.; Fiksen, Ø. Early Is Better: Seasonal Egg Fitness and Timing of Reproduction in a Zooplankton Life-History Model. Oikos 2007, 116, 1331–1342. [Google Scholar] [CrossRef]
- Grigor, J.J.; Søreide, J.E.; Varpe, Ø. Seasonal Ecology and Life-History Strategy of the High-Latitude Predatory Zooplankter Parasagitta Elegans. Mar. Ecol. Prog. Ser. 2014, 499, 77–88. [Google Scholar] [CrossRef]
- Espinasse, B.; Tverberg, V.; Kristensen, J.A.; Skreslet, S.; Eiane, K. Winter Mortality in Calanus Populations in Two Northern Norwegian Fjords from 1984 to 2016. Polar Biol. 2018, 41, 1405–1415. [Google Scholar] [CrossRef]
- Hobbs, L.; Banas, N.S.; Cohen, J.H.; Cottier, F.R.; Berge, J.; Varpe, Ø. A Marine Zooplankton Community Vertically Structured by Light across Diel to Interannual Timescales. Biol. Lett. 2021, 17, 20200810. [Google Scholar] [CrossRef]
- Tzella, A.; Haynes, P.H. Small-scale spatial structure in plankton distributions. Biogeosciences 2007, 4, 173–179. [Google Scholar] [CrossRef]
- Levy, M.; Martin, A.P. The influence of mesoscale and submesoscale heterogeneity on ocean biogeochemical reactions. Glob. Biogeochem. Cycles 2013, 27, 1139–1150. [Google Scholar] [CrossRef]
- Muñiz, O.; Rodríguez, J.G.; Revilla, M.; Laza-Martínez, A.; Seoane, S.; Franco, J. Inhomogeneity detection in phytoplankton time series using multivariate analyses. Oceanologia 2020, 62, 243–254. [Google Scholar] [CrossRef]
- Zhang, Z.; Li, H.; Shen, W.; Du, X.; Li, S.; Wei, Z.; Zhang, Z.; Feng, K.; Deng, Y. The large-scale spatial patterns of ecological networks between phytoplankton and zooplankton in coastal marine ecosystems. Sci. Total Environ. 2022, 827, 154285. [Google Scholar] [CrossRef] [PubMed]
- Monin, A.S. Turbulence and Microstructure in the Ocean. Uspekhi Fiz. Nauk. 1973, 109, 333. [Google Scholar] [CrossRef]
- Kamenkovich, V.M.; Koshlyakov, M.N.; Monin, A.S. (Eds.) Synoptic Eddies in the Ocean; Springer: Dordrecht, The Netherlands, 1986; ISBN 978-94-010-8506-9. [Google Scholar]
- Azovsky, A.; Chertoprud, E.; Garlitska, L. Community-Level Spatiotemporal Synchrony: New Metric and Application to White Sea Meiobenthic Harpacticoids. Mar. Ecol. Prog. Ser. 2022, 698, 55–68. [Google Scholar] [CrossRef]
- Steele, J.H.; Henderson, E.W. The Role of Predation in Plankton Models. J. Plankton Res. 1992, 14, 157–172. [Google Scholar] [CrossRef]
- Scheffer, M. Should We Expect Strange Attractors behind Plankton Dynamics—And If so, Should We Bother? J. Plankton Res. 1991, 13, 1291–1305. [Google Scholar] [CrossRef]
- Medvinskii, A.B.; Petrovskii, S.V.; Tikhonova, I.A.; Tikhonov, D.A.; Li, B.-L.; Venturino, E.; Malchow, H.; Ivanitskii, G.R. Spatio-Temporal Pattern Formation, Fractals, and Chaos in Conceptual Ecological Models as Applied to Coupled Plankton-Fish Dynamics. Phys.-Uspekhi 2002, 45, 27–57. [Google Scholar] [CrossRef]
- Mimura, M.; Murray, J.D. On a Diffusive Prey-Predator Model Which Exhibits Patchiness. J. Theor. Biol. 1978, 75, 249–262. [Google Scholar] [CrossRef]
- Koenig, W.D. Global Patterns of Environmental Synchrony and the Moran Effect. Ecography 2002, 25, 283–288. [Google Scholar] [CrossRef]
- Haury, L.R.; McGowan, J.A.; Wiebe, P.H. Patterns and Processes in the Time-Space Scales of Plankton Distributions. In Spatial Pattern in Plankton Communities; Springer: Boston, MA, USA, 1978; pp. 277–327. [Google Scholar]
- Leibold, M.A.; Holyoak, M.; Mouquet, N.; Amarasekare, P.; Chase, J.M.; Hoopes, M.F.; Holt, R.D.; Shurin, J.B.; Law, R.; Tilman, D.; et al. The Metacommunity Concept: A Framework for Multi-scale Community Ecology. Ecol. Lett. 2004, 7, 601–613. [Google Scholar] [CrossRef]
- Briseño-Avena, C.; Prairie, J.C.; Franks, P.J.S.; Jaffe, J.S. Comparing Vertical Distributions of Chl-a Fluorescence, Marine Snow, and Taxon-Specific Zooplankton in Relation to Density Using High-Resolution Optical Measurements. Front. Mar. Sci. 2020, 7, 602. [Google Scholar] [CrossRef]
- Prairie, J.C.; Sutherland, K.R.; Nickols, K.J.; Kaltenberg, A.M. Biophysical Interactions in the Plankton: A Cross-scale Review. Limnol. Oceanogr. Fluids Environ. 2012, 2, 121–145. [Google Scholar] [CrossRef]
- Jumars, P.A.; Trowbridge, J.H.; Boss, E.; Karp-Boss, L. Turbulence-Plankton Interactions: A New Cartoon. Mar. Ecol. 2009, 30, 133–150. [Google Scholar] [CrossRef]
- Shim, H.; Lee, C. Effect of Gravity-Induced Fluid Inertia on the Accumulation and Dispersion of Motile Plankton Settling Weakly in Turbulence. Phys. Fluids 2022, 34, 085107. [Google Scholar] [CrossRef]
- Fuchs, H.L.; Gerbi, G.P. Seascape-Level Variation in Turbulence- and Wave-Generated Hydrodynamic Signals Experienced by Plankton. Prog. Oceanogr. 2016, 141, 109–129. [Google Scholar] [CrossRef]
- Peters, F.; Redondo, J.M. Turbulence Generation and Measurement: Application to Studies on Plankton. Sci. Mar. 1997, 61, 205–228. [Google Scholar]
- Peters, F.; Marrase, C. Effects of Turbulence on Plankton: An Overview of Experimental Evidence and Some Theoretical Considerations. Mar. Ecol. Prog. Ser. 2000, 205, 291–306. [Google Scholar] [CrossRef]
- Ross, T. A Video-Plankton and Microstructure Profiler for the Exploration of in Situ Connections between Zooplankton and Turbulence. Deep. Res. Part I Oceanogr. Res. Pap. 2014, 89, 1–10. [Google Scholar] [CrossRef]
- Franks, P.J.S.; Inman, B.G.; MacKinnon, J.A.; Alford, M.H.; Waterhouse, A.F. Oceanic Turbulence from a Planktonic Perspective. Limnol. Oceanogr. 2022, 67, 348–363. [Google Scholar] [CrossRef]
- Sprules, W.G.; Cyr, H.; Menza, C.W. Multiscale Effects of Wind-Induced Hydrodynamics on Lake Plankton Distribution. Limnol. Oceanogr. 2022, 67, 1631–1646. [Google Scholar] [CrossRef]
- Flierl, G.; McGillicuddy, D.J. Mesoscale and Submesoscale Physical—Biological Interactions. In The Sea; Robinson, A.R., McCarthy, J.J., Rothschild, B.J., Eds.; John Wiley & Sons, Inc.: New York, NY, USA, 2002; Volume 12, pp. 113–186. ISBN 0471189014. [Google Scholar]
- Shadrin, N.V.; Anufriieva, E.V. An ecosystem role of spatial and temporal inhomogeneity in feeding of plankton crustaceans. Ekosystemy 2018, 14, 119–128. [Google Scholar]
- Esau, I.N. Xxi-St Century: A Shift of Paradigm in the Planetary Boundary Layer Theory. Fundam. Appl. Hydrophys. 2022, 15, 9–18. [Google Scholar] [CrossRef]
- Ozmidov, R.V. Diffusion of Contaminants in the Ocean; Springer: Dordrecht, The Netherlands, 1990; ISBN 978-0-7923-0611-5. [Google Scholar]
- Dyomin, V.V.; Davydova, A.Y.; Morgalev, S.Y.; Kirillov, N.S.; Olshukov, A.; Polovtsev, I.; Davydov, S. Monitoring of Plankton Spatial and Temporal Characteristics With the Use of a Submersible Digital Holographic Camera. Front. Mar. Sci. 2020, 7, 653. [Google Scholar] [CrossRef]
- Dyomin, V.; Davydova, A.; Kirillov, N.; Morgalev, S.; Naumova, E.; Olshukov, A.; Polovtsev, I. In Situ Measurements of Plankton Biorhythms Using Submersible Holographic Camera. Sensors 2022, 22, 6674. [Google Scholar] [CrossRef] [PubMed]
- Dyomin, V.; Davydova, A.; Kirillov, N.; Kondratova, O.; Morgalev, Y.; Morgalev, S.; Morgaleva, T.; Polovtsev, I. Monitoring Bioindication of Plankton through the Analysis of the Fourier Spectra of the Underwater Digital Holographic Sensor Data. Sensors 2024, 24, 2370. [Google Scholar] [CrossRef] [PubMed]
- Dyomin, V.; Polovtsev, I.; Davydova, A.; Kirillov, N. Spectroscopic Aspects of Underwater Digital Holography of Plankton. Sci. Rep. 2025, 15, 1884. [Google Scholar] [CrossRef] [PubMed]
- Xie, T.; Huang, L.; Guo, Y.; Ou, Y. Modeling and Simulation Analysis of Active Heave Compensation Control System for Electric-Driven Marine Winch under Excitation of Irregular Waves. Meas. Control 2023, 56, 1004–1015. [Google Scholar] [CrossRef]
- Soviadan, Y.D.; Dugenne, M.; Drago, L.; Biard, T.; Trudnowska, E.; Lombard, F.; Romagnan, J.B.; Jamet, J.L.; Kiko, R.; Gorsky, G.; et al. Combining in Situ and Ex Situ Plankton Image Data to Reconstruct Zooplankton (>1 Mm) Volume and Mass Distribution in the Global Ocean. J. Plankton Res. 2024, 46, 461–474. [Google Scholar] [CrossRef]
- Annasawmy, P.A.; Soviadan, Y.D.; Kiko, R.; Stemmann, L. Emerging Technologies in Marine Ecosystem Observation Networks. Available online: https://triatlas.w.uib.no/files/2024/04/TRIATLAS_factsheet_emerging_technologies_en.pdf (accessed on 10 May 2025).
- Barth, A.; Stone, J.; Irigoien, X. Understanding the Picture: The Promise and Challenges of in-Situ Imagery Data in the Study of Plankton Ecology. J. Plankton Res. 2024, 46, 365–379. [Google Scholar] [CrossRef]
- Dyomin, V.; Kurkova, D.; Davydova, A.; Polovtsev, I.; Morgalev, S. Plankton Concentration Model Consistent with Natural Events and Monitoring Series of Holographic Measurements. J. Mar. Sci. Eng. 2025, 13, 140. [Google Scholar] [CrossRef]
- Dyomin, V.; Morgalev, Y.; Morgalev, S.; Davydova, A.; Kondratova, O.; Morgaleva, T.; Polovtsev, I. Phototactic Behavioral Responses of Mesozooplankton in the Barents Sea as an Indicator of Anthropogenic Impact. Water 2023, 15, 3901. [Google Scholar] [CrossRef]
- Dyomin, V.; Polovtsev, I.; Davydova, A. Calibration for the Magnification of a Submersible Digital Holographic Camera during the Study of Particles in Natural Conditions. Appl. Opt. 2025, 64, B49–B57. [Google Scholar] [CrossRef]
- Collier, R.J.; Burckhardt, C.B.; Lin, L.H. Optical Holography; Academic Press: New York, NY, USA, 1971; ISBN 9780121810504. [Google Scholar]
- Schnars, U.; Juptner, W.P.O. Digital recording and numerical reconstruction of holograms. Meas. Sci. Technol. 2002, 13, R85–R101. [Google Scholar] [CrossRef]
- Dyomin, V.; Olshukov, A.S.; Davydova, A. Data acquisition from digital holograms of particles. In Unconventional Optical Imaging; Fournier, C., Georges, M.P., Popescu, G., Eds.; SPIE: Bellingham, WA, USA, 2018; Volume 10677, p. 106773B. [Google Scholar] [CrossRef]
- Reichert, P. The Ergodic Hypothesis: A Typicality Statement. In Physics and the Nature of Reality. Fundamental Theories of Physics; Bassi, A., Goldstein, S., Tumulka, R., Zanghì, N., Eds.; Springer: Cham, Switzerland, 2024; pp. 285–299. ISBN 978-3-031-45433-2. [Google Scholar]
- Higgins, C.W.; Froidevaux, M.; Simeonov, V.; Vercauteren, N.; Barry, C.; Parlange, M.B. The Effect of Scale on the Applicability of Taylor’s Frozen Turbulence Hypothesis in the Atmospheric Boundary Layer. Bound.-Layer Meteorol. 2012, 143, 379–391. [Google Scholar] [CrossRef]
- Jiménez, J.; del Álamo, J.C. Corrections to Taylor’s Approximation from Computed Turbulent Convection Velocities. In Progress in Wall Turbulence: Understanding and Modeling; ERCOFTAC Series; Springer: Dordrecht, The Netherlands, 2011; pp. 211–218. [Google Scholar]
- Del Álamo, J.C.; Jiménez, J. Estimation of Turbulent Convection Velocities and Corrections to Taylor’s Approximation. J. Fluid Mech. 2009, 640, 5–26. [Google Scholar] [CrossRef]
- Hilland, R.; Christen, A.; Vogt, R. Investigating Taylor’s Frozen Turbulence Hypothesis in the Surface Layer at an Ideal Desert Field Site Using Fibre-Optic Distributed Temperature Sensing. In Proceedings of the 2022 DACH Meteorology Conference, Leipzig, Germany, 17 December 2021; p. 5194. [Google Scholar] [CrossRef]
- Il’in, G.V.; Moiseev, D.V.; Shirokolobov, D.V.; Deryabin, A.A.; Pavlova, L.G. Long-Term Dynamics of Hydrological Conditions of the Zelenetskaya Bay, East Murman. Vestn. MGTU 2016, 19, 268–277. [Google Scholar] [CrossRef]
Disclaimer/Publisher’s Note: The statements, opinions and data contained in all publications are solely those of the individual author(s) and contributor(s) and not of MDPI and/or the editor(s). MDPI and/or the editor(s) disclaim responsibility for any injury to people or property resulting from any ideas, methods, instructions or products referred to in the content. |
© 2025 by the authors. Licensee MDPI, Basel, Switzerland. This article is an open access article distributed under the terms and conditions of the Creative Commons Attribution (CC BY) license (https://creativecommons.org/licenses/by/4.0/).
