Abstract
Seasonal lake-ice runways provide low-carbon winter infrastructure for cold-region logistics, yet direct links between ice flexural mechanics and runway design remain scarce. To address this gap, we investigated seasonal ice from Huhenuoer Lake and proposed a mechanics-based methodology for determining key design parameters. On 14 March 2024, an ice block was hoisted and tested in a cold laboratory after several days. Full-depth investigation revealed that throughout the entire-depth range, the ice consists exclusively of columnar ice with a mean density of 0.89 g/cm3 and a mean grain size of 15.88 mm. Subsequently, four-point bending tests gave an average effective flexural elastic modulus of 3.31 GPa and flexural strength of 2813 kPa. Furthermore, statistical analysis showed both properties decrease with temperature and are lower in higher-porosity specimens. Based on these results, we established a systematic procedure to derive design flexural strength, effective flexural elastic modulus, and ice thickness. When applied to the potential Huhenuoer Lake-ice runway, this method yields values of 2800 kPa, 3.24 GPa, and 30 cm for the An-2 (design flexural strength, design effective flexural elastic modulus, and design ice thickness, respectively); the same method can be used to obtain the corresponding values for other aircraft. As lake ice is locally sourced, recyclable, and temporary, it can serve as a low-carbon material for construction purposes.
1. Introduction
Recent advances in ice runway development have resulted in an increase in research concentrating on the bending mechanical characteristics of lake ice. The effective flexural elastic modulus and flexural strength, as critical bending mechanical properties of lake ice, significantly influence the performance of ice runways. Numerous laboratory and field studies have demonstrated that, prior to the onset of the first crack, the load-bearing capacity of an ice cover is governed by its flexural strength [1]. In the context of the recoverable response of ice, the effective elastic modulus, a single modulus for ice that is strictly related to the pure elastic response of the material, is required [2]. The load-carrying capacity of ice is related to both its flexural strength and its effective flexural elastic modulus [3]. Consequently, the thickness and flexural properties of ice are very significant for any prospective ice runway’s mechanical analysis. A related study by Wang et al. examined the ice thickness of Huhenuoer Lake for potential lake ice runway development [4]. In the present study, the bending characteristics refer specifically to the effective flexural elastic modulus and the flexural strength.
Much work has been carried out so far to investigate how lake ice bending mechanical characteristics change, with an emphasis on the effects of porosity, ice temperature, and other factors. Huang’s experimental analysis at temperatures of −5 °C, −10 °C, and −15 °C revealed that the flexural strength of ice with fewer bubbles was approximately 14.6% greater than that of ice with more bubbles [5]. Within the experimental temperature and strain-rate ranges of [5], as temperature decreased, the peak flexural strength and the average flexural strength of lake ice gradually increased. Gow et al. demonstrated that the fine-grained, crack-free top layer of snow-ice typically exhibits a stronger response to tension compared to the coarse-grained bottom lake ice, which is at risk for cracking [6]. Snow-ice forms by the freezing of water-soaked snow originally deposited on top of a preexisting ice sheet [7]. Gow et al. observed a significant correlation between flexural strength and temperature in large lake ice beams. Weeks et al. demonstrated a linear relationship between flexural strength and decreasing temperature [8]. Gow et al. proposed that the flexural strength of lake ice decreases significantly as the temperature approaches 0 °C [9]. Similarly to [9], Frankenstein demonstrated that the strength of ice decreases by a ratio of six from morning to mid-afternoon due to the influence of sunlight and air temperatures near 0 °C [10]. Han et al. demonstrated that ice’s bending properties are temperature-sensitive. At −0.5 °C, the average flexural strength of large columnar freshwater ice is 1.48 MPa. The flexural strength exhibits a significant increase as the temperature decreases from −0.5 °C to −5.0 °C; however, it declines gradually when the temperature falls below −5.0 °C. The effective modulus of large columnar freshwater ice varies between 1.20 and 7.60 GPa [11]. Current studies have examined the effects of porosity and temperature on the bending behavior of lake ice. However, little attention has been applied to combine the relationship and air temperature to predict future potential ice projects, for example, ice runways. Although flexural testing of lake ice using small-beam four-point (and three-point) bending is well established in other regions, to our knowledge no such mechanical investigation has previously been conducted for lake ice in the Hulun Buir. The local climatic and environmental conditions (such as lower winter air-temperatures and longer ice-growth periods) can lead to differences compared to lakes in other geographic zones (see, e.g., Cole (2001) [12]; Suominen et al. (2021) [13]). So, the mechanical parameters obtained elsewhere cannot simply be transferred to the present lake ice without local verification. Accordingly, the present work presents the first systematic four-point bending tests on Huhenuoer Lake ice, thereby filling an important regional data gap.
To support the researchers in the resolution of the aforementioned issues, the researchers in this study hoisted the Huhenuoer Lake ice block using a small gantry crane, hand chain hoists, and ice screws. To investigate the fundamental features of this material, the following techniques were conducted: the density of the lake ice was determined using the mass/volume method, and the grain size of the lake ice was observed using the universal stage. Subsequently, the four-point bending experiment was performed to assess the ice bending properties of Huhenuoer Lake, which serves to fill the research gap in lake-ice mechanics in Hulun Buir. The relationship between porosity, ice temperature, and the bending mechanical characteristics of lake ice was examined using several mathematical models. Furthermore, using the analytical approach from the study by Wang et al. [4] in conjunction with statistical techniques, the design ice temperatures for various aircraft used on the ice runway of Huhenuoer Lake are determined, subsequently leading to the calculation of their design effective flexural elastic modulus and design flexural strength. This analysis provides bending parameters pertinent to future ice runway construction from the standpoint of lake ice bending characteristics. Hulun Buir’s prolonged snow–ice season leaves much of the year as a tourism off-season [14]. International precedent demonstrates feasibility, as the blue-ice runway near Novolazarevskaya Station has supported commercial tourism among other purposes [15]. Moreover, lake ice is locally sourced, naturally recyclable, and a low-carbon material; incorporating its mechanical properties into design rules satisfies a concrete engineering need for safe, sustainable, and low-carbon winter infrastructure. The findings offer significant insights for the construction and application of potential ice runways.
2. Natural Conditions, Ice Properties, and Four-Point Bending Test
2.1. Basic Huhenuoer Lake Natural Conditions
This study investigated the ice of Huhenuoer Lake (49°15′~49°20′ N, 119°11′~119°17′ E), situated in the city of Hulun Buir. The latitude and longitude coordinates for Hulun Buir were taken from the study by Zhou et al. [16], and those for Jiagedaqi District were taken from the study by Zhang [17]. Huhenuoer Lake has a length of 7.6 km from north to south, a maximum width of 3.8 km from east to west, and an area of approximately 21 km2. The altitude of the lake is 587 m. Huhenuoer Lake, surrounded by the Huhenuoer Grassland, lies near the confluence of the Hailar and Morigele Rivers [18]. Figure 1 shows Huhenuoer Lake’s schematic geographic location.
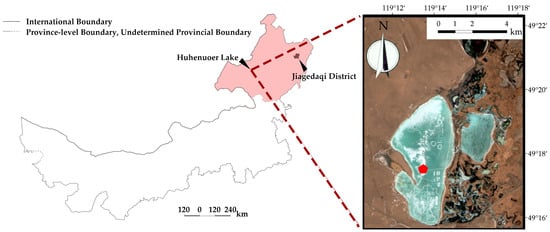
Figure 1.
Schematic diagram of the geographical location of Huhenuoer Lake. The left panel shows Hulunbuir City (light red), Jiagedaqi District (brown), and all other parts of the Inner Mongolia Autonomous Region except Hulun Buir City (white). The red pentagon of the right panel indicates the ice block position. The right panel presents a Sentinel-2 satellite image of Huhenuoer Lake acquired on 31 March 2023 from the Copernicus Browser https://browser.dataspace.copernicus.eu/ accessed on 9 May 2025.
On 14 March 2024, the ice block was acquired in the red pentagon of Figure 1. The ice screws are employed for ice block hoisting. Ice screws have superior mechanical properties that effectively prevent the device from detaching from the ice as a result of advancements in design and manufacturing [19,20]. To hoist the ice, a small gantry crane and hand chain hoists were also employed [21]. The conditions of ice-block hoisting in the field are shown in Figure 2.
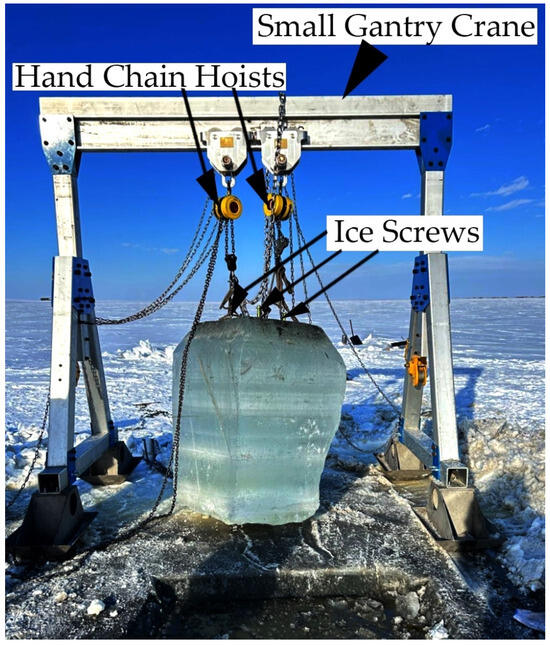
Figure 2.
Field photograph showing the ice block and hoisting equipment. The ice screws were used to anchor firmly into the ice surface and provide attachment points for hoisting ropes. The hand chain hoists were connected to the ice screws and manually operated to hoist the ice block efficiently. The small gantry crane functioned as a frame that supported the hand chain hoists, provided adequate operating space, and enabled the safe relocation of the ice block away from the ice hole (Photo by Ying Wang).
The initially measured ice thickness was approximately 108 cm (about 49°17′26″ N, 119°13′26″ E). This measurement was obtained after the ice block was hoisted from the lake, as shown in Figure 2, by directly measuring the thickness of the hoisted ice block. After the ice block was hoisted from the lake, it underwent further processing: the large block was cut into several smaller pieces, each carefully packaged to prevent mechanical damage during transport. Labels indicating the sampling depth below the ice surface and the ice-growth direction were attached to the outer layer of the packaging. The prepared ice samples were then transported under continuous low-temperature conditions (approximately −26 °C) to the Cold Laboratory at Dalian University of Technology. The ice block was subsequently cut along the direction of ice growth using an electric-powered chainsaw, supporting initial preparations for measuring lake ice density, observing grain size, and preparing test specimens.
2.2. Observed Fundamental Properties of the Huhenuoer Lake Ice
To observe grain and assess density, part of ice block was cut away using a chainsaw (this part must cover the whole depth range). Thin sections were prepared as follows: a small ice piece about 3 cm thick was quickly affixed to a clean, dry glass plate held at a slightly higher temperature, ensuring no air bubbles remained between the ice and glass. The attached part was then trimmed using a bone saw until only 0.5 cm layer adjacent to the glass remained. The surface was subsequently smoothed with a file to a final thickness of about 0.1 cm, until the grain structure became clearly visible with a universal stage under orthogonally polarized light. The method of grain observation is consistent with that described in Ref. [22]. During grain observation, it is essential to indicate the upper and lower orientations of ice. The ruler is positioned adjacent to the thin ice slice to facilitate the measurement of the grain area (horizontal slice) or horizontal length (vertical slice).
Figure 3 summarizes observations of grain, grain size, and density. A full-depth investigation of thin sections revealed that the ice throughout the depth range was exclusively columnar ice. The mean grain size of Huhenuoer Lake ice block was 15.88 mm. The grain image presented in Figure 3 indicates that the Huhenuoer Lake ice is entirely columnar ice. Grain size exhibits a clear trend of increasing with depth. This pattern parallels the grain variation observed in Wuliangsu Lake ice as documented by Zhang from 2015 to 2020 [20]. Wuliangsu Lake (40°46′~41°7′ N, 108°41′~108°58′ E) is located in Inner Mongolia, adjacent to the Yellow River [23]. It has an elevation of approximately 1050 m; a shoreline perimeter of approximately 140 km [24]. The primary factor contributing to this situation is the weak hydrodynamic conditions during the formation and melting of lake ice. The frozen water body exhibits minimal fluidity, allowing the influence of velocity to be disregarded, resulting in a purely thermodynamic process for the growth of lake ice [20].
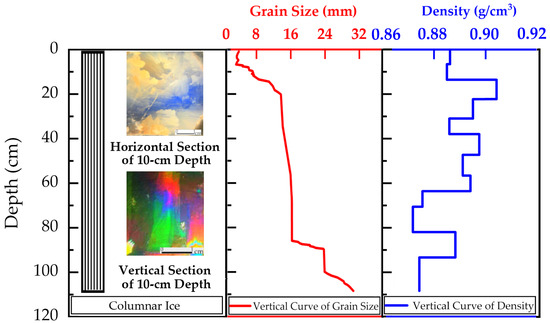
Figure 3.
Results on ice grain, grain size and density at Huhenuoer Lake.
Density was determined by the mass/volume method, recognized as one of the most accurate techniques available [25]. Density was defined as the sample mass divided by its volume. Standard cuboid samples were machined using a bone saw. For volume calculation, the length, width and thickness of each sample were measured multiple times on both faces with a vernier caliper to obtain an averaged value. Mass was measured on an electronic scale. The average density of Huhenuoer Lake ice is approximately 0.89 g/cm3. The density of Huhenuoer Lake ice tends to decreases with increasing depth, ultimately stabilizing, a pattern that similarities the density variation observed in Wuliangsu Lake ice with depth [20].
2.3. Four-Point Bending Test Method
Determining the test method and specimen size is a crucial preliminary step in analyzing the bending characteristics of lake ice. This experiment’s ultimate experimental specimen size is 7 cm × 7 cm × 65 cm, which is also one of the often-used measurements in the experiment of simply supported ice beams [26]. Experimental methods on ice bending primarily include three-point bending, four-point bending, and cantilever beam tests [27,28]. The four-point bending test technique was ultimately chosen for the reasons listed below. (1) The cantilever beam experiment is time-consuming when the ice thickness exceeds 50 cm [29]. The Huhenuoer Lake ice block has attained a thickness of 108 cm in this test. The cantilever beam experiment is deemed unsuitable for application. (2) Three-point bending tests exhibit a limitation in that the beam typically fails at the center, where the maximum moment occurs, thus hindering failure at its weakest point [30]. (3) Four-point bending tests produce a significant central region characterized by constant moment and zero shear between the loading points, which is typically advised for brittle materials [30].
After selecting the test method and specimen dimensions, the cut ice specimens were placed in a constant-temperature chamber set to the appropriate temperature for a minimum duration of 24 h to ensure the ice temperature reached equilibrium. During testing, consistency was maintained between the experimental environment—including the testing equipment—and the temperature of the constant-temperature chamber.
Position the test equipment as illustrated in Figure 4. Load using the universal testing machine. The loading direction aligns with the growth direction of ice grains. The external mechanical sensor is positioned on the upper span mold, enabling the measurement of the total forces at two points on the upper span. The external displacement sensor is positioned directly beneath the test to measure the mid-span displacement of the ice beam.
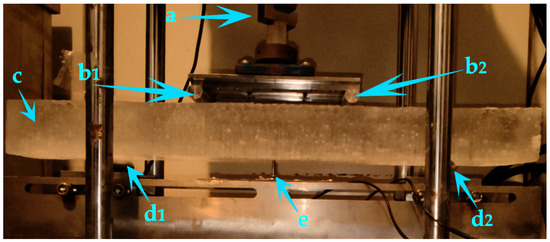
Figure 4.
Configuration of the four-point bending experiment for an ice beam: (a) the mechanical sensor; (b) upper loading points; (c) the ice beam specimen; (d) lower supporting points; (e) the displacement sensor (Photo by Zhixing Li).
In the experiment, the ice beams are positioned symmetrically. In this four-point bending test, F represents the force value recorded by the external mechanical sensor; ls denotes the lower span, defined as the horizontal distance between the two points of the lower support in Figure 4; l signifies the horizontal distance between the lower supporting point and the upper loading point on the same side in Figure 4. The mechanical analysis diagram of the four-point bending experiment for an ice beam is provided in Appendix A. Furthermore, a representative force–deflection plot obtained from Test No. 3 has been added in Appendix B to illustrate the quasi-linear deformation stage observed during the experimental process. As shown in Appendix C, the fracture locations of the ice beams were observed to occur randomly within the region between the two upper loading points. Additionally, the flexural strength and effective flexural elastic modulus can be derived from the four-point bending stress diagram of the ice beam.
where σf denotes the flexural strength (kPa); Fmax represents the peak measurement value (kN) of the external force sensor; b denotes the width of the ice beam (m); h represents the height of the ice beam (m); Ef signifies the effective flexural elastic modulus (MPa); I represents the second moment of area (m3); w(0.5ls) denotes the mid-span displacement (mm). To be more precise, Fmax corresponds to w(0.5ls)corr at the same time. Another parameter in the four-point bending test of ice is the strain rate. According to the study by Sun, the strain rate for a given specimen is proportional to the applied loading rate when the specimen dimensions are specified [31].
This research examines flexural strength and effective flexural elastic modulus as the bending mechanical properties. The temperature of ice significantly influences its bending mechanical properties [32]. The porosity of ice also affects the bending mechanical characteristics of ice [33]. Refer to the subsequent information for the computation of ice porosity. vT is defined as ice porosity. For freshwater lake ice, porosity is therefore equal to the gas (air) volume fraction (va), i.e., vT = va. Accordingly, vT can be expressed as [22,34]:
where vT is the porosity (volume fraction); va is the gas volume (volume fraction); ρ is the density of the ice specimen (g·cm−3); ρi is the pure ice density (g·cm−3).
Subsequent to the assessment of porosity and additional parameters, the experimental program was established to methodically examine the effects of ice temperature and porosity on the lake ice flexural properties (i.e., effective flexural elastic modulus and flexural strength). Ice temperature and porosity are set as controlled variables. In this study, the ice temperature is controlled by a constant-temperature chamber and the laboratory environment, guaranteeing steady temperature control during testing. Simultaneously, porosity, derived from depth-resolved density assessments, served as a representative microstructural indicator of the ice. This study primarily focused on the effects of temperature and porosity. The strain rate was not treated as a controlled variable because of practical and statistical constraints. The available number of specimens was limited; even if a wider range of strain rates had been tested, the sample number would have precluded robust statistical analysis of strain-rate dependence. Detailed strain rate data for each experiment are provided in Appendix D. Previous studies have demonstrated that the bending behavior, particularly the flexural strength, is highly sensitive to the strain rate.
Consequently, a total of 50 set of bending tests were made, with each group matching specific ranges of porosity and ice temperature. This design allows for a comprehensive assessment of the impact of differences in temperature or porosity on the effective flexural elastic modulus and flexural strength, offering mechanistic insights into the thermal and structural sensitivity of lake ice under flexural loading.
3. Test Results and Analysis of Ice Flexural Properties
3.1. Four-Point Bending Test Results
Subsequent to the determination of the testing methodology, specimen dimensions, and parameter computation, the ice block was divided into fifty specimens measuring 7 cm × 7 cm × 65 cm and subjected to the test. Each ice beam was tested only once because the four-point bending test causes complete fracture of the specimen, making repeated measurements impossible. To ensure consistency, all specimens were prepared under uniform conditions before the minimum duration of 24 h in a constant-temperature chamber. The experiment’s results are presented in Table 1.

Table 1.
Test results. T denotes temperature; vT signifies porosity; Ef indicates the effective flexural elastic modulus; σf represents flexural strength.
The average effective bending modulus of all test specimens in this experiment is about 3.31 GPa ± 0.90 GPa. The average flexural strength is about 2813 kPa ± 531 kPa (average value ± standard deviation). It is worth noting that the coefficients of variation (COV is defined as standard deviation/average value in this study) for the effective flexural elastic modulus (0.27) and the flexural strength (0.19) differ in this study. Such differences are not unusual in ice mechanics experiments. Similar results have been reported by Wang et al. (2023), who found that for mixed ice from Prydz Bay, East Antarctica, the flexural strength ranged from 511 to 846 kPa with a mean value of 688 ± 153 kPa (COV ≈ 0.22), whereas the effective elastic modulus varied between 0.9 and 2.0 GPa with a mean of 1.6 ± 0.5 GPa (COV ≈ 0.31) [3]. In addition, the Hanzhang Lake ice results shown in Table 3 of [35] reported a similar pattern, where the COV of the effective modulus was higher than that of the flexural strength. Following the analysis of the experimental results, Section 3.2 and Section 3.3 will concentrate on the influence of T and vT on bending mechanical properties, respectively.
3.2. Effect of Ice Temperature on Bending Mechanical Properties
There has been much research on how ice temperature affects bending mechanical properties. Wang used logarithmic fitting to ascertain the relationship between the flexural strength and temperature of ice [36]. Refer to Equation (5) for details.
where T0 = 1 °C to standardize units.
Additionally, temperature has a significant impact on the modulus. In the study by Koshkin et al. [37], the linear function described by the model represented by Equation (6) is used for fitting purposes.
where Ef represents the effective flexural elastic modulus in gigapascals (GPa) and T denotes the ice temperature in °C. m, n, and p are fitting constants.
This section used Equation (6) for fitting, yielding fitting values of m = 4.537, n = 0.498, and p = 0.022. The fitting results are shown in Figure 5.
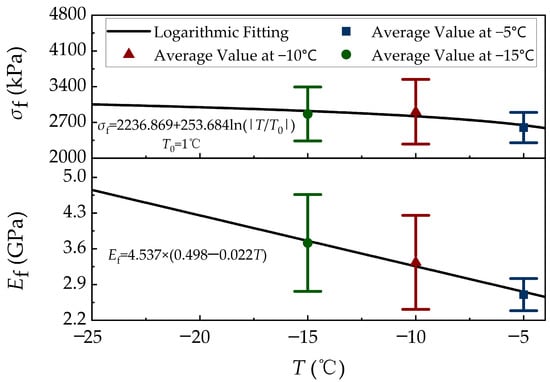
Figure 5.
Fitting curve of ice temperature and bending mechanical properties. Error bars represent sample standard deviation. σf denotes the flexural strength. Ef represents the effective flexural elastic modulus.
As shown in Figure 5, the experimental results of flexural strength and effective flexural elastic modulus at −5 °C, −10 °C, and −15 °C exhibit good agreement with the fitted Equations (5) and (6), respectively, indicating the reliability of the correlations within this temperature range. It is worth noting that although Equations (5) and (6) describe the temperature dependence of flexural properties, they are not applicable when the temperature is close to 0 °C, even if it remains below freezing. Within the experimental range, as temperature decreases, both flexural strength and effective flexural elastic modulus increase. From an energy perspective, this can be explained by the fact that lower ice temperature strengthens intermolecular bonding, requiring more energy to initiate cracks, thereby increasing the flexural strength and effective flexural elastic modulus of the ice [27,36].
Compared with published relations—such as and reported by Wang [36], and given by Koshkin et al. [37]—the Huhenuoer Lake ice shows a much higher baseline flexural strength (i.e., a larger intercept in the σf fit). However, its logarithmic sensitivity to temperature is lower. In contrast, its effective flexural elastic modulus, although intermediate in magnitude at low temperatures, decreases with temperature at a substantially greater rate (slope ≈ −0.0998) than those reported previously. These results indicate that the Huhenuoer Lake ice maintains superior initial resistance to bending but undergoes a comparatively sharper stiffness reduction with increasing temperature. In engineering terms, this implies favorable low-temperature strength but a faster loss of stiffness as temperature rises, which means larger design safety factors near the melting range.
3.3. Effect of Ice Porosity on Bending Mechanical Properties
The impact of ice porosity on ice bending properties has been studied in numerous earlier works. Consequently, this section adopts the concept of the study by Wang et al. [3], dividing the porosity range of the samples from 0.000 with intervals of 0.005 and calculating the average values of bending properties and porosity within each category for fitting purposes. According to the study by Ji et al. [35], the model represented by Equation (7) is applicable for modeling the flexural strength of ice with porosity.
The unit of σf is kilopascals (kPa), while the unit of vT is parts per thousand (‰). Xiu indicates that the model represented by Equation (8) may effectively replicate the relationship between porosity and effective flexural elastic modulus [38].
The unit of Ef is gigapascals (GPa), while the unit of vT is parts per thousand (‰). Data from Table 1 were analyzed to establish the fitting coefficients at various temperatures; these coefficients are shown (Table 2). Figure 6 was used to illustrate the fitted curves visually.
Table 2.
Porosity’s fitting coefficient of effect on bending parameters. T represents temperature; a, c, and d are parameters in Equation (7); and f and g are parameters in Equation (8).
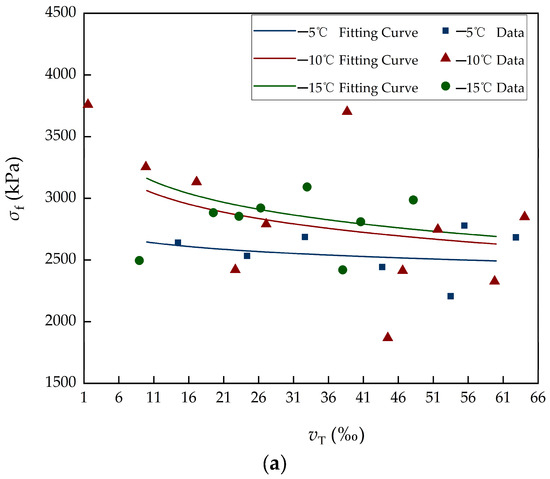
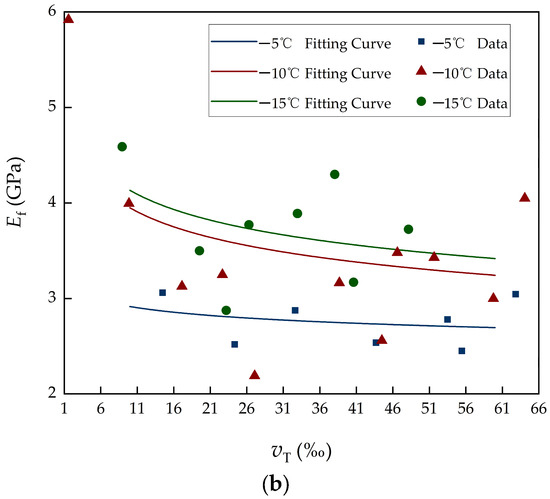
Figure 6.
Relationship between porosity and flexural mechanical properties. (a) Fitted curve showing the variation in flexural strength as a function of porosity. (b) Fitted curve showing the variation in effective flexural elastic modulus as a function of porosity.
Figure 6 illustrates an obvious decrease in flexural strength as porosity increases. It is noteworthy that for vT = 1.58‰, the effective flexural elastic modulus (Ef = 5.92 GPa) and flexural strength (σf = 3761 kPa) shown in Figure 6a,b are very big within their respective datasets, particularly the effective flexural elastic modulus, which is 1.289 times more than the second highest value in the modulus category. This indicates that variations in vT may significantly influence the effective flexural elastic modulus and flexural strength, similar to the study by Huang [5]. It is worth noting that sea-ice formulations were used only as mathematical forms and were re-fitted using Huhenuoer Lake-ice data. In Figure 6, the variation in the porosity fitting coefficients, particularly parameter a, can be attributed to the effect of ice temperature change. Specifically, at lower temperatures, the intermolecular bonding between ice grains is strengthened, which enhances the overall resistance to crack initiation and propagation. As a result, both the flexural strength and effective flexural elastic modulus increase under the same porosity conditions. From an energy perspective, this phenomenon aligns with the previously discussed mechanism that lower ice temperatures require greater energy to break intermolecular bonds and initiate cracks. Consequently, the sensitivity of the flexural strength to porosity (represented by the coefficient a) becomes more pronounced at lower temperatures, reflecting the stronger bonding. These results highlight the important role of temperature in modulating the porosity–strength relationship.
Regarding why this occurs, the study by Huang [5] elucidates three primary reasons. (1) According to mixed media theory, air has a substantially lower flexural strength than pure ice within the range of natural ice deformation. Additionally, changes in the volume content of bubbles and pure ice crystals will unavoidably control the mechanical properties of the entire ice layer. (2) In terms of structure, the overall mechanical behavior of lake ice will also be impacted by variations in bubble size and arrangement within an ice layer with the same bubble quantity. (3) Internal porosity in ice induces stress concentration inside the material. High-stress zones occur around bubbles. Consequently, even when the mean stress across the cross-section is little, the stresses at bubble tips inside the ice may be high—this causes inter-crystal or trans-crystal dislocation slip, resulting in fast growth of cracks and ultimately causing the whole ice specimen to fracture.
4. Design Parameters of Huhenuoer Lake Ice Runway
In the 4th section, we determine that the bending mechanical properties of ice can be obtained from its temperature using equation fitting (i.e., Equations (5) and (6)). A primary concern of ice runways is the ice’s carrying capacity, necessitating an understanding of its flexural strength and effective flexural elastic modulus [3]. Therefore, if the design air temperatures for different aircraft types at Huhenuoer Lake can be determined from long-term meteorological records, the corresponding design ice temperature can then be obtained. Here, design air temperature refers to standardized temperature indices representing more extreme warm-summer or cold-winter seasons. There are situations where a design “warm-winter” freeze index is of much value [39]. Once the design ice temperature is established from the design air temperature, the design flexural strength and the design effective flexural elastic modulus can be derived using Equations (5) and (6). This will yield valuable insights for the future design of lake ice runways.
Consequently, to achieve the aforementioned goals, this part necessitates the execution of two steps, with the second step making full use of the experimentally measured flexural strength and effective flexural elastic modulus to determine the design mechanical parameters of the Huhenuoer Lake ice runway. (1) The methodology outlined in subsection 5.1 of the study by Wang et al. [4] facilitates the determination of design temperatures for various aircraft models, necessitating statistical data on daily mean air temperature from 1993 to 2024. (1. Daily mean air temperature data were used to calculate the winter freezing-degree-days (FDD). 2. The Stefan equation was applied to convert FDD into the corresponding lake-ice thickness for each day. 3. The relation provides the minimum required ice thickness for each aircraft type. By combining this requirement with the Stefan-derived ice-thickness curve, we determined the first day on which the ice thickness meets the aircraft-specific requirement. 4. The end point is taken as the final day of the study period—for Huhenuoer Lake this is generally the last day on which the accumulated freezing-degree-days (FDD) exhibit a continuous day-to-day increase, owing to the lake’s long winters and the large number of daily mean air temperature < 0 °C days. 5. Based on the beginning and end points, and after applying the prescribed safety factor (i.e., dividing the relevant duration by the safety factor), the conservative operational period is determined. The conservative operational period is defined here as the continuous time within the study period during which operation of a specified aircraft type on the lake ice can be considered reasonably safe under conservative assumptions.) (2) The design ice temperature of Huhenuoer Lake is derived using the design air temperature established in the first step, along with the distribution law of lake ice temperature. This paper’s Section 3.2 indicates the correlation between ice temperature and the ice bending mechanical characteristics, enabling the determination of design bending mechanical properties of lake ice for various aircraft types. Detailed practices of these two steps are described as follows.
The growth period ends when the ice surface temperature settles to the melting point in late winter [40]. The time when maximum ice thickness is reached typically corresponds to the maximum accumulated freezing-degree days [41]. Therefore, this section employs the methodology outlined in subsection 5.1 of the study by Wang et al. [4], specifically the Stefan equation displayed in Figure 9 of the study by Wang et al. [4], alongside arunway = 1.870, to compute from the 1993–1994 research period to 2023–2024 research period (refer to Appendix A of the study by Wang et al. [4] for more information). The specific research methodologies are shown in Appendix E. Appendix E serves as the basis for determining the required ice thickness for each aircraft type. Please refer to Appendix E for a detailed explanation of the calculation procedure. Note that bending strength and effective flexural elastic modulus are intrinsic material properties of the ice. Using conservative operation time period corresponding to a larger aircraft for a smaller aircraft constitutes a conservative (safer) choice.
Subsequently, for this aircraft type, all daily mean air temperatures within the conservative periods from 1993 to 2024 are compiled, and the mean and standard deviation of this dataset are calculated. The results are shown in Table 3.
Table 3.
The mean and standard deviation of all daily mean air temperatures within the conservative periods from 1993 to 2024 for different aircraft.
This section uses the average value plus standard deviation of the identical aircraft shown in Table 3 as the design air temperature for the aircraft. In mid-winter, the lake ice temperature distribution exhibits a linear characteristic [42,43,44,45], and the ice-water interface is approximately 0 °C. Consequently, the design ice temperature is the mean of the design air temperature and the ice-water interface temperature. It is another point to note that the effective flexural modulus represents an average over the porosity between the upper load points, whereas the flexural strength is governed by the weakest region near the beam surface. Consequently, porosity located near the bottom surface can exert a large influence on the measured flexural strength. The design flexural strength is derived from Equation (5), while the design effective flexural elastic modulus is calculated using Equation (6). The overall workflow for calculating the design flexural strength and the design effective flexural elastic modulus is shown in Figure 7.
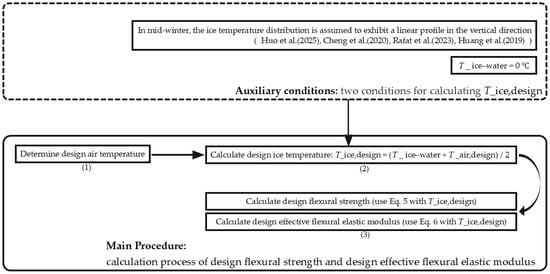
Figure 7.
The overall workflow for the calculation of the design flexural strength and the design effective flexural elastic modulus. Overall workflow for calculating the design flexural strength and design effective flexural elastic modulus of Huhenuoer Lake ice. The auxiliary conditions (top) define the assumptions regarding the ice temperature distribution and its relationship with air temperature [42,43,44,45]. The main procedure (bottom) calculates the design ice temperature based on design air temperature, then derives the corresponding design flexural strength and design effective flexural elastic modulus using Equations (5) and (6).
The design ice thickness (in centimeters) is determined by rounding the calculated minimum thickness to the nearest multiple of 10 cm. List the statistical findings in Table 4 in brief.
Table 4.
Design ice temperature, design flexural strength and design effective flexural elastic modulus of different aircraft. (Design ice temperature was computed using data in Table 3 as: average of daily mean air temperature over the conservative operational period + the standard deviation of daily mean air temperature over the same period; e.g., An-2: −25.2 + 5.5 = −19.7 °C.).
In Table 4, the design air temperature and design ice temperature are reported to one decimal place. The design flexural strength is reported to two significant figures by truncation (i.e., digits beyond the second significant figure were discarded rather than rounded, which yields a conservative estimate). The design effective flexural elastic modulus is reported to two decimal places.
It should be noted that, for aircraft that require greater ice thickness—here exemplified by the Gulfstream G650ER—both the design air temperature and the design ice temperature are higher. This primarily reflects local climatology: in Hulun Buir daily mean air temperatures remain relatively low from mid-January through mid-to-late February, after which individual March days exhibit comparatively higher daily mean air temperature values (although these generally remain below 0 °C). Ice thickness may increase over this interval; accordingly, sufficient ice thickness for the Gulfstream G650ER is reached only by mid-to-late February. Consequently, the conservative operational period applicable to the Gulfstream G650ER corresponds to days with relatively higher daily mean temperatures, which leads to higher design air and ice temperatures compared with lighter aircraft (e.g., the An-2), whose conservative operational period occurs earlier (mid-January to mid-to-late February).
5. Conclusions and Perspectives
The flexural behavior of ice has been widely investigated through three-point and four-point bending tests, with some studies analyzing the effects of temperature and porosity on its mechanical properties. For example, Timco and O.’Brien (1994) demonstrated that in measuring the flexural strength of ice, both cantilever beam tests and simply supported beam tests are commonly used, with the latter involving beams loaded at three or four points [46]. These studies underscore that the flexural behavior of ice has long been a central topic in ice research. However, despite this extensive research, no systematic investigation of the flexural properties of lake ice in Hulun Buir has been reported. The development of potential lake-ice runways can therefore help bridge this research gap and contribute to the broader utilization of natural ice resources. It is also emphasized that this study focuses on the preliminary feasibility analysis, and further fundamental research is needed before the actual implementation of a lake-ice runway at Huhenuoer Lake.
This research studied the ice in Huhenuoer Lake to examine how porosity and ice temperature influence the effective flexural elastic modulus and flexural strength, using a four-point bending experiment to measure those parameters. Concurrently, the design ice temperatures for different aircraft used on Huhenuoer Lake’s ice runway are established using the analytical method from the study by Wang et al. [4] in combination with statistical techniques. This leads to the computation of the aircraft’s design flexural strength and design effective flexural elastic modulus. It should be emphasized that the present analysis pertains exclusively to the potential ice runway at Huhenuoer Lake, which has not yet undergone any actual construction. Nevertheless, this analysis may provide advantageous information for the design and construction of the potential ice runway at Huhenuoer Lake, particularly with respect to structural safety.
5.1. Conclusions
Specifically, the following are drawn as conclusions:
- The average grain size of the Huhenuoer Lake ice is around 15.88 mm. The grain figure indicates that the Huhenuoer Lake ice consists entirely of columnar ice, with grain size exhibiting a pattern of increasing with depth. The average density of Huhenuoer Lake ice is about 0.89 g/cm3. The density of Huhenuoer Lake ice has a decreasing trend with depth until stabilizing. Analysis of all test specimens from the four-point bending experiment yielded an average effective flexural elastic modulus of 3.31 GPa. The average flexural strength is about 2813 kPa.
- The effective flexural elastic modulus and flexural strength increase as temperature decreases. This research used Equation (5) (logarithmic function) to model the inverse relationship between flexural strength and temperature. Equation (6) (linear function) characterizes the inverse association between effective flexural elastic modulus and temperature. The influence of temperature on the effective flexural elastic modulus and flexural strength may be attributed to the fact that lower ice temperatures enhance intermolecular bonding forces, necessitating more energy to initiate fractures, hence strengthening the flexural strength and effective flexural elastic modulus of ice.
- The effective flexural elastic modulus and flexural strength decrease as porosity increases. This research used Equation (7), a composite function of the exponential and power functions, to model the inverse relationship between flexural strength and porosity. Equation (8) (power function) characterizes the inverse relationship between the effective flexural elastic modulus of bending and porosity. The impact of porosity on the effective flexural elastic modulus and flexural strength may be analyzed from three perspectives: 1. The flexural strength of air is significantly inferior to that of pure ice, and variations in the volume of bubbles and pure ice crystals influence the mechanical properties of the entire ice layer; 2. Structurally, differences in bubble size and position within an ice layer of equivalent bubble content will also influence the overall mechanical performance of lake ice; 3. During failure, pores within the ice will induce stress concentration phenomena, resulting in elevated stress regions surrounding the bubbles. Consequently, it results in inter-crystal or trans-crystal dislocation and slip. As a result, it affects the flexural mechanical properties of lake ice.
- Utilizing the analytical methodology proposed by Wang et al. [4], and considering that the design air temperature in cold-region engineering serves as a conservative indicator reflecting how “warm” the winter season can be, this study first analyzed the daily mean air temperatures during the conservative operational periods of different aircraft types from 1993 to 2024. For each aircraft type, the average value and standard deviation of the daily mean air temperatures within its respective conservative operational periods were calculated. The sum of these two values—the average plus one standard deviation—was then defined as the design air temperature for the aircraft in this study. Based on this design air temperature, the corresponding design ice temperature was obtained by averaging the design air temperature and the ice–water interface temperature, under the assumption of a linear vertical temperature distribution within the ice cover. The subsequent steps for determining the design flexural strength and the design effective flexural elastic modulus are summarized in Figure 7. Specifically, the design ice temperature derived above is used to calculate the design flexural strength according to Equation (5), and the design effective flexural elastic modulus according to Equation (6). Following this procedure, the design ice temperature of the An-2 aircraft at the potential Huhenuoer Lake ice runway was determined to be −9.8 °C, corresponding to a design flexural strength of 2800 kPa and a design effective flexural elastic modulus of 3.24 GPa. The same analytical process was applied to the Bombardier Q400 and Gulfstream G650ER to derive their respective design values.
5.2. Perspectives
In addition, this study highlights that seasonal lake ice can be regarded as a low-carbon material, since lake ice is locally sourced, naturally recyclable (end-of-life by melting), and temporary in nature. As noted by Wu et al., “the ice and snow materials that have melted into water re-enter the natural water cycle, have a minimal impact on environment, and at the same time achieve efficient recycling of materials, environmental sustainability” highlighting the potential of ice as a low-carbon building material in cold-region applications [47]. At the same time, it is notable that airplane noise poses a significant threat to the well-being of individuals living in buildings near busy airports [48,49,50,51,52]. In contrast, the Huhenuoer Lake is located on the western side of Chen Barag Banner’s urban area, approximately 14 km from the Chen Barag Banner’s center. Chen Barag Banner’s urban area is the nearest county-level administrative unit urban area to the lake.
The relationship between lake-ice growth processes at Huhenuoer Lake and meteorological variable (i.e., air temperature) with Stefan model has been studied. Ice-thickness observations were obtained by hoisting the ice block from Huhenuoer Lake in this research. In line with prior literature, we assumed that the meteorological variable exhibits relationships with both ice thickness and ice temperature. (The ice temperature profile in mid-winter with ice depth in this study follows the assumption proposed by the studies [42,43,44,45], since the vertical ice-temperature distribution is not the core focus of the present work. The design ice temperature here mainly serves as a basis for the preliminary feasibility analysis of the potential ice runway. During future practical applications, temperature sensors will be embedded at various depths to obtain accurate ice temperature profiles). Using these relationships, we propose design parameters applicable to potential lake-ice runways. This research also provides an in-depth examination of the correlation between the fundamental physical features of Huhenuoer Lake ice (ice porosity and ice temperature) and its bending characteristics (flexural strength and effective flexural elastic modulus). This article analyzes the engineering characteristics of a sustainable ice runway from the standpoint of bending mechanics. However, the link between strain rate and bending mechanical characteristics is the area that needs more investigation in future studies. More specifically, it is shown below:
The present study is limited by the small number of specimens and the relatively narrow variation in strain rates. In this work, strain rates ranged from 10−4 to 10−3/s, corresponding to low-rate conditions (see Appendix D for details). These findings are directly applicable to runway apron design. For high-speed aircraft operations, particularly during landing, applying a sufficient safety factor is one feasible approach. Alternatively, additional sampling and large-scale testing under high strain rate conditions prior to project implementation could provide more reliable data for landing scenarios. It is worth noting that the treatment of strain rate remains important for further study. One possible approach would be to normalize all data to an equivalent strain rate. Another practical method was proposed by other researchers. In this approach, the flexural mechanical properties are first normalized with respect to porosity (for example, to the mean porosity of the samples) to eliminate porosity-related variability. Subsequently, the strain-rate dependence is analyzed using the normalized data to determine the rate-sensitivity coefficient. Although the present study did not conduct an in-depth investigation of strain-rate effects, future work should pay particular attention to this form of normalization, which may enhance the comparability and physical interpretability of mechanical parameters in ice studies. Meanwhile, future research will further explore the influence of meteorological conditions on the porosity evolution of natural lake ice. Porosity is a parameter reflecting the microstructural state of ice, understanding its response to varying meteorological factors will be helpful for improving the prediction of ice properties under changing climate conditions. Future research should therefore focus on developing a prediction model of ice bending behavior that incorporates multiple parameters and safety factors, and translating this model into a robust design process for ice runways.
In comparison with the work of Sinha (1995), which presented a comprehensive investigation of a sea-ice runway for a Boeing-727 in Northern Greenland [53], the present study has already covered the key aspects related to ice quality. Specifically, the full-depth structural characteristics of the Huhenuoer Lake ice were examined and confirmed to be columnar freshwater ice, and detailed laboratory analyses were conducted on its physical and mechanical properties. In this respect, the current work provides a more complete understanding of the quality and flexural behavior of lake ice. However, Sinha (1995) extended beyond laboratory characterization to include engineering verification through actual aircraft test landings [53]. That study further examined practical operational concerns such as the influence of tire pressure and landing gear on the runway surface, temperature variations during both landing and parking periods, and the monitoring of ice deflection and crack propagation. In addition, Sinha discussed the short-term rheological behavior of polycrystalline ice, emphasizing that it remains linear within the elastic and primary creep range—termed the Elasto-Delayed Elastic (EDE) response—which governs many applied problems in ice mechanics [54,55]. These aspects provide valuable insights for future work. The present research represents a preliminary step toward evaluating the mechanical feasibility of a potential ice runway at Huhenuoer Lake. In future studies, efforts will be directed toward large-scale field verification, including in situ loading tests, and monitoring of runway response under aircraft operations, thereby aligning the next phase of research more closely with the practical framework demonstrated in Sinha (1995) [53].
Author Contributions
Conceptualization, P.L.; methodology, Q.Z. and L.X.; investigation, B.Z., Y.W., Z.L.; data curation, B.Z., Y.W., Y.L. and X.B.; formal analysis, Q.Z., L.X., X.G., J.H.; visualization, Q.W. and P.L.; writing—original draft preparation, Q.Z., Y.W. and L.X.; writing—review and editing, B.Z., Q.W. and P.L.; funding acquisition, Y.W., L.X. and J.H. All authors have read and agreed to the published version of the manuscript.
Funding
This research was supported by Natural Science Foundation of Inner Mongolia Autonomous Region of China (grant number 2023MS04006), the National Natural Science Foundation of China (grant number 32460290), and the Science and Technology Innovation Project of Inner Mongolia Autonomous Region Meteorological Bureau, China (grant number nmqxkjcx202409).
Data Availability Statement
All essential data are included within the article. For a more detailed data request, please contact the corresponding author directly.
Conflicts of Interest
The authors declare no conflicts of interest.
Appendix A. Schematic Diagram of the Mechanical Analysis for the Four-Point Bending Test

Figure A1.
Mechanical analysis diagram of the four-point bending experiment for an ice beam. Where F represents the force value measured by the external mechanical sensor; lₛ denotes the lower span, defined as the horizontal distance between the two lower support points in Figure 4, which is 40 cm in this experiment; l refers to the horizontal distance between the lower supporting point and the upper loading point on the same side in Figure 4, which is 12.5 cm in this experiment.
Appendix B. Force–Deflection Behavior of Ice Beams
To verify the quasi-linear response region during four-point bending, the representative force–deflection curve from Test No. 3 is presented below. This plot demonstrates that the applied load and mid-span deflection exhibit an approximately linear relationship prior to failure.

Figure A2.
Representative force–deflection curve from Test No. 3 during the four-point bending test. F represents the measurement value (N) of the external force sensor. F is the sum of external forces at two loading points on the upper span. w(0.5ls) represents the mid-span displacement (mm).
Appendix C. Two Representative Experimental Results to Illustrate the Fracture Location of Ice Beams
Appendix C presents two representative test records that illustrate the fracture behavior and variability of failure locations observed in ice beams subjected to four-point bending. Although both beams fractured within the region between the two upper loading points, the Test No. 1 specimen failed closer to one of the upper loading points, while the Test No. 2 specimen fractured nearer to the mid-span. These results confirm that the fracture locations were randomly distributed across the region between the two upper loading points.

Figure A3.
Representative fracture patterns of ice beams under four-point bending: (a) Test No. 1 specimen, fracture occurred near the upper loading point; (b) Test No. 2 specimen, fracture occurred near the mid-span. (Photo by Zhixing Li).
Appendix D. The Specific Strain Rate and Loading Time for Each Specimen
The range of loading rates achievable with our testing instrument corresponds, for the specimen size used here (7 cm × 7 cm × 65 cm), to strain rates of approximately 10−4–10−3 s−1; consequently, this interval represents the realistic and reliably attainable operating range for the present experimental setup. It should also be noted that the present work is intended as a feasibility analysis for a potential ice runway at Huhenuoer Lake; full-scale implementation would require additional foundational studies. In follow-up work we plan to collect a larger number of specimens and to upgrade the loading system to permit stable application and control of a substantially wider range of loading rates, thereby enabling a more comprehensive assessment of strain-rate effects. The strain rate and loading time for each specimen, are shown in Table A1.
Table A1.
Strain rate calculations for each specimen. The test numbers in Table A1 align with those in Table 1. The unit of is 10−4 s−1 and the unit of loading time is s in Table A1.
| Test Number | Loading Time | Test Number | Loading Time | ||
|---|---|---|---|---|---|
| 1 | 2.24 | 18 | 26 | 3.23 | 19 |
| 2 | 2.24 | 25 | 27 | 2.21 | 17 |
| 3 | 3.27 | 14 | 28 | 2.24 | 13 |
| 4 | 4.34 | 8 | 29 | 3.26 | 11 |
| 5 | 4.13 | 8 | 30 | 4.55 | 12 |
| 6 | 3.27 | 14 | 31 | 3.24 | 10 |
| 7 | 4.54 | 9 | 32 | 3.30 | 10 |
| 8 | 2.20 | 14 | 33 | 3.33 | 9 |
| 9 | 4.62 | 9 | 34 | 4.22 | 12 |
| 10 | 2.20 | 20 | 35 | 4.40 | 9 |
| 11 | 3.20 | 12 | 36 | 3.16 | 11 |
| 12 | 3.30 | 13 | 37 | 3.33 | 6 |
| 13 | 4.36 | 10 | 38 | 4.41 | 8 |
| 14 | 3.34 | 16 | 39 | 3.36 | 16 |
| 15 | 2.22 | 23 | 40 | 2.21 | 19 |
| 16 | 2.15 | 16 | 41 | 3.24 | 40 |
| 17 | 4.47 | 11 | 42 | 4.37 | 16 |
| 18 | 2.24 | 32 | 43 | 2.24 | 22 |
| 19 | 2.15 | 14 | 44 | 4.45 | 10 |
| 20 | 4.46 | 13 | 45 | 2.16 | 6 |
| 21 | 3.35 | 13 | 46 | 2.2 | 23 |
| 22 | 3.28 | 11 | 47 | 4.38 | 11 |
| 23 | 4.46 | 7 | 48 | 3.37 | 11 |
| 24 | 4.53 | 9 | 49 | 4.11 | 12 |
| 25 | 4.37 | 9 | 50 | 2.23 | 24 |
Appendix E. Method of Ice Thickness Required by Different Aircraft Types and Conservative Operation Time Period in a Certain Year
During a certain study period, calculations using the Stefan equation indicate that the ice thickness exceeds the requisite thickness for the aircraft by q days (Given that different aircraft types may be considered depending on operational needs. Refer to the study by Sharp [56] for the detailed calculation methodology on the necessary ice thickness for aircraft and the assumptions about the potential Huhenuoer Lake-ice runway). First, q days are divided by 1.5 (the safety factor) to obtain r days. Then, 0.5 × (q − r) is calculated, and the result is rounded up to the nearest integer to obtain s days. Starting from the first day on which the ice thickness exceeds the requirement for the given aircraft (i.e., q days), s days are moved backward to determine the start date of the conservative period. Similarly, move forward the end day of the research period by s days to determine the end date of the conservative period. In this way, for the given aircraft type, the exact start and end dates of the conservative period within the study period can be obtained. The calculation procedure of the conservative period is illustrated in Figure A4.

Figure A4.
The overall workflow of calculation process of conservative operation period. Flowchart illustrating the calculation process of the conservative operation period for different aircraft types on Huhenuoer Lake. The subroutine (top) defines the minimum required ice thickness Sl for safe aircraft operation based on temperature and aircraft weight assumptions. Significantly, the equation from [56] used in the subroutine, Sl = (1 + 25%) × (1 + 20%) × (27/8) × √W, is expressed with Sl in inches and W in tons. Refer to [56] for the formulation and further background about the units of various variables. In this study, aircraft weights were first converted to tons to compute Sl in inches, which was subsequently converted to centimeters for consistency in further analysis. The main procedure (bottom) applies the Stefan model to estimate lake ice thickness and determines the conservative start and end dates by incorporating safety factors and the study-period boundaries [4,56].
References
- Goldstein, R.; Leppäranta, M.; Onishchenko, D.; Osipenko, N. Bearing Capacity of Ice. Available online: https://www.eolss.net/ebooklib/bookinfo/cold-regions-science-marine-technology.aspx# (accessed on 16 September 2025).
- Babaei, H.; Barrette, P.D. A Computational Modeling Basis in Support of the Canadian Winter Road Infrastructure; Technical Report; NRC-OCRE-2020-TR-007; National Research Council Canada: Ottawa, ON, Canada, 2020.
- Wang, Q.; Li, Z.; Lu, P. Engineering Applications of Sea Ice Physical and Mechanical Properties: A Case Study on Unloading Cargos on Ice in the Antarctic. Ship Boat 2023, 34, 137–142. (In Chinese) [Google Scholar] [CrossRef]
- Wang, Y.; Zhao, Q.; Zhang, B.; Wang, Q.; Lu, P.; Wang, Q.; Bao, X.; He, J. An Investigation of the Thickness of Huhenuoer Lake Ice and Its Potential as a Temporary Ice Runway. Water 2025, 17, 400. [Google Scholar] [CrossRef]
- Huang, W. Study on Lake Ice Microstructure and Its Effects on Thermal and Mechanical Parameters. Ph.D. Thesis, Dalian University of Technology, Dalian, China, 2013. (In Chinese). [Google Scholar]
- Gow, A.J.; Ueda, H.T.; Ricard, J.A. Flexural Strength of Ice on Temperate Lakes: Comparative Tests of Large Cantilever and Simply Supported Beams; CRREL Report 78-9; U.S. Army Cold Regions Research and Engineering Laboratory: Hanover, NH, USA, 1978. [Google Scholar]
- Gow, A.J. Orientation Textures in Ice Sheets of Quietly Frozen Lakes. J. Cryst. Growth 1986, 74, 247–258. [Google Scholar] [CrossRef]
- Weeks, W.F.; Assur, A. Fracture of Lake and Sea Ice; CRREL Research Report 269; U.S. Army Cold Regions Research and Engineering Laboratory: Hanover, NH, USA, 1969. [Google Scholar]
- Gow, A.J.; Langston, D. Flexural Strength of Lake Ice in Relation to Its Growth Structure and Thermal History; CRREL Research Report 349; U.S. Army Cold Regions Research and Engineering Laboratory: Hanover, NH, USA, 1975. [Google Scholar]
- Frankenstein, G.E. Strength Data on Lake Ice; Technical Report 80; U.S. Army Snow Ice and Permafrost Research Establishment, Corps of Engineers: Wilmette, IL, USA, 1961. [Google Scholar]
- Han, H.; Jia, Q.; Huang, W.; Li, Z. Flexural Strength and Effective Modulus of Large Columnar-grained Freshwater Ice. J. Cold Reg. Eng. 2016, 30, 04015005. [Google Scholar] [CrossRef]
- Cole, D.M. The Microstructure of Ice and Its Influence on Mechanical Properties. Eng. Fract. Mech. 2001, 68, 1797–1822. [Google Scholar] [CrossRef]
- Suominen, M.; Repin, R.; Lu, L.; Li, F.; Kujala, P. Flexural Strength of Freshwater Ice in Saimaa Area. In Proceedings of the 26th International Conference on Port and Ocean Engineering Under Arctic Conditions, Moscow, Russia, 14–18 June 2021. [Google Scholar]
- Yang, L. Research on the Problems and Countermeasures in the Development of Tourism in Hulunbeier City. Master’s Thesis, Harbin Institute of Technology, Harbin, China, 2015. (In Chinese). [Google Scholar]
- Antarctic and Southern Ocean Coalition (ASOC). Land-based Tourism in Antarctica. In Proceedings of the Buenos Aires: XXXIV Antarctic Treaty Consultative Meeting (ATCM 34), Buenos Aires, Argentina, 20 June–1 July 2011. [Google Scholar]
- Zhou, C.; Xie, Y.; Zhang, A.; Liu, C.; Yang, J. Spatiotemporal Analysis of Interactions Between Seasonal Water, Climate, Land Use, Policy, and Socioeconomic Changes: Hulun-Buir Steppe as a Case Study. Water Res. 2022, 209, 3541. [Google Scholar] [CrossRef]
- Zhang, J. Study on the Fuel Moisture Codes and Dynamic of Fuel Moisture Content in Jiagedaqi and Fuyuan. Ph.D. Thesis, Northeast Forestry University, Harbin, China, 2018. (In Chinese). [Google Scholar]
- Editorial Committee of Encyclopedia of Rivers and Lakes in China. Encyclopedia of Rivers and Lakes in China: Section of Heilong River and Liaohe River Basins; China Water & Power Press: Beijing, China, 2014; p. 17. (In Chinese) [Google Scholar]
- Bedogni, V.; Manes, A. An Experimental Investigation of the Effect of the Placement Angle on the Collapse of Ice Screw Anchors. Eng. Fail. Anal. 2021, 26, 139–150. [Google Scholar] [CrossRef]
- Zhang, Y. Study on Internal Fabric Characteristics and Compressive Mechanical Properties of the Frazil Ice. Ph.D. Thesis, Dalian University of Technology, Dalian, China, 2024. (In Chinese). [Google Scholar] [CrossRef]
- Wu, G.; Tang, W.; Wang, Q.; Zhao, Y.; Ma, Q.; Li, Z. Full-scale Ice Trials of R/V Xuelong 2 during Her Maiden Antarctic Voyage. J. Ship Mech. 2021, 25, 981–990. (In Chinese) [Google Scholar]
- Zhang, Y.; Qian, Z.; Lv, S.; Huang, W.; Ren, J.; Fang, Z.; Chen, X. Experimental Investigation of Uniaxial Compressive Strength of Distilled Water Ice at Different Growth Temperatures. Water 2022, 14, 4079. [Google Scholar] [CrossRef]
- Huo, P.; Lu, P.; Leppäranta, M.; Kirillin, G.; Cheng, B.; Xie, F.; Li, Z. Strong Under-ice Heating of Central Asian Shallow Lakes. Geophys. Res. Lett. 2025, 52, e2024GL114501. [Google Scholar] [CrossRef]
- Huo, P.; Lu, P.; Cheng, B.; Yu, M.; Wang, Q.; Li, X.; Li, Z. Reconstructing Ice Phenology of a Lake with Complex Surface Cover: A Case Study of Lake Ulansu during 1941–2023. Cryosphere 2025, 19, 849–868. [Google Scholar] [CrossRef]
- Hutchings, J.K.; Heil, P.; Lecomte, O.; Stevens, R.; Steer, A.; Lieser, J.L. Comparing Methods of Measuring Sea-ice Density in the East Antarctic. Ann. Glaciol. 2015, 56, 77–82. [Google Scholar] [CrossRef]
- Wang, Q. Study on the Physical and Mechanical Engineering Parameters of Sea Ice During Melt Season for Arctic Passage. Ph.D. Thesis, Dalian University of Technology, Dalian, China, 2019. (In Chinese). [Google Scholar]
- Han, H.; Li, W.; Li, Y.; Liu, Z.; Liu, X. An Experimental Investigation of the Flexural Strength and Fracture Toughness of Granular Snow Ice Under a Three-Point Bending Test. Water 2024, 16, 3358. [Google Scholar] [CrossRef]
- Aly, M. Analysis of Scale Effects in Ice Flexural Strength. Master’s Thesis, Memorial University of Newfoundland, St. John’s, NL, Canada, 2018. [Google Scholar]
- Weeks, W.F.; Assur, A. The Mechanical Properties of Sea Ice. In US Army Cold Regions Research and Engineering Laboratory (CRREL) Monograph II-C3; Cold Regions Research and Engineering Laboratory: Hanover, NH, USA, 1967. [Google Scholar]
- Aly, M.; Taylor, R.; Bailey Dudley, E.; Turnbull, I. Scale Effect in Freshwater Ice Flexural Strength. In Proceedings of the ASME 2018 37th OMAE Conference, Madrid, Spain, 17–22 June 2018. [Google Scholar]
- Sun, J. Bending Test of Ice Beam and Analysis of Mechanic Performance of Ice Shell. Master’s Thesis, Harbin Institute of Technology, Harbin, China, 2019. (In Chinese). [Google Scholar]
- Kermani, M.; Farzaneh, M. Flexural and Low-cycle Fatigue Behavior of Atmospheric Ice. J. Mater. Sci. 2009, 44, 2497–2506. [Google Scholar] [CrossRef]
- Timco, G.W.; Weeks, W.F. A Review of the Engineering Properties of Sea Ice. Cold Reg. Sci. Technol. 2010, 60, 107–129. [Google Scholar] [CrossRef]
- Cox, G.F.N.; Weeks, W.F. Equations for Determining the Gas and Brine Volumes in Sea-Ice Samples. J. Glaciol. 1983, 29, 306–316. [Google Scholar] [CrossRef]
- Ji, S.; Liu, Y.; Wang, Q.; Lu, P.; Yuan, S. In Situ Tests on the Flexural Strength and Effective Elastic Modulus of Brackish Ice During Different Ice Periods. Water 2025, 17, 3189. [Google Scholar] [CrossRef]
- Wang, L. Experimental Study on Bending Performance of Artificial Ice and Numerical Simulation Analysis of Artificial Ice Rink. Master’s Thesis, Harbin Institute of Technology, Harbin, China, 2021. (In Chinese). [Google Scholar] [CrossRef]
- Koshkin, S.V.; Taranukha, N.A. Physical and Mechanical Properties of Sea Ice in Bending. In Proceedings of the ASRTU Conference Proceedings, IV Sino-Russian ASRTU Symposium on Advanced Materials and Processing Technology, Ekaterinburg, Russia, 23–26 June 2016. [Google Scholar]
- Xiu, Y. Study on Sea Ice Design Parameters for Ship Ice Resistance Evaluation in the Arctic Ocean. Ph.D. Thesis, Dalian University of Technology, Dalian, China, 2023. (In Chinese). [Google Scholar]
- Scher, R.L. Alaska Air Temperature Indices—Design ‘Warm’ Winter. In Cold Regions Engineering: Cold Regions Impacts on Transportation and Infrastructure, Proceedings of the 11th International Conference on Cold Regions Engineering 2002, Anchorage, AK, USA, 20–22 May 2002; American Society of Civil Engineers: Anchorage, AK, USA, 2002; pp. 700–711. [Google Scholar]
- Leppäranta, M. Ice Phenology and Thickness Modelling for Lake Ice Climatology. Water 2023, 15, 2951. [Google Scholar] [CrossRef]
- Arp, D.; Cherry, E.; Brown, R.N.; Bondurant, C.; Endres, L. Observation-derived Ice Growth Curves Show Patterns and Trends in Maximum Ice Thickness and Safe Travel Duration of Alaskan Lakes and Rivers. Cryosphere 2020, 14, 3595–3609. [Google Scholar] [CrossRef]
- Huo, P.; Lu, P.; Leppäranta, M.; Cheng, B.; Li, C.; Fu, X.; Yu, M.; Li, Z.; Li, X. Modeling the Ice Mass and Heat Budget in Shallow Central Asian Lakes with Focus on Ice–water Interaction. Water Resour. Res. 2025, 61, e2025WR040070. [Google Scholar] [CrossRef]
- Cheng, Y.; Cheng, B.; Zheng, F.; Vihma, T.; Kontu, A.; Yang, Q.; Liao, Z. Air/snow, Snow/ice and Ice/water Interfaces Detection from High-resolution Vertical Temperature Profiles Measured by Ice Mass-balance Buoys on an Arctic Lake. Ann. Glaciol. 2020, 61, 309–319. [Google Scholar] [CrossRef]
- Rafat, A.; Kheyrollah Pour, H.; Spence, C.; Palmer, M.J.; MacLean, A. An Analysis of Ice Growth and Temperature Dynamics in Two Canadian Subarctic Lakes. Cold Reg. Sci. Technol. 2023, 210, 103808. [Google Scholar] [CrossRef]
- Huang, W.; Cheng, B.; Zhang, J.; Zhang, Z.; Vihma, T.; Li, Z.; Niu, F. Modeling Experiments on Seasonal Lake Ice Mass and Energy Balance in the Qinghai–Tibet Plateau: A Case Study. Hydrol. Earth Syst. Sci. 2019, 23, 2173–2186. [Google Scholar] [CrossRef]
- Timco, G.W.; O.’Brien, S. Flexural Strength Equation for Sea Ice. Cold Reg. Sci. Technol. 1994, 22, 285–298. [Google Scholar] [CrossRef]
- Wu, Y.; Chen, B.; Liu, X.; Zhang, X. Development and Innovation of Ice and Snow Building Structures. Build. Struct. 2018, 48, 34–39. (In Chinese) [Google Scholar]
- Benz, S.; Kuhlmann, J.; Jeram, S.; Bartels, S.; Ohlenforst, B.; Schreckenberg, D. Impact of Aircraft Noise on Health. In Aviation Noise Impact Management; Springer International Publishing: Cham, Switzerland, 2022; pp. 173–195. [Google Scholar]
- Ang, L.Y.L.; Cui, F. Remote Work: Aircraft Noise Implications, Prediction, and Management in the Built Environment. Appl. Acoust. 2022, 198, 108978. [Google Scholar] [CrossRef]
- Bayo Jimenez, M.T.; Gericke, A.; Frenis, K.; Rajlic, S.; Kvandova, M.; Kröller-Schön, S.; Oelze, M.; Kuntic, M.; Kuntic, I.; Mihalikova, D.; et al. Effects of Aircraft Noise Cessation on Blood Pressure, Cardio- and Cerebrovascular Endothelial Function, Oxidative Stress, and Inflammation in An Experimental Animal Model. Sci. Total Environ. 2023, 903, 166106. [Google Scholar] [CrossRef]
- Huss, A.; Spoerri, A.; Egger, M.; Röösli, M.; Swiss National Cohort Study Group. Aircraft Noise, Air Pollution, and Mortality from Myocardial Infarction. Epidemiology 2010, 21, 829–836. [Google Scholar] [CrossRef]
- Mahashabde, A.; Wolfe, P.; Ashok, A.; Dorbian, C.; He, Q.; Fan, A.; Lukachko, S.; Mozdzanowska, A.; Wollersheim, C.; Barrett, S.R.H.; et al. Assessing the Environmental Impacts of Aircraft Noise and Emissions. Prog. Aerosp. Sci. 2011, 47, 15–52. [Google Scholar] [CrossRef]
- Sinha, N.K. Sea Ice Landing Strip for Boeing-727 in Northern Greenland. In Proceedings of the 14th International Conference on Offshore Mechanics and Arctic Engineering, Copenhagen, Denmark, 18–22 June 1995. [Google Scholar]
- Sinha, N.K. Grain-size Influence on Effective Modulus of Ice. In Proceedings of the Workshop on the Bearing Capacity of Ice Covers, Winnipeg, MB, Canada, 16–17 October 1978. [Google Scholar]
- Gold, L.W.; Sinha, N.K. The Rheological Behaviour of Ice at Small Strains. In Proceedings of the Physics and Mechanics of Ice: Symposium Copenhagen, Copenhagen, Denmark, 6–10 August 1979; Technical University of Denmark: Lyngby, Denmark, 1979; pp. 117–128. [Google Scholar]
- Sharp, R.P. Suitability of Ice for Aircraft Landings. Trans. Am. Geophys. Union 1947, 28, 111–119. [Google Scholar] [CrossRef]
Disclaimer/Publisher’s Note: The statements, opinions and data contained in all publications are solely those of the individual author(s) and contributor(s) and not of MDPI and/or the editor(s). MDPI and/or the editor(s) disclaim responsibility for any injury to people or property resulting from any ideas, methods, instructions or products referred to in the content. |
© 2025 by the authors. Licensee MDPI, Basel, Switzerland. This article is an open access article distributed under the terms and conditions of the Creative Commons Attribution (CC BY) license (https://creativecommons.org/licenses/by/4.0/).