Abstract
Understanding the relationship between streamflow and climate input is important to inform how streamflow characteristics could change under climate change. The first part of this study assessed the relationship between annual streamflow and climate characteristics using rainfall, potential evapotranspiration (PET) and streamflow data from 133 catchments across the Murray–Darling Basin (MDB). The second part assessed the response of key streamflow metrics (mean annual runoff, high-flow days, low-flow days and minimum three-year flow) to changes in rainfall characteristics and PET using a weather generator and five hydrological models. The results indicate that annual streamflow is strongly correlated to many rainfall characteristics. However, these rainfall characteristics are also strongly correlated to annual rainfall, and therefore annual rainfall is generally a good predictor of annual streamflow. Rainfall characteristics that have a secondary influence on annual streamflow include effective rainfall, which is defined as the cumulative positive differences between daily or monthly rainfall and PET, rainfall seasonality, multi-day rainfall totals and multi-year rainfall lows. The change in future mean annual streamflow is driven primarily by the change in mean annual rainfall and PET, followed by some of the rainfall characteristics above. In addition to mean annual rainfall, high flows are also strongly influenced by multi-day rainfall totals, while multi-year hydrological droughts are also influenced by multi-year rainfall lows and annual rainfall variability. These results are useful to identify the key climate characteristics in assessing the impacts of future climate change on water availability, and potentially for developing next-generation hydrological models that can deal with non-stationarity and better predict streamflow under a changing climate.
1. Introduction
Rainfall and PET are key variables driving catchment runoff and water resource availability. However, other climatic and non-climatic characteristics can also have a major influence on streamflow. For example, the same annual rainfall in different years can result in a different annual streamflow. This is often termed as non-stationarity of annual rainfall–streamflow relationships in the literature [1,2]. There are many reasons for non-stationarities in hydrology [3,4], such as human activities (e.g., agricultural practices, surface water and groundwater extractions, farm dams, mining, afforestation and deforestation, wildfire, etc.), changes in climate characteristics due to climate change and variability (e.g., rainfall seasonality, extreme rainfall, wet/dry spell, warmer temperature and higher evaporation, etc.) and changes in dominant hydrological processes influencing the rainfall–streamflow relationship.
This study focuses on the influence of climate characteristics on streamflow, explored using Hydrological Reference Station (HRS) catchments [5,6], which are unregulated catchments with minimal land use change and high-quality streamflow observations (Section 2.1 for detailed information). That is to say, the contributions of human activities to the non-stationary rainfall–streamflow relationship are very limited in these catchments.
Understanding the relationship between streamflow and climate inputs is important to inform robust projections of future runoff under climate change and has implications for water resource management applications [7,8]. For example, water allocation management that are based on the stationary rainfall–streamflow relationship will likely overestimate future water availability [9]. Fu et al. [4] have demonstrated that the number of rainy days and the mean length of wet spell (MeWS) can best predict annual streamflow in different hydroclimate periods. Peterson et al. [10] have attributed the non-stationarity of annual rainfall–streamflow relationships to an increased evapotranspiration per unit of precipitation. Saft et al. [11] have found that changes in hydrologic processes reflected by the rainfall–runoff relationship are mainly driven by mechanisms endogenous to the catchment, rather than exogenous and PET, baseflow index, and vegetation cover were statistically insignificant influences on the non-stationarity in rainfall–runoff relationships. Hakala et al. [12] have reviewed commonly used modelling methods in the literature to investigate the climate change impacts on hydrology and water resources and described the main sources of uncertainty. Tian et al. [13] have developed a novel hybrid model to predict runoff in nonlinear and non-stationary environments.
This paper explores the influence of climate inputs on streamflow characteristics in the Murray–Darling Basin (MDB) in southeast Australia (Figure 1). The MDB is the most important river basin in Australia. It is considered the “food bowl” of the nation [14]; more than 2.5 million people live in the Basin, and it supports numerous environmental assets including 16 Ramsar-listed wetlands.
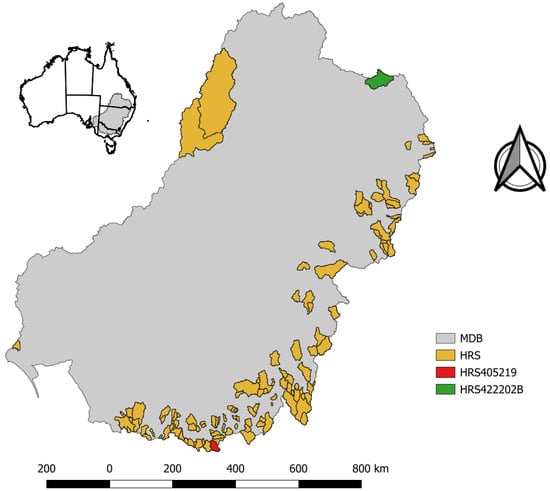
Figure 1.
Study region and 133 HRS catchments. Two catchments (405219 and 422202B) are used for hydrological modelling simulations.
There are two parts in this paper. The first part explores the relationship between annual streamflow and explanatory climate variables in the observed historical annual time series in catchments across the Basin. The second part explores the influence of changes in climate inputs on long-term average streamflow characteristics.
2. Materials and Methods
2.1. Study Region
The MDB covers one-seventh of Australia and is the largest and most important river basin in Australia (Figure 1). Hydroclimates vary significantly across the MDB with rivers exhibiting high inter-annual and multi-year variability [14]. Rainfall patterns differ in the MDB, with parts in the northern MDB experiencing highly variable tropical and extratropical summer (December to February) rainfall, while rainfall in the far south of the Basin is winter-dominated [15]. Most of the runoff comes from the high-elevation areas in the southeast of the MDB, with 80% of the public storage capacity in the southern Basin.
Data from 133 HRS catchments in the MDB (Figure 1) are used in this study for the regression relationship between annual streamflow and climate characteristics. These stations were selected by a four-stage process [5,6]:
(1) Identify unregulated catchments with insignificant land use change.
(2) Select hydrological stations with high-quality observed streamflow and being longer than 30 years.
(3) Ensure an even spatial distribution of streamflow stations for different hydroclimate conditions, particularly the high-runoff-generating upland areas in the MDB (Figure 1).
(4) Consult with relevant agencies in each jurisdiction to review the application of the guidelines.
The areas of these 133 catchments vary from 26.3 km2 to 35,239 km2 with a median value of 374 km2 and a mean value of 1066 km2.
Two catchments, 405219 in the southern MDB and 422202B in the northern MDB (Figure 1), are used for hydrological modelling simulations. These two catchments are chosen because they represent different hydroclimate patterns in the MDB: catchment 422202B in the northern MDB has summer-dominated rainfall and streamflow through the year; catchment 405219 has slightly higher rainfall in the cool season with most of the streamflow occurring in winter and spring.
2.2. Methods
Figure 2 shows the overall framework of this study. The first part of this study assessed the relationship between historical annual streamflow and climate characteristics using a simple correlation analysis. The second part assessed the response of four key streamflow metrics (mean annual runoff, high-flow days, low-flow days and minimum three-year flow) to changes in rainfall characteristics and PET using stochastic data generated by a weather generator, and runoff modelled using five rainfall–runoff models, using a simple linear correlation analysis. The number of high-flow days is defined as number of days exceeding the 99th percentile of historical daily streamflow (i.e., occurring on average 3.65 days per year in the historical data), and the number of low-flow days is defined as number of days below the 10th percentile of observed daily streamflow (i.e., occurring on average 36.5 days per year in the historical data).
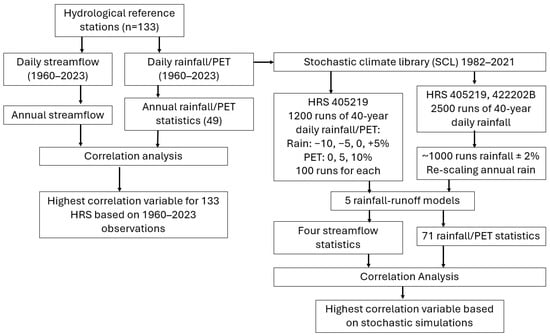
Figure 2.
Framework of this study.
2.2.1. Correlation Analysis
A correlation analysis is used to explore the relationship between the streamflow and climate variables. It is a statistical technique to understand the association between response (annual streamflow, high-flow days, low-flow days, minimum three-year flow) and the explanatory variable (climate variables). A correlation coefficient (Cor) or Pearson’s correlation coefficient is a numerical measure on the strength of the relationship and is the square root of coefficient of determination, R2, which is the proportion of the variance in the dependent variable (streamflow characteristics in this study) that is predictable from the independent variable (climate variables and statistics in this study). One advantage of Cor over R2 is that it shows the positive or negative relationship between dependent variables and the predictors [4].
2.2.2. Stochastic Climate Library
The stochastic climate library (SCL, Version 2.2) is a weather generator used to stochastically generate climate data (rainfall, PET and temperature). It is chosen for this study because it can accurately simulate daily, monthly and annual rainfall amounts as well as annual variability and extreme daily rainfall. SCL has eight models to generate rainfall and/or climate data, i.e., single-site rainfall at sub-daily, daily, monthly and annual timescales; single-site climate (rainfall, evaporation and maximum temperature) at daily, monthly and annual timescales; and multi-site daily rainfall [16].
Two scenarios of stochastic climate data are generated (Figure 2): (1) single-site climate series (rainfall and PET) for catchment 405219 with 12 different combinations of changes in rainfall (−10%, −5%, 0% and +5%) and PET (0%, 5% and 10%). Each of these 12 rainfall and PET combinations has 100 replicates of 40-year (1982–2021) daily data, resulting in 1200 replicates of daily climate data; (2) single-site rainfall series for catchments 405219 and 422202B with 2500 replicates of 40-year (1982–2021) daily data. About 1000 out of these 2500 runs with a mean annual rainfall within ±2% ranges of observations are selected and then re-scaled such that the daily time rainfall series have the same exact same mean annual historical rainfall (i.e., same long-term mean annual rainfall but different rainfall characteristics) to explore the influence of other rainfall characteristics independent of the change in mean annual rainfall.
2.2.3. Rainfall–Runoff Hydrological Models
Five lumped conceptual daily rainfall–runoff models are used to generate simulated runoff with stochastic daily climate series as inputs. The models are GR4J and GR4J_Closed [17], PDM [18], Sacramento [19], and SIMHYD [20]. The number of parameters calibrated is 4 for GR4J, 9 for PDM, 22 for Sacramento, and 10 for SimHYD. All the models simulate water movement in a closed system, except for the GR4J model, which has a parameter, water exchange coefficient (X2), allowing water exchange into or out of the system. In this study, we also employed another version of the GR4J model, where we set X2 = 0 to maintain a closed hydrological system, termed as GR4J_Closed.
These models are chosen because they have been extensively used in Australia, Europe, and the USA for climate change impact, runoff prediction at ungauged catchments and land use change studies [21,22,23,24]. Across both wet and dry catchments, GR4J demonstrates the strongest ability to reproduce observed flows, achieving the highest NSE and lowest bias, followed closely by PDM. Sacramento performs comparably to GR4J and PDM in wet catchments but is substantially less accurate in dry catchments.
The models are calibrated for the 1982–2021 period against the NSE-Bias (Nash–Sutcliffe efficiency and bias) objective function [25], which minimises the sum of squares of the difference between modelled and observed daily streamflow, while keeping the bias (the difference between total modelled and observed streamflow) small. This objective function reflects a good daily streamflow simulation with a low overall bias for the modelling period.
Overall, all five models perform well for these two catchments (Table 1). The daily NSE is above 0.7 for all models and catchments except SIMHYD for 422202B, and the bias is less than 5% except GR4J_Closed model for 422202B.

Table 1.
Performance of five hydrological models.
2.3. Datasets
The SILO Data Drill [26], which provides 0.05° gridded daily climate variables across Australia, is used in this study. The dataset is interpolated from station measurements made by the Bureau of Meteorology (BoM). The interpolations are based on the smoothing splining and kriging techniques described in [26].
Two sets of climate parameters are used in this study. For the correlation analysis of historical streamflow versus climate characteristics, 49 statistics are used, being 40 rainfall statistics, 7 PET statistics and 2 effective rainfall variables (sum of positive differences between daily and monthly rainfall and PET) (Table 2). The reason why monthly effective rainfall is also used is because daily rainfall observation in Australia is from 9:00 am to the next day at 9:00 am but daily streamflow is recorded from 0:00 am to 24:00 pm in the same day. For the hydrological model simulations, an additional 22 statistics are used, bringing the total number of statistics analysed to 71 (Table 2). The additional statistics are the coefficient of variance of annual rainfall and PET and multi-year rainfall totals.

Table 2.
Climate variables and statistics used in this study.
These statistics are chosen based on previous studies [4], which demonstrated that they could explain the non-stationary rainfall–streamflow relationship through the different hydroclimate conditions in the southern MDB and the variations in groundwater recharge. The names, units and their abbreviations are listed Table 2.
3. Results
3.1. Climate Drivers of Observed Annual Streamflow
The results of correlation analysis between annual streamflow and 49 climate variables (Table 3) indicate that annual rainfall (AP) is a key driver of catchment annual streamflow. The correlation between annual streamflow and annual rainfall is greater than 0.8 in 101 out of the 133 catchments (76%) with a mean correlation coefficient of 0.83. The correlation against annual rainfall is the highest compared to other climate statistics in 24 catchments, particularly catchments with high annual rainfall, high aridity index (ratio of mean annual rainfall to mean annual PET) and high runoff coefficient (ratio of annual streamflow to annual rainfall) (Table 3 and Figure 3).

Table 3.
Number of catchments with the highest correlation between annual streamflow and climate variables.
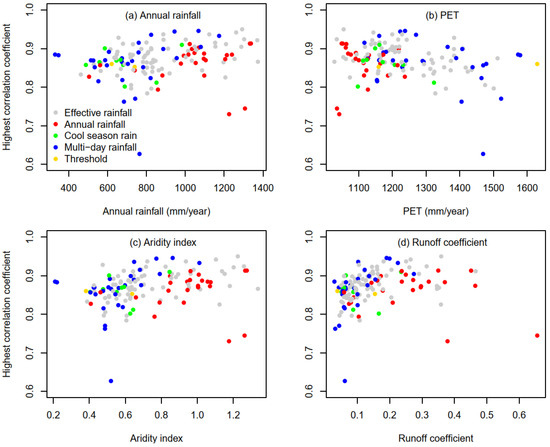
Figure 3.
Highest correlation coefficients plotted against (a) mean annual rainfall, (b) mean annual PET, (c) aridity index, and (d) runoff coefficient, across 133 HRS catchments. Each dot represents one catchment. All four plots show the climate statistic (represented by the different colours) with the highest correlation with annual streamflow as shown in Table 3.
The annual PET itself does not show a high correlation with annual streamflow, but its combination with rainfall, in terms of effective rainfall, shows the highest correlation against annual streamflow in 70 out of 133 HRS catchments, suggesting the importance of PET, as a secondary driver, on streamflow. It can happen in any hydroclimate conditions across the MDB, i.e., a wide range of mean annual rainfall, PET, aridity index and runoff coefficients (Figure 3). Moreover, the monthly effective rainfall has a much larger number of catchments as the highest correlation with annual streamflow than daily effective rainfall (51 vs. 19, Table 3).
The multi-day rainfall totals, particularly high rainfall like the maximum 10-, 30- and 90-day rainfall totals and 99th percentile of 90-day rainfall totals, are also important for runoff generation and together these have the highest correlation with annual streamflow in 28 out of 133 catchments. They are important particularly in drier regions (low annual rainfall, high PET, low aridity index and low runoff coefficient) where most of the streamflow comes from a few large rainfall events (Table 3 and Figure 3).
Rainfall seasonality, such as cool-season (March–October) rainfall (M310) in southern MDB, shows the highest correlation with annual streamflow for 9 catchments (Table 3), as most of the runoff in these catchments occur in winter and spring (Figure 3).
Another group of statistics considered is the annual total rainfall above a daily threshold, such as R20 and R30. These thresholds might be related to streamflow being generated by a small number of extreme events, potentially with small rainfall events being intercepted by vegetation or infiltration to soil occurring before runoff is generated. Annual streamflow is also strongly correlated to these statistics, but less so compared to the other rainfall characteristics described above.
In fact, annual streamflow is strongly correlated to many of the rainfall statistics considered here as shown in Figure 4, which is a boxplot of correlation coefficients with annual streamflow across 133 HRS catchments for each of 49 climate statistics.
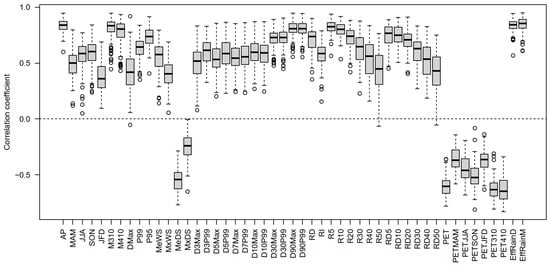
Figure 4.
Boxplot of correlation coefficients with annual streamflow across 133 HRS catchments for each of 49 climate variables. The boxes indicate the 25th (Q1), 50th, and 75th (Q3) percentiles; the whiskers indicate the lowest value within the lower limit of Q1 − 1.5 (Q3 − Q1) and the highest value within the upper limit of Q3 + 1.5 (Q3 − Q1). Values beyond the whiskers are outliers and are shown by the open circles.
However, these rainfall statistics are also strongly correlated to annual rainfall as shown in Figure 5. For example, the correlation coefficients between annual rainfall and R5 range from 0.973 to 0.998 across 133 HRS catchments, and the correlation coefficients between annual rainfall and effective rainfall (EffRainD) range from 0.967 to 0.998 (Figure 5).
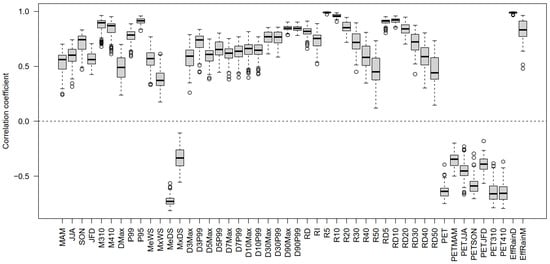
Figure 5.
Boxplot of correlation coefficients with annual rainfall across 133 HRS catchments for each of remaining 48 climate variables. The boxes indicate the 25th (Q1), 50th, and 75th (Q3) percentiles; the whiskers indicate the lowest value within the lower limit of Q1 − 1.5 (Q3 − Q1) and the highest value within the upper limit of Q3 + 1.5 (Q3 − Q1). Values beyond the whiskers are outliers and are shown by the open circles.
Figure 6 shows that annual streamflow is strongly correlated to annual rainfall in most catchments, but in some catchments, the correlation against other rainfall statistics can be up to 0.15 higher (with a median value of 0.02 across the 133 catchments). Nevertheless, as annual rainfall is strongly correlated to most rainfall statistics, annual rainfall is generally a good predictor of annual streamflow (Figure 4 and Figure 6).
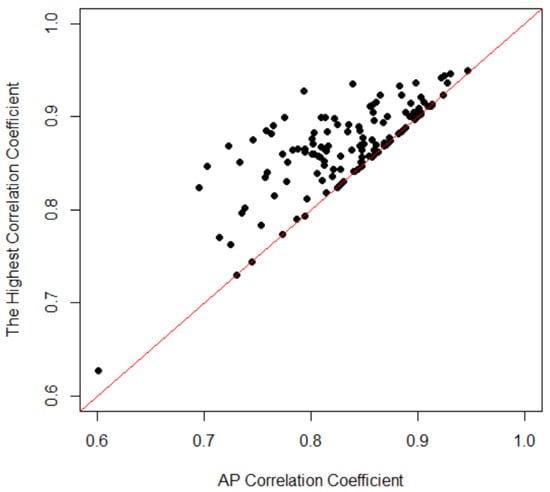
Figure 6.
Comparison of the highest correlation coefficients with the annual rainfall correlation coefficients across 133 HRS catchments. Each dot represents one catchment.
3.2. Streamflow Sensitivity to Changes in Climate Inputs as Modelled by Hydrological Models
Figure 7 shows the correlation coefficients between modelled long-term mean annual streamflow for 40 years at catchment 405219 and the long-term mean of 71 climate variables (Table 2) based on 1200 runs of stochastic daily rainfall and PET inputs (Section 2.2.2). All five rainfall–runoff hydrological models show similar results (Table 4), so the average correlation coefficients are shown in Figure 7.
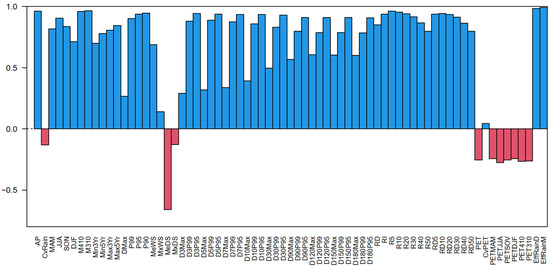
Figure 7.
Correlation coefficients between simulated annual streamflow and 70 climate variables based on 1200 runs of stochastic data from 12 different combinations of rainfall and PET changes.

Table 4.
Correlation coefficients between simulated streamflow and climate variables from five hydrological models. Only ten climate variables that have the 10 highest correlations are listed.
Although these simulated results are from a single catchment (405219), the conclusions are consistent with 133 HRS correlation based on observed data in Section 3.1 and should be valid for other catchments:
- (1)
- Mean annual rainfall (AP) is the main driver of catchment mean annual streamflow, with the modelled change in mean annual streamflow having a correlation of 0.96 against the change in mean annual rainfall (Figure 7 and Table 4). This implies that the simple elasticity of mean annual streamflow to mean annual rainfall [27,28] is a reasonable estimate of the impacts of climate change on mean annual streamflow.
- (2)
- The change in mean annual streamflow is almost perfectly related (correlation of 0.99) to the change in effective rainfall (EffRainD and EffRainM), implying the additional importance of PET on streamflow (Figure 7 and Table 4). In addition to runoff elasticity to rainfall in (1), a simple large-scale water and energy framework, like the Budyko equation [29], could be sufficient for estimating the change in mean annual runoff from a change in mean annual rainfall and PET.
- (3)
- The cool-season rainfall (M310 and M410) also shows a very high correlation with mean annual streamflow (0.95–0.98), as most of runoff in this catchment occurs over the cool season (Figure 7 and Table 4). However, it may not stand out for catchments in the northern MDB where most of rainfall occurs in summer months.
- (4)
- (5)
- Streamflow usually results from multiple rainfall events. Therefore, the lengths of wet spell and dry spell are also important for runoff generation. For example, the mean length of dry spell (MeDS) is one of the climate variables strongly relating to mean annual streamflow (Figure 7). However, its magnitude is smaller than these above-mentioned rainfall characteristics and accordingly is not listed in Table 4.
The climate variables that have a strong correlation with the number of high-flow days are dominated by the multi-day rainfall totals, particularly the 95th percentile of 90-, 120-, 30-, 150-, 180-, 10- and 7-day rainfall totals and 99th percentile of 30-day rainfall totals (Table 4). It is interesting to note that the effective rainfall (EffRainD and EffRainM) also has high correlation with the number of high-flow days. However, the magnitudes of correlation coefficients with the number of high-flow days are generally smaller than those with mean annual streamflow (Table 4).
The climate variables that have a strong correlation with the number of low-flow days are dominated by the number of days of total rainfall above a threshold, such as R5, R10, RD10, R20, RD5 and RD20 (Table 4), followed by daily effective rainfall (RffRainD) and annual rainfall (AP). The magnitudes of correlation coefficients with the number of low-flow days are the smallest among the four streamflow statistics we investigated in this study (Table 4). The differences in correlation coefficients among the five hydrological models are also the largest, highlighting the difficulty in defining and modelling low flow.
The multi-year streamflow drought is clearly driven by the multi-year rainfall total. For example, the minimum 3-year streamflow has the highest correlation with the minimum 3-year rainfall (Cor = 0.89–0.93), followed by the minimum 5-year rainfall with a Cor = 0.82–0.85.
Obviously, these climate variables are not independent, which is the main reason why many climate variables have a similar and high correlation coefficient with both mean annual rainfall and mean annual streamflow. As such, we further explore in Section 3.3 the influence of the rainfall characteristics beyond its strong correlation with mean annual rainfall, by using stochastic replicates with the same mean annual rainfall.
3.3. Streamflow Sensitivity to Changes in Climate Inputs Using Hydrological Models with No Change in Mean Annual Rainfall
This is a similar hydrological modelling and correlation analysis as Section 3.2 except that the long-term mean annual rainfall and PET from all the stochastic replicates are fixed (by scaling the replicates such that they all have the same mean annual rainfall and PET). This is to explore the additional influence of other climate variables on streamflow characteristics beyond what is already explained by the mean annual rainfall.
Table 5 shows the climate variables with the highest ten correlations with the streamflow characteristics, with the same mean annual rainfall and PET in all the stochastic replicates, for catchment 405219.

Table 5.
Correlation coefficients between simulated streamflow and climate variables from five hydrological models with fixed annual rainfall for catchment 405219. Only ten climate variables that have the highest 10 correlations are listed.
(1) For mean annual streamflow, the monthly effective rainfall (EffRainM) still has the highest correlation coefficient, but its magnitude decreased from 0.99 (Table 4) to 0.88–0.93 (Table 5), reflecting the impacts of mean annual rainfall. The cool-season rainfall (M310 and M410) also has correlation coefficients above 0.80, which are also now smaller than the 0.96–0.98 in Table 4. It is not surprising that summer rainfall (DJF) has a negative correlation with mean annual streamflow, because higher summer rainfall means lower winter rainfall as annual total rainfall is fixed here. The daily effective rainfall (EffRainD) has a correlation coefficient of 0.57–0.69. The multi-day rainfall totals (D90P95, D120P95, D150P95 and D30P95) have much lower correlation coefficients compared to 0.43–0.58 (Table 5). These overall lower correlation values mainly result from the fixed annual rainfall, implying the main driver of mean annual streamflow is mean annual rainfall.
(2) The results for the number of high-flow days are the same as Section 3.2, being dominated by the multi-day rainfall totals, particularly the 95th and 99th percentiles of 30–180-day rainfall totals. Their correlation coefficients are also smaller than Table 4 for the same catchment, 0.48–0.73 vs. 0.87–0.94, again highlighting the importance of mean annual rainfall and the strong correlation of this variable to it.
(3) The biggest challenge lies in interpreting the correlations between the number of low-flow days and climate variables. The correlation coefficients are not only smaller in magnitude, but also have different signs, i.e., negative values in Table 4, but positive in Table 5. Moreover, different climate variables show high correlations in Table 5 compared to Table 4. Also, different hydrological models show different results. For example, GR4J, GR4J_Closed, PDM and SimHyd all show that EffRainM has the highest correlation with the number of low-flow days (Cor = 0.66–0.71), but SACSMA_NSW model only has a correlation coefficient of 0.36 (Table 5). All these results indicate the challenges and limitations to simulate the number of low-flow days with current rainfall–runoff models and investigate the impacts of future climate change and variability on low flow, which is critical for ecological systems.
(4) The conclusion for multi-year low streamflow is the same as Section 3.2, that is, multi-year low streamflow is driven by the multi-year low rainfall. The minimum 3-year rainfall still has the highest correlation with Cor = 0.75–0.88, which is only slightly smaller than the 0.89–0.93 in Table 4.
Table 6 shows results for catchment 422202B located in the northern part of the MDB. The differences between results for the northern 422202B catchment and the southern 405219 catchment include the following: (1) the correlation coefficients in catchment 422202B are generally smaller than those in catchment 405219 (Table 6 vs. Table 5); (2) the coefficient of variance of annual rainfall (CvRain) seems to be an important climate variable for the streamflow at catchment 422202B (Table 6); (3) all climate variables that have a higher correlation with the mean annual streamflow in catchment 422202B are multi-day rainfall totals, such as 95th and 99th percentiles of 10–180 days except the effective rainfall and the coefficient of variance of annual rainfall time series; (4) it is more challenging to simulate the low flow at catchment 422202B because different hydrological models show opposite signs of correlations for the same climate variable (Table 6).

Table 6.
Correlation coefficients between simulated streamflow and climate variables from five hydrological models with fixed annual rainfall for catchment 422202B. Only ten climate variables that have the 10 highest correlations are listed.
The similarities in the results between the two catchments include the following: (1) climate variables, rather than mean annual rainfall, can still influence the streamflow with reasonable correlation coefficients; (2) the number of high-flow days is also dominated by the multi-day rainfall totals, particularly high rainfalls like the 95th and 99th percentiles of 10–180-day rainfall totals; (3) the multi-year drought is also driven by the multi-year minimum rainfall; (4) the effective rainfall (EffRainM) still has the highest or the second-highest correlation with mean annual streamflow, depending on hydrological models; and (5) it is difficult to model as well as interpret the low-flow results.
4. Discussion
4.1. Implications of This Study
A simple correlation analysis and hydrological modelling methods are used in this study to identify the important climate variables explaining a range of streamflow statistics under different hydroclimate conditions across the MDB. The results confirm the previous conclusion that annual rainfall and PET are key variables driving catchment runoff and water resource availability. However, other climatic characteristics can also have a major influence on streamflow. These variables include but are not limited to effective rainfall, rainfall seasonality, multi-day rainfall totals and multi-year rainfall.
The number of high-flow days is dominated by the multi-day rainfall totals, particularly high rainfalls like the 95th and 99th percentiles of 10–180 days. The multi-year streamflow drought is driven by the multi-year minimum rainfall lows.
There are also spatial differences, i.e., the secondary climate drivers vary from catchment to catchment. For example, catchment 405210 and 422202B show different climate variables that have a high correlation with mean annual streamflow. This is consistent with correlation analysis with observed rainfall and streamflow in 133 HRS catchments, where these factors include catchment topography, aridity, runoff coefficient and rainfall seasonality (Table 3).
The results have important implications in developing future climate scenarios to model changes in future runoff, and hydrological modelling has advantages in exploring more streamflow statistics and a wide range of different stochastic inputs with varied rainfall characteristics, holding mean annual rainfall and PET fixed.
4.2. Uncertainties and Limitations
Several caveats exist in this study and could potentially cause uncertainties of presented results and conclusions. They include but are not limited to the following:
(1) Non-climate factors. This current study focuses on climate characteristics only using HRS catchments, whilst the actual physical hydrological processes are more complicated, such as changes in baseflow and groundwater level due to surface–groundwater interactions. For example, Deb [30] demonstrated that endogenous catchment mechanisms, such as depth to groundwater table, baseflow and vegetation, have stronger influences on non-stationary rainfall–runoff relationships than exogenous catchment mechanisms like temperature and PET. Sate et al. [31] found that landscape slope and humidity could explain 75% of the rainfall–streamflow anomaly during the Millennium Drought.
(2) Analysis over calendar year. The northern MDB receives the majority of its annual rainfall in the summer season (December–February). As a result, correlation analysis between calendar annual (January–December) rainfall and streamflow might not be appropriate. Having said that, we also carried out the analysis based on water year (July–June) and the results indicate that it has a weaker correlation (smaller correlation coefficient, as seen in Figure 8) for most of the 133 HRS catchments. Even for the northern MDB catchment, the water year may produce a slightly higher correlations (above the 1:1 line in Figure 8); their differences are not very large. A more flexible seasonal analysis for each individual catchment should produce the best results, but it is hard to compare different catchments.
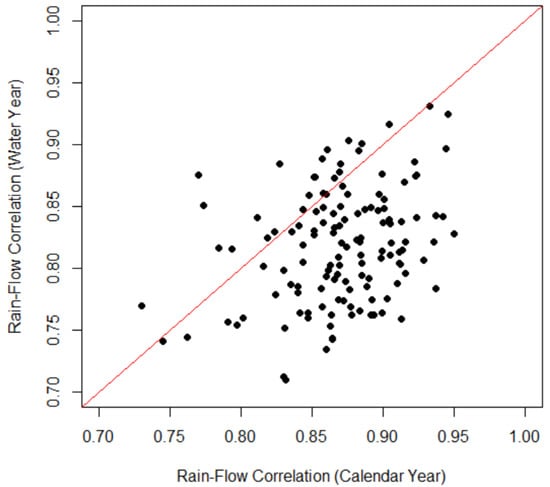
Figure 8.
Comparison of the highest correlation coefficients based on calendar year (x-axis) with those with water year (y-axis) across 133 HRS catchment. Each dot represents one catchment.
(3) Quality of rainfall datasets. This has two aspects: (a) rainfall measurements at weather stations have a certain number of missing values due to many reasons, especially in the early period of manual observations. This is a key reason why the hydrological modelling is limited to the last 40 years. Filling the missing rainfall is a scientific challenge and the main source of uncertainty. The rainfall data can also present the untagged multi-day rainfall accumulations, that is, recording a rainfall event on the weekend to Monday as a result of the rainfall observer being unavailable on-site on the weekend [32]; (b) gridded rainfall data are generated by interpolation from a limited number of weather stations, which could lead to uncertainties due to interpolation algorithms and station networks [33].
(4) Quality of streamflow datasets. The streamflow data used for this study come from HRS catchments, which are usually well-maintained stations with long and high-quality streamflow observations, lending themselves to studies like this. However, data accuracy could still be a concern in some specific catchments. For example, there are some observed daily streamflow being marked with a quality code of “poor data” and “unreliable data”, and some impacts of land use and farm dams have not been identified. It is the main reason why some catchments show very weak correlations even with the best climate variables (Figure 4).
(5) Independence of climate variables. The rainfall and PET statistics (Table 2) used in this analysis are not independent. Many of them are indeed highly correlated with each other (especially those statistics in the same group), as well as highly corelated with annual rainfall. It is the main reason that they produce similar correlation with streamflow statistics (Figure 4, Table 4 and Table 5).
(6) The correlation coefficient itself. The fact that one climate variable does not have a high correlation with streamflow does not mean it is not important for runoff generation, especially as a secondary driver. For example, the MeWS itself is not one of the highly correlated climate variables with streamflow, but its combination with other climate variables can explain the non-stationary rainfall–streamflow relationship [4]. It implies that this method might not fully capture more complex, nonlinear, or combinatorial relationships between climate variables and streamflow.
5. Conclusions
There are two parts to this paper which assessed the influence of climate characteristics on streamflow in the Murray–Darling Basin. The first part explored the correlation between annual streamflow and annual climate characteristics in the observed historical climate and streamflow series in 133 catchments in the Basin. The results show that annual rainfall can explain a high proportion of the variance in the annual streamflow with correlation greater than 0.8 in three quarters of the catchments. The correlations are highest in wet catchments with high rainfall, high aridity index and high runoff coefficient. The correlation is generally higher when rainfall is considered together with PET, where effective rainfall, defined as cumulative positive difference between daily or monthly rainfall minus PET, is the variable showing the higher correlation with annual streamflow in more than half of the catchments. The correlation between annual streamflow and other rainfall characteristics like seasonal rainfall, multi-day rainfall totals and total rainfall above daily rainfall thresholds are also relatively high, but these statistics are also correlated to the annual rainfall. As such, annual rainfall and effective rainfall, by themselves, describe most of the variance in the annual streamflow that can be explained by the climate data.
The second part of the paper explored the influence of changes in long-term average climate inputs to long-term average streamflow characteristics modelled by several rainfall–runoff models. The results show that changes in the modelled mean annual streamflow, and most other streamflow characteristics, are driven mainly by changes in mean annual rainfall and PET. The change in mean annual streamflow is also strongly correlated with many other rainfall characteristics, like seasonal rainfall, multi-day rainfall totals, and wet spell length, but these characteristics are also already strongly correlated with mean annual rainfall. High-flow characteristics are also influenced by high multi-day rainfall totals in addition to mean annual rainfall, particularly in the drier catchments. Multi-year hydrological droughts are also influenced by multi-year low rainfall and annual rainfall variability.
These findings are useful to identify the critical climate characteristics in explaining the nonstationary rainfall-streamflow relationship and in assessing the impacts of climate change and variability on regional water availability and accordingly having practical applications for water management. They could be served as a reference for developing next-generation hydrological models that can deal with non-stationarity under changing hydroclimate conditions, therefore better predict streamflow under a changing climate.
Author Contributions
Conceptualisation, G.F., D.A.P. and F.H.S.C.; methodology, G.F., D.A.P. and F.H.S.C.; software, G.F. and Z.K.; validation, G.F. and Z.K.; formal analysis, G.F. and D.A.P.; investigation, G.F., D.A.P., F.H.S.C., Z.K. and H.Z.; data curation, G.F., Z.K. and H.Z.; writing—original draft preparation, G.F.; writing—review and editing, G.F., D.A.P., F.H.S.C., Z.K. and H.Z.; visualisation, G.F.; project administration, G.F., D.A.P. and F.H.S.C.; funding acquisition, D.A.P. and F.H.S.C. All authors have read and agreed to the published version of the manuscript.
Funding
This research was funded by the Murray-Darling Basin Authority through the Murray Darling Basin Sustainable Yield 2 (MDBSY2) project.
Data Availability Statement
Hydrological reference stations (HRS) streamflow data is available at http://www.bom.gov.au/water/hrs/about.shtml (accessed on 8 October 2025) and Silo climate data at https://www.longpaddock.qld.gov.au/silo/ (accessed on 8 October 2025).
Acknowledgments
We would like to thank two anonymous reviewers for their invaluable comments and constructive suggestions used to improve the quality of the manuscript.
Conflicts of Interest
The authors declare no conflicts of interest.
Abbreviations
The following abbreviations are used in this manuscript:
| MDB | Murray–Darling basin |
| HRS | Hydrological reference station |
| PET | Potential evapotranspiration |
| SCL | Stochastic climate library |
References
- Koutsoyiannis, D.; Montanari, A. Negligent killing of scientific concepts: The stationarity case. Hydrol. Sci. J. 2015, 60, 1174–1183. [Google Scholar] [CrossRef]
- Milly, P.C.D. Climate change—Stationarity is dead: Whither water management? Science 2008, 319, 573–574. [Google Scholar] [CrossRef]
- Fowler, K.; Peel, M.; Saft, M.; Peterson, T.J.; Western, A.; Band, L.; Petheram, C.; Dharmadi, S.; Tan, K.S.; Zhang, L.; et al. Explaining changes in rainfall–runoff relationships during and after Australia’s Millennium Drought: A community perspective. Hydrol. Earth Syst. Sci. 2022, 26, 6073–6120. [Google Scholar] [CrossRef]
- Fu, G.; Chiew, F.H.; Zheng, H.; Robertson, D.E.; Potter, N.J.; Teng, J.; Post, D.A.; Charles, S.P.; Zhang, L. Statistical analysis of attributions of climatic characteristics to nonstationary rainfall-streamflow relationship. J. Hydrol. 2021, 603, 127017. [Google Scholar] [CrossRef]
- Australian Bureau of Meteorology. Hydrologic Reference Stations Update 2020. 2020. Available online: http://www.bom.gov.au/water/hrs/update_2020.shtml (accessed on 23 November 2025).
- Zhang, X.S.; Amirthanathan, G.E.; Bari, M.A.; Laugesen, R.M.; Shin, D.; Kent, D.M.; MacDonald, A.M.; Turner, M.E.; Tuteja, N.K. How streamflow has changed across Australia since the 1950s: Evidence from the network of hydrologic reference stations. Hydrol. Earth Syst. Sci. 2016, 20, 3947–3965. [Google Scholar] [CrossRef]
- Twinomuhangi, M.B.; Bamutaze, Y.; Kabenge, I.; Wanyama, J.; Kizza, M.; Gabiri, G.; Egli, P.E. Analysis of stationary and non-stationary hydrological extremes under a changing environment: A systematic review. HydroResearch 2025, 8, 332–350. [Google Scholar] [CrossRef]
- Shrestha, R.R.; Najafi, M.R. Special Issue: Hydrological Extremes in a Warming Climate: Nonstationarity, Uncertainties and Impacts. Water 2022, 14, 1658. [Google Scholar] [CrossRef]
- Department of Environment, Land, Water and Planning (DELWP); Bureau of Meteorology (BoM); Commonwealth Scientific and Industrial Research Organisation (CSIRO); The University of Melbourne. Victoria’s Water in a Changing Climate; DELWP: Melbourne, VIC, Australia; BoM: Melbourne, VIC, Australia; CSIRO: Canberra, ACT, Australia; The University of Melbourne: Parkville, VIC, Australia, 2020; p. 97. [Google Scholar]
- Peterson, T.J.; Saft, M.; Peel, M.C.; John, A. Watersheds may not recover from drought. Science 2021, 372, 745–749. [Google Scholar] [CrossRef]
- Saft, M.; Western, A.W.; Zhang, L.; Peel, M.C.; Potter, N.J. The influence of multiyear drought on the annual rainfall-runoff relationship: An Australian perspective. Water Resour. Res. 2015, 51, 2444–2463. [Google Scholar] [CrossRef]
- Hakala, K.; Addor, N.; Teutschbein, C.; Vis, M.; Dakhlaoui, H.; Seibert, J. Hydrological Modeling of Climate Change Impacts. In Encyclopedia of Water: Science, Technology, and Society; Maurice, P., Ed.; Wiley & Sons: Hoboken, NJ, USA, 2019. [Google Scholar]
- Tian, W.-C.; Wang, W.-C.; Wang, Y.-Y.; Shi, C.-C.; Ma, Q. Accurate runoff prediction in nonlinear and nonstationary environments using a novel hybrid model. J. Hydrol. 2025, 662, 133949. [Google Scholar] [CrossRef]
- Yu, J.; Fu, G.; Cai, W.; Cowan, T. Impacts of precipitation and temperature changes on annual streamflow in the Murray-Darling Basin. Water Int. 2010, 35, 313–323. [Google Scholar] [CrossRef]
- Peel, M.C.; McMahon, T.A.; Finlayson, B.L. Continental differences in the variability of annual runoff-update and reassessment. J. Hydrol. 2004, 295, 185–197. [Google Scholar] [CrossRef]
- Srikanthan, R.; McMahon, T.A. Automatic evaluation of stochastically generated rainfall data. Australas. J. Water Resour. 2015, 8, 195–201. [Google Scholar] [CrossRef]
- Perrin, C.; Michel, C.; Andréassian, V. Improvement of a parsimonious model for streamflow simulation. J. Hydrol. 2003, 279, 275–289. [Google Scholar] [CrossRef]
- Moore, R.J. The PDM rainfall-runoff model. Hydrol. Earth Syst. Sci. 2007, 11, 483–499. [Google Scholar] [CrossRef]
- Burnash, R.J.; Ferral, R.L.; McGuire, R.A. A Generalized Streamflow Simulation System, Conceptual Modeling for Digital Computers; U.S. Department of Commerce, National Weather Service: Silver Spring, MD, USA; State of California, Department of Water Resources: Sacramento, CA, USA, 1973; p. 204. [Google Scholar]
- Chiew, F.; Peel, M.; Western, A. Application and Testing of the Simple Rainfall-Runoff Model SIMHYD. In Mathematical Models of Small Watershed Hydrology and Applications; Singh, V., Frevert, D., Eds.; Water Resources Publication: Denver, CO, USA, 2002; pp. 335–367. [Google Scholar]
- Gan, T.Y.; Burges, S.J. Assessment of soil-based and calibrated parameters of the Sacramento model and parameter transferability. J. Hydrol. 2006, 320, 117–131. [Google Scholar] [CrossRef]
- Oudin, L.; Andréassian, V.; Perrin, C.; Michel, C.; Le Moine, N. Spatial proximity, physical similarity, regression and ungaged catchments: A comparison of regionalization approaches based on 913 French catchments. Water Resour. Res. 2008, 44, W03413. [Google Scholar] [CrossRef]
- Tuteja, N.K.; Vaze, J.; Teng, J.; Mutendeudzi, M. Partitioning the effects of pine plantations and climate variability on runoff from a large catchment in southeastern Australia. Water Resour. Res. 2007, 43, W08415. [Google Scholar] [CrossRef]
- Vaze, J.; Barnett, P.; Beale, G.; Dawes, W.; Evans, R.; Tuteja, N.K.; Murphy, B.; Geeves, G.; Miller, M. Modelling the effects of land-use change on water and salt delivery from a catchment affected by dryland salinity in south-east Australia. Hydrol. Process. 2004, 18, 1613–1637. [Google Scholar] [CrossRef]
- Viney, N.; Vaze, J.; Crosbie, R.; Wang, B.; Dawes, W.; Frost, A. AWRA-L v5.0: Technical Description of Model Algorithms and Inputs; AWRA-L v5.0 technical report; CSIRO: Canberra, ACT, Australia, 2015; p. 78. [Google Scholar]
- Jeffrey, S.J.; Carter, J.O.; Moodie, K.B.; Beswick, A.R. Using spatial interpolation to construct a comprehensive archive of Australian climate data. Environ. Model. Softw. 2001, 16, 309–330. [Google Scholar] [CrossRef]
- Schaake, J.C. From Climate to Flow in Climate Change and U.S. Water Resources; Waggoner, P.E., Ed.; John Wiley: New York, NY, USA, 1990; pp. 177–206. [Google Scholar]
- Sankarasubramanian, A.; Vogel, R.M. Hydroclimatology of the continental United States. Geophys. Res. Lett. 2003, 30, 1363. [Google Scholar] [CrossRef]
- Zhang, X.; Dong, Q.; Cheng, L.; Xia, J. A Budyko-based framework for quantifying the impacts of aridity index and other factors on annual runoff. J. Hydrol. 2019, 579, 124224. [Google Scholar] [CrossRef]
- Deb, P.; Kiem, A.S.; Willgoose, G. Mechanisms influencing non-stationarity in rainfall-runoff relationships in southeast Australia. J. Hydrol. 2019, 571, 749–764. [Google Scholar] [CrossRef]
- Saft, M.; Peel, M.C.; Western, A.W.; Zhang, L. Predicting shifts in rainfall-runoff partitioning during multiyear drought: Roles of dry period and catchment characteristics. Water Resour. Res. 2016, 52, 9290–9305. [Google Scholar] [CrossRef]
- Viney, N.R.; Bates, B.C. It never rains on Sunday: The prevalence and implications of untagged multi-day rainfall accumulations in the Australian high quality data set. Int. J. Climatol. 2004, 24, 1171–1192. [Google Scholar] [CrossRef]
- Fu, G.; Barron, O.; Charles, S.P.; Donn, M.J.; Van Niel, T.G.; Hodgson, G. Uncertainty of Gridded Precipitation at Local and Continent Scales: A Direct Comparison of Rainfall from SILO and AWAP in Australia. Asia-Pac. J. Atmos. Sci. 2022, 58, 471–488. [Google Scholar] [CrossRef]
Disclaimer/Publisher’s Note: The statements, opinions and data contained in all publications are solely those of the individual author(s) and contributor(s) and not of MDPI and/or the editor(s). MDPI and/or the editor(s) disclaim responsibility for any injury to people or property resulting from any ideas, methods, instructions or products referred to in the content. |
© 2025 by the authors. Licensee MDPI, Basel, Switzerland. This article is an open access article distributed under the terms and conditions of the Creative Commons Attribution (CC BY) license (https://creativecommons.org/licenses/by/4.0/).