Article

Site-Specific Net Suspended Sediment Flux and Turbidity–TSM Coupling in a UNESCO Tidal Flat on the Western Coast of Korea: High-Resolution Vertical Observations

1
Korea-Peru Joint Research Center on Ocean Science & Technology for Latin America, Korea Institute of Ocean Science & Technology, Esquina Gamarra y General Valle s/n, Chucuito, Callao 07021, Peru
2
Sea Power Reinforcement Security Research Department, Korea Institute of Ocean Science & Technology, Yeongdo-gu, Busan 49111, Republic of Korea
3
Korea Ocean Satellite Center, Korea Institute of Ocean Science & Technology, Yeongdo-gu, Busan 49111, Republic of Korea
4
External Relations Division, Korea Institute of Ocean Science & Technology, Yeongdo-gu, Busan 49111, Republic of Korea
*
Author to whom correspondence should be addressed.
Water 2025, 17(23), 3361; https://doi.org/10.3390/w17233361
Submission received: 17 October 2025 / Revised: 20 November 2025 / Accepted: 22 November 2025 / Published: 25 November 2025

Abstract

Understanding suspended sediment transport in macrotidal embayments is crucial for assessing water quality, ecosystem function, and long-term morphological stability. This study provides a high-resolution, localized estimate of suspended sediment flux and examines the empirical relationship between turbidity (NTU, nephelometric turbidity unit) and total suspended matter (TSM, mg·L−1) in the main tidal channel of Gomso Bay, a UNESCO-designated tidal flat on the west coast of Korea. A 13 h high-resolution fixed-point observation was conducted during a semi-diurnal tidal cycle using a multi-instrument platform, including an RCM, CTD profiler, tide gauge, and water sampling for gravimetric TSM analysis. Vertical measurements at the surface, mid, and bottom layers, taken every 15–30 min, revealed a strong linear correlation (R2 = 0.94) between turbidity and TSM, empirically validating the use of optical sensors for real-time sediment monitoring under the highly dynamic conditions of Korean west-coast tidal channels. The net suspended sediment transport load was estimated at approximately 5503 kg·m−1, with ebb-dominant residual currents indicating a net seaward sediment flux at the observation site. Residual flows over macrotidal channels are known to vary laterally, with landward fluxes often occurring over shoals. Importantly, the results from this single-station, short-duration observation indicate a predominantly seaward suspended sediment transport during the study period, which should be interpreted as a localized and time-specific estimate rather than a bay-wide characteristic. Nevertheless, these findings provide a baseline for assessing sediment flux and contribute to future applications in digital twin modeling and coastal management. Gomso Bay is part of the UNESCO-designated ‘Getbol, Korean Tidal Flats’, underscoring the global significance of preserving and monitoring this dynamic coastal system.

1. Introduction

Tidal flats are among the most dynamic and ecologically valuable coastal environments, acting as crucial interfaces between land and sea. These intertidal systems not only provide essential ecosystem services such as nutrient cycling, carbon storage, and habitat for benthic organisms and migratory birds but also function as natural buffers for coastal erosion and flooding [1,2]. This is particularly evident along the western coast of Korea, where the ‘Getbol, Korean Tidal Flats’ exhibit broad intertidal zones with semi-diurnal macrotidal regimes, fine-grained sediments, and twice-daily cycles of inundation and exposure that strongly regulate sediment resuspension, biogeochemical exchanges, and ecological processes [3,4,5,6]. Understanding hydrodynamic and sediment transport processes in such macrotidal environments is therefore essential for evaluating long-term morphological evolution and coastal management.
Previous research conducted in Gomso Bay has highlighted the complex interplay of tidal currents, sediment resuspension, and geomorphological confinement that governs the dynamics of suspended sediment in this semi-enclosed coastal environment. Researchers reported net seaward transport of near-bed suspended sediments in the main tidal channel, with a reversal of flow during flood tides, transporting finer materials landward into the upper intertidal zones, consistent with previous studies in Gomso Bay [7]. Park et al. identified distinct seasonal variability, with sediment erosion dominating in winter and southward transport prevailing during the summer monsoon period [8]. Stratigraphic investigations by Choi et al. revealed long-term tidal channel infilling and inclined heterolithic stratification (IHS), indicating persistent tidal control over sedimentation processes [9].
The impact of episodic high-energy events was also noted by Lee et al. [10], who observed inland chenier migration during typhoon events, reshaping sediment distribution patterns across the tidal flat. Comparative studies in adjacent embayments such as Garolim Bay by Jo and Lee emphasised the role of tidal asymmetry and wind-wave interaction, mechanisms likely applicable to Gomso Bay as well [11]. Furthermore, post-construction surveys by Lee and Ryu and Lee et al. suggested that the Saemangeum dyke project may have induced regional changes in hydrodynamics and sediment routing within Gomso Bay [12,13]. The construction of the Saemangeum dyke has resulted in substantial alterations to tidal flat morphology and sediment distribution in nearby estuarine complexes.
Broad-scale geological surveys and foundational hydrodynamic assessments by the National Geographic Institute (NGI, Republic of Korea) [14] provided early evidence of depth-dependent current structures and sediment flux gradients within the tidal channel. More recently, Woo et al. underscored the importance of atmospheric forcing in modifying surface sediment transport pathways in Korean tidal systems [15]. While these studies have significantly improved our understanding of sediment processes in Gomso Bay, few have quantified net suspended sediment fluxes using high-resolution, depth-resolved field observations that combine turbidity and total suspended matter (TSM, mg·L−1), where TSM is defined as the gravimetrically measured concentration of suspended particulate material in seawater, including both inorganic sediments and organic detrital particles and current velocity measurements under a full tidal cycle. This study addresses that gap through a focused, instrument-based investigation of vertical sediment flux characteristics in the main tidal channel of Gomso Bay.
Rapid sediment transport can be induced by anthropogenic activities, such as port construction, changes in the structure of marine ecosystems, and sea level rise caused by global warming, all of which significantly affect coastal landforms, including tidal flats [16]. To assess these geomorphological changes, a variety of observational methods have been employed. In the studies by Ryu [17] and Park et al. [8], sedimentation plates were embedded in the study area to measure the rates of sediment accumulation and erosion caused by sediment transport in tidal flats and sandbars. Observations using sedimentation plates have primarily been conducted at specific points or within relatively small-scale study areas.
Understanding sediment dynamics in tidal flats is crucial for assessing their long-term morphological evolution and for informing coastal management strategies under the pressures of human activities and climate change [18]. This transition toward hyper-turbid conditions in Gomso Bay is likely associated with recent morphological changes, such as channel deepening, which may have altered tidal dynamics and enhanced sediment retention. Such processes have been previously described as part of a positive feedback mechanism leading to the development of estuarine turbidity maxima (ETM) [19]. One of the key parameters in assessing such dynamics is the suspended sediment flux, which is governed by tidal currents, stratification, and shear stress, and often shows significant spatiotemporal variability across estuarine and bay environments [20,21].
Recent advances in situ observational techniques, including high-frequency optical turbidity sensors and current meters, have improved the temporal resolution and accuracy of suspended sediment transport estimates. However, converting turbidity (NTU, nephelometric turbidity unit) to TSM still requires site-specific calibration due to variability in particle size, composition, and optical properties [22,23]. Despite this, many estuarine studies have demonstrated strong correlations between turbidity and TSM, highlighting the potential for continuous, cost-effective monitoring systems. Recent advances in situ observational techniques, particularly high-frequency optical turbidity sensors and current meters, have significantly improved the temporal resolution of suspended sediment transport measurements. However, converting NTU to TSM still necessitates site-specific calibration due to variability in particle size, composition, and optical response [24,25].
Given these geomorphological and hydrodynamic settings, the main tidal channel plays a central role in sediment transport within Gomso Bay. Although previous studies have described general sedimentary characteristics of the bay [26], detailed flux-based investigations that integrate high-resolution turbidity measurements with direct TSM analysis remain limited, and the influence of tidal phase, stratification, and vertical current structure on suspended-sediment transport is still insufficiently constrained [27]. To address these gaps, this study conducted a 13 h fixed-point observation using optical turbidity sensing, current profiling, and gravimetric TSM sampling to quantify net suspended-sediment transport and empirically evaluate the turbidity–TSM relationship. This integrated approach provides a clear methodological framework and yields short-term, site-specific estimates of sediment flux, offering essential baseline information for sediment monitoring, digital-twin applications, and coastal management in Gomso Bay.

2. Materials and Methods

This section describes the characteristics of the study area, the fixed-point field observation design, and the instrumentation and TSM analytical procedures applied in this study.

2.1. Study Area

The Gomso Bay tidal flat, located in Gochang-gun, Jeollabuk-do, on the west coast of Korea, is characterized as a semi-enclosed bay, with hydrodynamic conditions predominantly influenced by offshore waters. A small river, Jujincheon, flows into the southeastern inner bay, supplying a limited amount of freshwater during both dry and flood seasons. The intertidal flat is primarily distributed along the southern shoreline, with a maximum width of approximately 6 km. A major tidal channel is known to exist in the northern part of the tidal flat, reaching up to 900 m in width and 15 m in depth [28]. Gomso Bay extends approximately 7–9 km from north to south and about 20 km from east to west. The average tidal range is 4.33 m, with recorded current velocities of approximately 1.15 m/s during flood tide and 1.50 m/s during ebb tide [29].

2.2. Investigation on Research Vessel Eun-A

In this study, TSM is used as the quantitative gravimetric measurement of suspended particulate matter (SPM) collected from the water column. To estimate the flux of SPM in and out of the main tidal channel of Gomso Bay and investigate the relationship between TSM and turbidity (NTU), a 13 h fixed-point field survey was conducted using a stationary vessel on 22 October 2023 (Sunday), from 05:00 to 18:00 local time. The survey vessel, Eun-A (4.83 tons), was anchored at the fixed station located at Lat. 35°34.5650′ N, Lon. 126°32.3840′ E (WGS-84 datum) in Figure 1. During the survey period, water depth at the station varied from approximately 4.2 to 7.0 m. Water samples were collected every 15–30 min at three different depths—surface, middle, and bottom—along with simultaneous in situ measurements using various scientific instruments (Figure 2a,b). The equipment deployed included the SEAGUARD® Recording Current Meter (RCM)–SWTM (Aanderaa Data Instruments, Bergen, Norway), YSI® ProDSS™ (Xylem/YSI, Yellow Springs, OH, USA) Multiparameter Digital Water Quality Meter, RBR Solo3 (RBR Ltd., Ottawa, ON, Canada) series tide gauge, digital illuminance meter (Testo SE & Co. KGaA, Titisee-Neustadt, Germany), and United Scientific SCDSK1 plastic Secchi disk (United Scientific Supplies, Waukegan, IL, USA). Notably, the turbidity sensor of the YSI® ProDSS employs a nephelometric optical method with a 90° scatter angle, offering accuracy specifications of ±2% of the reading (0–999 NTU) and ±5% of the reading (1000–4000 NTU). For the measurement of TSM from collected seawater samples, filtration was performed using Whatman® (Cytiva, Marlborough, MA, USA) 0.4 μm Nuclepore™ Track-Etch Membrane filters (Product No. 10417112). A volume of 300 mL of seawater was filtered for each sample.

2.3. Instrumentation and TSM Analysis

The field measurements were conducted using the research vessel Eun-A, anchored at both bow and stern, for the fixed-point observation. The RCM was configured to collect data at 30 min intervals. For each target depth layer, current data were recorded for 3 min at 20 s sampling intervals (using 20 s averaged values). A vertical profiling routine was followed: surface layer (3 min) → transition (1 min) → middle layer (3 min) → transition (1 min) → bottom layer (3 min) (Figure 2a). The YSI® ProDSS™ multiparameter CTD was operated at a 2 s sampling interval and deployed every 15–30 min for full-depth profiling. To ensure measurement accuracy, a 5 min stabilization period was allowed at the surface before vertical casts. For TSM analysis, seawater was collected at 1 h intervals from the surface, middle, and bottom layers using an onboard submersible pump. For reference purposes, water transparency was measured using a Secchi disk six times between 13:00 and 15:00, during peak solar elevation. Incident light intensity (irradiance) was also measured every 30 min between 08:00 and 16:30 to assess the daylight conditions on the survey day. A volume of 300 mL was filtered immediately on deck through Whatman® 0.4 μm Nuclepore™ Track-Etch Membrane filters. The membrane filters were pre-dried at 60 °C in the onboard laboratory prior to filtration and post-dried at 60 °C in the laboratory after the field survey for precise weight measurements. A tide gauge was deployed on the seafloor directly beneath the anchored vessel to record continuous tidal elevation changes at 1 s intervals.

3. Results

The results of the 13 h fixed-point observation are presented below, with particular emphasis on tidal variation, hydro-physical parameters, and sediment-related properties across the water column.

3.1. Tidal Level and Light Intensity Time Series

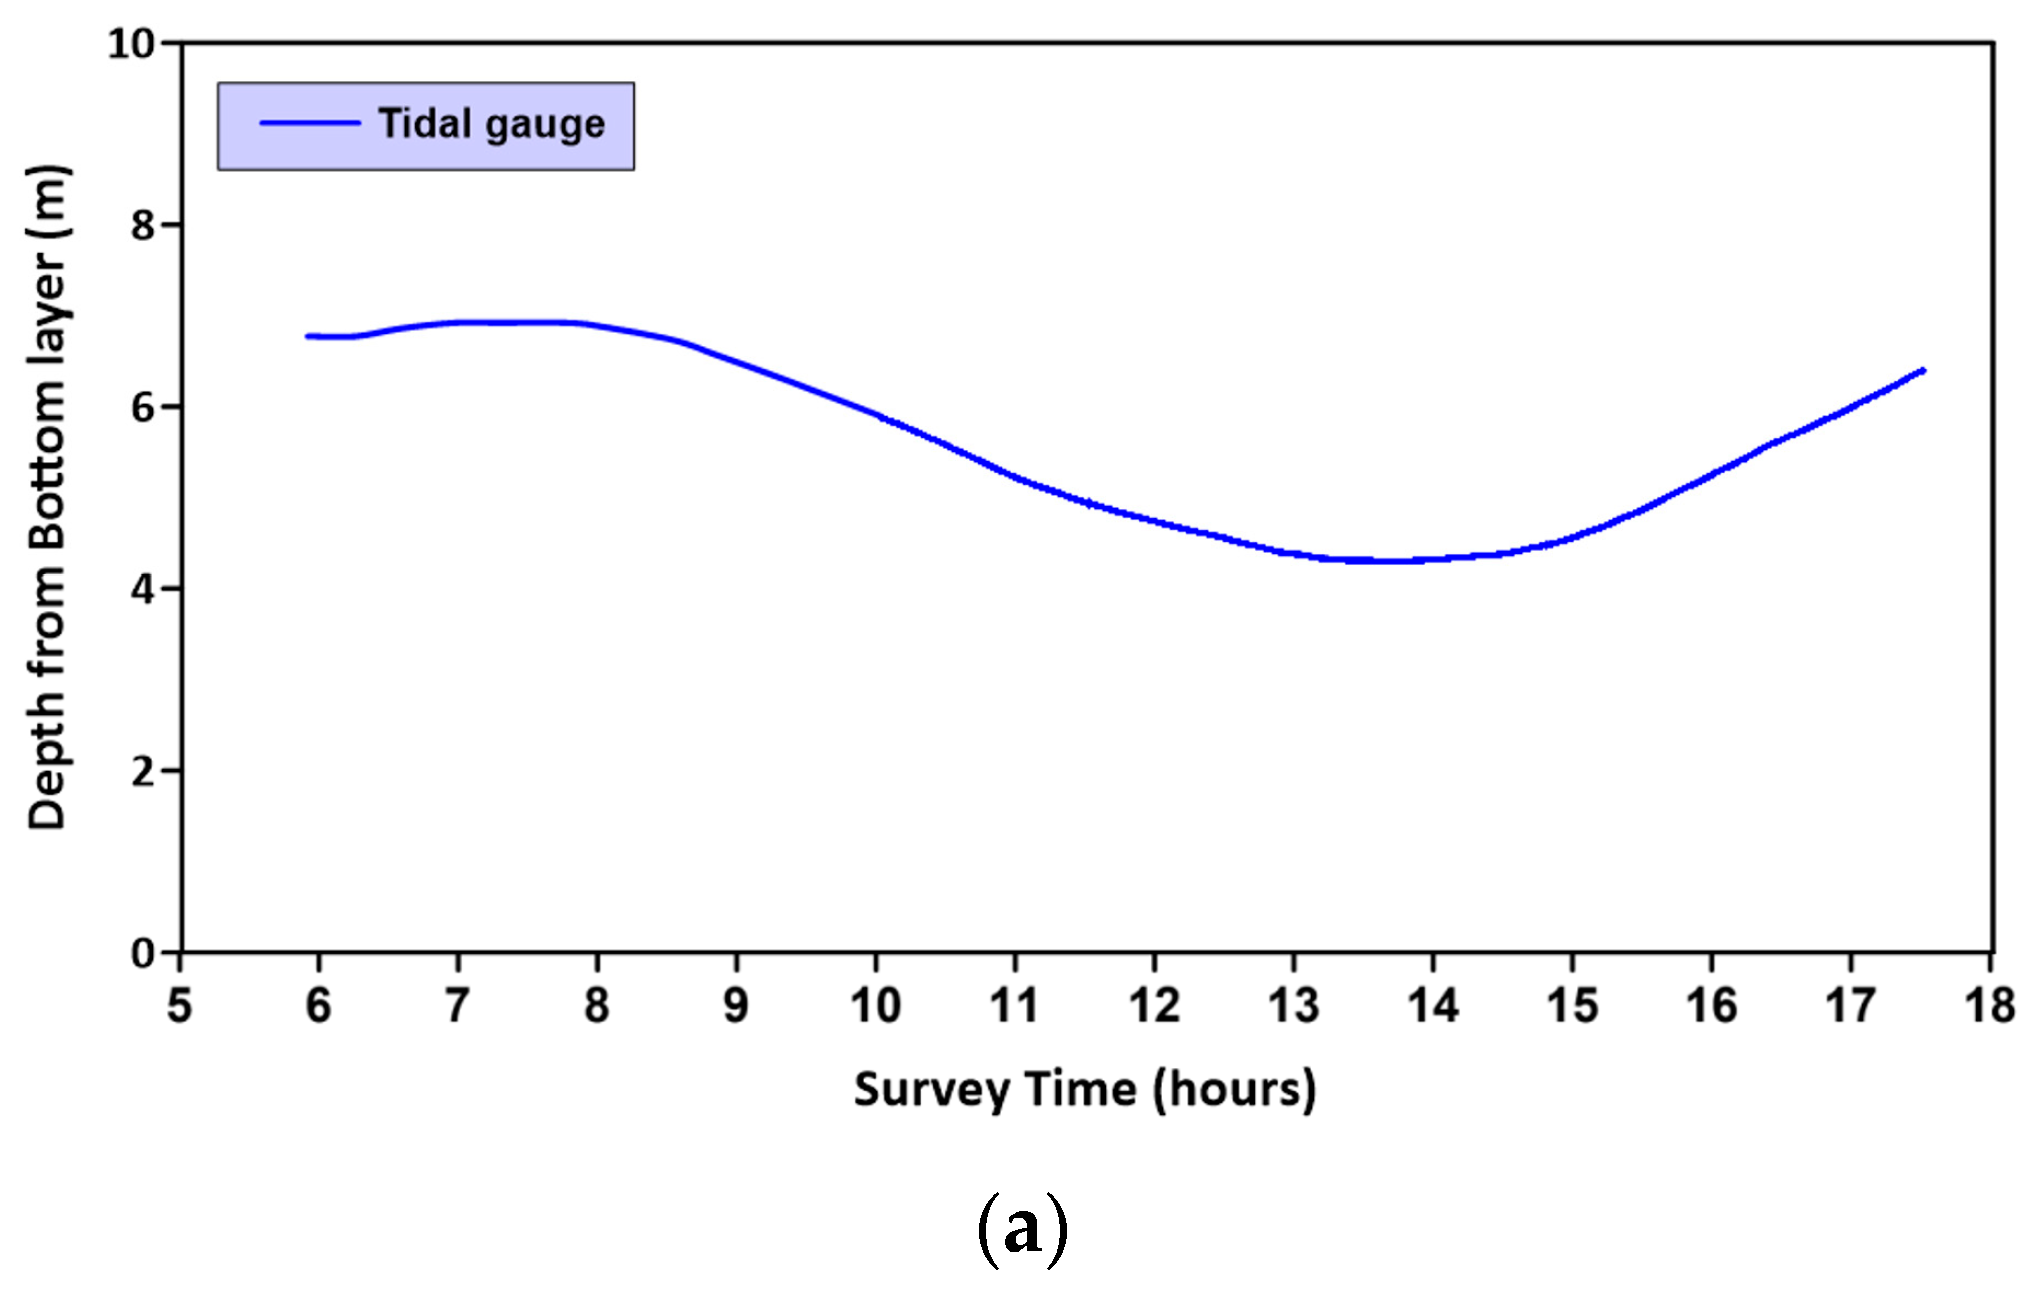
During the observation period, tidal levels ranged from 4.2 to 7.0 m. The water level decreased gradually to approximately 4.2 m by 13:30, followed by a slow increase, mirroring the ebb tide slope shown in Figure 2c. Incident light intensity, measured from 08:00 to 16:30, showed an average value of 38,001 lux, with a range from 11,870 to 58,690 lux. During this time, ambient light intensity was approximately 37,860 lux. Secchi disk transparency measurements conducted between 13:00 and 15:00 (n = 6) indicated an average water clarity of 98.5 cm, with a range of 88 to 120 cm. The corresponding light intensity during this period was approximately 38,860 lux in Figure 3.

3.2. Characteristics of Turbidity, TSM, and Other Parameters

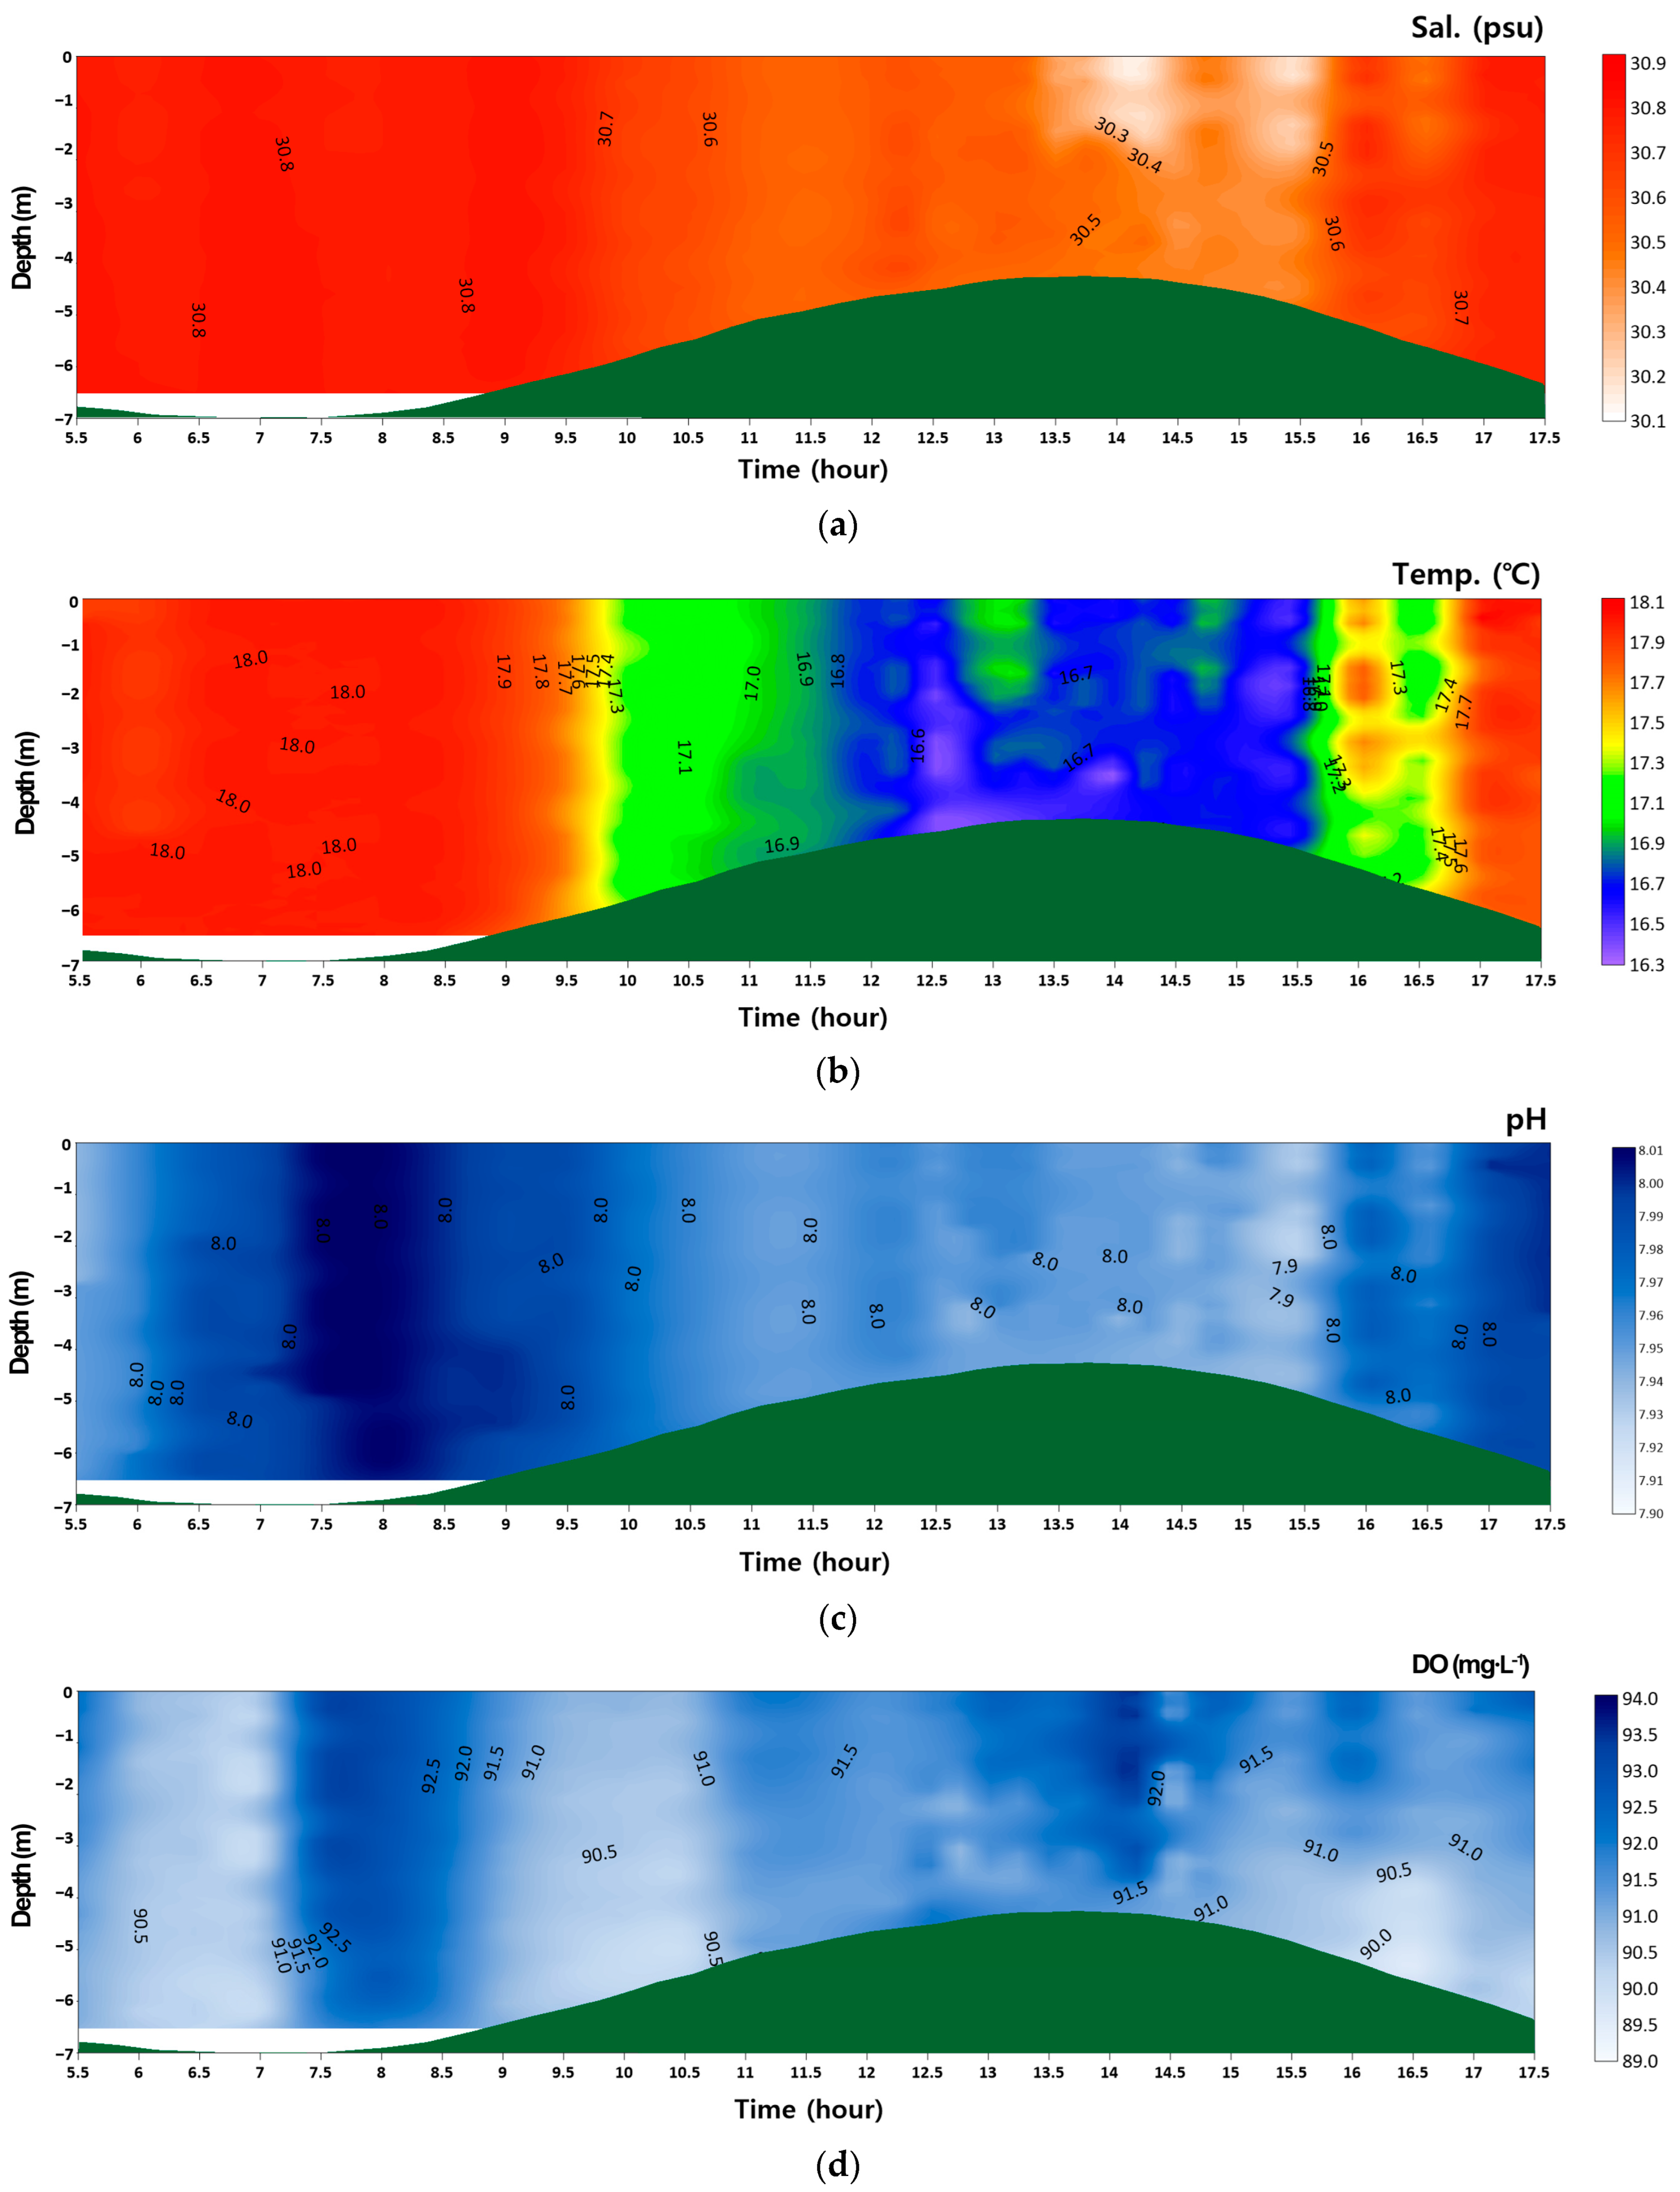
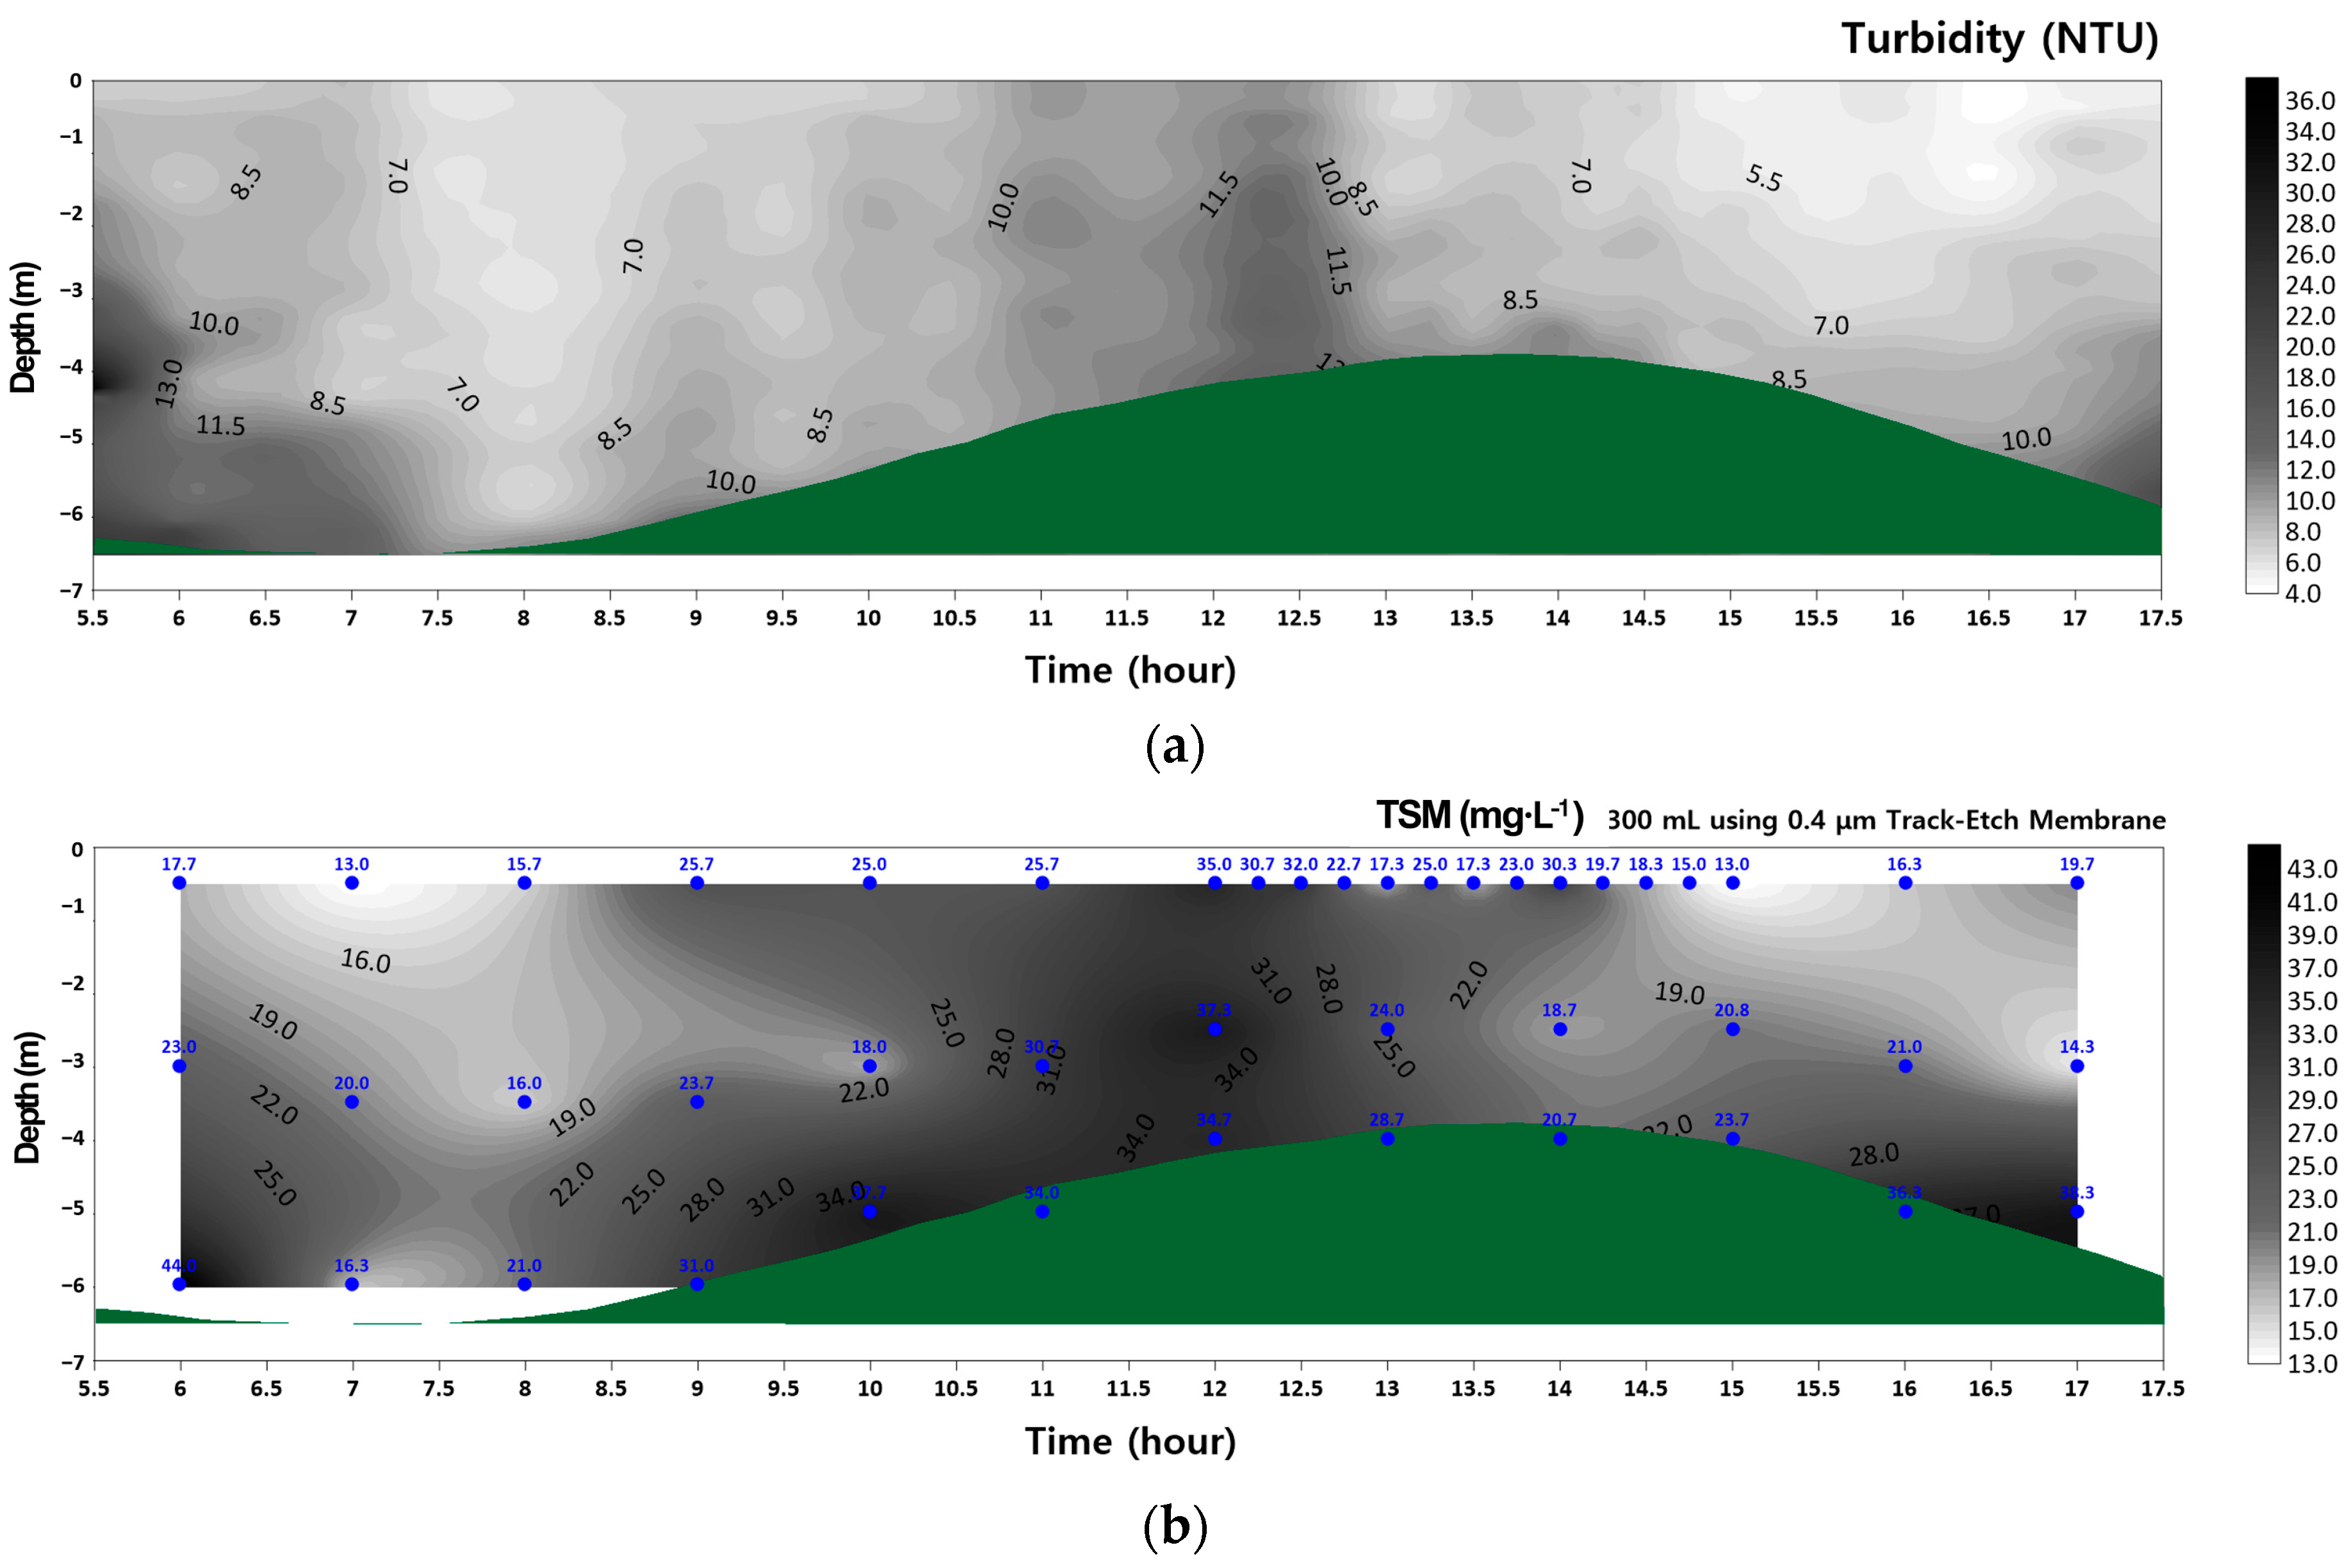
Salinity measurements across the surface, middle, and bottom layers showed an average of 30.7 psu, with a range of 30.1 to 30.8 psu. At 07:00, salinity was uniform across all depths (surface: 30.8 psu; middle: 30.8 psu; bottom: 30.8 psu). As the ebb tide progressed, salinity slightly decreased by 14:00 to 30.2 psu (surface), 30.4 psu (middle), and 30.5 psu (bottom) (Figure 4a). The water temperature averaged 17.4 °C (range: 16.3–18.1 °C) across the depth layers. However, a significant drop was observed during the ebb tide, with temperatures decreasing to 16.6 °C (surface), 16.7 °C (middle), and 16.3 °C (bottom) by 14:00 (Figure 4b). Vertical profiles of pH, illustrating chemical stability and minor fluctuations associated with tidal phases, and dissolved oxygen (DO) concentration profiles over time, showing depth-specific variability and potential correlations with turbidity and sediment suspension events, were measured (Figure 4c,d). Turbidity showed an average of 8.9 NTU (range: 4.0–36.4 NTU) across all depth layers. At high tide (07:00), surface turbidity (0.4–0.6 m depth) averaged 8.0 NTU (range: 7.8–8.2 NTU). As the tide ebbed, turbidity increased, peaking at 13.2 NTU (range: 13.1–13.3 NTU) in the middle layer (1.9–2.8 m depth) around 12:30 (Figure 5a). A total of 45 TSM samples (n = 45) were analysed. Water samples (300 mL) were filtered onboard using 0.4 μm Whatman® Nuclepore™ Track-Etch Membrane filters, which were pre-dried at 60 °C in the laboratory. After filtration, the membranes were again dried at 60 °C for mass calculation. TSM concentrations averaged 24.3 mg/L (range: 13.0–44.0 mg/L) across all depths. For reference, at high tide (07:00), surface TSM at 0.5 m depth measured 13.0 mg/L (Figure 5b).

3.3. Time Series Characteristics of Turbidity (NTU) and TSM Correlation

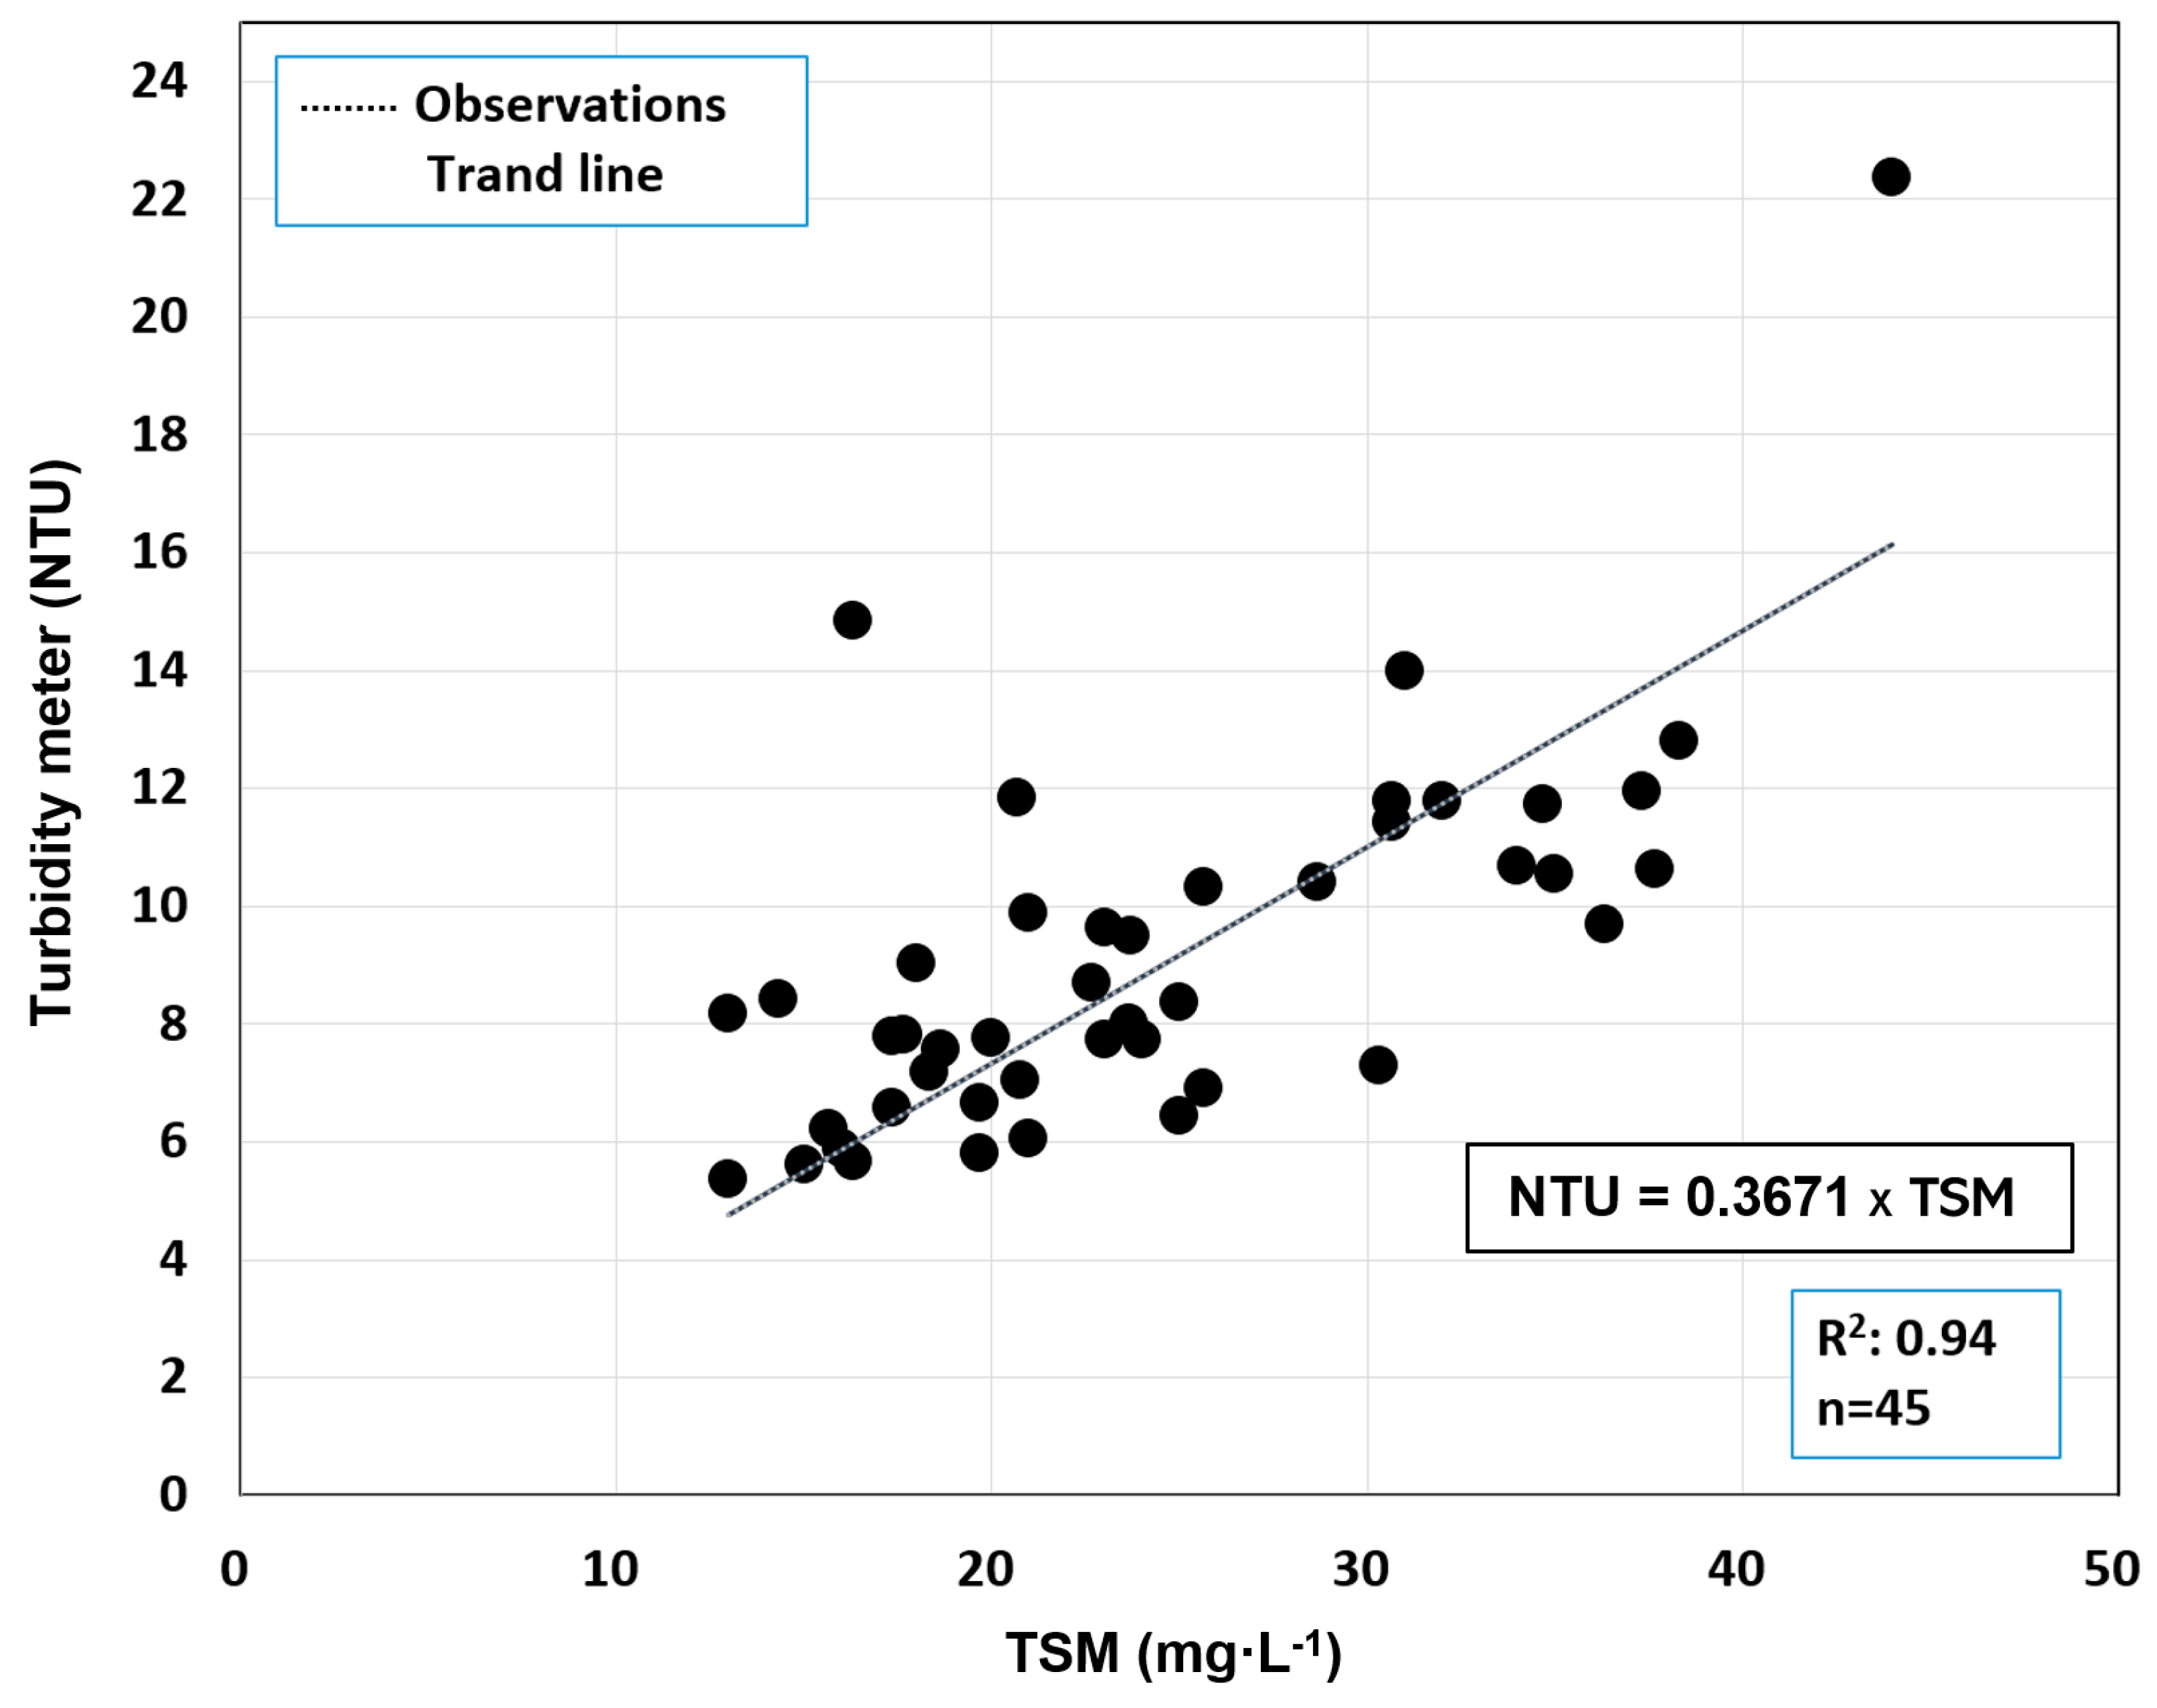
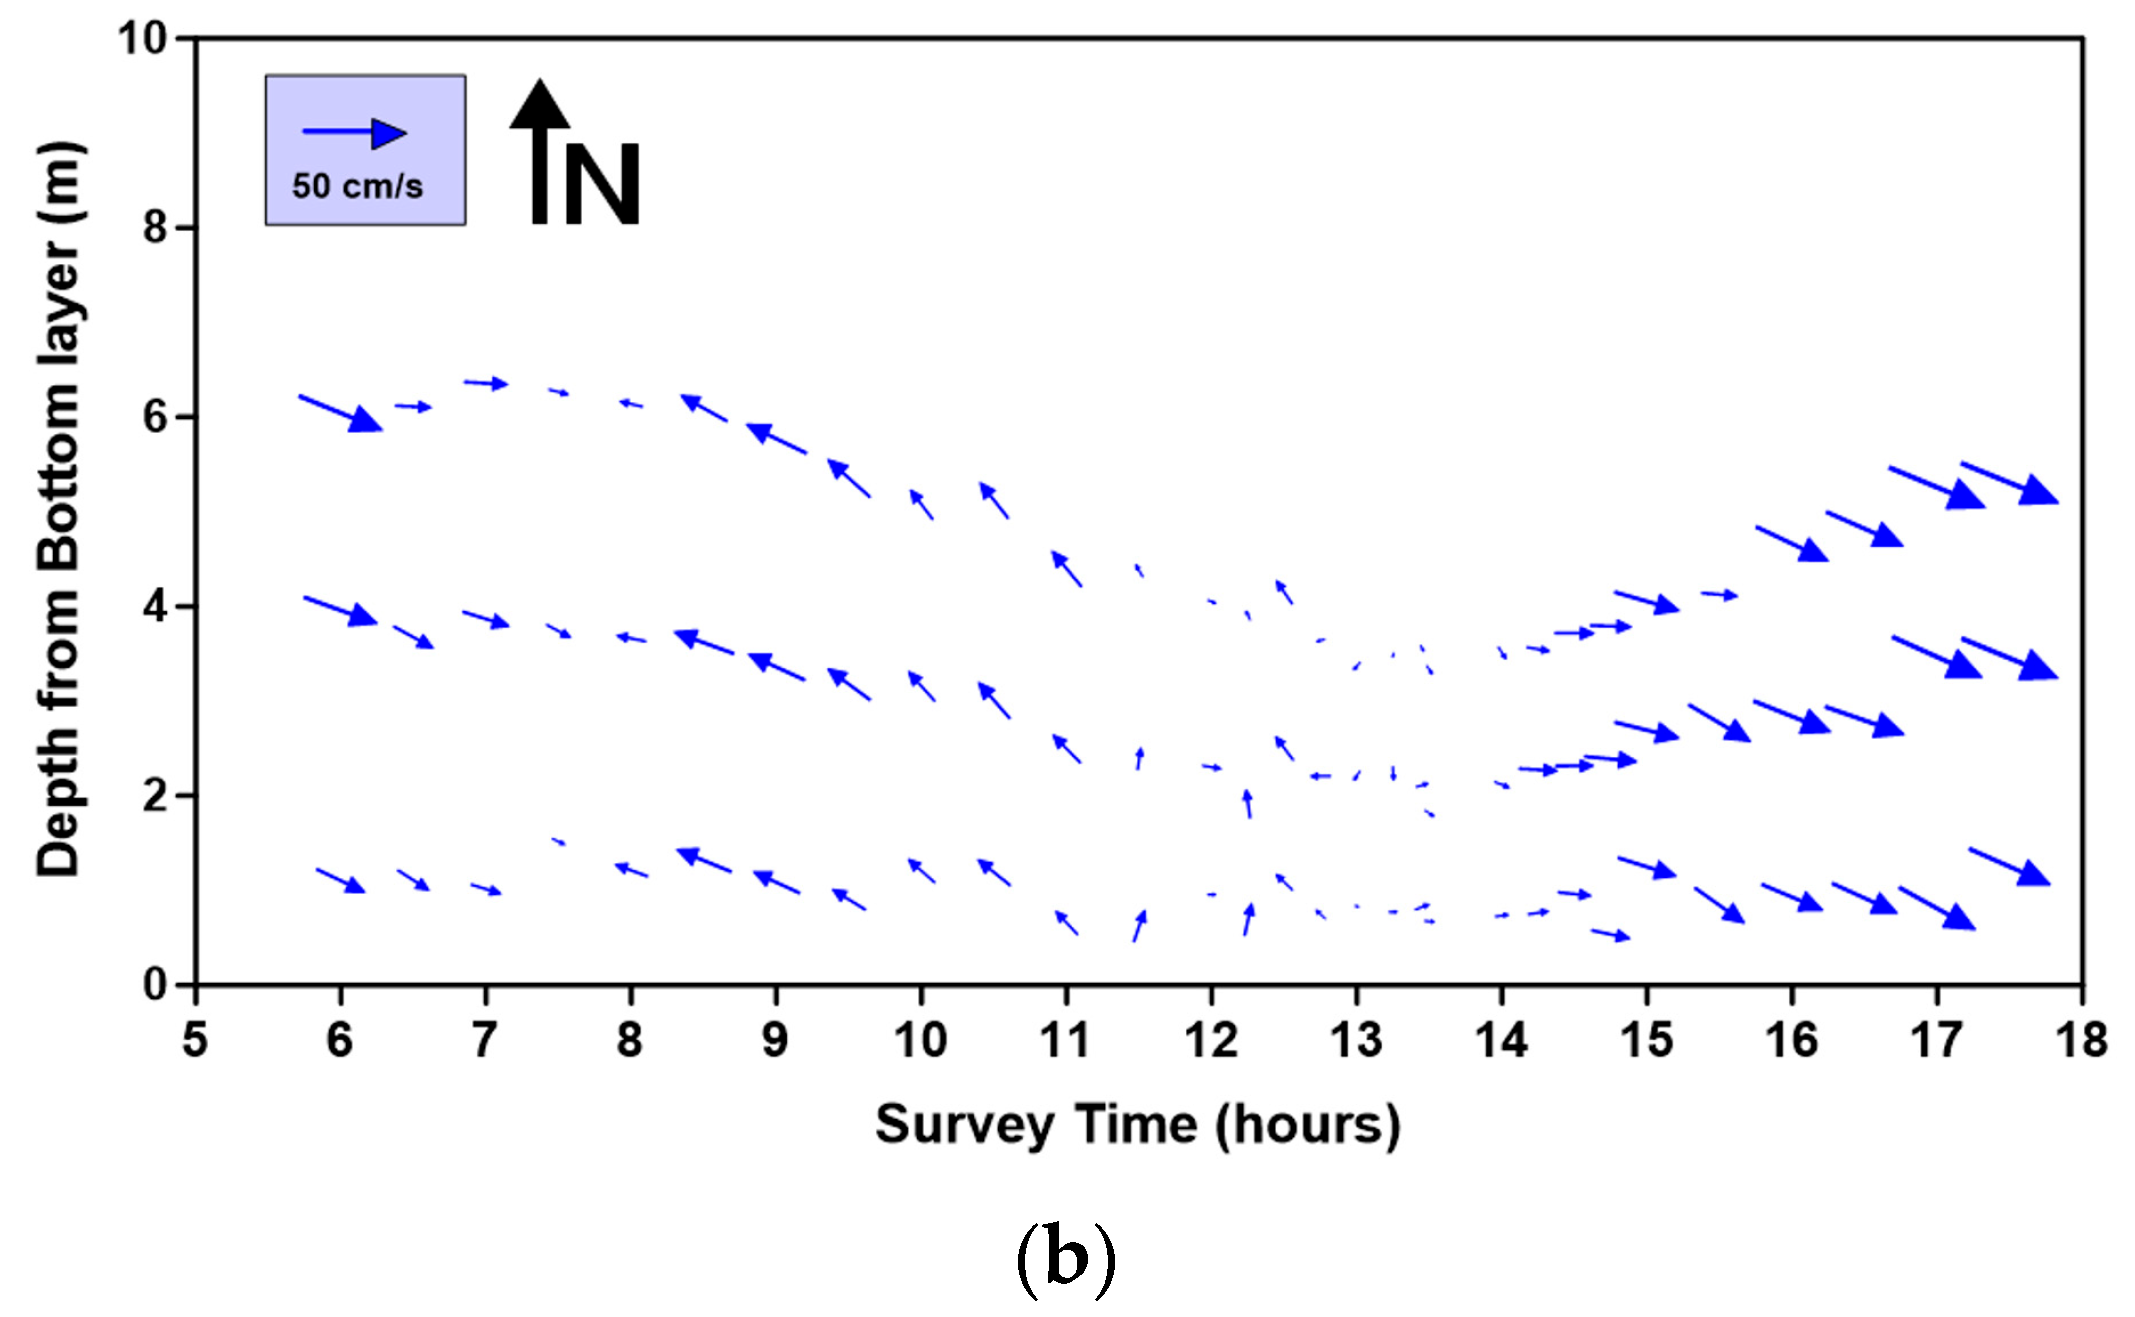
A strong positive correlation was observed between turbidity (NTU) and TSM (mg/L; n = 45), with a coefficient of determination of R2 = 0.94, indicating a high level of agreement between optical turbidity measurements and gravimetrically measured suspended solids concentrations (Figure 6). The RCM sensor was consistently positioned at approximately 1.4 m depth in the surface layer throughout the observation period. Surface current direction at this depth exhibited a dominant ebb tide flow towards approximately 300° until 13:00, after which the direction shifted toward approximately 120° as the flood tide commenced. Surface current velocity remained relatively stable with an average of approximately 21 cm/s until the low water slack around 13:30. Subsequently, the velocity steadily increased, reaching a maximum of 50 cm/s by 17:00. The time series of surface turbidity at 1.4 m showed a pronounced increase during low tide slack and ebb stages, with turbidity values peaking at 17 NTU around 10:00.

3.4. Net Suspended Sediment Flux Calculation

The net suspended sediment residual flow ( f s ) in each layer was estimated using the following equation, as adapted from Erikson et al. [30], Equation (1):
f s = C   ·   V
where f s is the net suspended sediment flux (kg·m−2·s−1), C is the suspended sediment concentration (kg·m−3), and V is the flow velocity (m·s−1) at each depth layer. Observations were conducted every hour over a 13 h period, and representative values were scaled by a factor of 2.08 to cover an entire tidal cycle, resulting in a total effective observation time T of 25 h.
The net suspended sediment transport load per unit width over the tidal cycle ( Q s , in 103 kg·m−1) was computed by vertically integrating f s over the water column, as in Equation (2):
Q s = i = 1 n f s , i ·   D i
where ( f s , i ) is the time-averaged sediment flux at depth layer i , D i is the thickness of the water layer adjacent to depth i , and n is the number of depth layers.
The net transport was then decomposed into directional components, as in Equation (3):
Q 1 = Q s · s i n α ,   Q 2 = Q s · c o s α
where Q 1 and Q 2 represent the east–west and north–south components of sediment transport, respectively, and α is the flow direction relative to true north.
The final net transport direction (θ) was calculated as the angle between the resultant transport vector and the alignment of the bay entrance transect where the station was located.
Depth-averaged quantities were denoted using angle brackets (e.g., ( C )) and water depths H were obtained from tide gauge data. Multiplicative coefficients (e.g., 0.5 m and 1.5 m) represent the sampling offsets below the surface and above the seabed, respectively, corresponding to the specific sampling depths in surface and bottom layers.
In this study, the net suspended sediment flux was estimated based on a one-dimensional (1-D) vertical integration approach, which assumed laterally uniform flow and suspended sediment concentration across the channel cross-section. Due to the lack of multi-point lateral measurements, potential lateral exchange and return flows were not included in the calculation, and the flux values presented here should be interpreted as first-order approximations under these assumptions.

3.5. Measurement of Suspended Sediment Inflow and Outflow

At three water column layers (surface, middle, and lower), flow direction and velocity were measured using a current velocity meter (RCM-SW; Aanderaa, Nesttun, Norway), and water was collected using a water sampling pump to investigate suspended sediments. To determine suspended sediment concentrations, 500 mL of each water sample was filtered through a pre-dried and pre-weighed filter paper (Whatman® 0.4 μm Nuclepore™ Track-Etch Membrane filters) using a vacuum pump, dried at 110 °C, and weighed. The weight was measured to 0.1 mg using a precision balance and recorded as mg·L−1. The total amount of suspended sediments moved per unit width during the investigated 1.5 tidal periods was calculated as follows [31,32,33] (Equation (4)):
f s = ( 1 / T ) T C V cos α   d t   = ( 1 / 25 ) i = 2 25 C i V i cos α 1 + ( 1 / 2 ) ( C 1 V 1 cos α 1 + C 26 V 26 cos α 26 )
where fs is the net sediment residual flux (kg·m−2·s−1) in each layer, C is the concentration of suspended sediments (kg·m−3), V is the flow velocity (m·s−1), and T is the observation time; each subscript indicates time-series data. Here, observations were conducted at 1 h intervals over 13 h, so the total representative value of T was 13. The net suspended sediment transport load (Qs; 103 kg·m−1) of sediment per unit width during the tidal cycle was calculated as follows (Equation (5)):
Q s = Q 1 2 + Q 2 2 1 / 2  
Q1 and Q2 represent the Qs components in the east–west and south–north directions, respectively, and were calculated as follows (Equations (6)–(8)):
Q 1 = T H C V sin α   d h   d t ,     Q 2 = T H C V cos α   d h   d t ,  
Q 1 = T H C V sin α   d h   d t = i = 2 25 H i < C i V i sin α i > + ( 1 / 2 ) ( H 1 < C 1 V 1 sin α 1 > + H 26 < C 26 V 26 sin α 26 > ) × 25 × 3600
and
Q 2 = T H C V cos α   d h   d t = i = 2 25 H i < C i V i cos α i > + ( 1 / 2 ) ( H 1 < C 1 V 1 cos α 1 > + H 26 < C 26 V 26 cos α 26 > ) × 25 × 3600
where α represents the direction to true north, H is the water depth, and the contents within < > represent the mean water depth. The mean depth was defined as in Equations (9) and (10):
C 1 V 1 sin α 1   = ( 1 / H ) J = 2 n 1 D j   ( C i , j V i , j sin α i , j + C i , j + 1 V i , j sin α i , j + 1 ) + 0.5 × C i , 1 V i , 1 sin α i , 1 + 1.5 × C i , n V i , n sin α i , n
and
C 1 V 1 cos α 1 = ( 1 / H ) J = 2 n 1 D j   ( C i , j V i , j cos α i , j + C i , j + 1 V i , j cos α i , j + 1 ) + 0.5 × C i , 1 V i , 1 cos α i , 1 + 1.5 × C i , n V i , n cos α i , n
Here, Dj is the difference in water depth between water column layers and n is the total number of observed water layers. The factors of 0.5 and 1.5 were applied to account for water sampling 0.5 m below the water surface and 1.5 m above the seafloor, respectively.
The direction of Qs was determined from Q1 and Q2, and the correlation between Qs and fs was as follows (Equation (11)):
Q s s i n θ     T f s d t
where θ is the angle between the direction of Qs and the direction of the survey line at the entrance, with the observation site as the apex of the angle.

3.6. Net Suspended Sediment Transport and Residual Flow Characteristics

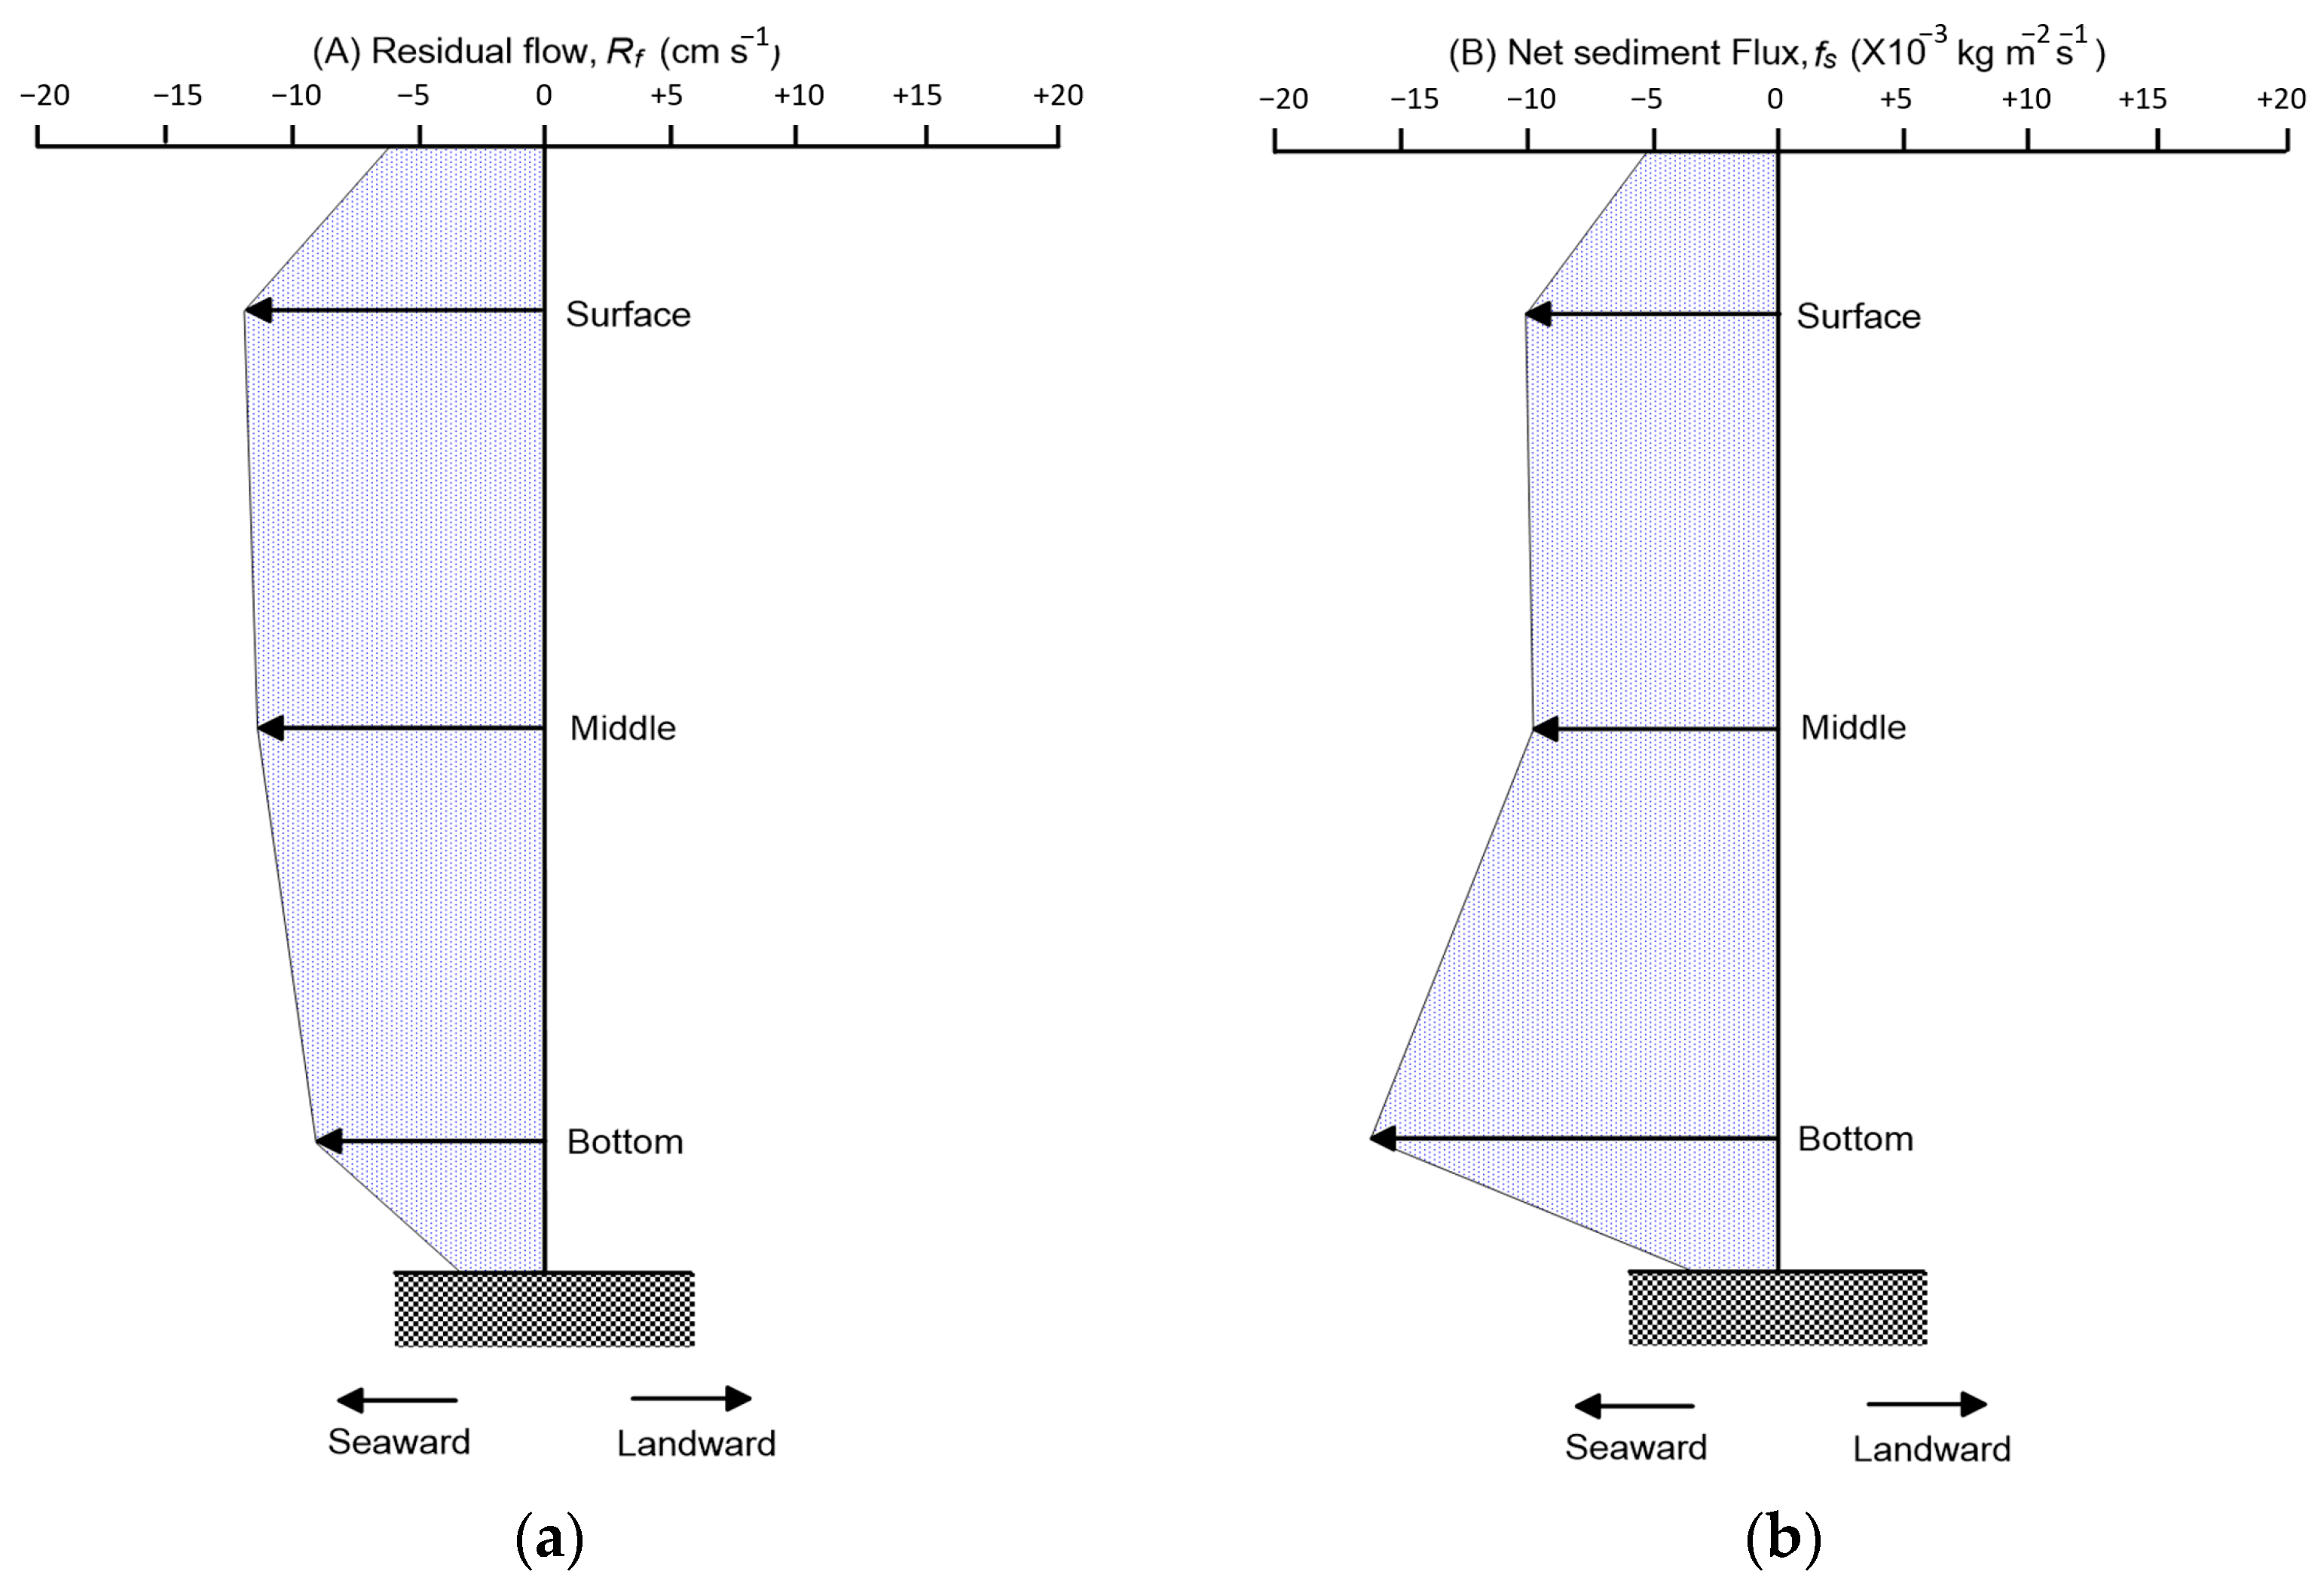
The net suspended sediment transport load (Qs) exhibited an outward (export) flux, with a value of 5503 kg·m−1. Residual flow velocities (Rf) indicated net seaward movement, with average values of −13.15, −12.85, and −8.90 cm·s−1 for the surface, middle, and bottom layers, respectively. Similarly, net suspended sediment flux (fs) showed export-dominant transport, with corresponding values of −10.33 × 10⁻³, −9.81 × 10⁻³, and −16.49 × 10⁻³ kg·m−2 ·s−1 for the surface, middle, and bottom layers. Current direction (Vector, °) was consistent across depth layers, with average flow angles of 254.9°, 255.2°, and 254.2° for the surface, middle, and bottom layers, respectively, indicating a predominant outflow toward the southwest (mean direction: 254.8°). Time series observations of current speed at all depth layers showed that velocities were higher during flood tides compared to ebb tides, with a maximum recorded speed of 50 cm·s−1. A summary of residual flow velocity (Rf), net suspended sediment flux (fs), net suspended sediment transport load (Qs), and current direction (Vector, °) for the surface, middle, and bottom layers during the fixed-point observation period is presented in the following Table 1, Figure 7, Figure 8 and Figure 9.

4. Discussion

The following discussion interprets the observed residual flows, sediment transport patterns, and turbidity–TSM coupling in the context of tidal modulation, lateral variability, and their broader implications for the morphodynamical stability of Gomso Bay’s tidal flat system.

4.1. Limitations and Implications for Bay-Wide Sediment Budget

The net suspended sediment flux was estimated based on 13 h fixed-point measurements during a semi-diurnal tidal cycle. However, this short-term observation does not account for potential diurnal inequality, nor does it capture spring-neap, seasonal, or lateral variations in hydrodynamics and sediment transport. In particular, the observed seaward residual flow may be partially offset by landward flows across shallow shoals or lateral channels, which were not covered by the present study. We therefore emphasize that the results represent a localized, episodic view rather than a bay-wide or time-integrated estimate.
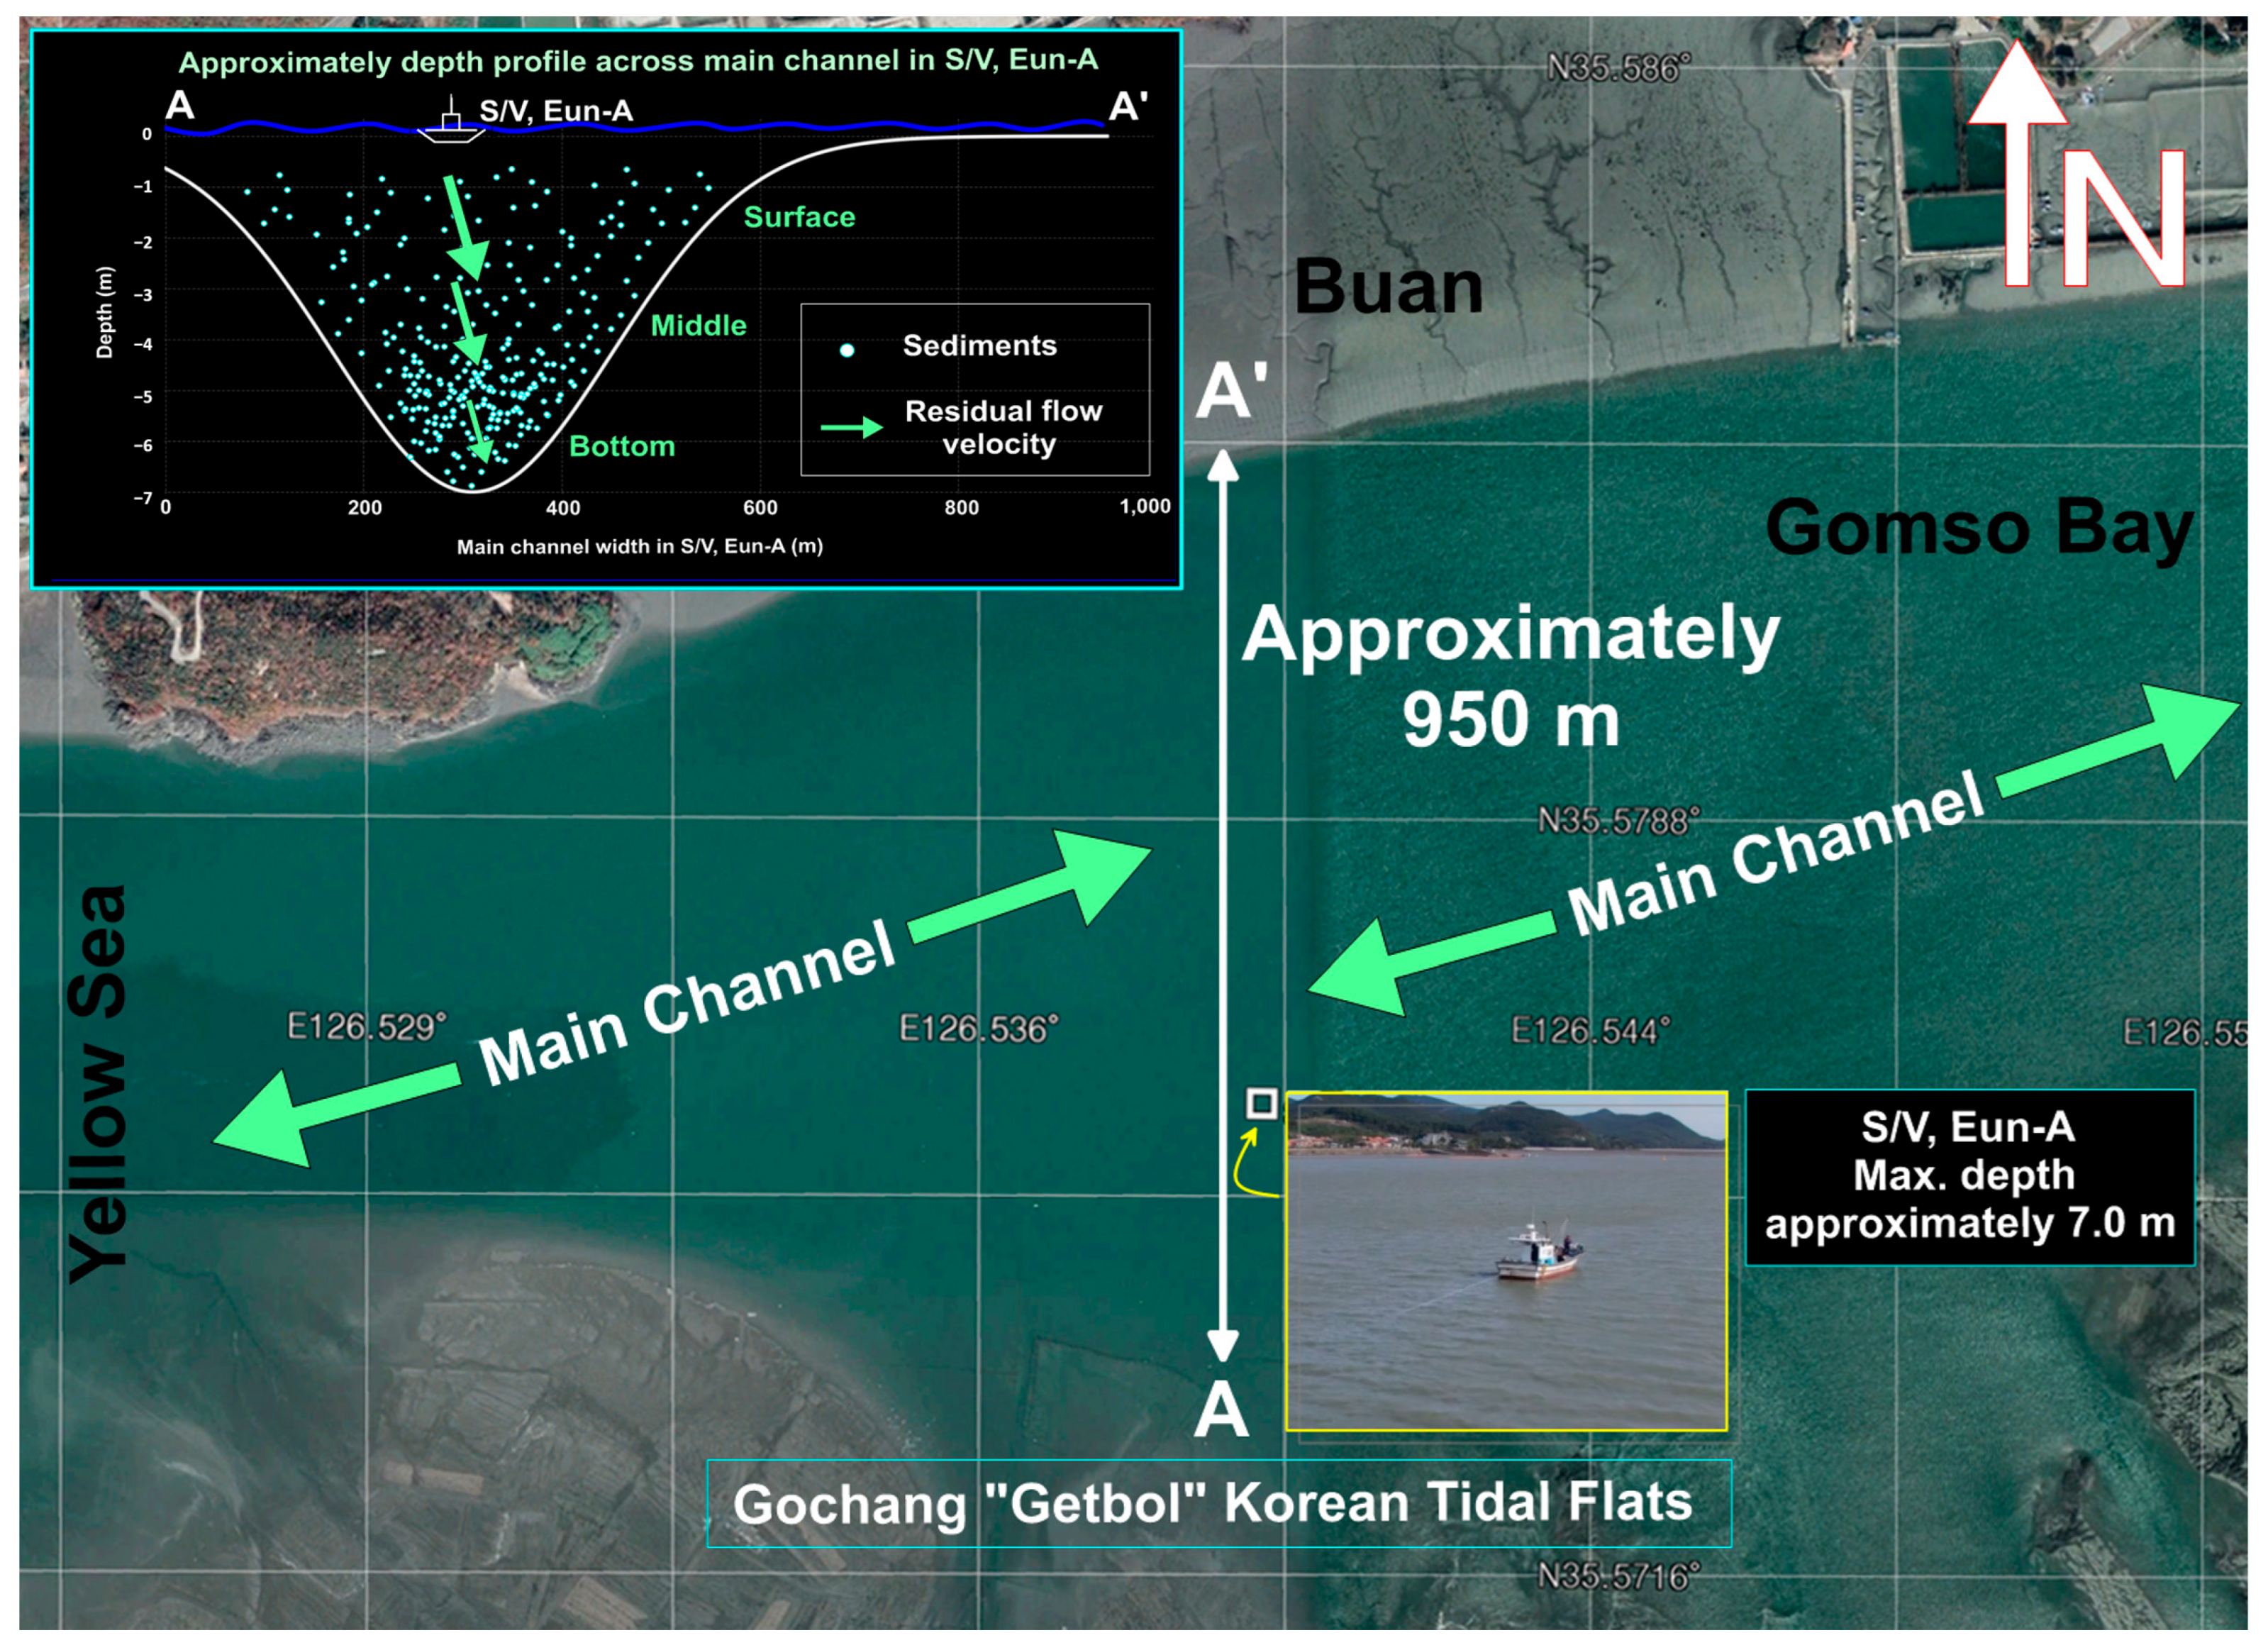
The residual water flux of approximately 174.9 m3·s−1, calculated from the residual flow velocity (≑11 cm·s−1) and main channel dimensions (about 950 m wide × about 7 m deep in Figure 1c and Figure 10), is acknowledged to be a potential overestimation of the net seaward discharge from Gomso Bay. However, Figure 10 is a hypothetical cross-sectional estimate and lacks lateral data. Based on the residual flow velocity of 11 cm/s and the cross-sectional area of approximately 1590.9 m2 estimated from the vertical bathymetric profile, the residual volumetric discharge was calculated to be approximately 174.9 m3·s−1. This value represents a localized estimate of the net seaward water flux through the main tidal channel at the time of observation.
This is because the estimate does not incorporate counterbalancing landward flows over shallow lateral shoals or intertidal zones, which are commonly observed in macrotidal embayments. Such lateral inflows are likely to offset a portion of the observed outflow, underscoring the need for spatially distributed observations across the entire width of the bay mouth for an accurate mass balance assessment.
In macrotidal embayments, residual flow structures are often laterally heterogeneous, with seaward-directed flows concentrated in the central channel and compensating landward flows occurring over adjacent shoals or intertidal flats [34]. The current study, limited to a single vertical profile in the main channel, does not capture these lateral dynamics. Thus, the net seaward residual flow reported here may be offset to some extent by landward-directed flows over the shallow margins of the bay, warranting future transect-based observations across the full channel width. Because the flux estimation does not incorporate lateral flow components or cross-sectional sediment concentration gradients, the resulting net seaward flux may be systematically overestimated, especially if lateral return flows or bar–channel sediment trapping processes occur within the system. Thus, the reported values should be considered upper-bound estimates rather than full-bay sediment export rates.

4.2. Interpretation of Net Sediment Transport Patterns

The estimated net suspended sediment transport load ( Q s ) of 5503 kg·m−1 and depth-averaged net sediment residual flow ( f s ) values ranging from −9.81 to −16.49 × 10⁻³ kg·m−2·s−1 indicate a consistent seaward transport of suspended material. These findings align with the general sediment export dynamics previously reported in semi-enclosed bay systems, especially those under the influence of macrotidal regimes and restricted freshwater inflow [35,36]. The residual current velocities ( R f ) at all depths showed seaward movement, with the surface layer showing the strongest flow (−13.15 cm·s−1), consistent with flood-ebb asymmetry contributing to net export [37]. Similar mechanisms have been documented in the Western Korean tidal flats, such as Saemangeum [29], where anthropogenic modification and topographic confinement enhance ebb-dominant transport, as shown in Figure 9 and Figure 10.

4.3. Turbidity–TSM Relationship and Calibration Potential

A notable outcome of this study is the high correlation (R2 = 0.94) between turbidity (NTU) and TSM (mg·L−1), consistent with prior work that demonstrated robust empirical models linking optical turbidity measurements to gravimetric TSM in estuarine and coastal environments [24,26,27]. This validates the reliability of YSI ProDSS’s optical sensor for real-time, high-resolution sediment flux monitoring in muddy environments. However, caution is warranted. Variability in particle size distribution, color, and organic content can influence turbidity–TSM relationships, especially under storm or flood conditions [25,38]. In future studies, multi-parameter calibration including particulate organic carbon (POC) or colored dissolved organic matter (CDOM) may enhance prediction accuracy.

4.4. Tidal Modulation of Water Column Properties

Vertical profiles of salinity, temperature, and turbidity showed clear modulation by tidal forcing. As the ebb tide progressed, salinity and temperature decreased slightly at all depths, indicating the intrusion of offshore water during the flood and subsequent flushing during the ebb. These patterns agree with classical estuarine classification [39] and observed dynamics in comparable Korean systems [3]. Furthermore, elevated turbidity during ebb tide slack and subsequent maximum values at mid-depth (13.2 NTU at 12:30) indicate resuspension and downstream advection of fine sediment under peak shear stress conditions. This supports theories of critical shear stress and sediment entrainment during tidal transitions [23,40].

4.5. Implications for Tidal Flat Morphodynamics

The net export of suspended sediments from the tidal channel into the offshore environment raises questions about the long-term sediment budget and morphodynamic evolution in Gomso Bay. While sediment import via tidal asymmetry and wave-driven transport has been documented in other Korean embayments [28,41], the prevailing seaward flux observed here suggests potential sediment starvation of the inner tidal flats, especially under scenarios of sea-level rise and reduced riverine input. If persistent, such a trend could lead to channel incision and erosion of inner flats, as described in similar systems in China [42] and the Netherlands [20]. However, the observed net sediment export at the main channel may reflect a localized and episodic imbalance; further investigation is required to assess whether this indicates a sustained sediment deficit within the inner tidal system. It should be noted that the observed net export of suspended sediments during the 13 h window reflects a specific hydrodynamic state under semi-diurnal tidal forcing. Given the limited temporal and spatial scope of this study, such episodic net export cannot be extrapolated to infer a long-term or bay-wide sediment deficit. Additional observations over spring–neap cycles and lateral transects are necessary to evaluate the spatial heterogeneity and long-term sediment balance of Gomso Bay. Future research integrating hydrodynamic modeling, remote sensing, and sediment budget analysis is crucial for evaluating the long-term stability and resilience of the Gomso tidal system. Therefore, the observed net seaward export should be interpreted as a localized response under the specific hydrodynamic state during the observation period and cannot be directly extrapolated to represent long-term or bay-scale sediment budget without additional spatially and seasonally distributed datasets.

4.6. Comparison with Global Estuarine Studies

The sediment flux magnitudes reported here are comparable with values from meso- to macrotidal estuaries worldwide, including the Ems River Estuary [21] and the Yangtze [43]. The relatively moderate TSM concentrations (average 24.3 mg·L−1) reflect a less turbid regime compared to hyper-turbid systems, but are consistent with other Korean embayments, such as Garolim [4] and Suncheon [44].
Table 2 shows that environmental conditions, TSM range, turbidity calibration, and net suspended sediment transport rates vary widely among global estuarine systems due to differences in hydrodynamics, sediment supply, and observational scales [45,46,47,48,49,50,51,52,53,54]. This study on Gomso Bay found a moderate TSM range (13–44 mg·L−1), which is higher than values in some lake or river-plume systems (e.g., Taihu Lake, Adour River) in minimum value data, but much lower than highly turbid environments such as the Jiangsu Coast or Yangtze River estuary. The strong NTU–TSM calibration (R2 = 0.94, n = 45) observed in this study is comparable to or higher than that of other well-studied systems, indicating that turbidity sensors can be reliably used in Gomso Bay. Similarly, comparison of net suspended sediment transport estimates reveals that values reported in other macrotidal or large river-dominated systems are generally expressed at basin-scale or annual-scale magnitudes (e.g., ~7–11 Mt·yr−1 in the Dutch tidal inlet; ~488 Mt·yr−1 in the Yangtze River estuary), whereas the estimate reported in this study (~5503 kg·m−1 per tidal cycle, ~3.7–3.8 Mt/yr−1, assuming a channel width of W ≈ 950 m and an annual tidal frequency of N ≈ 705 cycles) is based on unit-width, channel-focused, and cycle-scale vertical integration.
Nevertheless, the comparison shows that Gomso Bay has a clear and measurable local sediment export signal, despite having only moderate turbidity levels. This consistency supports the validity of using Gomso Bay as a reference site for sediment dynamics under semi-enclosed, tide-dominated conditions. Comparative synthesis with other UNESCO Getbol sites (Shinan, Gochang, Buan, and Suncheon Bay Tidal Flats, Korean Tidal Flats) in South Korea would further strengthen the understanding of Korean tidal flat sedimentology under global change.

5. Conclusions

This study conducted a high-resolution, 13 h fixed-point observation in the main tidal channel of Gomso Bay. The results show that at the central channel station, suspended sediments were predominantly transported seaward during the observed semi-diurnal tidal cycle. Given the limited temporal and spatial scope of the measurements (single station, one tidal cycle), this finding represents a localized estimate of sediment upper-bound flux rather than a system-wide characterization of net sediment transport. Using a combination of in situ instruments, such as an RCM, a multiparameter CTD, a tide gauge, a Secchi disk, and laboratory-based filtration for TSM analysis, we characterized the vertical and temporal variability of hydro-sedimentary processes in this semi-enclosed, macrotidal environment.
A total net suspended sediment transport load ( Q s ) of approximately 5503 kg·m−1 was estimated, supported by negative residual suspended-sediment flow ( f s ) across all layers and ebb-directed residual currents aligned with the bay mouth. A strong linear turbidity–TSM correlation (R2 = 0.94) confirms the utility of optical sensors for real-time sediment monitoring, although particle size, organic content, and hydrodynamic variability highlight the need for local calibration. The observed stratification and tidal modulation further demonstrate the interaction between physical forcing and sediment suspension. Furthermore, the observed vertical structure in temperature and salinity, along with tidal modulation of turbidity, highlights the intricate interplay between physical forcing (e.g., tidal currents, stratification, etc.) and sediment transport processes.
From a broader geomorphic perspective, these findings suggest that short-term net sediment export may contribute to channel deepening or inner-flat erosion under conditions of reduced fluvial sediment supply and sea-level rise, consistent with trends reported in other macrotidal systems worldwide. This study provides site-specific empirical data relevant to estuarine sediment budgets and digital-twin coastal management, supporting improved modeling, restoration planning, and long-term monitoring.
This study contributes to the empirical understanding of sediment transport in Korean tidal flats and the broader discourse on estuarine sediment budgets and digital-twin coastal management. It provides validated, site-specific data that may support numerical modelling, ecosystem restoration planning, and long-term environmental monitoring. Because the flux estimation does not incorporate lateral flow components or cross-sectional sediment gradients, the resulting net export may be systematically overestimated, particularly where lateral return flows or bar–channel trapping occur. Literature indicates that vertically integrated 1-D approaches may overestimate actual net export if lateral sediment exchange or bar–shoal dynamics are active [54], and lateral flows and stratification can alter flow structure in ways not captured by simplified 1-D models [55].
Future studies should expand these findings by integrating spring–neap tidal observations, sediment source attribution (e.g., isotopic or geochemical methods), and field measurements with UAV/drone surveys and numerical hydrodynamic modeling. These efforts will improve prediction of climate-driven and human-induced changes and support sustainable management of Korea’s UNESCO tidal flats.
Although this study provides important insight into vertical sediment-transport dynamics and turbidity–TSM relationships, several limitations must be acknowledged.
(1)
The measurements represent a single 13 h fixed-point record, limiting spatial coverage and potentially underestimating lateral sediment gradients without transect observations [56,57].
(2)
The temporal scope, confined to one tidal cycle in October, restricts evaluation of seasonal or lunar variability in sediment flux and turbidity–TSM calibration [58,59].
(3)
Flux estimation using Erikson et al.’s [30] formula assumes quasi-equilibrium and uniform vertical structure, but nonlinear tidal waveforms, shear-induced resuspension, and relaxation effects may introduce biases [23,60,61].
(4)
Although future deployments of high-performance, spatially resolved instruments may reduce these issues, uncertainties remain due to sensor depth placement and the inherent limitations of optical backscatter sensors (OBSs) in heterogeneous sediment regimes, which can affect calibration accuracy (e.g., ADCP-related constraints) [44,62].
To address these uncertainties, future work should include multi-station and transect-based surveys, multi-season observations, and refined turbidity–TSM calibration across varying sediment conditions, supported by numerical modeling to improve spatial representativeness. Broader temporal and spatial monitoring will also be necessary to determine whether the observed export tendency persists under different tidal, seasonal, and meteorological conditions.

Supplementary Materials

The following supporting information can be downloaded at https://www.mdpi.com/article/10.3390/w17233361/s1.

Author Contributions

Conceptualization, J.-H.L. and H.S.J.; methodology, J.-H.L.; validation, J.-H.L., H.S.J.; formal analysis, J.-H.L., Y.J. and D.L.; investigation, J.-H.L., K.K., Y.J. and D.L.; data curation, J.-H.L. and Y.J.; writing—original draft preparation, J.-H.L.; writing—review and editing, J.-H.L., H.S.J.; visualization, J.-H.L.; supervision, J.-H.L. and J.-H.R.; project administration, J.-H.L., K.K. and J.-H.R.; funding acquisition, J.-H.R. All authors have read and agreed to the published version of the manuscript.

Funding

This research was supported by the Korea Institute of Marine Science & Technology Promotion (KIMST) funded by the Ministry of Oceans and Fisheries (RS-2023-00254717). This research was financially supported by the “Development of Maritime Domain Awareness Technology for Sea Power Enhancement (PEA0332)” project funded by the Korea Institute of Ocean Science & Technology, Republic of Korea.

Data Availability Statement

The original contributions presented in this study are included in the article and Supplementary Materials. Further inquiries can be directed to the corresponding author.

Acknowledgments

The authors would like to thank Joo-Hyung Ryu and Eung Kim for securing the funding necessary to conduct this study and Hanjun Woo for providing constructive comments on our study.

Conflicts of Interest

All authors declare that the research was conducted in the absence of any commercial or financial relationships that could be construed as a potential conflict of interest.

Abbreviations

The following abbreviations are used in this manuscript:
ADCPAcoustic Doppler Current Profiler (General water current velocities)
CDOMColored Dissolved Organic Matter (General mg·m−3)
CTDConductivity (µS·cm−1), Temperature (°C), Depth (m) Profiler
DODissolved Oxygen (mg·L−1)
ETMEstuarine Turbidity Maxima
FTUFormazin Turbidity Unit (dimensionless)
IHSInclined Heterolithic Stratification
NTUNephelometric Turbidity Unit (dimensionless)
OBSOptical Backscatter Sensors
POCParticulate Organic Carbon
RCMRecording Current Meter
SPMSuspended Particulate Matter (mg·L−1)
SSCSuspended Sediment Concentration
TSMTotal Suspended Matter (mg·L−1), where TSM is defined as the gravimetrically measured concentration of suspended particulate material in seawater, including both inorganic sediments and organic detrital particles
UNESCOUnited Nations Educational, Scientific and Cultural Organization
Mathematical Variables:
α Flow direction relative to true north (°)
C Suspended sediment concentration (kg·m−3)
D i Thickness of the water layer adjacent to depth (m)
fsNet suspended sediment flux (kg·m−2·s−1)
H Water depth (m)
QsNet suspended sediment transport load (kg·m−1)
RfResidual flow velocity (cm·s−1)
θNet transport direction (vector, °)
VFlow velocity (m·s−1)
WChannel-scale width (m)
NAnnual tidal frequency (cycles)
nNumber of analyzed samples (dimensionless)

References

  1. Chen, Y.; Dong, J.; Xiao, X.; Zhang, M.; Tian, B.; Zhou, Y.; Ma, Z. Land claim and loss of tidal flats in the Yangtze Estuary. Sci. Rep. 2016, 6, 24018. [Google Scholar] [CrossRef] [PubMed]
  2. Barbier, E.B.; Hacker, S.D.; Kennedy, C.; Koch, E.W.; Stier, A.C.; Silliman, B.R. The value of estuarine and coastal ecosystem services. Ecol. Monogr. 2011, 81, 169–193. [Google Scholar] [CrossRef]
  3. Ryu, J.H.; Choi, J.K.; Lee, Y.K. Potential of remote sensing in management of tidal flats: A case study of thematic mapping in the Korean tidal flats. Ocean Coast. Manag. 2014, 102, 458–470. [Google Scholar] [CrossRef]
  4. Lee, H.J.; Jo, H.R.; Chu, Y.S.; Bahk, K.S. Sediment transport on macrotidal flats in Garolim Bay, west coast of Korea: Significance of wind waves and asymmetry of tidal currents. Cont. Shelf Res. 2004, 24, 821–832. [Google Scholar] [CrossRef]
  5. Yahnke, R.A.; Craven, D.B. Quantifying the role of heterotrophic bacteria in the carbon cycle: A need for respiration rate measurements. Limnol. Oceanogr. 1995, 40, 436–441. [Google Scholar] [CrossRef]
  6. Giblin, A.E.; Hopkinson, C.S.; Tucker, J. Benthic metabolism and nutrient cycling in Boston Harbor, Massachusetts. Estuaries 1997, 20, 346–364. [Google Scholar] [CrossRef]
  7. Lee, H.J. Preliminary Results on Suspended Sediment Transport by Tidal Currents in Gomso Bay, Korea. Ocean Sci. J. 2010, 45, 187–195. [Google Scholar] [CrossRef]
  8. Park, K.; Woo, H.J.; Jung, H.-S.; Jeong, J.B.; Ryu, J.-H.; Lee, J.-H. A Geological Environment Characteristics Dataset of Tidal Flat Surface Sediments: A 2021 Pilot Study of the Gomso Bay Tidal Flat Area to Use of Sediment Type Data. Geo Data 2022, 4, 9–22. (In Korean) [Google Scholar] [CrossRef]
  9. Choi, K.; Hong, C.M.; Kim, M.H.; Oh, C.R.; Jung, J.H. Morphologic evolution of macrotidal estuarine channels in Gomso Bay, west coast of Korea: Implications for the architectural development of inclined heterolithic stratification. Mar. Geol. 2013, 346, 343–354. [Google Scholar] [CrossRef]
  10. Lee, H.J.; Chun, S.S.; Chang, J.H.; Han, S.J. Landward Migration of Isolated Shelly Sand Ridge (Chenier) on the Macrotidal Flat of Gomso Bay, West Coast of Korea: Controls of Storms and Typhoon. J. Sediment. Res. 1994, 64A, 886–893. [Google Scholar] [CrossRef]
  11. Jo, H.R.; Lee, H.J. Bedform Dynamics and Sand Transport Pathways in the Garolim Bay Tidal Flat, West Coast of Korea. Geosci. J. 2008, 12, 299–308. [Google Scholar] [CrossRef]
  12. Lee, Y.-K.; Ryu, J.-H.; Choi, J.-K.; Lee, S.; Woo, H.-J. Satellite-based observations of unexpected coastal changes due to the Saemangeum Dyke construction, Korea. Mar. Pollut. Bull. 2015, 97, 150–159. [Google Scholar] [CrossRef] [PubMed]
  13. Lee, H.J.; Ryu, S.O. Changes in Topography and Surface Sediments by the Saemangeum Dyke in an Estuarine Complex, West Coast of Korea. Cont. Shelf Res. 2008, 28, 1177–1189. [Google Scholar] [CrossRef]
  14. National Geographic Institute-1981 (NGI). Report on Results of Basic Survey on the Coastal Region (Kunsan District); National Geographic Institute: Seoul, Republic of Korea, 1981. (In Korean) [Google Scholar]
  15. Woo, H.J.; Kang, J.; Lee, J.-H.; Jang, S. Seasonal changes in sediment characteristics on the tidal flat in Geunso Bay, west coast of Korea. J. Coast. Res. 2016, 75, 1412–1416. [Google Scholar] [CrossRef]
  16. Mouritsen, K.N.; Mouritsen, L.T.; Jensen, K.T. Change of topography and sediment characteristics on an intertidal mudflat following mass-mortality of the amphipod Corophium volutator. J. Mar. Biol. Assoc. UK 1998, 78, 1167–1180. [Google Scholar] [CrossRef]
  17. Ryu, S.O. Seasonal variation of sedimentary processes in a semi-enclosed bay: Hampyong Bay, Korea. Estuar. Coast. Shelf Sci. 2003, 56, 481–492. [Google Scholar] [CrossRef]
  18. Friedrichs, C.T.; Perry, J.E. Tidal salt marsh morphodynamics. J. Coast. Res. 2001, 27, 149–163. [Google Scholar]
  19. Winterwerp, J.C.; Wang, Z.B.; Van Braeckel, A.; Van Holland, G.; Kösters, F. Man-Induced Regime Shifts in Small Estuaries—II: A Comparison of Rivers. Ocean Dyn. 2013, 63, 1293–1306. [Google Scholar] [CrossRef]
  20. Geyer, W.R.; Signell, R.P. A reassessment of the role of tidal dispersion in estuaries. Estuaries 1992, 15, 97–108. [Google Scholar] [CrossRef]
  21. Sanford, L.P.; Maa, J.P.Y. A unified erosion formulation for fine sediments. Mar. Geol. 2001, 179, 9–23. [Google Scholar] [CrossRef]
  22. Boss, E.; Slade, W.; Hill, P. Effect of particulate aggregation in aquatic environments on beam attenuation and its utility as a proxy for particulate mass. Opt. Express 2009, 17, 9408–9420. [Google Scholar] [CrossRef]
  23. Bilotta, G.S.; Brazier, R.E. Understanding the influence of suspended solids on water quality and aquatic biota. Water Res. 2008, 42, 2849–2861. [Google Scholar] [CrossRef]
  24. Bunt, J.A.C.; Larcombe, P.; Jago, C.F. Quantifying the response of optical backscatter devices and transmissometers to variations in suspended particulate matter. Cont. Shelf Res. 1999, 19, 1199–1220. [Google Scholar] [CrossRef]
  25. Druine, F.; Lafite, R.; Cugier, P.; Deloffre, J.; Leprêtre, A.; Laroche, F.; Roussel, N. In Situ High-Frequency Long-Term Measurements of Suspended Sediment Concentration in a Turbid Estuarine System (Seine Estuary, France): Optical Turbidity Sensors Response to Suspended Sediment Characteristics. Mar. Geol. 2018, 400, 24–37. [Google Scholar] [CrossRef]
  26. Koh, C.-H.; Khim, J.S. The Korean tidal flat of the Yellow Sea. Ocean Coast. Manag. 2014, 102, 398–414. [Google Scholar] [CrossRef]
  27. Byun, D.-S.; Wang, X.-H. The Effect of Sediment Stratification on Tidal Dynamics and Sediment Transport Patterns. J. Geophys. Res. Ocean. 2005, 110, C03011. [Google Scholar] [CrossRef]
  28. National Geographic Institute-2010 (NGI). Report on Results of Basic Survey on the Coastal Region (Kunsan District); National Geographic Institute: Seoul, Republic of Korea, 2010. (In Korean) [Google Scholar]
  29. National Geographic Institute-2018 (NGI). Report on Results of Basic Survey on the Coastal Region (Kunsan District); National Geographic Institute: Seoul, Republic of Korea, 2018. (In Korean) [Google Scholar]
  30. Erikson, L.H.; Wright, S.A.; Elias, E.; Hanes, D.M.; Schoellhamer, D.H.; Largier, J. The Use of Modeling and Suspended Sediment Concentration Measurements for Quantifying Net Suspended Sediment Transport through a Large Tidally Dominated Inlet. Mar. Geol. 2013, 345, 96–112. [Google Scholar] [CrossRef]
  31. Zhong, W.; Zhu, L.; Dong, P.; Hu, R.; Wu, J.; Zhu, Y.; Duan, H. Mechanisms of sediment trapping in coastal embayments off the Shandong Peninsula in summer—A case study in Weihai Bay. Estuar. Coast. Shelf Sci. 2020, 236, 106623. [Google Scholar] [CrossRef]
  32. Li, L.; Guan, W.; Hu, J.; Cheng, P.; Wang, X.H. Responses of water environment to tidal flat reduction in Xiangshan Bay: Part I hydrodynamics. Estuar. Coast. Shelf Sci. 2018, 206, 14–26. [Google Scholar] [CrossRef]
  33. Gao, S.; Qin-Chun, X.; Ying-Jun, F. Fine-grained sediment transport and sorting by tidal exchange in Xiangshan Bay, Zhejiang, China. Estuar. Coast. Shelf Sci. 1990, 31, 397–409. [Google Scholar]
  34. Harris, P.T.; Collins, M. Estimation of annual bedload flux in a macrotidal estuary: Bristol Channel, UK. Mar. Geol. 1988, 83, 237–252. [Google Scholar] [CrossRef]
  35. Uncles, R.J.; Elliott, R.C.A.; Weston, S.A. Observed fluxes of water, salt and suspended sediment in a partly mixed estuary. Estuar. Coast. Shelf Sci. 1985, 21, 147–167. [Google Scholar] [CrossRef]
  36. Dyer, K.R. Coastal and Estuarine Sediment Dynamics; Wiley: Chichester, UK, 1988. [Google Scholar]
  37. Ralston, D.K.; Stacey, M.T. Longitudinal dispersion and lateral circulation in the intertidal zone. J. Geophys. Res. Ocean. 2005, 110, C07015. [Google Scholar] [CrossRef]
  38. Santiago, S.; Thomas, R.L.; McCarthy, L.; Loizeau, J.L.; Larbaigt, G.; Corvi, C.; Vernet, J.P. Particle size characteristics of suspended and bed sediments in the Rhone River. Hydrol. Process. 1992, 6, 227–240. [Google Scholar] [CrossRef]
  39. Hansen, D.V.; Rattray, M. New dimensions in estuary classification. Limnol. Oceanogr. 1966, 11, 319–326. [Google Scholar] [CrossRef]
  40. Winterwerp, J.C. Stratification Effects by Cohesive and Noncohesive Sediment. J. Geophys. Res. Ocean. 2001, 106, 22559–22574. [Google Scholar] [CrossRef]
  41. Dronkers, J. Tidal Asymmetry and Estuarine Morphology. Neth. J. Sea Res. 1986, 20, 117–131. [Google Scholar] [CrossRef]
  42. Yang, S.L.; Friedrichs, C.T.; Shi, Z.; Ding, P.X.; Zhu, J.; Zhao, Q.Y. Morphological Response of Tidal Marshes, Flats and Channels of the Outer Yangtze River Mouth to a Major Storm. Estuaries 2003, 26, 1416–1425. [Google Scholar] [CrossRef]
  43. Pu, X.; Shi, J.Z.; Hu, G.D.; Xiong, L.B. Circulation and mixing along the North Passage in the Changjiang River estuary, China. J. Mar. Syst. 2015, 148, 213–235. [Google Scholar] [CrossRef]
  44. Lee, Y.G.; Kim, S.; Jeong, D.U.; Kim, J.K.; Woo, H.J. Effects of heavy rainfall on sedimentation in the tidal salt marsh of Suncheon Bay, South Korea. J. Coast. Res. 2013, 29, 566–578. [Google Scholar] [CrossRef]
  45. Zhou, W.; Wang, S.; Zhou, Y.; Troy, A. Mapping the concentrations of total suspended matter in Lake Taihu, China, using Landsat-5 TM data. Int. J. Remote Sens. 2006, 27, 1177–1191. [Google Scholar] [CrossRef]
  46. Wang, Y.; Peng, Y.; Du, Z.; Lin, H.; Yu, Q. Calibrations of suspended sediment concentrations in high-turbidity waters using different in situ optical instruments. Water 2020, 12, 3296. [Google Scholar] [CrossRef]
  47. Wang, Y.P.; Gao, S.; Jia, J.; Thompson, C.E.L.; Gao, J.; Yang, Y. Sediment transport over an accretional intertidal flat with influences of reclamation, Jiangsu coast, China. Mar. Geol. 2012, 291–294, 147–161. [Google Scholar] [CrossRef]
  48. Jiang, J.; Xie, W.; Zhang, N.; Xu, Y.; Zhu, C.; Lin, J.; Guo, L.; Shen, J.; He, Q. Mechanism of rapid accretion-erosion transition in a complex hydrodynamic environment based on refined in situ data. Front. Mar. Sci. 2024, 11, 1375085. [Google Scholar] [CrossRef]
  49. Wang, H.; Yang, Z.; Wang, Y.; Saito, Y.; Liu, J.P. Reconstruction of sediment flux from the Changjiang (Yangtze River) to the sea since the 1860s. J. Hydrol. 2008, 349, 318–332. [Google Scholar] [CrossRef]
  50. Molen, J.D.M.; Groeskamp, S.; Maas, L.R.M. Imminent reversal of the residual flow through the Marsdiep tidal inlet into the Dutch Wadden Sea based on multiyear ferry-borne acoustic Doppler current profiler (ADCP) observations. Ocean. Sci. 2022, 18, 1805–1816. [Google Scholar] [CrossRef]
  51. Nauw, J.J.; Merckelbach, L.M.; Ridderinkhof, H.; van Aken, H.M. Long-Term Ferry-Based Observations of the Suspended Sediment Fluxes through the Marsdiep Inlet Using Acoustic Doppler Current Profilers. J. Sea Res. 2014, 87, 17–29. [Google Scholar] [CrossRef]
  52. Petus, C.; Chust, G.; Gohin, F.; Doxaran, D.; Froidefond, J.-M.; Sagarminaga, Y. Estimating turbidity and total suspended matter in the Adour River plume (South Bay of Biscay) using MODIS 250-m imagery. Cont. Shelf Res. 2010, 30, 379–392. [Google Scholar] [CrossRef]
  53. Ralston, D.K.; Yellen, B.; Woodruff, J.D.; Fernald, S. Turbidity hysteresis in an estuary and tidal river following an extreme discharge event. Geophys. Res. Lett. 2020, 46, e2020GL088005. [Google Scholar] [CrossRef]
  54. Zhou, Z.; Ge, J.; van Maren, D.S.; Wang, Z.B.; Kuai, Y.; Ding, P. Study of Sediment Transport in a Tidal Channel-Shoal System: Lateral Effects and Slack-Water Dynamics. J. Geophys. Res. Ocean. 2021, 126, e2020JC016334. [Google Scholar] [CrossRef]
  55. Becherer, J.; Stacey, M.T.; Umlauf, L.; Burchard, H. Lateral Circulation Generates Flood Tide Stratification and Estuarine Exchange Flow in a Curved Tidal Inlet. J. Phys. Oceanogr. 2015, 45, 638–656. [Google Scholar] [CrossRef]
  56. Ganju, N.K.; Schoellhamer, D.H.; Bergamaschi, B.A. Suspended sediment fluxes in a tidal wetland: Measurement, controlling factors, and error analysis. Estuaries 2005, 28, 812–822. [Google Scholar] [CrossRef]
  57. Slabon, A.; Terweh, S.; Hoffmann, T.O. Vertical and Lateral Variability of Suspended Sediment Transport in the Rhine River. Hydrol. Process. 2025, 39, e70070. [Google Scholar] [CrossRef]
  58. Lewis, D.J.; Tate, K.W.; Dahlgren, R.A.; Newell, J. Turbidity and total suspended solid concentration dynamics in streamflow from California oak woodland watersheds. In Proceedings of the Fifth Symposium on Oak Woodlands: Oaks in California’s Challenging Landscape, San Diego, CA, USA, 22–25 October 2001; Standiford, R.B., Ed.; Gen. Tech. Rep. PSW-GTR-184. Pacific Southwest Research Station, USDA Forest Service: Albany, CA, USA, 2002; Volume 184, pp. 107–118. [Google Scholar]
  59. Fischer, A.M.; Pang, D.; Kidd, I.M.; Moreno-Madriñán, M.J. Spatio-Temporal Variability in a Turbid and Dynamic Tidal Estuarine Environment (Tasmania, Australia): An Assessment of MODIS Band 1 Reflectance. ISPRS Int. J. Geo-Inf. 2017, 6, 320. [Google Scholar] [CrossRef]
  60. Scully, M.E.; Friedrichs, C.T. Sediment pumping by tidal asymmetry in a partially mixed estuary. J. Geophys. Res. Ocean. 2007, 112, C07017. [Google Scholar] [CrossRef]
  61. Claudin, P.; Charru, F.; Andreotti, B. Transport relaxation time and length scales in turbulent suspensions. J. Fluid. Mech. 2011, 671, 491–506. [Google Scholar] [CrossRef]
  62. Downing, J. Twenty-Five Years with OBS Sensors: The Good, the Bad, and the Ugly. Cont. Shelf Res. 2006, 26, 2299–2318. [Google Scholar] [CrossRef]
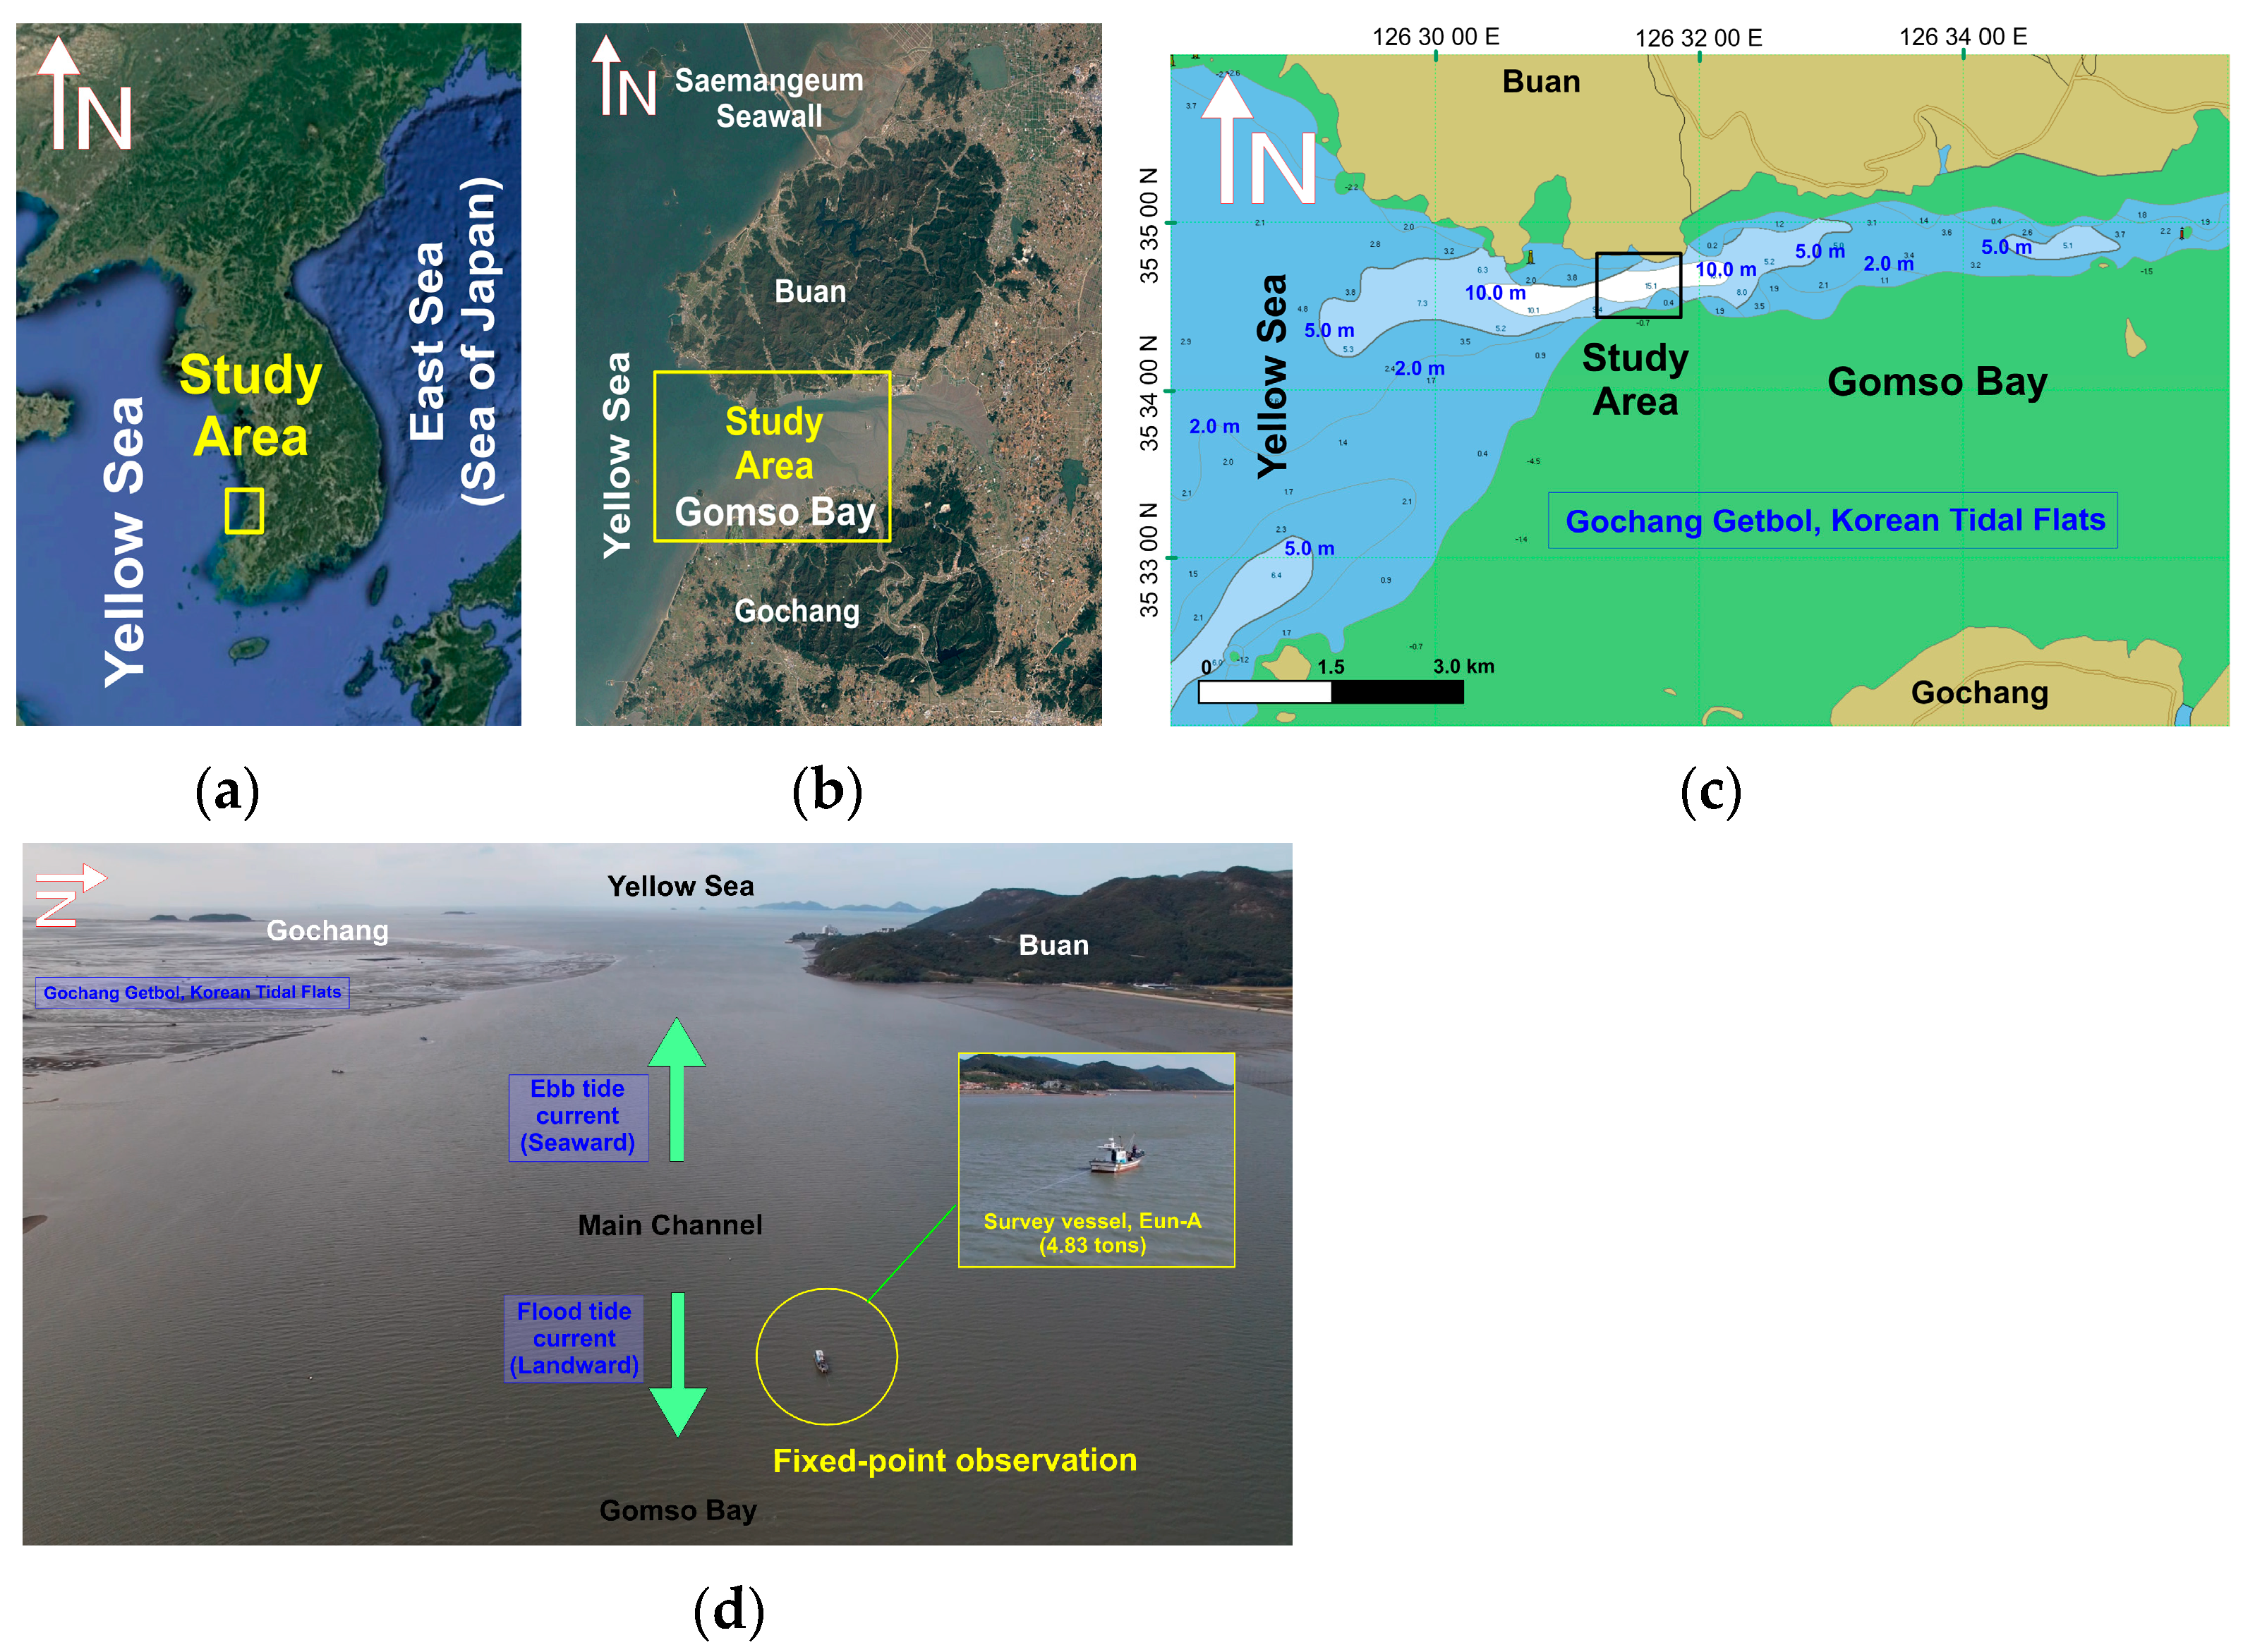
Figure 1. Map of the study area: (a) Location of the study area within South Korea. (b) Detailed map of the study area, showing the main tidal channel of Gomso Bay, the west coast of Korea. (c) Black indicates the study area. (d) Fixed-point (Survey vessel, Eun-A, 4.83 tons) observation location near the main channel.
Water 17 03361 g001
Figure 2. Conceptual diagram and instrument deployment for quantifying suspended sediment flux in Gomso Bay’s tidal channel: (a) Illustration of fixed-point vertical observation using the research vessel Eun-A (4.83 tons) at the main tidal channel of Gomso Bay. (b) Primary instruments used for data collection, including SEAGUARD® Recording Current Meter–SWTM, YSI® ProDSS™ multiparameter water quality sensor, United Scientific SCDSK1 model plastic Secchi disk, Testo SE & Co. KGaA digital illuminance meter, and a bottom-mounted tide gauge. (c) Graph of tidal variation and vertical sampling depths at 15–30 min intervals from 05:00 to 18:00, illustrating measurement layers and corresponding tidal changes throughout the observation period.
Water 17 03361 g002
Figure 3. Secchi disk depth measurements (cm) during peak solar elevation in the tidal channel of Gomso Bay.
Water 17 03361 g003
Figure 4. Time-series vertical profiles of parameters observed in the tidal channel of Gomso Bay: (a) Vertical distribution of salinity, showing layer-specific variation throughout the tidal cycle. The graph includes bottom-referenced tidal changes to contextualize stratification and mixing patterns. (b) Time-series variation in water temperature across surface, middle, and bottom layers, highlighting thermal stratification and tidal modulation effects. (c) Vertical profiles of pH measure. (d) Dissolved oxygen (DO) concentration profiles.
Water 17 03361 g004
Figure 5. Time-series vertical profiling of turbidity and TSM in the main tidal channel of Gomso Bay: (a) The vertical distribution of turbidity (NTU) was measured using the YSI® ProDSS sensor at 15 to 30 min intervals throughout the 13 h observation period. The time-series highlights mid-depth turbidity peaks near low slack water and variations linked to tidal resuspension processes. (b) Gravimetrically measured TSM (mg·L−1) across surface, middle, and bottom layers at 0.5–1.0 h intervals, showing a strong temporal and vertical correlation with turbidity measurements.
Water 17 03361 g005
Figure 6. Relationship between turbidity (NTU) and TSM (mg·L−1) based on fixed-point vertical sampling in the tidal channel of Gomso Bay (n = 45; R2 = 0.94).
Water 17 03361 g006
Figure 7. Tidal variations and corresponding current responses observed during the fixed-point survey in the tidal channel of Gomso Bay: (a) Tidal elevation changes recorded during the 13 h fixed-point observation period using the anchored vessel Eun-A (4.83 tons). (b) Variations in current velocity and direction in surface, middle, and bottom layers in response to tidal fluctuations.
Water 17 03361 g007aWater 17 03361 g007b
Figure 8. Residual flow velocity and net suspended sediment flux in surface, middle, and bottom layers of the tidal channel in Gomso Bay: (a) Residual flow velocity ( R f ; cm·s−1) observed at surface, middle, and bottom layers; (b) net suspended sediment flux ( f s ; 10−3 kg·m−2·s−1) corresponding to each layer, calculated based on vertical profiling during a 13 h fixed-point observation.
Water 17 03361 g008
Figure 9. Vector representation of net suspended sediment transport load (Qs = 5503 kg·m−1) from the tidal channel of Gomso Bay toward the sea flow in the western Yellow Sea.
Water 17 03361 g009
Figure 10. Approximate bathymetric cross-section (Transect A–A′) and S/VEun-A observation site location along the main tidal channel of Gomso Bay.
Water 17 03361 g010
Table 1. Residual flow ( f s : net suspended sediment flux and R f : residual flow velocity), current direction (vector, °), and net suspended sediment transport load ( Q s ) in surface, middle, and bottom layers at the fixed station in Gomso Bay’s tidal channel.
StationLayer R f
(cm·s−1)
f s
(10−3 kg·m−2·s−1)
Net Sediment Transport Load
Q s (kg·m−1) Direction (Vector, °)
Gomso Bay
(This study)
Surface−13.15−10.335502.7254.9254.8
Middle−12.85−9.81255.2
Bottom−8.90−16.49254.2
Table 2. Comparison of suspended sediment characteristics, turbidity–TSM calibration relationships, and net sediment transport among representative coastal and estuarine systems.
Study RegionHydrodynamic EnvironmentsSuspended Sediments Range
(mg·L−1)
Calibration
Relationships, R2
Net Suspended Sediment TransportReference
Gomso Bay (1)
(South Korea)
Semi-enclosed macrotidal bay with limited freshwater and a deep tidal channelTSM ≈ 13–44NTU ≈ 0.367 × TSM, R2 = 0.94
(n = 45)
Qₛ ≈ 5503 kg·m−1
per tidal cycle (ebb-dominant),
~3.7–3.8 Mt·yr−1
(assuming
a channel-scale (1) width of W = 950 m and
an annual tidal
frequency of N = 705 cycles)
This study
Taihu Lake,
Estuary
(China)
Wind–wave-dominated shallow lake–estuary systemTSM ≈ 0.2–398.9R2 = 0.63–0.68
(in the TSM–Optical reflectance relationship)
Not reported[45]
(Zhou et al., 2006)
Jiangsu Coast (China)Macrotidal muddy environmentsNot reportedFTU ≈ −2.89 × SSC2 +
80.4 × SSC + 3850.3,
R2 = 0.99
(SSC ≥ 14.95 kg·m−3)
SSC ≈ 100~
(up to 1000–10,000) kg·m−1
[46,47]
(Wang et al., 2020; Wang et al., 2012)
Yangtze River (2)
Estuary
(China)
Highly turbid mesotidal estuary with multi-channel distributariesSSC ≈ ~2500
(thesis expression, up to 2.5 kg·m−3)
NTU ≈ 416.4 × SSC,
R2 = 0.99
(n = 32)
~488 Mt·yr−1
(basin-scale (2))
[48,49]
(Jiang et al., 2024; Wang et al., 2008)
Dutch Tidal Bays (3) (Marsdiep inlet, Wadden Sea)Mixed-energy tidal inlet
connecting the North Sea &
Wadden Sea
Not reportedNot reported~7–11 Mt·yr−1
(system-scale (3))
[50,51]
(Molen et al., 2022; Nauw et al., 2014)
Adour River Plume
(France)
River-dominated coastal plume
system
TSM ≈ 0.3–145.6
(about
1–100)
Turbidity in situ
(NTU) ≈ 1.353
× TSM in situ
–1.044,
R2 = 0.996
(n = 65)
Not reported[52]
(Petus et al., 2010)
Hudson River
Estuary
(USA)
Partially mixed
estuary with tidal reversals &
hysteresis
TSS < 100TSS ≈ 1.2 × NTU,
R2 = 0.52
(n = 219)
~4.2–5.0 Mt·yr−1
(1990–2002 years, seaward);
~1.2 Mt·yr−1
(2004–2010 years, seaward)
[30,53]
(Ralston et al., 2020; Erikson et al., 2013)
Note: (1), (2), (3) Yangtze and Dutch systems are basin-scale and system-scale estimates, not directly comparable to channel-scale unit-width values reported for Gomso Bay.
Disclaimer/Publisher’s Note: The statements, opinions and data contained in all publications are solely those of the individual author(s) and contributor(s) and not of MDPI and/or the editor(s). MDPI and/or the editor(s) disclaim responsibility for any injury to people or property resulting from any ideas, methods, instructions or products referred to in the content.