Article

Experimental Study on the Variation Pattern of Saline Ice Microstructure with Temperature

State Key Laboratory of Coastal and Offshore Engineering, Dalian University of Technology, Dalian 116024, China
*
Author to whom correspondence should be addressed.
Water 2025, 17(23), 3343; https://doi.org/10.3390/w17233343
Submission received: 31 October 2025 / Revised: 18 November 2025 / Accepted: 20 November 2025 / Published: 21 November 2025

Abstract

By employing high-resolution imaging and image processing techniques, a quantitative analysis was conducted on the changes in volume fraction and size of microstructures, such as brine inclusions and air bubbles, within natural saline ice at different temperatures. This study revealed the distinct stratified distribution characteristics of ice microstructure parameters along the depth direction and elucidated the differential response mechanisms of various ice layers to temperature changes. The results indicate that the sizes of brine inclusions and air bubbles decrease progressively from the surface layer to the bottom layer, with the size distribution of microstructures being most concentrated in the bottom layer. Changes in the size of microstructures in the surface ice layer are primarily dominated by solar radiation, showing strong correlations (brine inclusions: r = 0.96, p < 0.01; air bubbles: r = 0.95, p < 0.02). In contrast, the size changes of microstructures in the middle ice layer show a more significant response to ice temperature, with strong linear relationships between the sizes of brine inclusions/air bubbles and ice temperature (brine inclusions: r = 0.70, p < 0.04; air bubbles: r = 0.69, p < 0.05). The temperature of the bottom ice layer, influenced by the stable lake water temperature, remains relatively constant, and no significant correlation was observed between its microstructure size changes and ice temperature. Derived from field experiments, this study provides quantified, layer-specific mechanisms of how saline ice microstructure responds to temperature. These mechanisms offer crucial observational constraints for refining the parameterizations of ice thermodynamics and albedo feedback in cryosphere and climate system models.

1. Introduction

Against the backdrop of increasingly severe global climate change, gaining a profound understanding of the cryosphere’s evolution requires precise knowledge of the physical properties of ice—its core component. These properties are fundamentally governed by ice microstructure: ice is essentially a multiphase composite material composed of ice crystals, air bubbles, brine inclusions, and various impurities [1,2], and the content and spatial distribution of these components collectively form the ice microstructure. Physical processes such as ice growth, freezing, and melting are directly manifested as the continuous evolution of the ice microstructure (changes in the size, morphology, and quantity of air bubbles and brine inclusions) [3], which is also the underlying cause of changes in macroscopic parameters like ice temperature, density, and salinity. Notably, temperature-driven microstructural changes in ice amplify ice sheet ablation and influence the climate system via two positive feedback mechanisms: reduced albedo [4] and enhanced thermal conductivity [5]. Consequently, in-depth research on ice microstructure is pivotal for accurately understanding and predicting a series of its physical properties (optical [6], thermal [7], electromagnetic [8], and mechanical properties [9], etc.).
Ice microstructure is directly influenced by air temperature changes [10], and this effect subsequently exerts a significant impact on the macroscopic properties of ice. When ice temperature fluctuates due to air temperature, the geometric characteristics of brine inclusions and air bubbles undergo notable changes. Specifically, during warming, brine inclusions expand and may become interconnected—a process that markedly modifies the permeability of saline ice [5]. Concurrently, the expansion of air bubbles [11] reduces sea ice density and impairs structural stability, thereby diminishing the overall strength and stability of saline ice. Conversely, during cooling, the size and quantity of both brine inclusions and air bubbles decrease correspondingly [12,13].
To thoroughly explore the dynamic evolution of ice’s physical properties, accurately grasping the mechanism by which temperature fluctuations affect the volume of air bubbles and brine inclusions within ice is particularly critical. Based on formulas related to ice temperature, salinity, and density proposed by Cox [14] and Leppäranta [15], among others, this study can quantitatively analyze the specific impact of temperature changes on the volume of air bubbles and brine inclusions within ice. Laboratory warming experiments by Golden [5] et al. revealed a significant increase in sea ice porosity with rising temperature, while Bailey [16] et al. used a sea ice thermodynamic model to predict the trend of brine inclusion volume change with temperature in sea ice. In addition to the patterns of volume change, the evolution of the morphology of air bubbles and brine inclusions with temperature cannot be overlooked. Perovich and Gow [17] observed changes in the cross-sectional area and distribution of brine inclusions during sea ice warming; Cole and Shapiro [18] used high-resolution imaging techniques to capture morphological changes in air bubbles and brine inclusions; Light [12] et al. and Frantz [19] et al. recorded the size change characteristics of air bubbles and brine inclusions within sea ice during warming processes through laboratory and field experiments, respectively. Although previous research on ice microstructure has established a general framework, studies focusing on its specific changes with temperature remain relatively limited. Past research has predominantly concentrated on laboratory-based cooling [13] and heating [12] processes, whereas field-based experiments under natural conditions are comparatively scarce. This limitation may result in experimental results that fail to comprehensively and accurately describe the differences ice exhibits in response to environmental changes in natural settings.
To address the gap in detailed information in this area and thereby gain a deeper understanding of the specific impact of temperature on ice microstructure, this paper presents experimental results from high-resolution imaging of natural saline ice in Lake Hanzhang during winter. Natural environments contain influential factors—such as solar radiation, diurnal cycles, and complex weather variations—that significantly affect ice microstructure evolution yet are difficult to fully replicate in laboratory settings. By investigating the changes in the volume and size of brine inclusions and air bubbles within saline ice, as well as the underlying causes of these changes, this study aims to develop a more nuanced understanding of the mechanisms governing the variation in ice microstructure with temperature. In turn, this research will provide a scientific foundation and data support for the development of ice thermodynamic models.

2. Field Experiments and Methods

Field experiments were conducted at Lake Hanzhang (40°40′12″–40°43′48″ N, 122°2′24″–122°9′0″ E), located in the Liaodong Bay New Area of Panjin City, Liaoning Province. The lake features an approximately four-month ice cover period, which provided favorable natural conditions for the experimental observations. Ice sampling was carried out from 5 December 2023, to 19 March 2024—a timeframe that fully covers the lake’s ice-freezing and ice-ablation phases. During observation period, the daily air temperature ranged from −14 °C to 13 °C, while the average water salinity was about 6.9‰.
The specific field site and layout of relevant instruments are illustrated in Figure 1. Prior to the complete freezing of the lake surface, the floating observation platform [20,21] shown in Figure 1b was deployed at the location marked by the red point in Figure 1a to continuously monitor parameters including ice thickness and temperature. Solar radiation was also measured at the same location using upward/downward-facing shortwave radiometers with a spectral range of 230–2800 nm and longwave radiometers with a spectral range of 4.2–42 μm (Sunshine Meteorological Technology (Jinzhou) Ltd., Jinzhou, China). Detailed observational results are presented in the Results section. The platform was retrieved once the lake ice had completely melted.
Ice core sampling was conducted in the vicinity of the floating observation platform starting from 18 January 2024, with a frequency of approximately once every six days; the final sampling was carried out on 29 February 2024. A total of eight ice cores were obtained during this observation period, covering both the growth and melting stages of the lake ice. Specifically, on each sampling day, ice cores were extracted using chainsaws near the floating platform. The horizontal dimension of each ice core was set to 30 cm × 30 cm, and the distance between individual ice core sampling points was controlled within a 20 cm range. This sampling strategy effectively minimized the potential impact of spatial variability on the observation results.

2.1. Ice Physical Properties

Ice thickness was measured using a PTA500 ultrasonic rangefinder (Tritech, Westhill, UK) with a measurement range of 0.1–10 m and an accuracy of 2.5 mm; the sensor was factory-calibrated prior to deployment. To ensure measurement accuracy, the rangefinder was mounted on the floating platform and maintained vertically in the water. Ice thickness was calculated by subtracting the distance from the ice bottom to the sensor from the known distance between the ice surface and the sensor. For subsequent analysis, the top 5 cm of the ice layer was defined as the surface layer, the bottom 5 cm as the bottom layer, and the segment between these two layers as the middle layer.
Ice temperature was obtained using a platinum resistance temperature sensor chain (Meacon, Hangzhou, China) deployed vertically along the floating platform, with a measurement range of −40–150 °C and an accuracy of 0.1 °C. For convenience, the temperature chain was fixed to a wooden stick for deployment, with sensors spaced at 0.03 m intervals. Owing to the low thermal conductivity of wood, its impact on ice temperature measurement was negligible. Additionally, an infrared temperature sensor (with an accuracy of 0.2 °C) was used to measure the ice surface temperature (Apogee Instruments, Logan, UT, USA). After acquiring the ice temperature data, depth-wise interpolation was performed to calculate the average ice temperatures of the surface, middle, and bottom layers. Specifically, during the sampling period, the mean vertical temperature gradients from the surface to the bottom layer were −8.35 °C·m−1, −6.42 °C·m−1, and −3.02 °C·m−1, respectively. This monotonic decrease in gradient with increasing depth confirms the existence of distinct thermal stratification within the ice cover.
After ice core samples were collected, they were horizontally sectioned along the depth direction into layers of 5 cm thickness. Subsequently, Archimedes’ drainage method was used to determine the ice density (ρice) of a portion of each ice layer. To prevent sample melting during measurement, antifreeze was used as the fluid in the drainage method. The ice density ρice was derived using the following formula:
ρ i c e = M 2 M 1 M 3 M 1 ρ
In the formula, M1 denotes the total mass of the container plus the antifreeze it contains, M2 denotes the total mass of the ice sample, antifreeze, and container when the ice sample floats freely in the container, M3 denotes the total mass of the container, antifreeze, and ice sample when the ice sample is fully submerged in the antifreeze, and ρ denotes the density of the antifreeze (which is known).

2.2. Ice Microstructure

2.2.1. Volume Fraction

In this study, Va and Vb denote the volume fractions of air bubbles and brine inclusions in ice samples, respectively. These two parameters were accurately calculated based on phase diagrams [14,15], using field-measured input variables including ice temperature (T), ice salinity (S), and ice density (ρice). For the calculations, established empirical relationships for pure ice density and intermediate brine parameters were adopted, with distinct expressions applied to different temperature ranges as referenced in the literature [14,15].

2.2.2. Size of Ice Microstructure

Ice samples were sectioned along their growth direction into slices of approximately 5 mm in thickness for high-resolution imaging. This thickness effectively prevents brine drainage in overly thin sections while avoiding mutual obstruction between air bubbles and brine inclusions during observation—thus ensuring measurement accuracy. To prevent sample melting, all procedures were conducted in a low-temperature laboratory maintained at −10 °C. Each imaging session covered an area of roughly 9 mm × 5 mm, with a pixel resolution of approximately 0.005 mm. Imaging was performed under diffuse light [12] to enhance feature clarity and facilitate subsequent processing. A total of over 3000 high-resolution images were acquired, covering all ice samples collected in this study.
All acquired images were preprocessed using an algorithmic model [22]. A subset of images was manually annotated to label air bubbles and brine inclusions, and these annotations were used to train the model. The dataset consisted of 50 images for training and 30 for testing, with the test set covering all ice layers from each sampling day. Segmentation accuracy was defined as the ratio of successfully segmented pores to the total number of pores in each image. The accuracy of every image in the test set was found to range between 80 and 90%. Unsegmented regions were manually corrected, and the preprocessed images were subsequently binarized (Figure 2b). Key morphological parameters—including major axis, minor axis, area, and circularity—were automatically extracted for each inclusion.
Statistical analysis was performed separately for brine inclusions and air bubbles. Unlike previous methods, such as those by Perovich [17] and Light et al. [12], which relied on ice type or subjective shape criteria, this study used circularity [13] as a quantitative discrimination parameter. A threshold value of 0.833 was selected, and the validity of this threshold was confirmed by comparing the brine pocket volume fraction derived from image analysis with the results obtained via phase-diagram-based calculations [14,15]; the two sets of results showed good consistency. This approach effectively minimized subjective bias.
Notably, brine drainage during thin-section preparation may render some brine inclusions transparent, leading to their misclassification. Therefore, although slice imaging was used to obtain microstructural sizes, the volume fractions (Va and Vb) employed in subsequent analyses were derived computationally, as detailed in Section 2.2.1. In subsequent discussions, bubble size (La) refers to diameter, and brine inclusion size (Lb) denotes the length of major axis.

3. Results

3.1. Weather Conditions

Since all ice core sampling occurred around 12:00 noon, this study extracted daily noon data for air temperature, skin temperature, and radiation flux during the observation period (4 December 2023–19 March 2024). Initial ice formation was observed on 11 December 2023 with an initial thickness of 1.36 cm and skin temperature dropping below 0 °C (Figure 3a,c). Ice thickness increased rapidly following a period of low temperatures. Air temperature and skin temperature exhibited a strong correlation (r = 0.89, p < 0.001). During the sampling phase (18 January–29 February 2024), the air temperature ranged from −12.6 °C to 7.9 °C (mean: −3.1 °C), with notable fluctuations occurring between February 2–20. The incident radiation flux (Ed) increased (r = 0.53, p < 0.001), while reflected flux (Er) decreased (r = −0.51, p < 0.001), reaching 700 W·m−2 later in the season (Figure 3b). The maximum ice thickness (46.0 cm) was recorded on 14 February 2024, which marks the transition of lake ice from the freezing period to the ablation period. Ice temperatures ranged from −8.3 °C to −0.1 °C, decreasing with increasing depth and showing a significant response to air temperature variations.

3.2. Measurement of Ice Physical Properties

3.2.1. Ice Temperature

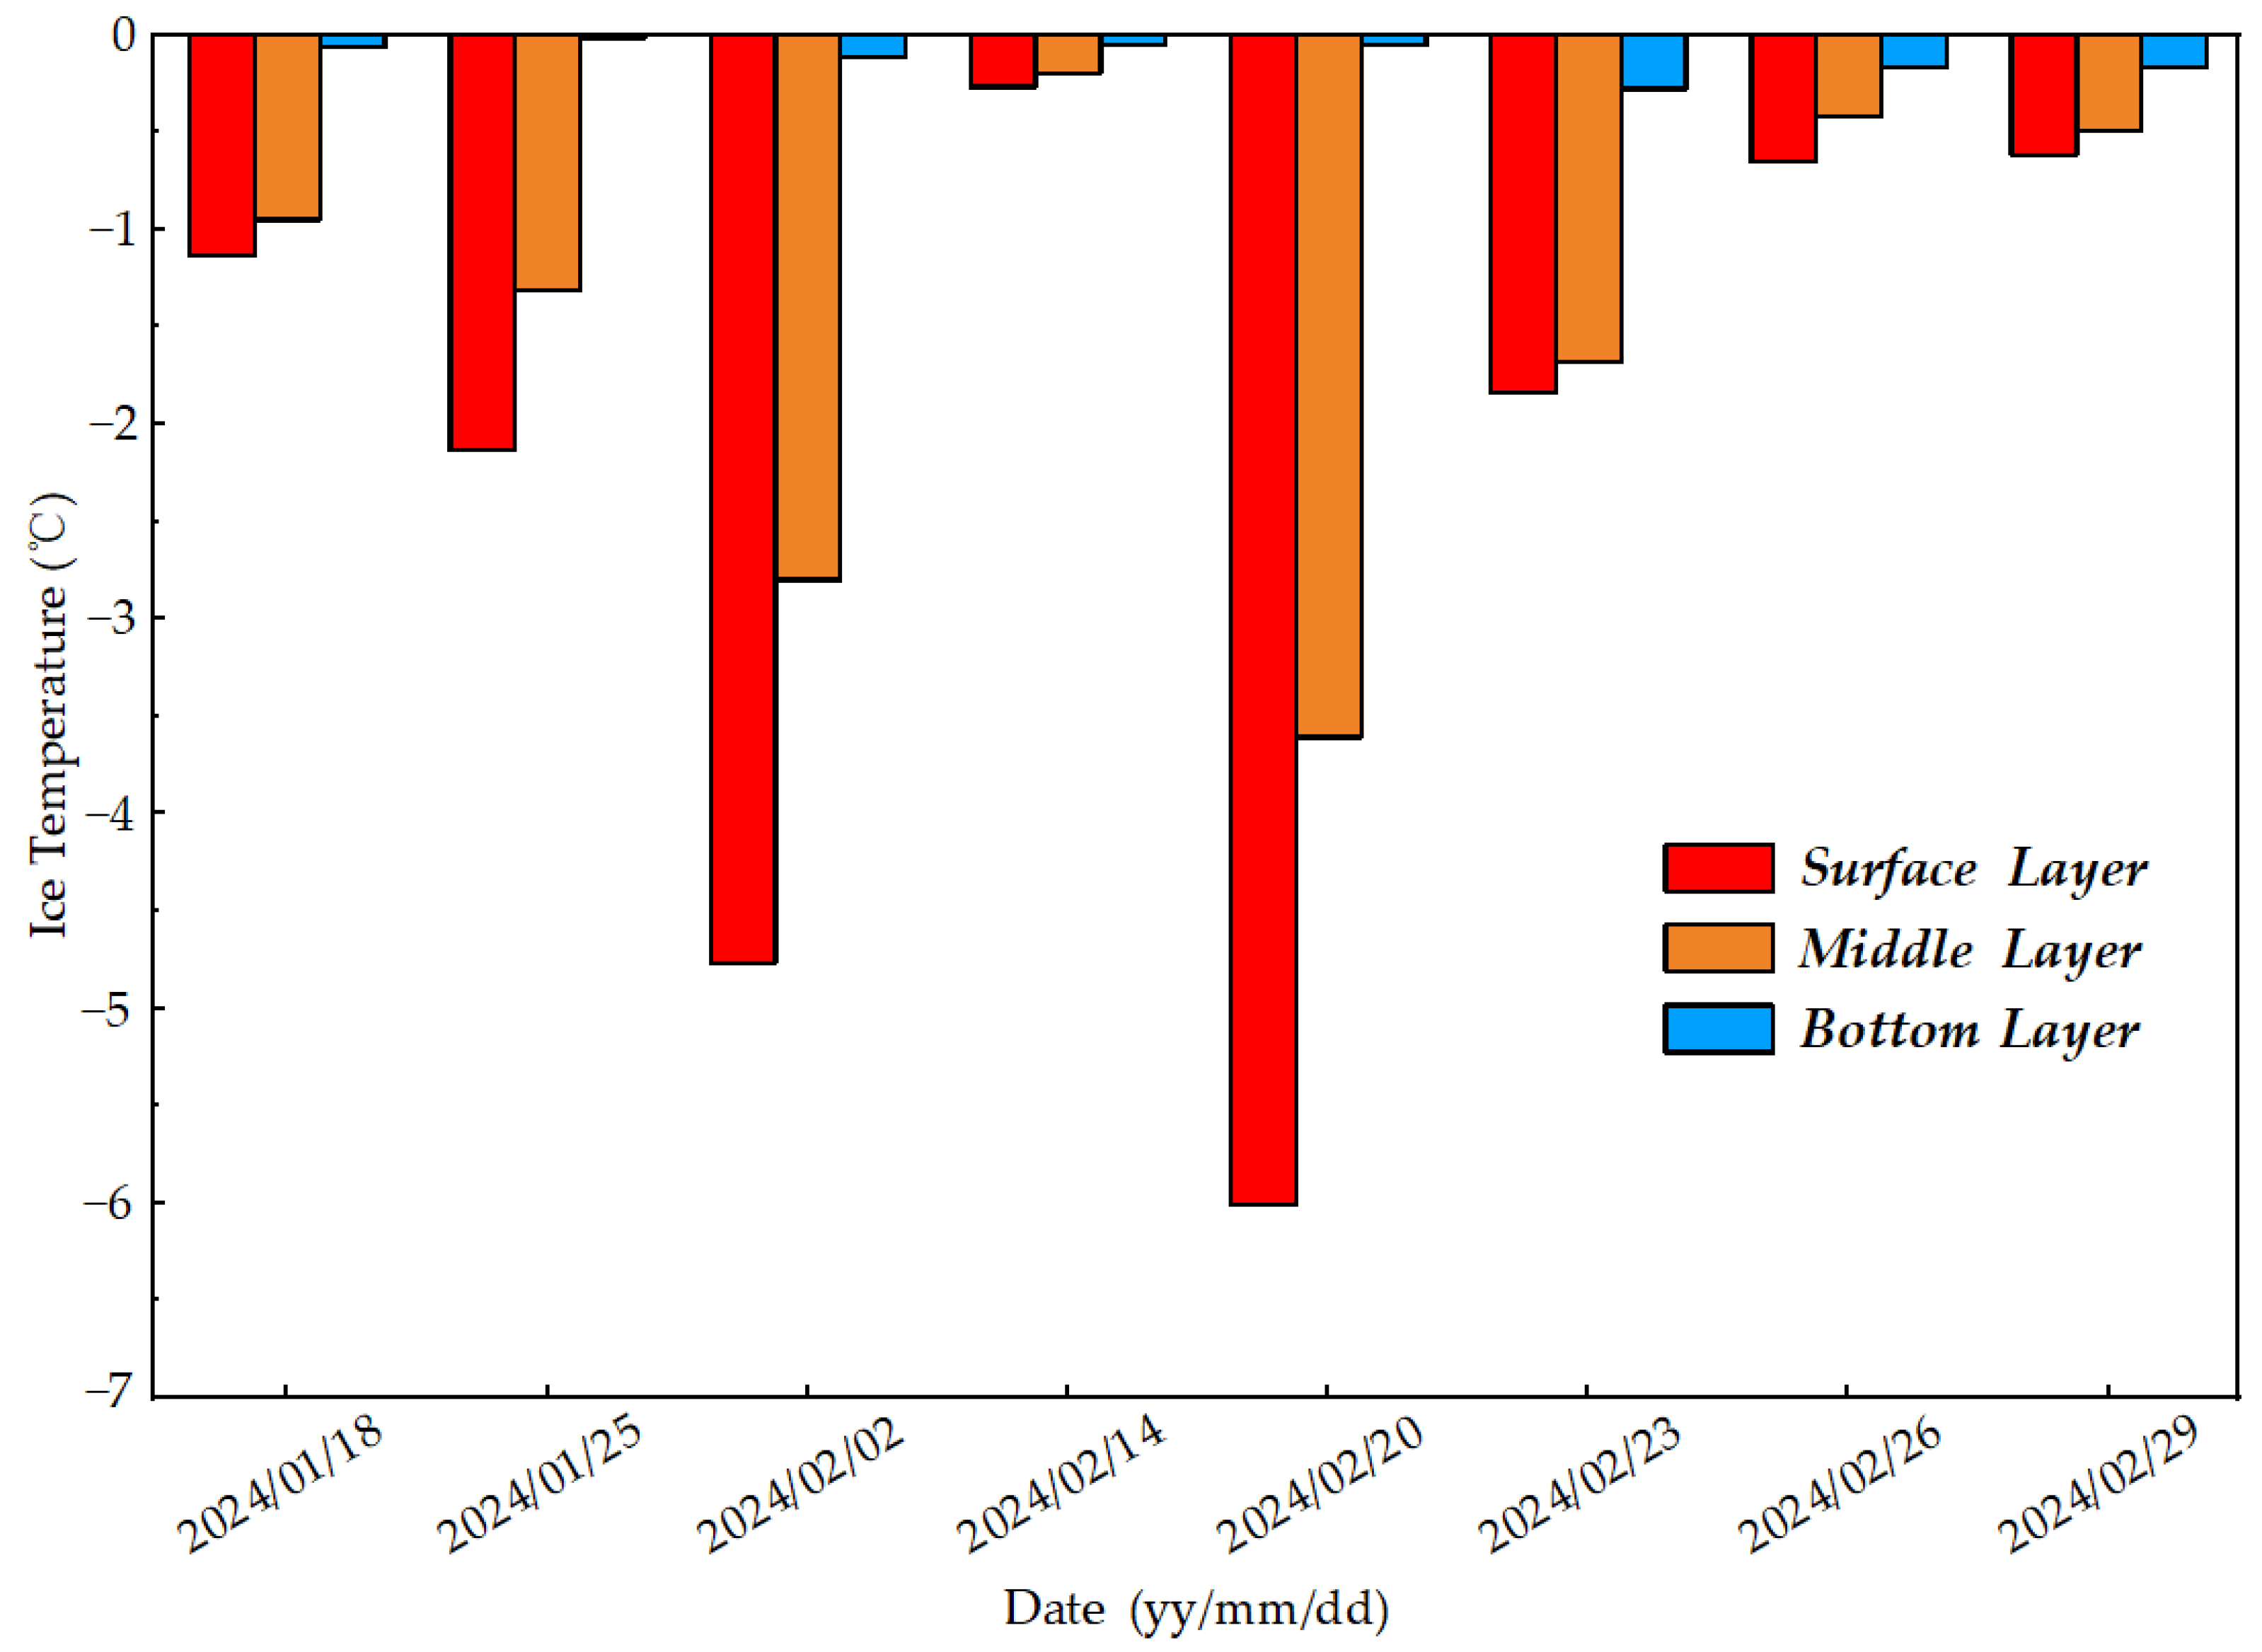
The sectioned ice cores—divided into three layers as specified in Section 2.1—exhibited an ice temperature range of −6.008 °C to −0.014 °C. Notable temperature fluctuations were observed in the middle and bottom layers during sampling on 2, 14, and 20 February 2024, which corresponded to abrupt changes in air temperature. As illustrated in Figure 4, the bottom layer showed minimal temperature variation (variance = 0.007), a phenomenon attributed to the stabilizing effect of the underlying lake water. In contrast, the surface layer displayed the highest temperature variability (variance = 4.426), resulting from its direct exposure to air temperature fluctuations at the air-ice interface.

3.2.2. Ice Salinity and Density

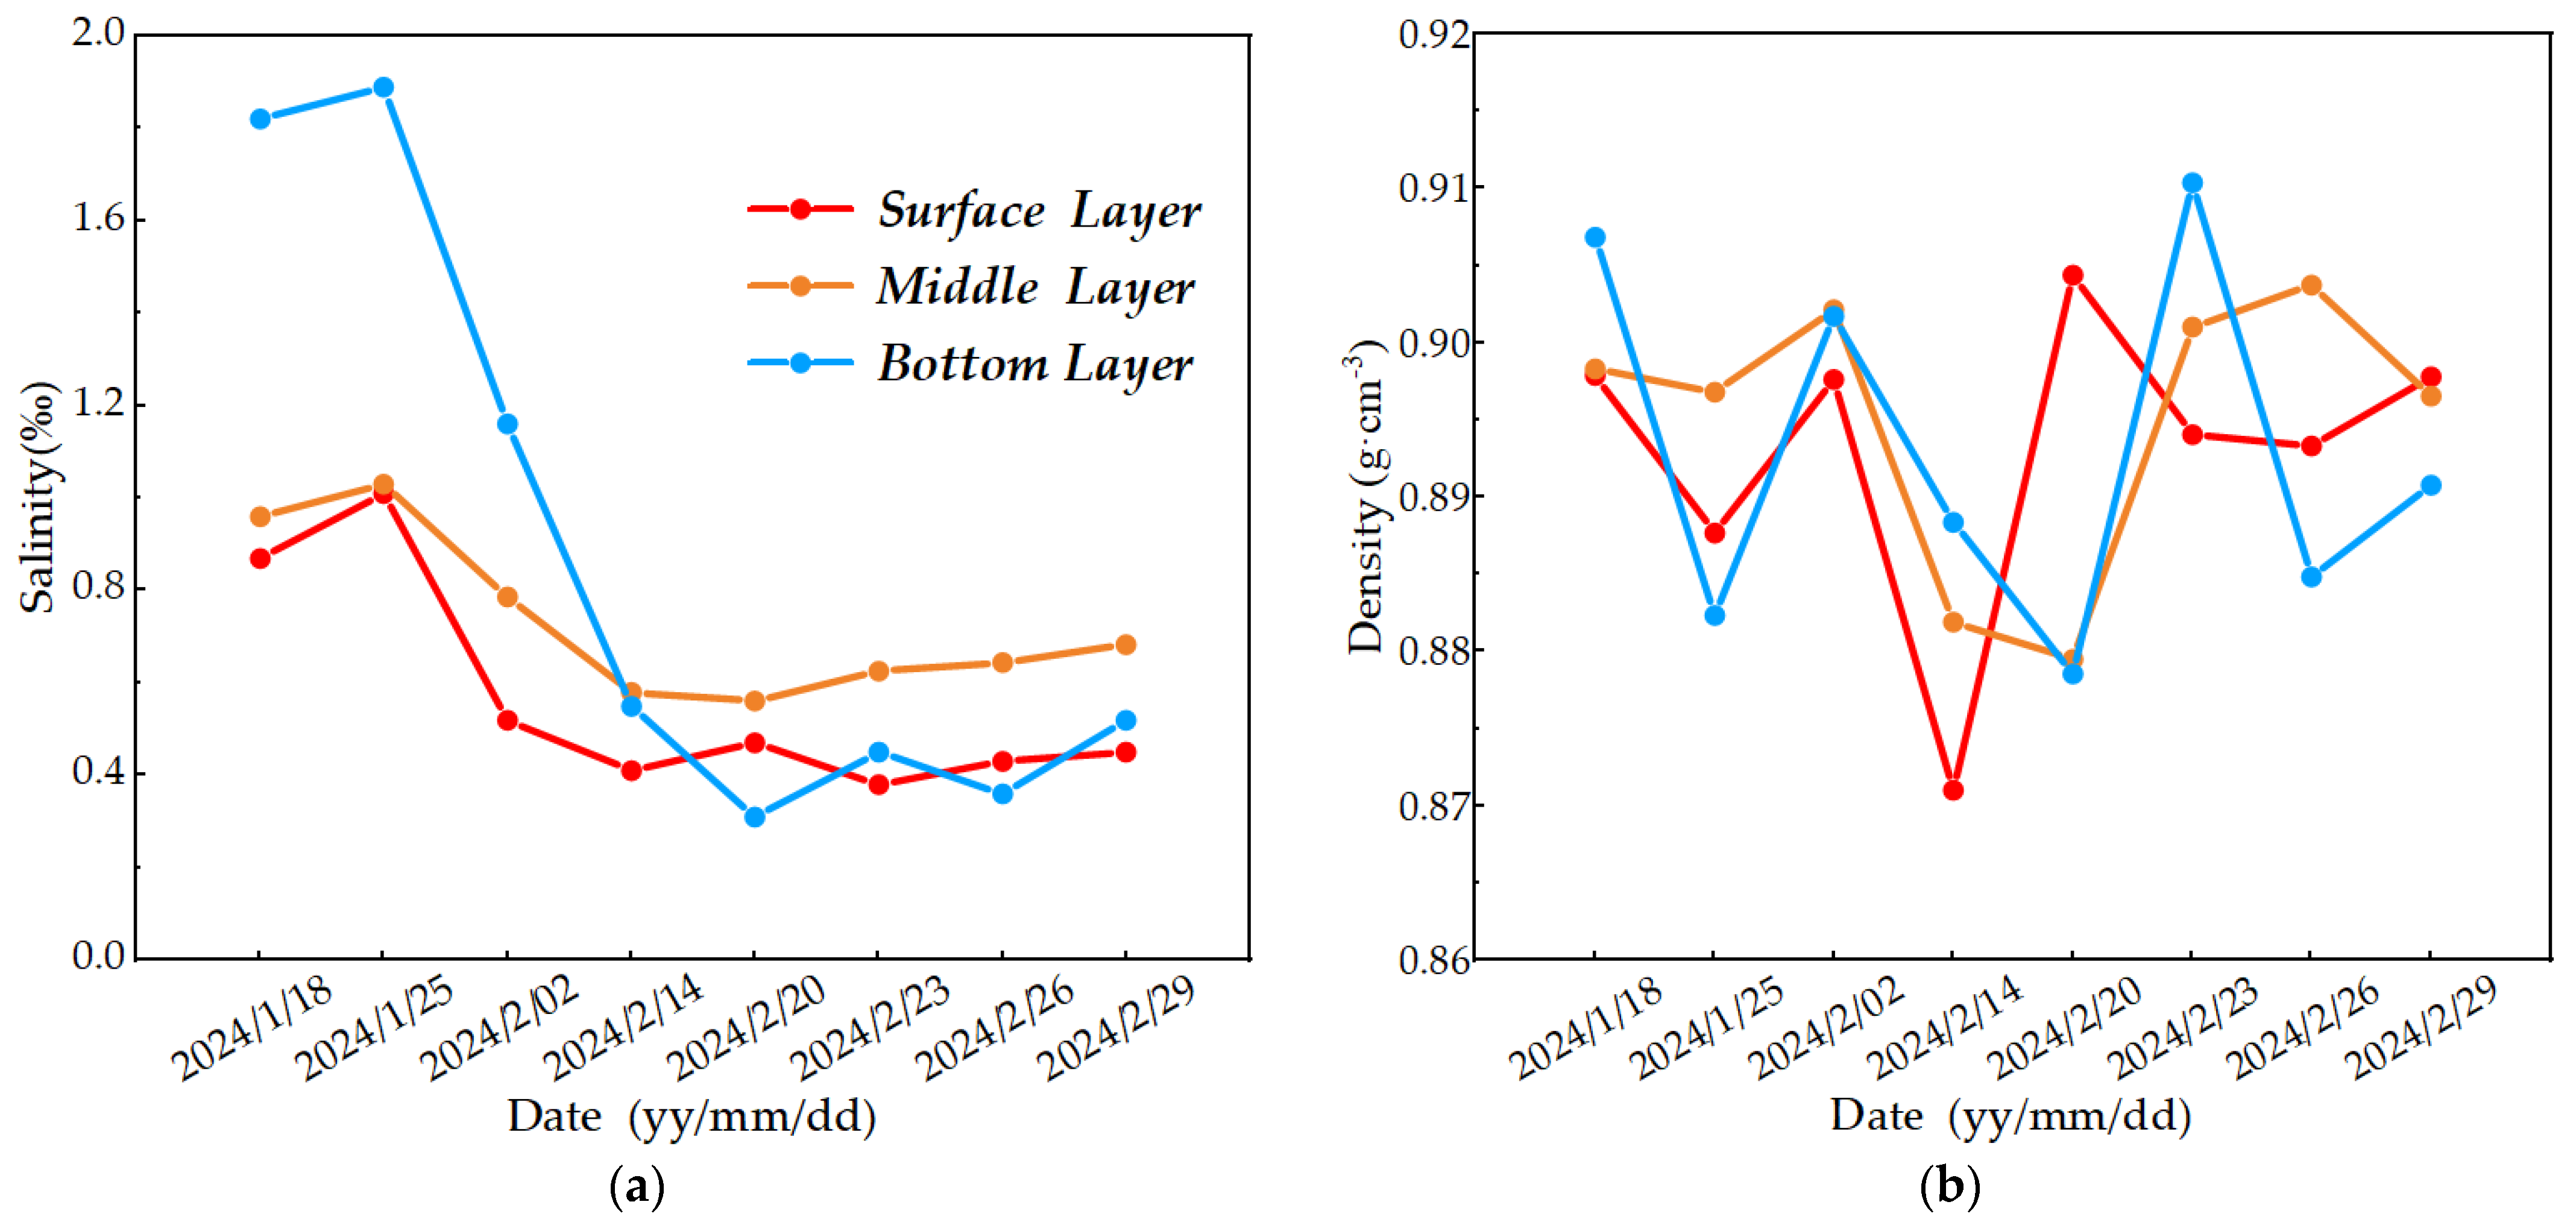
As illustrated in Figure 5a, ice salinity varied notably across layers (0.36‰–1.89‰). Salinity in all layers decreased initially before stabilizing. During early ice growth (18–25 January), brine entrapment caused a temporary salinity increase. The bottom layer showed the most pronounced fluctuations, with salinity decreasing at 0.217‰/week (r = −0.94, p < 0.001). Smaller variations occurred in the middle (0.046‰/week, r = −0.85, p < 0.01) and surface layers (0.060‰/week, r = −0.85, p < 0.01). The middle layer exhibited the most gradual changes, while temporal factors significantly influenced all layers.
As seen in Figure 5b, ice density across all layers fluctuated within the range of 0.87–0.91 g·cm−3, with an average variation rate of ±2.25%. Compared to ice salinity, density variations were smaller and exhibited no clear trend. Specifically, the average densities of the surface, middle, and bottom layers were 0.893 g·cm−3, 0.895 g·cm−3, and 0.893 g·cm−3, respectively. No significant differences were observed between layers (variance 0.0009), and all values were slightly lower than the density of pure ice (0.917 g·cm−3)—indicating the presence of pore structures and similar void features within the ice across all layers.

3.3. Variation in Ice Microstructure

3.3.1. Variation in Volume Fraction

Based on phase diagram calculations [14,15], the volume fractions of air bubbles (Va) and brine inclusions (Vb) ranged between 0.9–8.1% and 0.4–14.2%, respectively. As illustrated in Figure 6, brine inclusions exhibited more pronounced temporal variations compared to air bubbles. The average volume fractions of air bubbles in the surface, middle, and bottom ice layers were 3.0% ± 1.3%, 2.9% ± 1.1%, and 3.5% ± 2.1% (average ± standard deviation), respectively, and the corresponding values for brine inclusions were 4.0% ± 3.8%, 5.1% ± 3.9%, and 8.2% ± 3.3%. Maximum values for both components occurred on 14 February 2024, coinciding with peak ice temperatures (Figure 4). During 20 February, brine inclusion volumes initially rose by 11.3% (surface), 11.8% (middle), and 10.4% (bottom), and then declined by 11.4%, 12.4%, and 5.8%, respectively. Concurrently, air bubbles increased by 3.9%, 3.3%, and 6.0%, before decreasing by 4.7%, 0.9%, and 3.8%. Ice temperatures showed parallel trends across all layers: an initial increase of 4.50 °C, 2.60 °C, and 0.07 °C, followed by a decrease of 5.74 °C, 3.41 °C, and 0.01 °C across layers.

3.3.2. Variation in Ice Microstructure Size

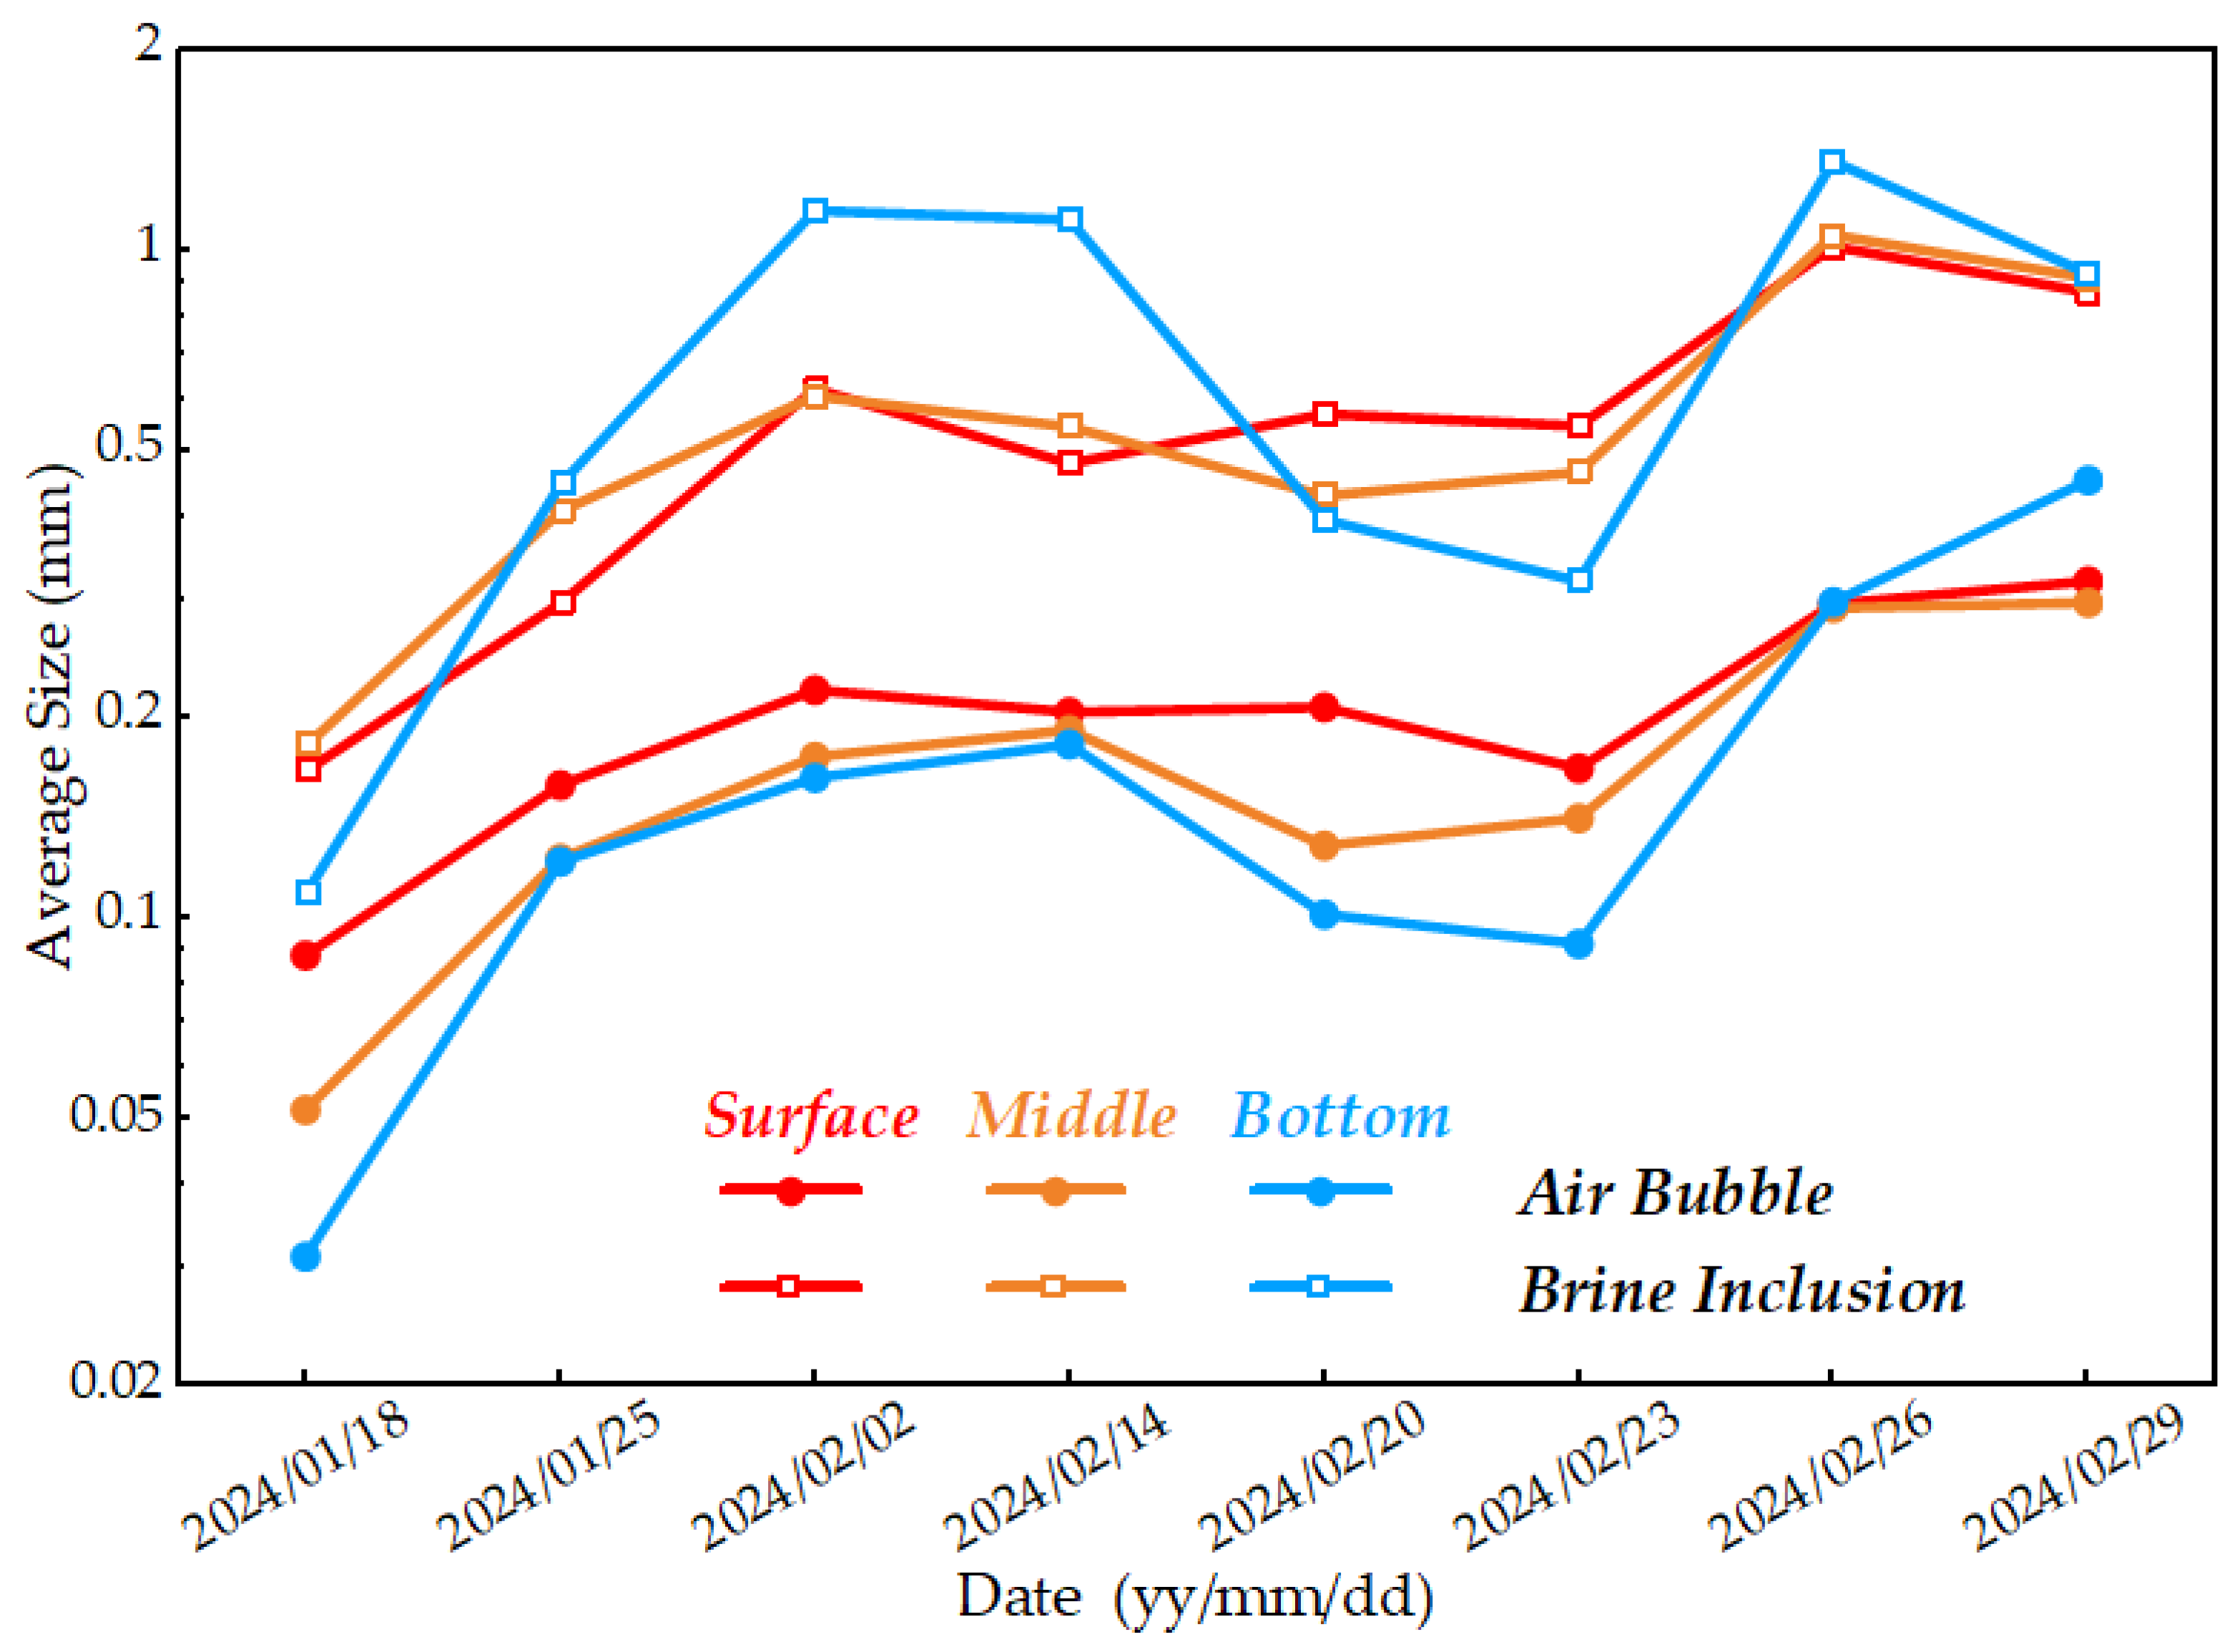
When conducting an in-depth investigation of ice microstructure characteristics, it is essential to examine not only changes in volume fraction but also variations in their sizes. As illustrated in Figure 7, the temporal changes in the average sizes of air bubbles (Lb) and brine inclusions (La) across different ice layers. From the figure, it can be clearly observed that in all ice cores collected on various sampling dates, the average size of brine inclusions was consistently larger than that of air bubbles. Specifically, the average sizes of air bubbles in the surface, middle, and bottom ice layers were 0.208 ± 0.070 mm, 0.175 ± 0.079 mm, and 0.181 ± 0.127 mm, respectively; the corresponding average sizes of brine inclusions were 0.571 ± 0.259 mm, 0.576 ± 0.265 mm, and 0.727 ± 0.433 mm, respectively. After normality tests, the data distribution showed no significant deviation from a normal distribution (R2 = 0.95, p > 0.0.5), satisfying the prerequisite assumptions for parametric correlation analysis. Further analysis reveals that in the three days prior to the sampling dates, specifically from 18 January to 2 February 2024, the average sizes of microstructures in all ice layers showed a clear growth trend. Combined with Figure 4, it is evident that this period coincided with the freezing phase of Lake Hanzhang ice, as well as the growth stage of brine inclusions and air bubbles. Additionally, the growth rates of brine inclusion sizes in the surface, middle, and bottom layers were 0.030 mm·d−1 (r = 0.98, p < 0.2), 0.028 mm·d−1 (r = 0.99, p < 0.05), and 0.069 mm·d−1 (r = 0.98, p < 0.1), respectively. Meanwhile, the growth rates of air bubble average sizes in the surface, middle, and bottom layers were 0.009 mm·d−1 (r = 0.99, p < 0.05), 0.008 mm·d−1 (r = 0.99, p < 0.1), and 0.009 mm·d−1 (r = 0.97, p < 0.2). However, a clear contrast is observed between the high sensitivity of volume fraction to decreasing ice temperature and the insensitivity of microstructure size to cooling, as shown in Figure 6 and Figure 7. The relatively rapid changes in bottom-ice microstructure can be explained by its permanent contact with the lake water. The resulting stable thermal environment near 0 °C promotes continuous and active structural reorganization at the ice-water interface. To elaborate, volume fraction is a thermodynamically sensitive parameter [14,15], whereas size represents a geometric morphological variable. During warming, microstructures undergo expansion and pore interconnection, leading to an increase in microstructure size. During cooling, however, brine channels tend to disconnect preferentially [5], reducing permeability while leaving the size of isolated brine pockets relatively unchanged—that is, size remains relatively insensitive to cooling. Moreover, since the brackish ice examined in this study has a low average salinity of 6.9‰, interactions between brine inclusions are further reduced, which enhances the insensitivity of inclusion size to cooling. Additionally, the analysis of central tendency metrics shows that the temporal evolution of both the average and median sizes followed highly consistent patterns and magnitudes of change across all ice layers. This visual alignment is strongly supported by a formal correlation analysis, which reveals an exceptionally strong and statistically significant relationship between the mean and median values across all ice layers (all r > 0.99, all p < 0.05). This indicates that both metrics consistently represent the central tendency of the inclusion size distribution. In contrast, the mode exhibits limited representativeness due to the broad dispersion of the size distribution.

3.4. Impact of Ice Temperature on Microstructure Size in Different Ice Layers

Further analysis demonstrates the influence of ice temperature on brine inclusion (Lb) and air bubble (La) sizes across ice layers. After excluding temperature lag points from 2, 14, and 20 February 2024 (marked with dashed circles in Figure 8), strong correlations were observed between ice temperature and brine inclusion sizes in surface (r = 0.73, p < 0.03; La = 0.976 + 0.333T) and middle layers (r = 0.70, p < 0.04; La = 1.071 + 0.481T). Similarly, air bubble sizes showed linear relationships in surface (r = 0.68, p < 0.03; Lb = 0.307 + 0.084T) and middle layers (r = 0.69, p < 0.05; Lb = 0.318 + 0.141T). Notably, no significant correlations were detected between ice temperature and the sizes of either component in the bottom layer (brine inclusions: r = −0.11, p < 0.1; air bubbles: r = −0.30, p < 0.2). In surface and middle layers, the sensitivity of brine inclusion sizes to temperature changes was approximately four times greater than that of air bubbles. For both brine inclusions and air bubbles, the middle layer exhibited higher rates of size change in response to temperature variations compared to the surface layer—revealing layered complexity in the thermal response characteristics of ice microstructures.
During data processing and analysis, this study found that on the three sampling days between 2 and 20 February 2024, parameters including ice temperature, as well as the size and volume fraction of ice microstructures, exhibited unstable fluctuations across all layers. This phenomenon is attributed to the extremely intense air temperature fluctuations during this period, characterized by sharp drops (ΔT = −19.8 °C) and rises (ΔT = 14.8 °C). Changes in air temperature directly drive corresponding changes in ice temperature [23,24], which in turn induce alteration in ice microstructure.
Combining the data analysis results, ice thickness peaked on 14 February; however, the sharp temperature rise observed prior to this sampling date indicates an asymmetry between changes in ice physical properties and air temperature variations. Further analysis reveals that on 2 and 20 February—sampling nodes following sharp temperature drops (Figure 3a)—measured ice microstructure sizes in the surface and middle layers exceeded the theoretical fitted values, despite lower ice temperatures (Figure 9). In contrast, on 14 February, a sampling node subsequent to a sharp temperature rise, measured ice microstructure sizes in the surface and middle layers were lower than the theoretical fitted values, even with higher ice temperatures. These observations align with previous studies: Light [12] found that brine inclusion sizes in sea ice did not immediately return to their original values after slow warming followed by sudden cooling; Crabeck [13] also observed in warming experiments that ice microstructure sizes required a certain amount of time to increase to stable values after warming, exhibiting a distinct “lag effect.” These prior studies corroborate the observations of this work, further validating the rationality and reliability of the conclusions drawn in this paper.

4. Discussion

4.1. Stratified Mechanisms of Temperature Response in Different Ice Layers and Their Microstructural Control Factors

Based on the temperature field data of Lake Hanzhang during its ice-covered period (Figure 3 and Figure 4), this section conducts an in-depth analysis of the physical mechanisms underlying the differential responses of various ice layers and the regulatory role of external environmental factors. Previous studies have indicated that air temperature plays a critical role in the evolution of saline ice [25]. To investigate how air temperature influences the microstructure of different ice layers, it is first essential to clarify the mechanism by which air temperature affects the ice temperature of these layers, and then to explore how ice temperature conditions modulate the ice microstructure.
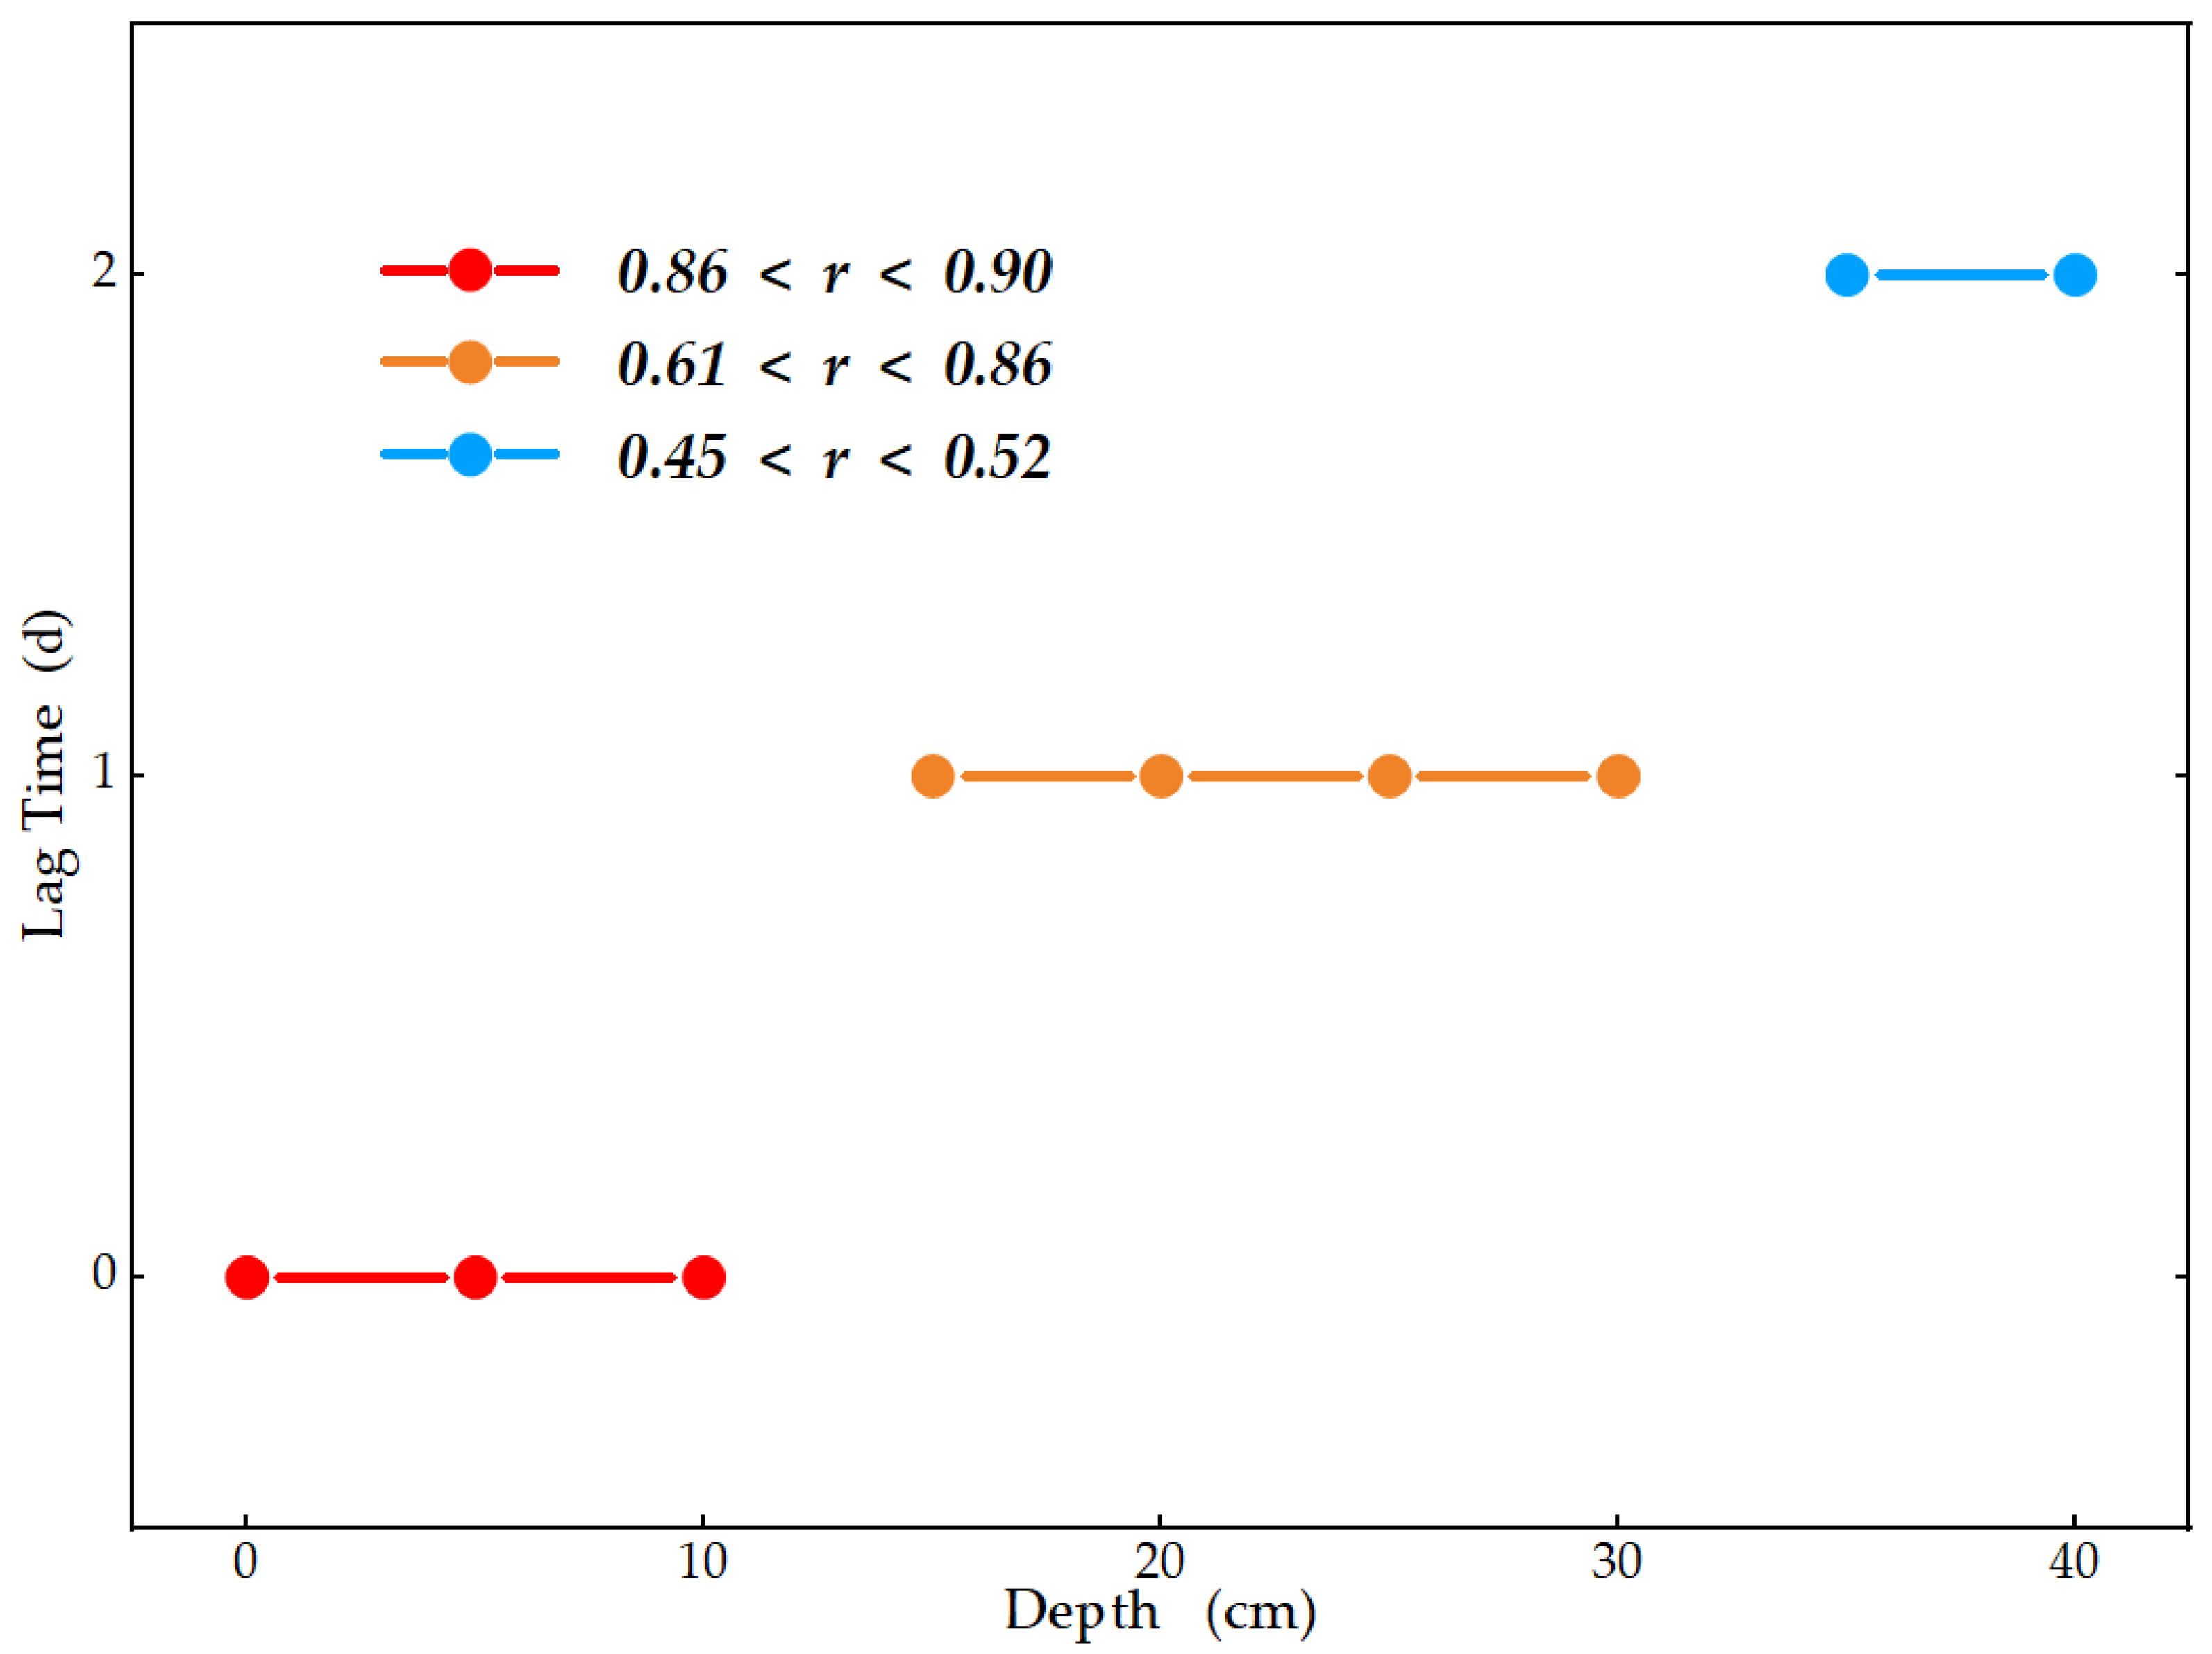
To examine the mechanism of air temperature’s influence on the ice temperature of different layers, this study selected air temperature and ice temperature data from snow-free periods on the ice surface (covering all 8 sampling days) between 18 January and 29 February 2024. Using a daily time step, lag correlation coefficients were calculated between ice temperature time series at different depths and air temperature time series. The time difference corresponding to the peak correlation coefficient was defined as the lag time, with specific results presented in Figure 9. The results indicate that as ice layer depth increases, the response of ice temperature to air temperature changes exhibits distinct stratified characteristics: the correlation of the temperature response gradually decreases, and the lag time significantly prolongs. Specifically, the surface ice layer (depth: 0–10 cm) shows an immediate response, with a lag time of 0 days and a high correlation coefficient of 0.86–0.88, indicating a significant correlation. The middle ice layer (depth: 15–30 cm) has an extended lag time of 1 day, and the correlation coefficient decreases to 0.61–0.85, reflecting a marked reduction in temperature response intensity. Near the bottom ice layer (depth: 35–40 cm), the lag time further extends to 2 days, and the correlation coefficient is only 0.47–0.51, indicating a weak correlation.
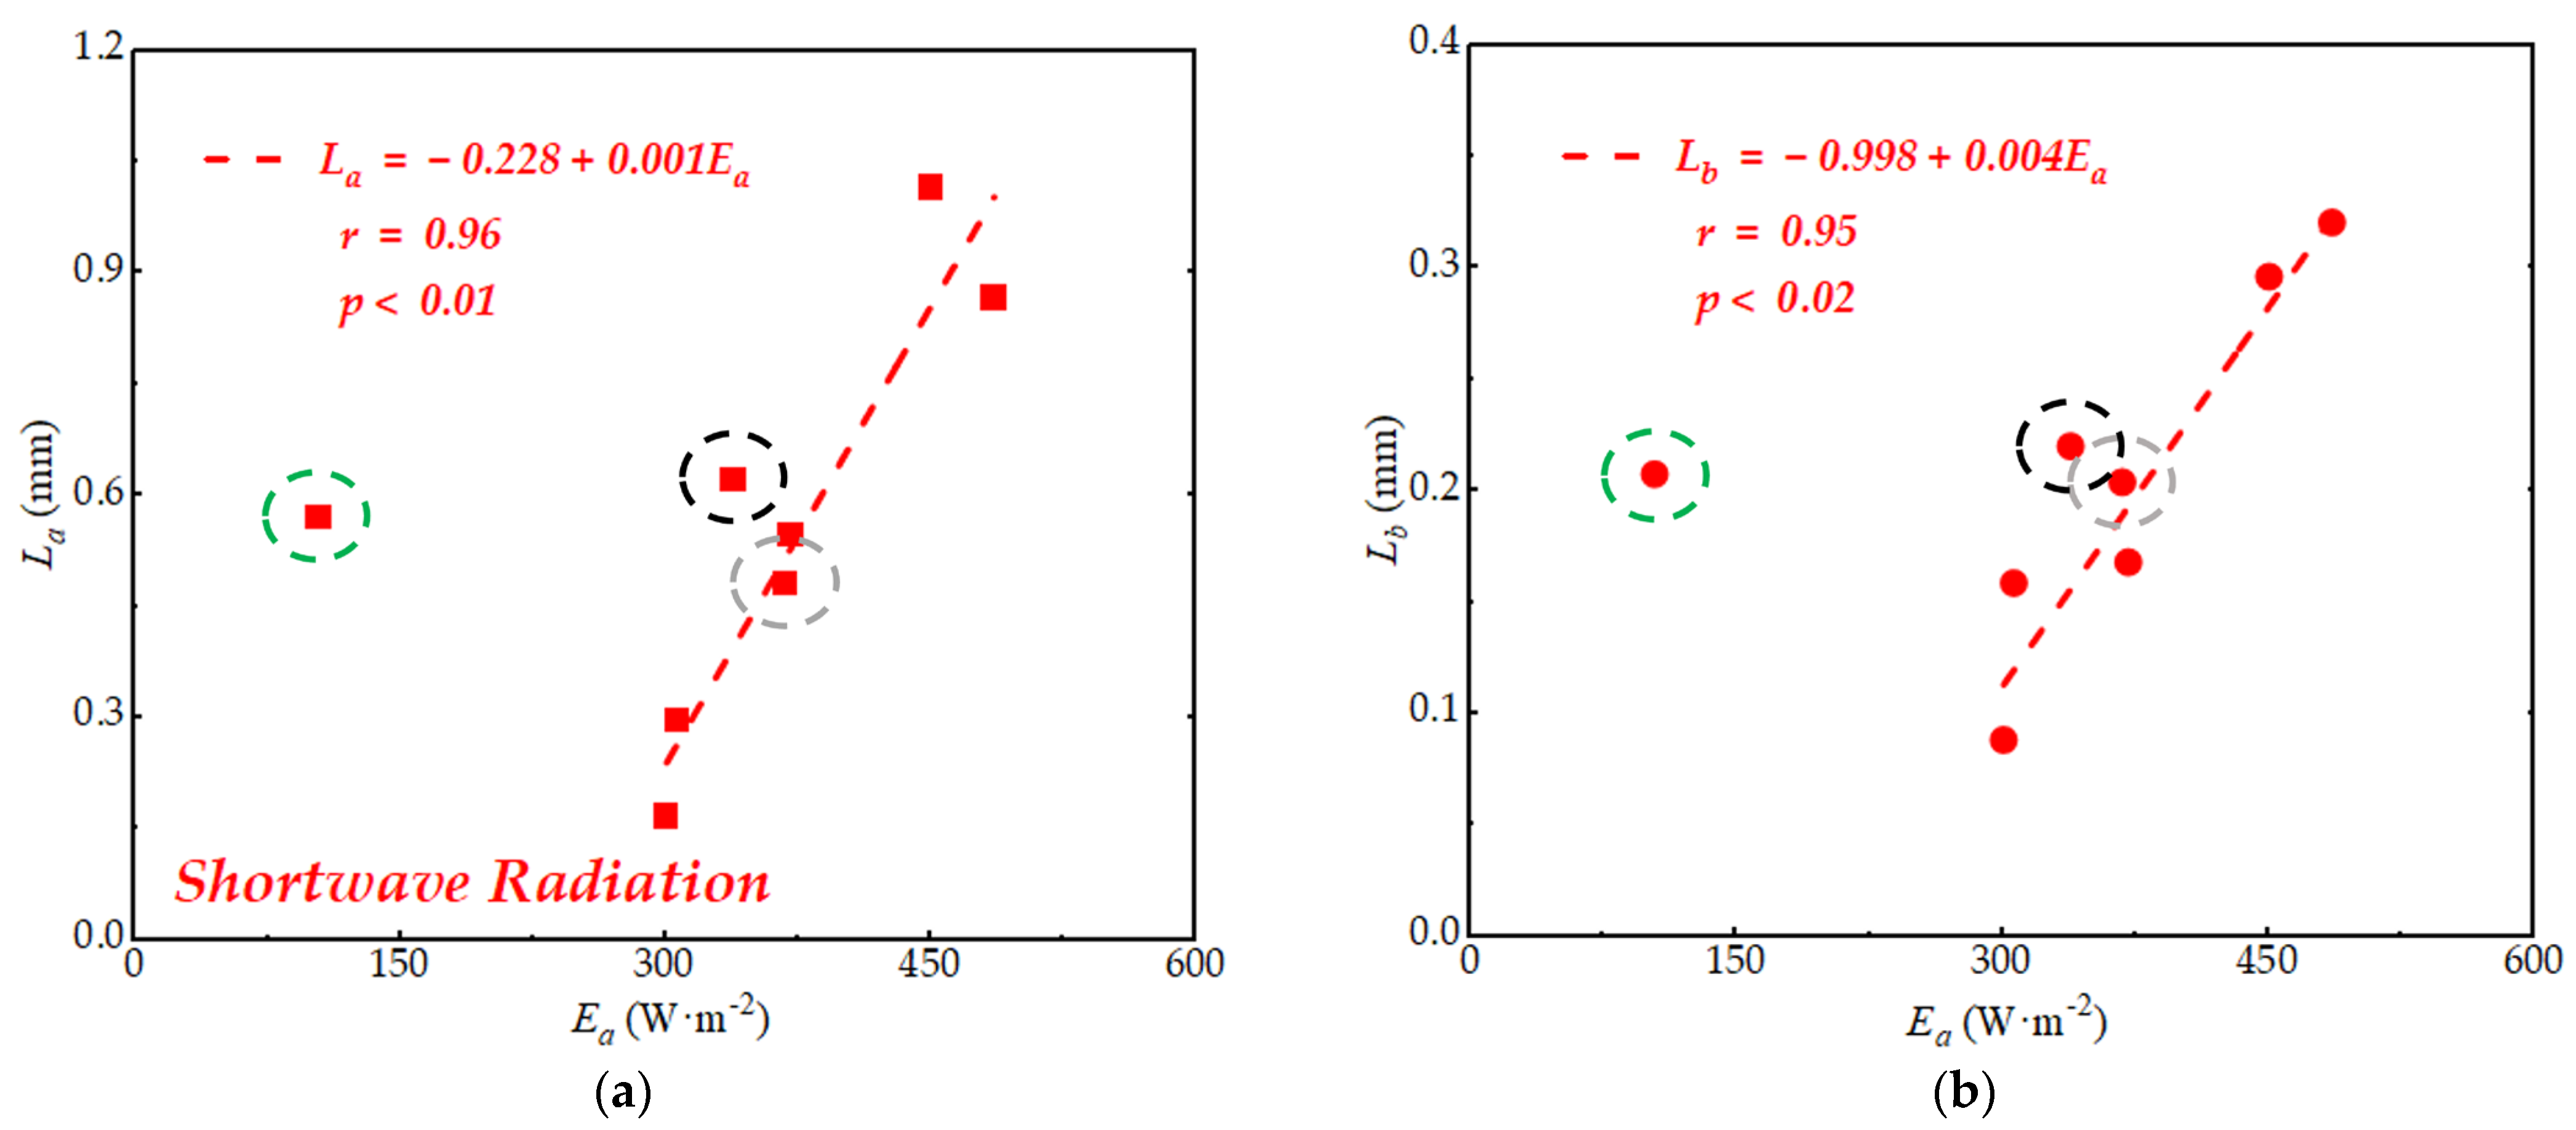
The surface ice is directly exposed to the air at the air-ice interface, and its temperature changes are highly synchronized with air temperature variations [23,24]. When studying the mechanism of how ice temperature influences microstructural changes in the surface ice, this study found a certain correlation between the temperature of the surface ice and the size changes of brine inclusions and air bubbles (as shown in Figure 8). However, due to the unique interfacial position of the surface ice, it is necessary to consider whether ice temperature is the decisive factor for microstructural changes. Further analysis indicates that solar radiation is the dominant factor influencing microstructural changes in the surface layer [4]. After the incident solar radiation flux (Ed) acts on the ice layer, it is primarily converted into three components [26,27], specifically expressed as:
  E d = E a + E r + E t
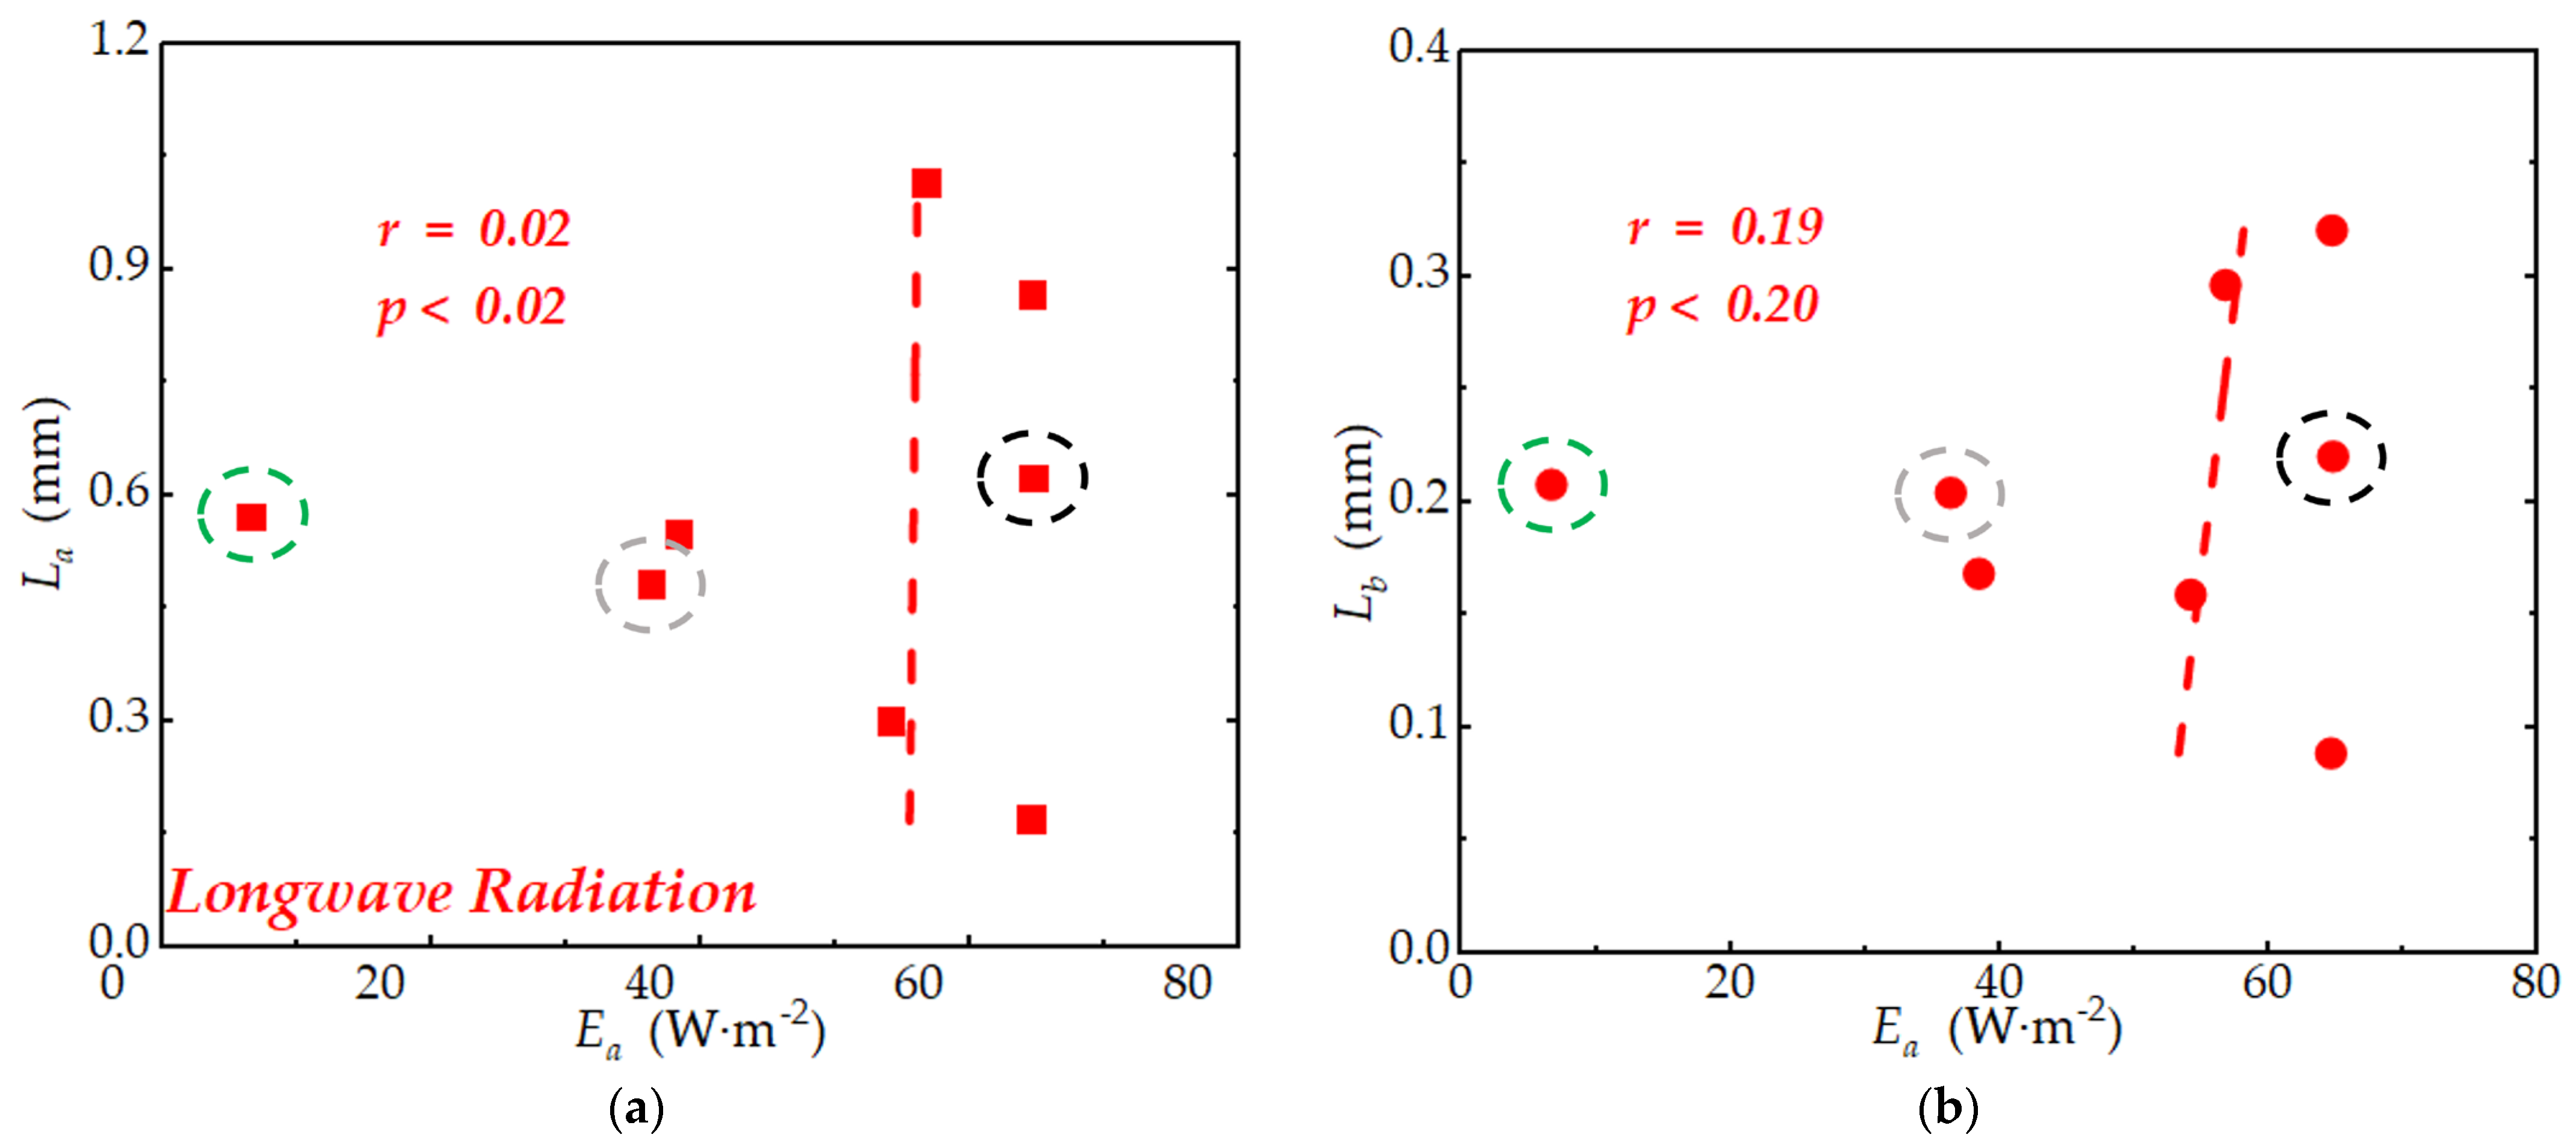
In the equation, Ea represents the absorbed radiation flux, Er represents the reflected radiation flux, and Et represents the transmitted radiation flux. In actual field experiments, since the transmitted radiation flux (Et) accounts for a relatively small proportion of the incident solar radiation flux (Ed) [28], and the ice layer contains a high content of impurities, it can be neglected in the radiation flux calculation. Only the impact of the radiation flux absorbed by the surface layer on the ice microstructure needs to be considered. Based on this classification, the discussion that follows examines shortwave and longwave radiation effects independently.
Figure 10 shows the relationship between the sizes of brine inclusions and air bubbles in the surface ice and the absorbed shortwave radiation intensity. After excluding the three temperature lag points (details in Section 3.4), it is clearly observed that the sizes of both brine inclusions and air bubbles increase with the rise in absorbed shortwave radiation flux, showing a significant positive correlation. Linear fitting analysis yields the relationship between brine inclusion size (Lb) and absorbed shortwave radiation flux (Ea) as: Lb = −0.228 + 0.001Ea (r = 0.96, p < 0.01); and the relationship between air bubble size (Lb) and absorbed shortwave radiation flux (Ea) as: Lb = −0.998 + 0.004Ea (r = 0.95, p < 0.02). These findings indicate that, compared to ice temperature, solar shortwave radiation plays a more crucial role in the size variations of brine inclusions and air bubbles in the surface layer. In contrast, Figure 11 shows the relationship between the absorbed longwave radiation flux and the size of surface-layer microstructures. No significant correlation is observed (Brine inclusions: r = 0.02, p < 0.02; Air Bubbles: r = 0.19, p < 0.20). Thus, absorbed longwave radiation is not considered to have a functional relationship with the microstructural size in the surface ice layer.
Ice temperature changes exert a relatively significant influence on the sizes of brine inclusions (Lb) and air bubbles (La) in the middle layer (Figure 8), and this effect is more pronounced compared to that in the surface layer. This characteristic of the middle layer can be attributed to its relatively unique physical environment: specifically, the middle ice layer is separated by a certain distance from both the overlying air and underlying lake water. As a result, its temperature changes are indirectly influenced by two factors—air temperature variations transmitted through the surface ice, and temperature fluctuations in the water beneath the bottom ice—leading to a moderate range of temperature variation in the middle layer. Furthermore, the middle ice layer is sandwiched between the surface and bottom ice layers. When ice temperature changes, the size variations of brine inclusions and air bubbles are constrained by both the surface and bottom ice [29]. Consequently, while a rise in ice temperature drives a significant increase in the sizes of these two components in the middle layer, such changes are further modulated by the constraints imposed by the adjacent surface and bottom ice. In previous studies [30,31], although ice temperature changes were shown to affect the microstructure of the middle ice layer to some extent, the influence was relatively weak, resulting in less noticeable changes in microstructure size. The discrepancy with the present study likely arises from the fact that prior research often focused on polar sea ice: its greater ice thickness leads to lower heat transfer efficiency between the surface and bottom layers [32], thereby reducing the magnitude of microstructure size changes. In contrast, this study investigates saline ice from Lake Hanzhang, which has a smaller ice thickness. The middle layer of this ice is more significantly affected by temperature variations in the surface and bottom layers [33,34], ultimately leading to a more pronounced microstructural response.
Unlike the surface and middle ice layers, the bottom ice is in direct contact with lake water, so its temperature is significantly influenced by water temperature [35], resulting in relatively small fluctuations. Under these conditions, the response of brine inclusion (Lb) and air bubble (La) sizes in the bottom ice to temperature is weaker and less obvious compared to the surface and middle layers. Additionally, this study found no clear correlation between bottom ice temperature and the sizes of these two components (as shown in Figure 8), suggesting to some extent that ice temperature is not the key factor governing microstructural size changes in the bottom ice. However, in contrast to the conclusions of this study, Golden [5] observed in their research that when ice temperature approached 0 °C (similar to the bottom ice temperature in this study), ice microstructure underwent significant changes, showing a clear correlation. An in-depth analysis of the reasons suggests that Golden’s study was conducted in a laboratory setting, focusing solely on phase transition processes within the ice’s internal structure. In contrast, this study was carried out in a natural environment where ice thickness changed dynamically during the experiment. When microstructural changes in the bottom layer reach a certain degree, they may become difficult to observe due to freezing growth or melting disappearance. This makes it challenging to capture the stage where microstructural changes in the bottom ice are most pronounced, consequently preventing a clear demonstration of the correlation between microstructural size and ice temperature in the bottom layer.

4.2. Comparison with Other Studies

Regarding the lag of temperature response within ice, in previous studies on Lake Hanzhang, Fei Xie [36] found that the lag time for ice temperature response at depths of 5–10 cm was 70–120 min (approximately 0.1 days), which is consistent with the immediate response (0 days) observed in the surface layer of this study. For other regions, Puzhen Huo [37] found in their study of Lake Ulansu that, when there was no snow cover, the ice temperature at depths of 3–12 cm responded immediately (0 days) to air temperature, consistent with the corresponding depth in this study. Similarly, Ruibo Lei [38], in their study of Antarctic Lake ice, found a lag time of 0.8 days at a depth of 30 cm, which aligns well with the 15–30 cm depth layer in this study. At a depth of 37.5 cm, the lag time was 1 day, whereas in this study, the lag time in the bottom layer (35–40 cm) was 2 days. This difference is attributed to variations in ice thickness: the ice thickness in this study was 40 cm, while in Ruibo Lei’s [38] study, it was 102 cm—significantly greater than the lake ice thickness in this study. The vertical heat conduction flux within the ice layer is primarily related to air temperature and ice thickness. Under the same air temperature conditions, greater ice thickness results in a smaller vertical heat conduction flux within the ice, leading to a longer lag time for the ice temperature response to air temperature changes. This essentially reveals the ice thickness dependence in the heat conduction process through which air temperature influences ice temperature: greater ice thickness reduces the vertical heat conduction flux within the ice, exacerbating the delay in temperature response.
Inter-layer differences in heat conduction efficiency further regulate the evolution of ice microstructure. This is evident in the full life cycle of brackish ice [39], as documented in studies of its seasonal evolution during growth and decay processes, which provide a comprehensive background for the dynamic changes in microstructure. In Nordic lakes, the systematic analysis by Leppäranta [35] emphasizes that the spatiotemporal heterogeneity of snow cover regulates the thermal gradient within the ice layer, thereby governing the vertical distribution patterns of ice crystal structure, growth rate, and microstructural features (air bubbles and brine inclusions). The critical influence of microstructure on macroscopic properties is further highlighted by Ladefoged’s work on Swedish lake ice [40], which demonstrates that crystal size and bubble distribution are key determinants of the ice’s compressive strength. Bock [41], in a warming experiment on Arctic first-year sea ice using magnetic resonance imaging, found that when the ice temperature was greater than −14 °C, the volume fraction of brine inclusions and the size of air bubbles within the ice increased with rising ice temperature. Furthermore, Lieb-Lappen [42], using CT scans on sea ice from the Ross Sea, Antarctica, found that when sea ice temperature increased from −20 °C to −16 °C, the volume fractions of brine inclusions and air bubbles increased from 6.2% to 10.0% and from 0.78% to 0.88%, respectively. Brine inclusions exhibited greater sensitivity to ice temperature compared to air bubbles. The field observations in this study further extend this understanding: in the surface and middle layers with relatively efficient heat conduction, the rate of size change for brine inclusions is four times that of air bubbles. In contrast, in the bottom layer with sluggish heat transfer, the weakened heat flux conduction caused by ice thickness results in no significant correlation between microstructure response and ice temperature.
Integrating the multi-scale observational data, the temperature-microstructure coupling mechanism established in this study is not limited to Lake Hanzhang. Despite differences in thermodynamic boundary conditions across regions, the response patterns formed within ice bodies through heat conduction-phase transition processes possess cross-regional universality. This universality provides data support for subsequent thermodynamic studies of polar-mid-latitude ice bodies and holds significant value for improving the parameterization schemes of climate models.

4.3. Limitations and Future Work

While this study provides a quantified, layer-resolved analysis of temperature-microstructure relationships in saline ice, several limitations should be acknowledged. First, the research primarily focused on thermodynamic drivers and did not explicitly incorporate the potential influence of other environmental factors—such as snow cover—that can substantially alter the thermal regime of ice. Furthermore, although a “lag effect” was identified, it has not been quantitatively modeled, which represents a critical direction for future mechanistic investigations

5. Conclusions

To thoroughly investigate the specific mechanisms underlying temperature effects on the microstructure of saline ice, this study conducted field ice core sampling and observational experiments at Lake Hanzhang during the winter period (December 2023–March 2024). Systematic data on the physical properties of ice cores were collected, and high-resolution imaging and image processing techniques were employed. The principal conclusions are as follows:
A significant response mechanism exists between the microstructure of saline ice and ice temperature. Specifically, in the surface and middle ice layers, the sizes of brine inclusions (Lb) and air bubbles (La) increase with rising ice temperature, showing a strong correlation. The sensitivity of brine inclusion size to ice temperature is four times that of air bubbles, indicating a more intense response of brine inclusion size to temperature changes. The response to ice temperature varies significantly across different ice layers: Changes in the surface ice microstructure are primarily dominated by solar radiation, with a significantly stronger correlation with solar radiation than to ice temperature. Constrained by both the surface and bottom layers, the middle ice layer exhibits approximately 1.5 times the ice temperature sensitivity in microstructure size compared to the surface layer, and its microstructure is mainly regulated by ice temperature. In contrast, the bottom ice is in direct contact with lake water, and its temperature is directly influenced by water temperature, resulting in minimal fluctuations. No significant correlation was observed between bottom-ice microstructure and ice temperature, a phenomenon that warrants further investigation.
Notably, the response of ice temperature to air temperature changes differs across ice layers, with lag times increasing from 0 days (surface layer) to 2 days (bottom layer). Abrupt air temperature changes lead to a “lag effect” in the subsequent microstructural response. Future work should employ computed tomography (CT) scanning to obtain three-dimensional images of the internal ice structure. This approach will enable quantification of brine inclusion connectivity—rather than size alone—and help clarify its relationship with the stable underlying water temperature and thermal conditions at the ice-water interface.
The quantitatively established temperature-microstructure relationships from this study can significantly improve the parameterization schemes in lake ice and climate models. Specifically, these layer-specific, quantitative response functions can be directly applied to dynamically compute the sizes of brine inclusions and air bubbles within the ice, thereby enabling more accurate simulation of key properties such as optical albedo and thermal conductivity. For instance, parameterizing the strong correlation between the size of brine inclusions in the surface layer and absorbed radiation can enhance the model’s representation of the ice-albedo positive feedback process. Similarly, the temperature-size relationship identified for the middle ice layer can optimize the calculation of internal heat transport. These advancements will effectively reduce biases in current models—such as those in simulating ice cover evolution, internal melting, and energy budget—that arise from the lack of microphysical processes, ultimately providing a more reliable tool for predicting the response of regional lake ice to climate change.

Author Contributions

H.L.: Investigation, Methodology, Formal analysis, Writing—original draft. M.Y.: Supervision, Investigation, Methodology. P.L. and Q.W.: Supervision. All authors have read and agreed to the published version of the manuscript.

Funding

This study was supported by the National Natural Science Foundation of China (42406244, 42320104004, U24A20582, 42276242, 52325108), the Postdoctoral Fellowship Program of CPSF (GZB20230102), and the Joint Funds of the National Natural Science Foundation of Liaoning Province (2023-BSBA-021).

Data Availability Statement

The original contributions presented in this study are included in the article. Further inquiries can be directed to the corresponding author.

Conflicts of Interest

The authors declare no conflicts of interest.

References

  1. Petrich, C.; Eicken, H. Overview of sea ice growth and properties. In Sea Ice; John Wiley & Sons, Ltd.: Chichester, UK, 2017; pp. 1–41. [Google Scholar]
  2. Hunke, E.; Notz, D.; Turner, A.; Vancoppenolle, M. The multiphase physics of sea ice. Sea 2011, 5, 1949–1993. [Google Scholar]
  3. Lund-Hansen, L.; Søgaard, D.; Sorrell, B.; Gradinger, R.; Meiners, K. Arctic Sea Ice Ecology; Springer: Berlin/Heidelberg, Germany, 2020. [Google Scholar]
  4. Yu, M.; Lu, P.; Cheng, B.; Leppäranta, M.; Li, Z. Impact of microstructure on solar radiation transfer within sea ice during summer in the Arctic: A model sensitivity study. Front. Mar. Sci. 2022, 9, 861994. [Google Scholar] [CrossRef]
  5. Golden, K.; Eicken, H.; Heaton, A.; Miner, J.; Pringle, D.; Zhu, J. Thermal evolution of permeability and microstructure in sea ice. Geophys. Res. Lett. 2007, 34, L16501. [Google Scholar] [CrossRef]
  6. Sandven, H.; Hamre, B.; Petit, T.; Röttgers, R.; Liu, H.; Granskog, M. Seasonality and drivers of water column optical properties on the northwestern Barents Sea shelf. Prog. Oceanogr. 2023, 217, 103076. [Google Scholar] [CrossRef]
  7. Thielke, L.; Huntemann, M.; Hendricks, S.; Jutila, A.; Ricker, R.; Spreen, G. Sea ice surface temperatures from helicopter-borne thermal infrared imaging during the MOSAiC expedition. Sci. Data 2022, 9, 364. [Google Scholar] [CrossRef]
  8. Kaleschke, L.; Tian-Kunze, X.; Hendricks, S.; Ricker, R. SMOS-derived Antarctic thin sea ice thickness: Data description and validation in the Weddell Sea. Earth Syst. Sci. Data 2024, 16, 3149–3170. [Google Scholar] [CrossRef]
  9. Zhang, Y.; Zhang, Y.; Guo, R.; Cui, B. Method for testing shear and tensile strengths of freshwater/seawater ice. Water 2022, 14, 1363. [Google Scholar] [CrossRef]
  10. Salomon, M.; Maus, S.; Petrich, C. Microstructure evolution of young sea ice from a Svalbard fjord using micro-CT analysis. J. Glaciol. 2022, 68, 571–590. [Google Scholar] [CrossRef]
  11. Light, B.; Maykut, G.; Grenfell, T. A temperature-dependent, structural-optical model of first-year sea ice. J. Geophys. Res. Ocean. 2004, 109, C06013. [Google Scholar] [CrossRef]
  12. Light, B.; Maykut, G.; Grenfell, T. Effects of temperature on the microstructure of first-year Arctic sea ice. J. Geophys. Res. Ocean. 2003, 108, 3051. [Google Scholar] [CrossRef]
  13. Crabeck, O.; Galley, R.; Mercury, L.; Delille, B.; Tison, J.; Rysgaard, S. Evidence of freezing pressure in sea ice discrete brine inclusions and its impact on aqueous-gaseous equilibrium. J. Geophys. Res. Ocean. 2019, 124, 1660–1678. [Google Scholar] [CrossRef]
  14. Cox, G.; Weeks, W. Equations for determining the gas and brine volumes in sea-ice samples. J. Glaciol. 1983, 29, 306–316. [Google Scholar] [CrossRef]
  15. Leppäranta, M.; Manninen, T. The Brine and Gas Content of Sea Ice with Attention to Low Salinities and High Temperatures; Finnish Institute for Marine Research: Helsinki, Finland, 1988. [Google Scholar]
  16. Bailey, D.; Holland, M.; DuVivier, A.; Hunke, E.; Turner, A. Impact of a new sea ice thermodynamic formulation in the CESM2 sea ice component. J. Adv. Model. Earth Syst. 2020, 12, e2020MS002154. [Google Scholar] [CrossRef]
  17. Perovich, D.; Gow, A. A quantitative description of sea ice inclusions. J. Geophys. Res. Ocean. 1996, 101, 18327–18343. [Google Scholar] [CrossRef]
  18. Cole, D.; Shapiro, L. Observations of brine drainage networks and microstructure of first-year sea ice. J. Geophys. Res. Ocean. 1998, 103, 21739–21750. [Google Scholar] [CrossRef]
  19. Frantz, C.; Light, B.; Farley, S.; Carpenter, S.; Lieblappen, R.; Courville, Z.; Orellana, M.; Junge, K. Physical and optical characteristics of heavily melted “rotten” Arctic sea ice. Cryosphere 2019, 13, 775–793. [Google Scholar] [CrossRef]
  20. Xie, F.; Lu, P.; Leppäranta, M.; Cheng, B.; Li, Z.; Zhang, Y.; Zhang, H.; Zhou, J. Heat budget of lake ice during a complete seasonal cycle in lake Hanzhang, northeast China. J. Hydrol. 2023, 620, 129461. [Google Scholar] [CrossRef]
  21. Liu, T.; Zhang, Y.; Li, Z.; Yu, M.; Xie, F.; Georgiy, K.; Yang, Z. Optical properties of ice in a shallow Chinese lake (Hanzhang) with consequent impacts on primary production. Sci. Total Environ. 2024, 957, 177512. [Google Scholar] [CrossRef]
  22. Stringer, C.; Wang, T.; Michaelos, M.; Pachitariu, M. Cellpose: A generalist algorithm for cellular segmentation. Nat. Methods 2021, 18, 100–106. [Google Scholar] [CrossRef]
  23. Shuman, C.; Hall, D.; DiGirolamo, N.; Mefford, T.; Schnaubelt, M. Comparison of near-surface air temperatures and MODIS ice-surface temperatures at Summit, Greenland (2008–2013). J. Appl. Meteorol. Climatol. 2014, 53, 2171–2180. [Google Scholar] [CrossRef]
  24. Lindsay, R.; Rothrock, D. Arctic sea ice surface temperature from AVHRR. J. Clim. 1994, 7, 174–183. [Google Scholar] [CrossRef]
  25. Stefan, J. Über die Theorie der Eisbildung, insbesondere über die Eisbildung im Polarmeere. Ann. Der Phys. 1891, 278, 269–286. [Google Scholar] [CrossRef]
  26. Smith, M.; Light, B.; Macfarlane, A.; Perovich, D.; Holland, M.; Shupe, M. Sensitivity of the Arctic sea ice cover to the summer surface scattering layer. Geophys. Res. Lett. 2022, 49, e2022GL098349. [Google Scholar] [CrossRef]
  27. Müller, R.; Pfeifroth, U. Remote sensing of solar surface radiation–a reflection of concepts, applications and input data based on experience with the effective cloud albedo. Atmos. Meas. Tech. 2022, 15, 1537–1561. [Google Scholar] [CrossRef]
  28. Zhao, J.; Zhang, S.; Jiao, Y.; Li, T. The shortwave solar radiation energy absorbed by packed sea ice in the central Arctic. Adv. Earth Sci. 2009, 24, 33–41. [Google Scholar]
  29. Marchenko, A.; Lishman, B. The influence of closed brine pockets and permeable brine channels on the thermo-elastic properties of saline ice. Philos. Trans. R. Soc. A Math. Phys. Eng. Sci. 2017, 375, 20150351. [Google Scholar] [CrossRef]
  30. Eicken, H. From the microscopic, to the macroscopic, to the regional scale: Growth, microstructure and properties of sea ice. In Sea Ice: An Introduction to Its Physics, Chemistry, Biology and Geology; Finnish Institute for Marine Research: Helsinki, Finland, 2003; pp. 22–81. [Google Scholar]
  31. Petrich, C.; Eicken, H. Growth, structure and properties of sea ice. In Sea Ice; Wiley-Blackwell: Hoboken, NJ, USA, 2010; Volume 2, pp. 23–77. [Google Scholar]
  32. Malm, J.; Terzhevik, A.; Bengtsson, L.; Boyarinov, P.; Glinsky, A.; Palshin, N.; Petrov, M. Temperature and salt content regimes in three shallow ice-covered lakes: 1. Temperature, salt content, and density structure. Hydrol. Res. 1997, 28, 99–128. [Google Scholar] [CrossRef]
  33. Kirillin, G.; Engelhardt, C.; Golosov, S.; Hintze, T. Basin-scale internal waves in the bottom boundary layer of ice-covered Lake Müggelsee, Germany. Aquat. Ecol. 2009, 43, 641–651. [Google Scholar] [CrossRef]
  34. Shatwell, T.; Thiery, W.; Kirillin, G. Future projections of temperature and mixing regime of European temperate lakes. Hydrol. Earth Syst. Sci. 2019, 23, 1533–1551. [Google Scholar] [CrossRef]
  35. Leppäranta, M. Structure and properties of lake ice. In Freezing of Lakes and the Evolution of Their Ice Cover; Springer: Berlin/Heidelberg, Germany, 2023; pp. 63–108. [Google Scholar]
  36. Xie, F.; Zhang, Y.; Lu, P.; Cao, X.; Zu, Y.; Li, Z. Characteristics and influencing factors of lake ice growth and decay in a shallow lake from a cold region. J. Lake Sci. 2021, 33, 1552–1563. [Google Scholar] [CrossRef]
  37. Huo, P.; Lu, P.; Xie, F.; Wang, Q.; Li, Z.; Arvola, L. Numerical simulation of the complete process of lake ice formation and melting in Lake Ulansu. Adv. Water Sci. 2024, 35, 145–155. [Google Scholar]
  38. Lei, R.; Li, Z.; Zhang, Z.; Cheng, Y. Comparisons of thermodynamic processes between lake ice and landfast sea ice around Zhongshan Station, East Antarctica. Chin. J. Polar Res. 2011, 23, 289. [Google Scholar]
  39. Yu, M.; Lu, P.; Zhang, H.; Zhang, G.; Wang, L.; Wang, Q.; Li, Z. Seasonal evolution of brackish ice microstructure during growth and decay processes. Cold Reg. Sci. Technol. 2025, 242, 104740. [Google Scholar] [CrossRef]
  40. Ladefoged, J. Microstructures and Compressive Strength of Lake Ice in Sweden A structural Documentation and Compressive Strength Analysis of Lake Ice Cores from Uppsala, Using the SonReb Method. Master’s Thesis, University of Gothenburg, Gothenburg, Sweden, 2023. [Google Scholar]
  41. Bock, C.; Eicken, H. A magnetic resonance study of temperature-dependent microstructural evolution and self-diffusion of water in Arctic first-year sea ice. Ann. Glaciol. 2005, 40, 179–184. [Google Scholar] [CrossRef]
  42. Lieb-Lappen, R.; Golden, E.; Obbard, R. Metrics for interpreting the microstructure of sea ice using X-ray micro-computed tomography. Cold Reg. Sci. Technol. 2017, 138, 24–35. [Google Scholar] [CrossRef]
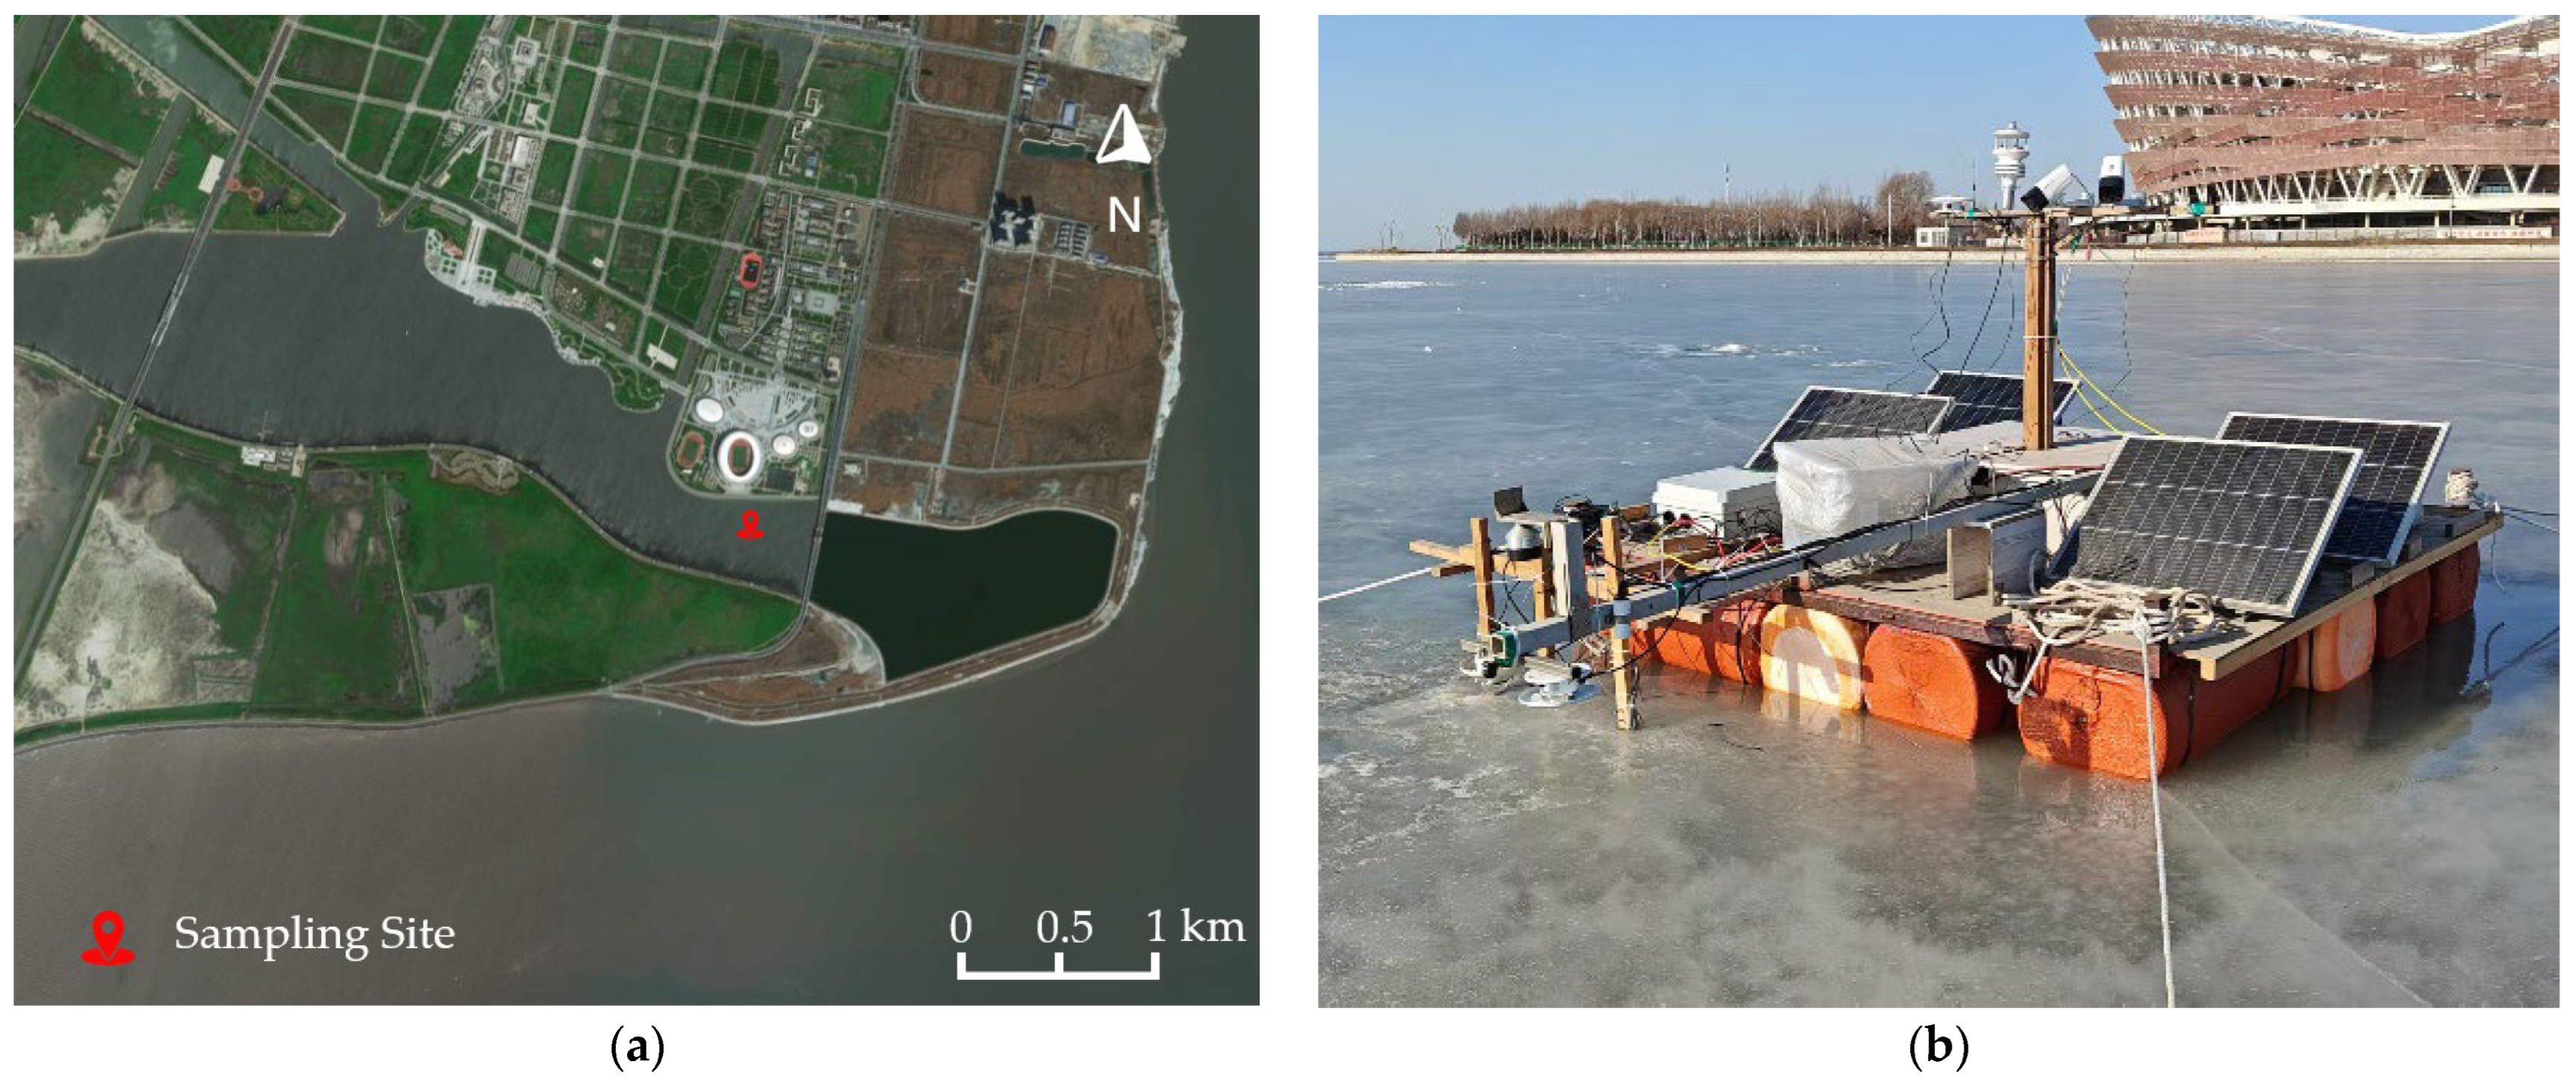
Figure 1. (a) Experimental site, with the red marker indicating the sampling location; (b) Floating observation platform.
Water 17 03343 g001
Figure 2. (a) Before processing; (b) Processed image. Arrows 1 and 2 indicate air bubbles, and arrow 3 indicates a brine inclusion.
Water 17 03343 g002
Figure 3. (a) Air temperature/Skin temperature variation; (b) Incident/Reflected radiation flux (Ed/Er) variation; (c) Ice thickness evolution and vertical temperature distribution within the ice during the observation period. The gray lines indicate the respective ice core sampling dates.
Water 17 03343 g003
Figure 4. Variation in Ice Temperature with Time.
Water 17 03343 g004
Figure 5. Variations in (a) salinity and (b) density of different ice layers with time.
Water 17 03343 g005
Figure 6. Variations in (a) brine inclusion and (b) air bubble volume fractions with time.
Water 17 03343 g006
Figure 7. Variations in average sizes of brine inclusions and air bubbles in different ice layers.
Water 17 03343 g007
Figure 8. Relationships between ice temperature and the sizes of (ac) brine inclusions and (df) air bubbles in different ice layers. The circled data points represent temperature lag points, indicating that when temperature changes abruptly within a short period, changes in ice microstructure sizes exhibit a lag effect. Black, gray, and green dashed circles mark the temperature lag points recorded on 2, 14, and 20 February 2024, respectively.
Water 17 03343 g008
Figure 9. Lag time of ice temperature response to air temperature changes at different depths.
Water 17 03343 g009
Figure 10. Relationship between absorbed shortwave radiation intensity (Ea) and (a) brine inclusion size (La); (b) air bubble size (Lb) in the surface layer. Black, gray, and green dashed circles denote 2, 14, and 20 February 2024, respectively, and were excluded from the linear regression analysis.
Water 17 03343 g010
Figure 11. Relationship between absorbed longwave radiation intensity (Ea) and (a) brine inclusion size (La); (b) air bubble size (Lb) in the surface layer. Black, gray, and green dashed circles denote 2, 14, and 20 February 2024, respectively, and were excluded from the linear regression analysis.
Water 17 03343 g011
Disclaimer/Publisher’s Note: The statements, opinions and data contained in all publications are solely those of the individual author(s) and contributor(s) and not of MDPI and/or the editor(s). MDPI and/or the editor(s) disclaim responsibility for any injury to people or property resulting from any ideas, methods, instructions or products referred to in the content.