Machine Learning Prediction of River Freeze-Up Dates Under Human Interventions: Insights from the Ningxia–Inner Mongolia Reach of the Yellow River
Abstract
1. Introduction
2. Materials and Methods
2.1. Study Area
2.2. Dataset
- Starting from 1 November, calculate the cumulative temperature within a sliding window:
- 2.
- Given a threshold , identify the first date that meets the threshold condition ( < θ), and calculate the number of days from 1 November (Dy (w, θ)), y denotes the year.
- 3.
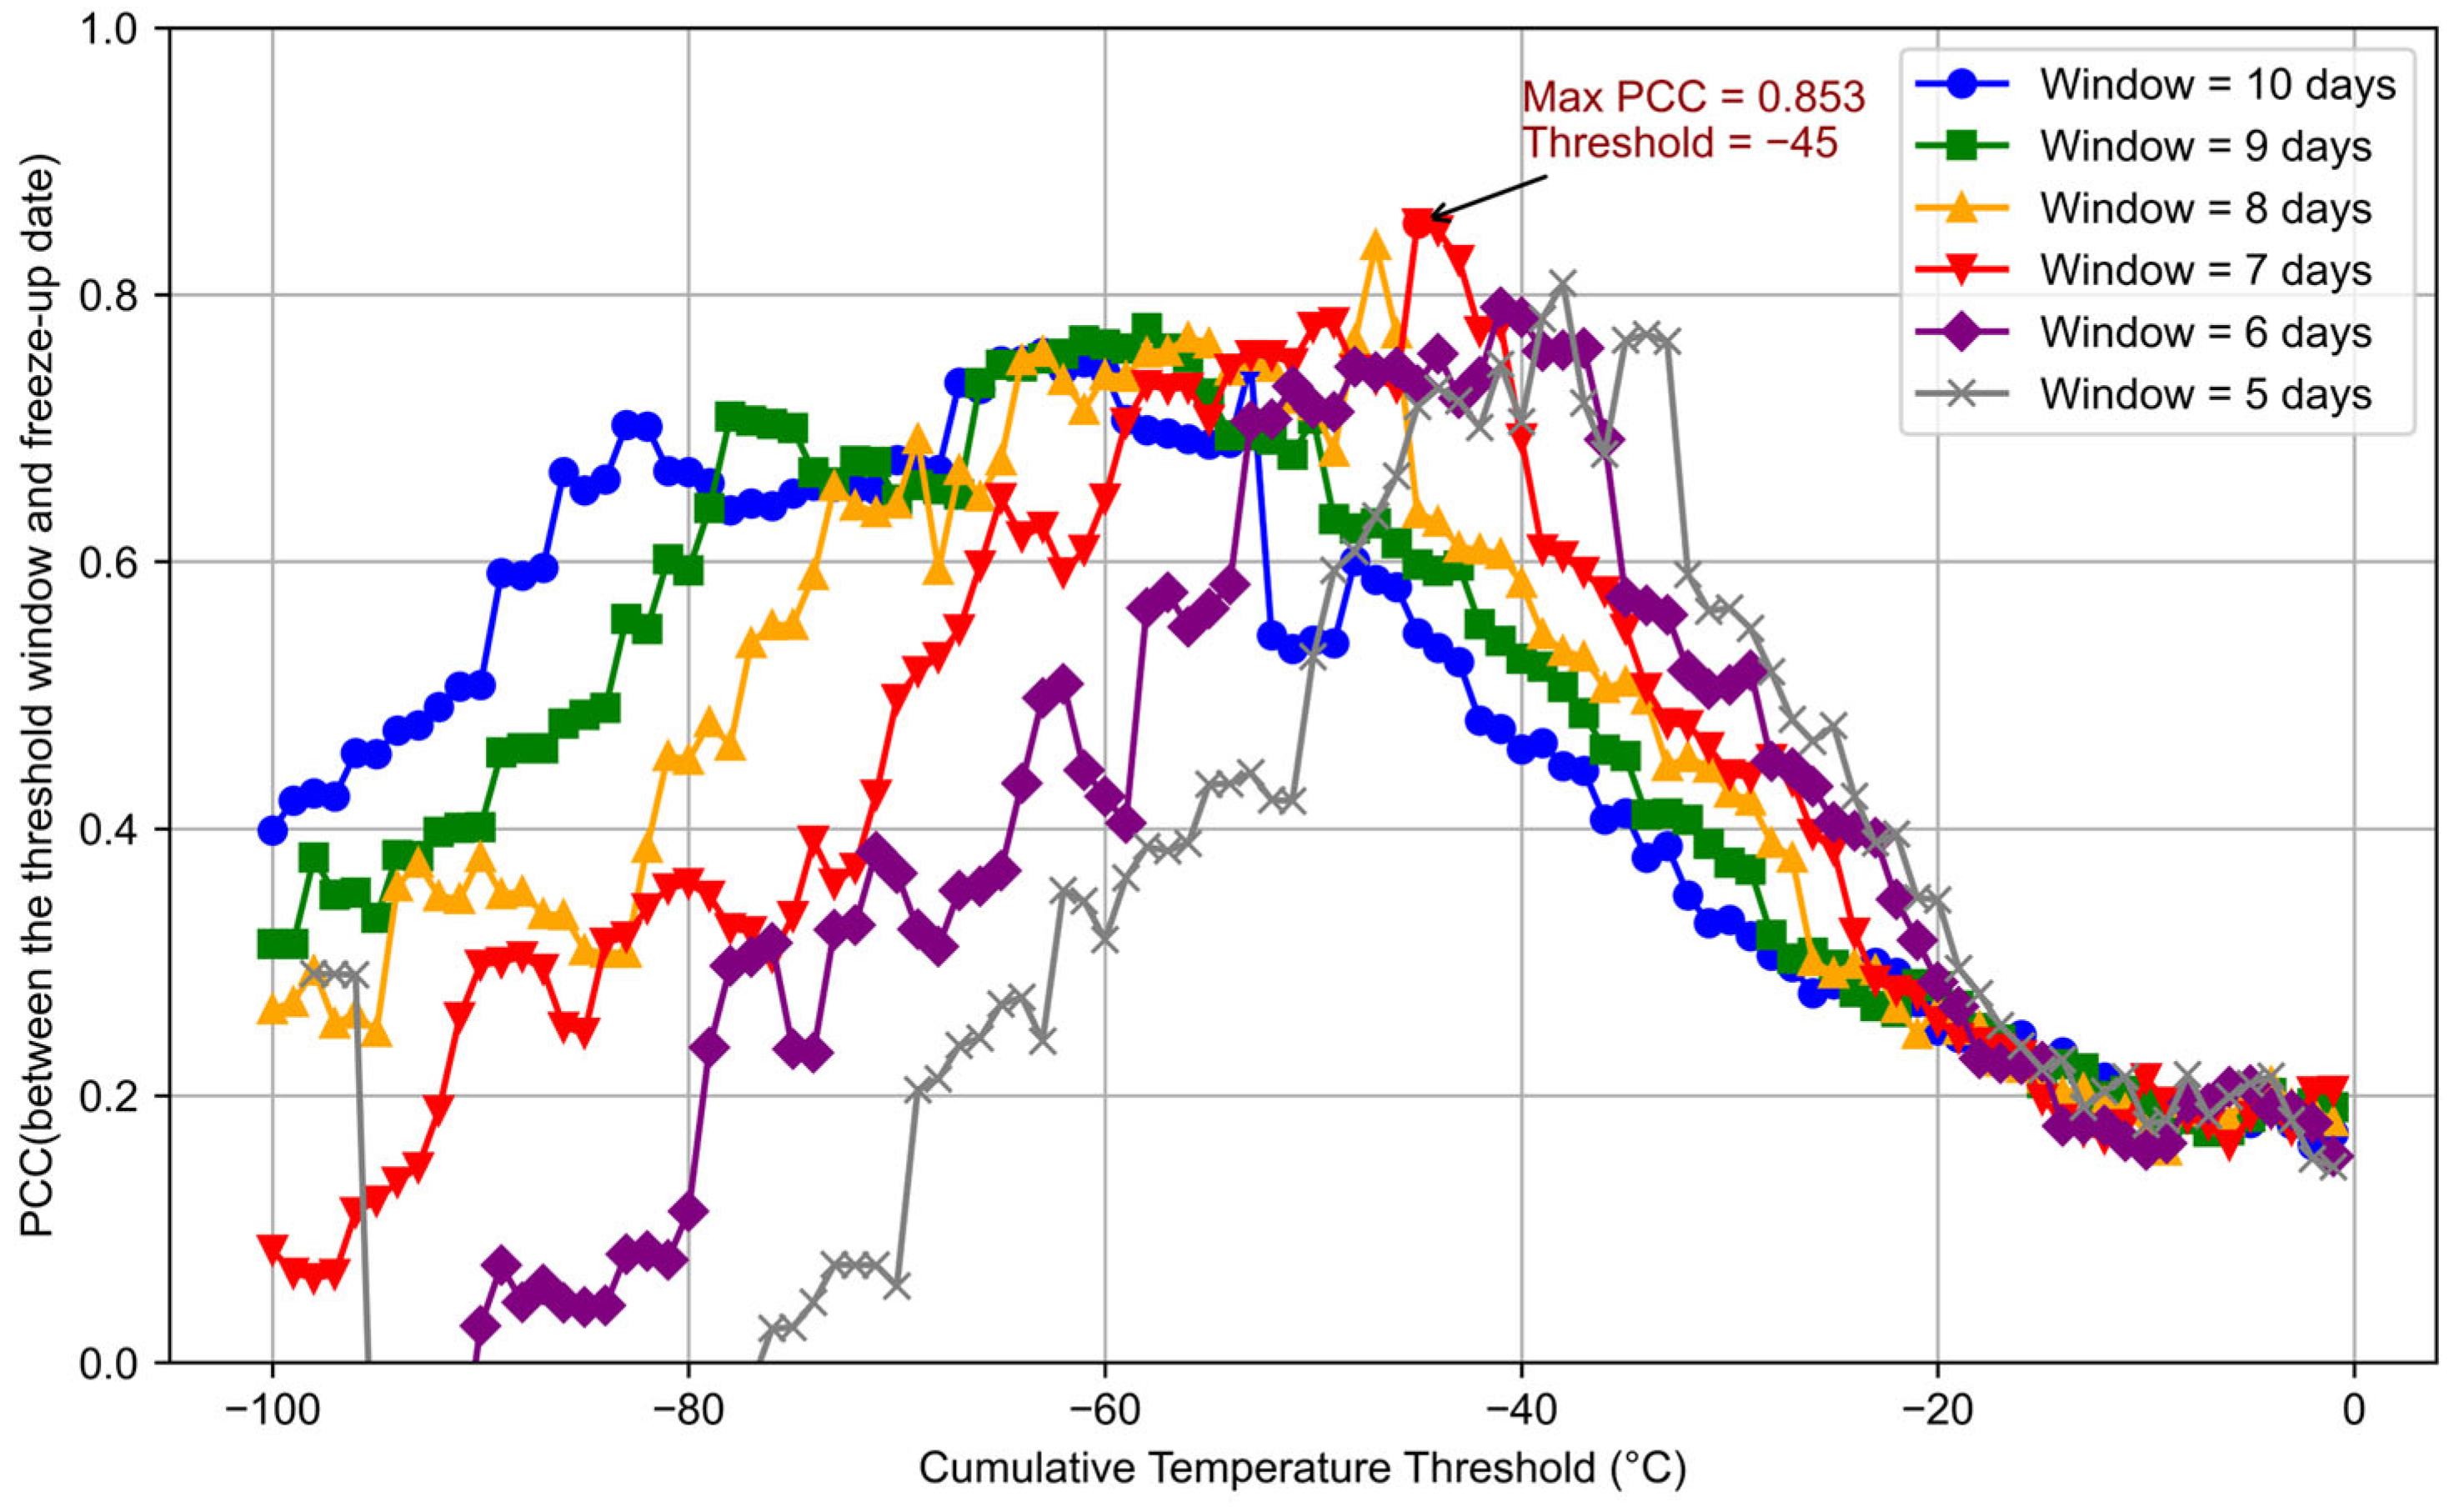
- Traverse different thresholds and time windows, calculate the PCC value between Dy (w, θ) and the observed freeze-up date Fy for each combination, and finally determine the optimal threshold θ* time window w*, corresponding to the maximum PCC value, the PCC formula is given as follows:
2.3. Methods
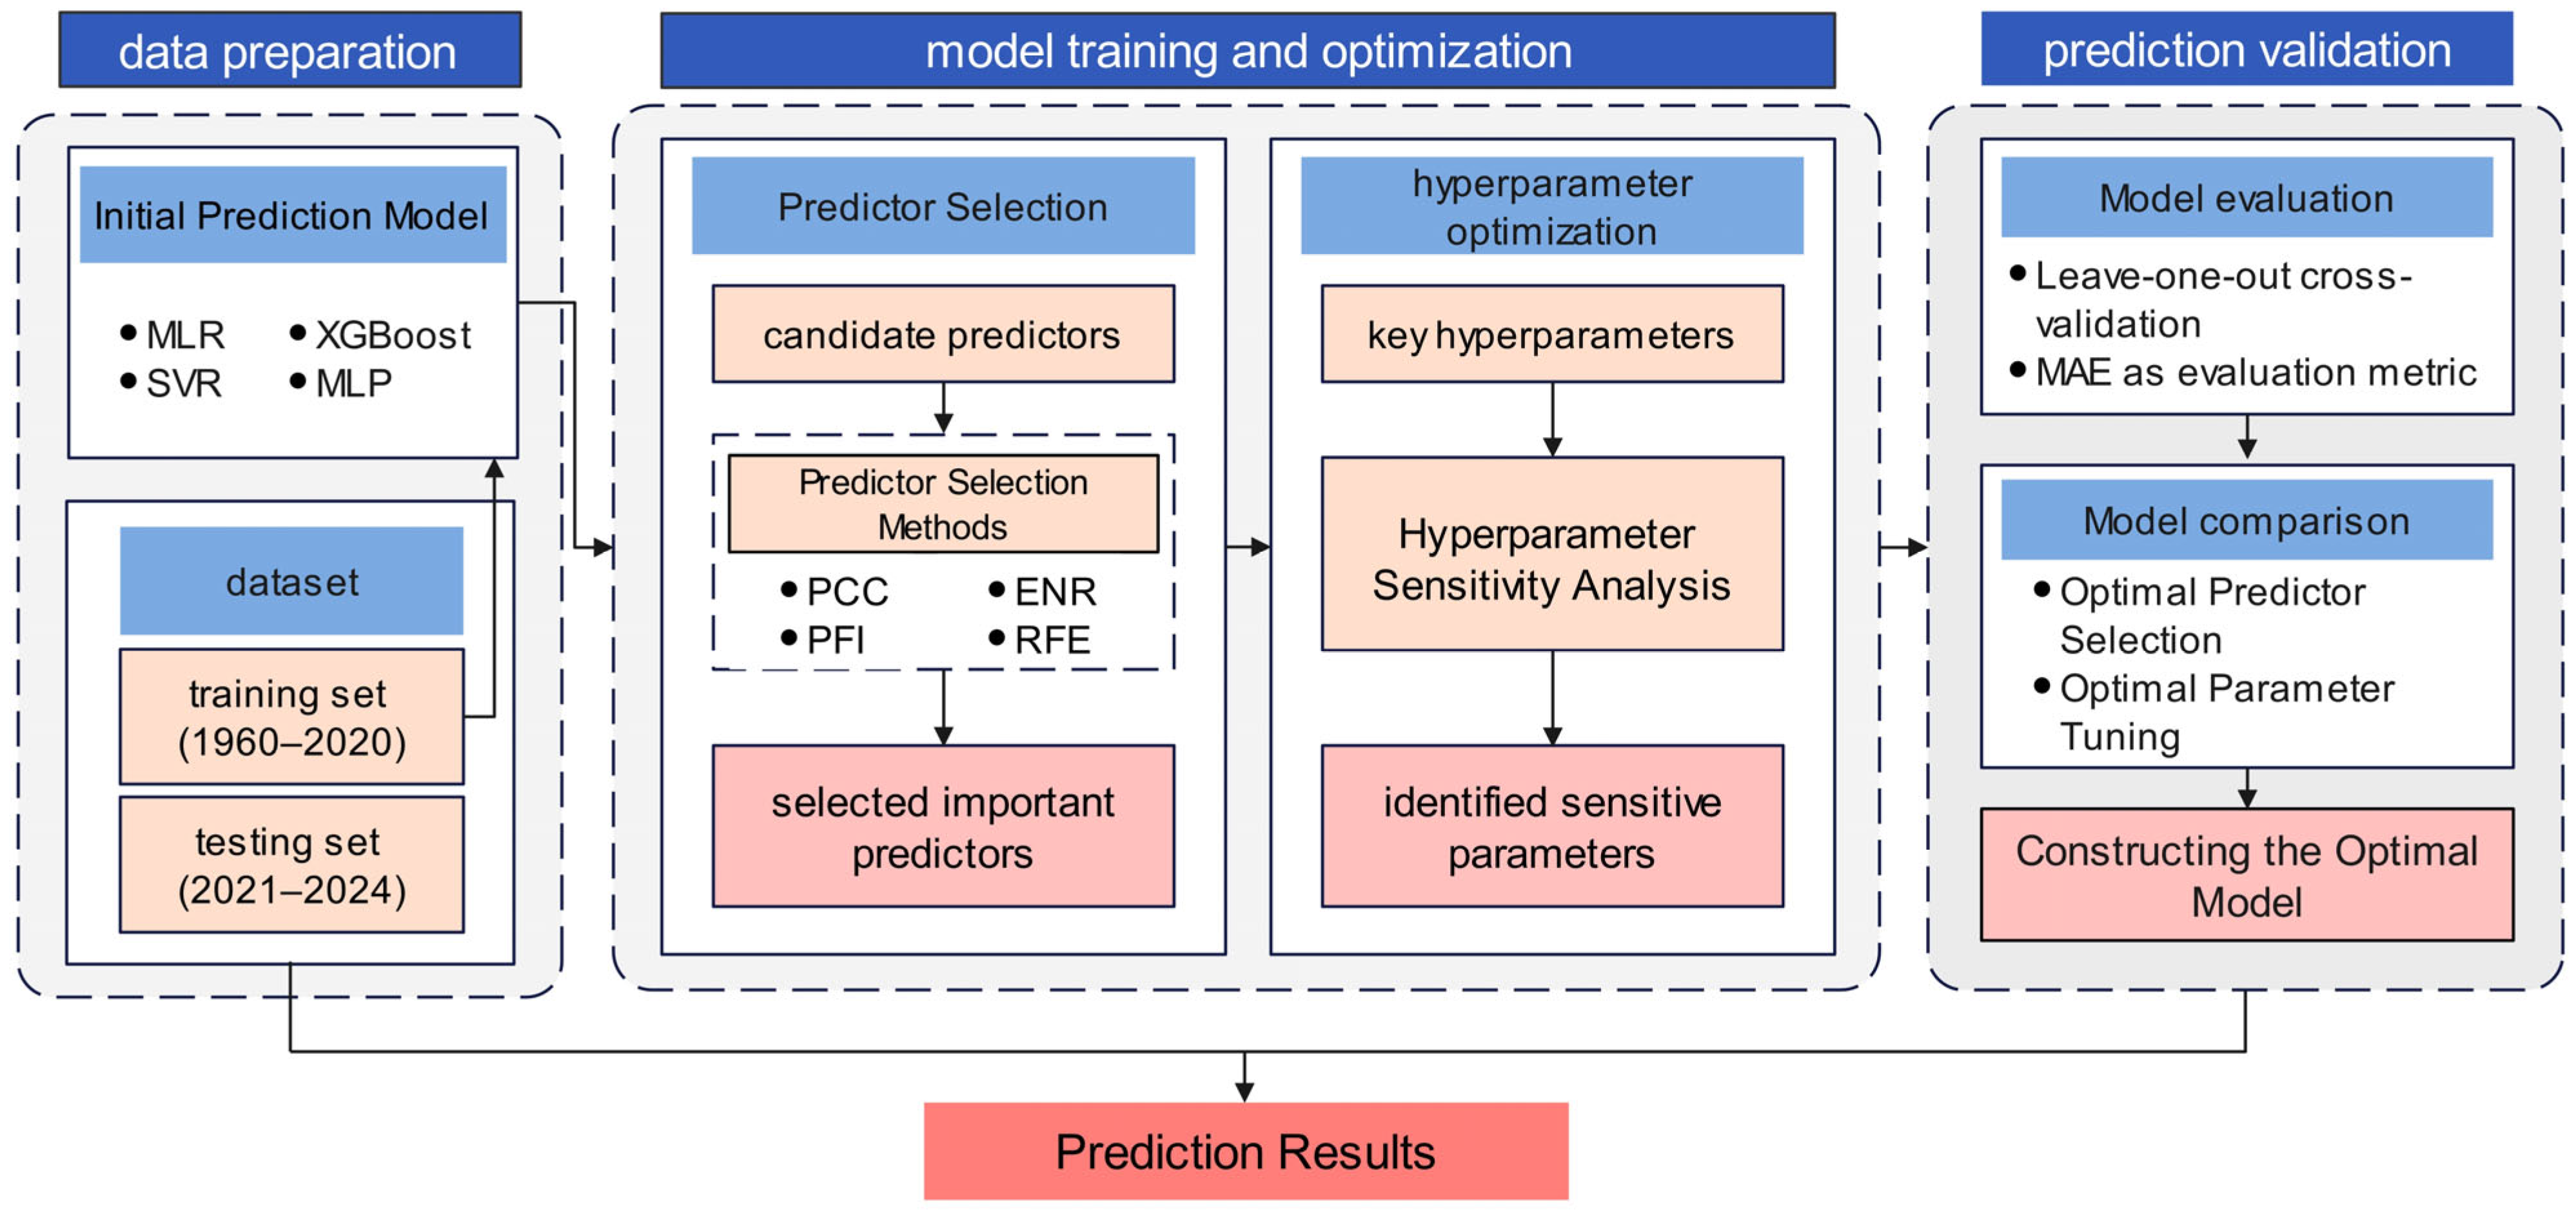
2.3.1. Predictor Selection Methods
- Pearson Correlation Coefficient (PCC)
- 2.
- Permutation Feature Importance (PFI)
- 3.
- Elastic Net Regularization (ENR)
- 4.
- Recursive Feature Elimination (RFE)
2.3.2. Prediction Models
- Multiple Linear Regression (MLR)
- 2.
- Support Vector Regression (SVR)
- 3.
- Extreme Gradient Boosting (XGBoost)
- 4.
- Multilayer Perceptron (MLP)
2.3.3. Hyperparameter Sensitivity Analysis and Optimization
2.3.4. Leave-One-Out Cross-Validation
2.3.5. Evaluation Metric
3. Results
3.1. Predictor Selection Results and Evaluation
3.2. Hyperparameter Sensitivity Analysis and Calibration Results
3.3. Evaluation of Different Modeling Strategies Under Anthropogenic Influences
3.3.1. Impact of Human Intervention
3.3.2. Selection of Different Sample Periods Based on Major Reservoir Construction
3.3.3. Incorporating Stage-Specific Threshold Cumulative Temperature Predictor
3.4. Prediction Results
3.5. Uncertainty Analysis
4. Discussion
4.1. Differences in Prediction Accuracy Among Models
4.2. Model Performance Under the Influence of Human Interventions
4.3. Limitations and Outlook
5. Conclusions
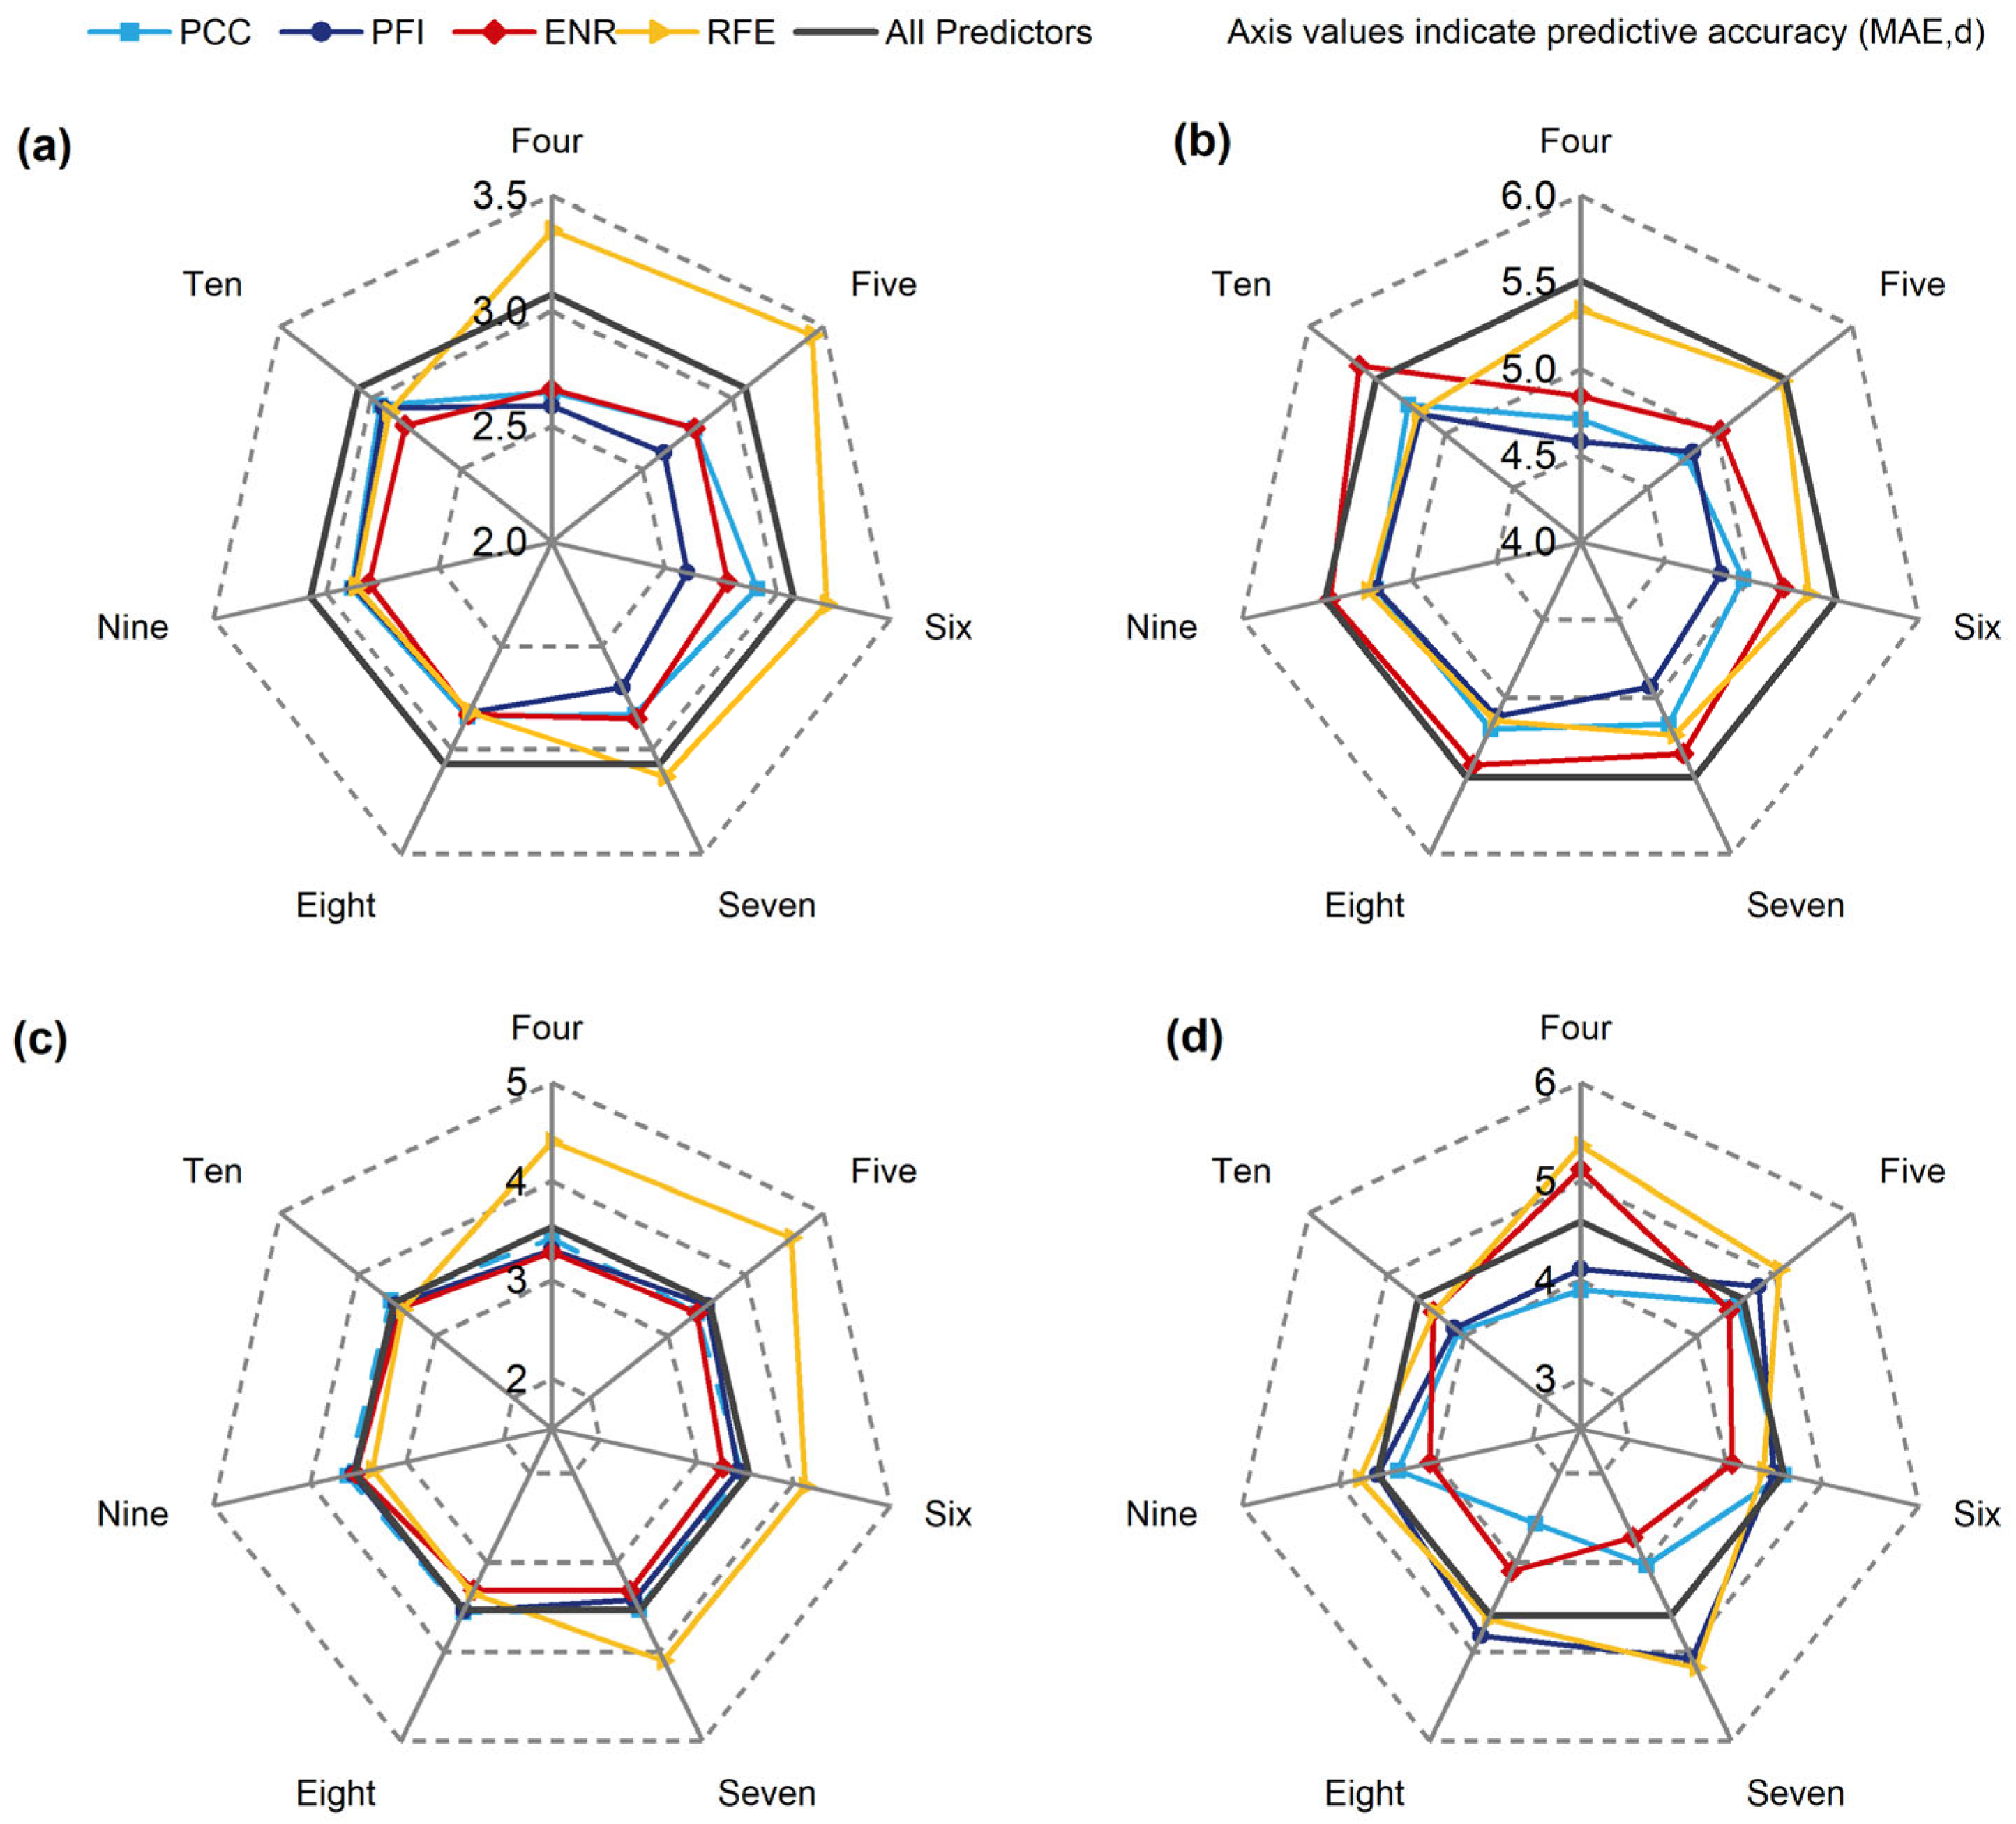
- Predictor selection substantially affects prediction accuracy, with different models exhibiting distinct sensitivities to selection methods and the number of optimal features. MLR and SVR favored a small set of key predictors, while XGBoost was insensitive to changes in predictor inputs, and MLP benefited from a larger set of predictors.
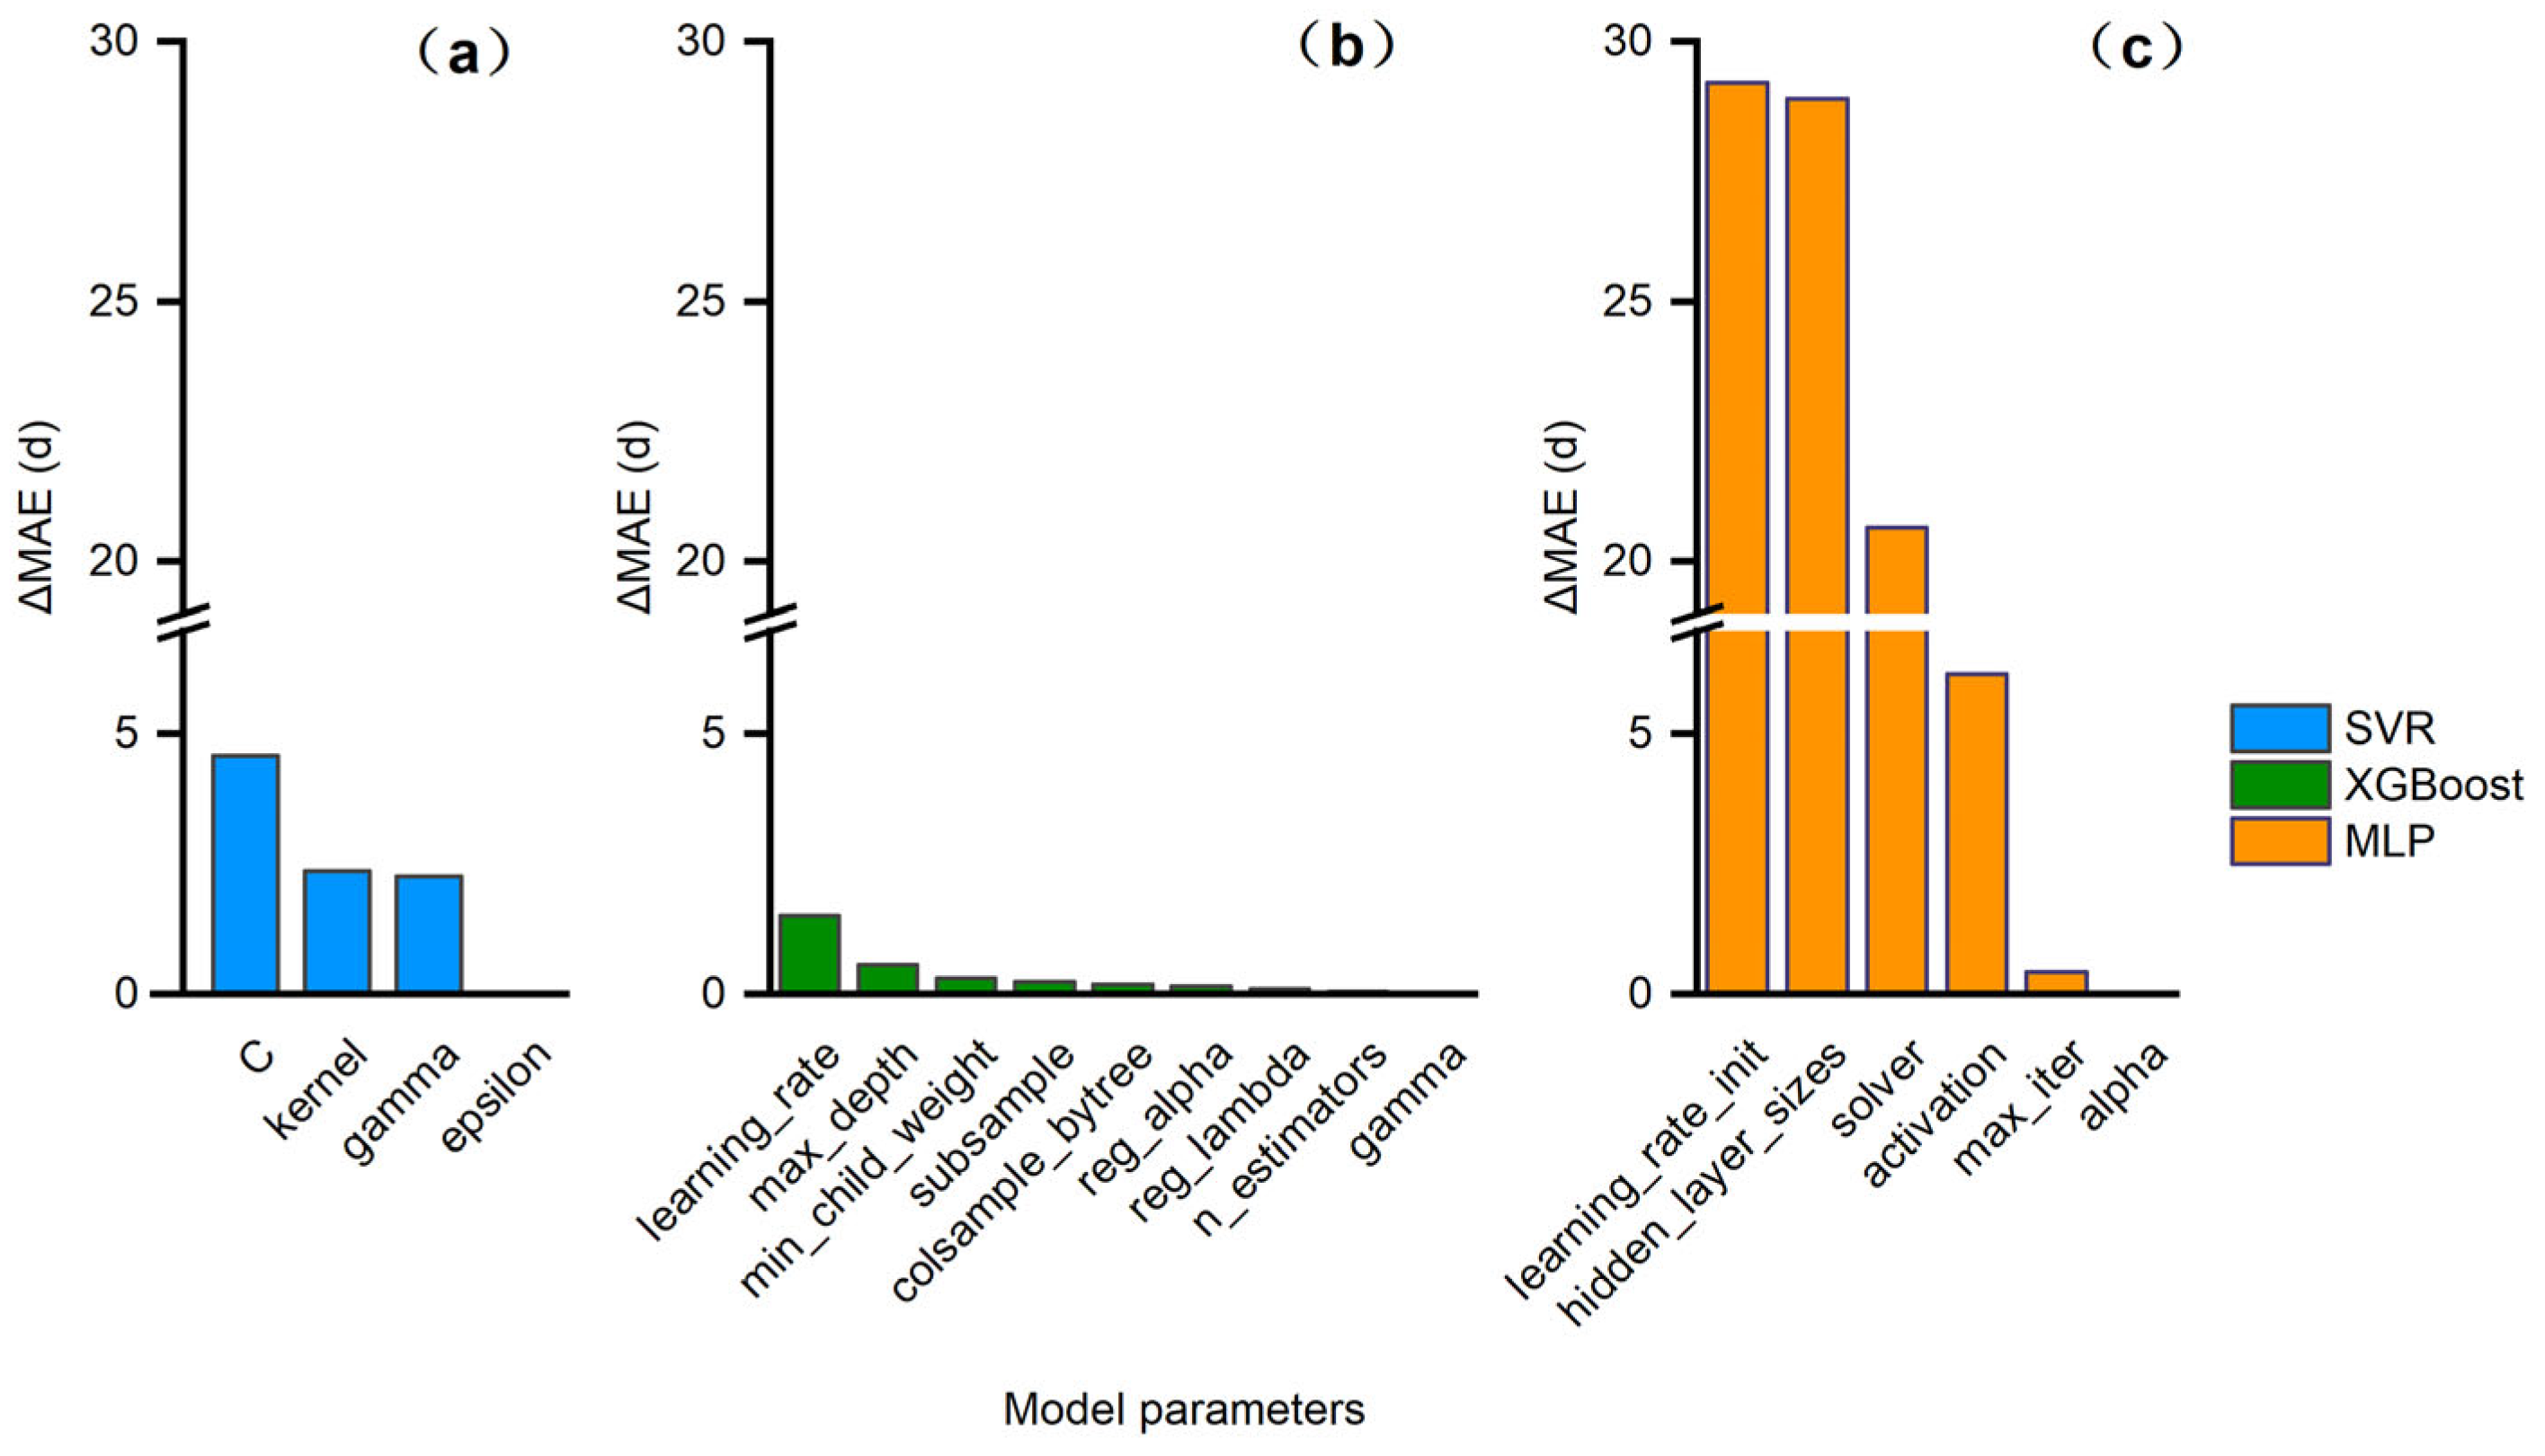
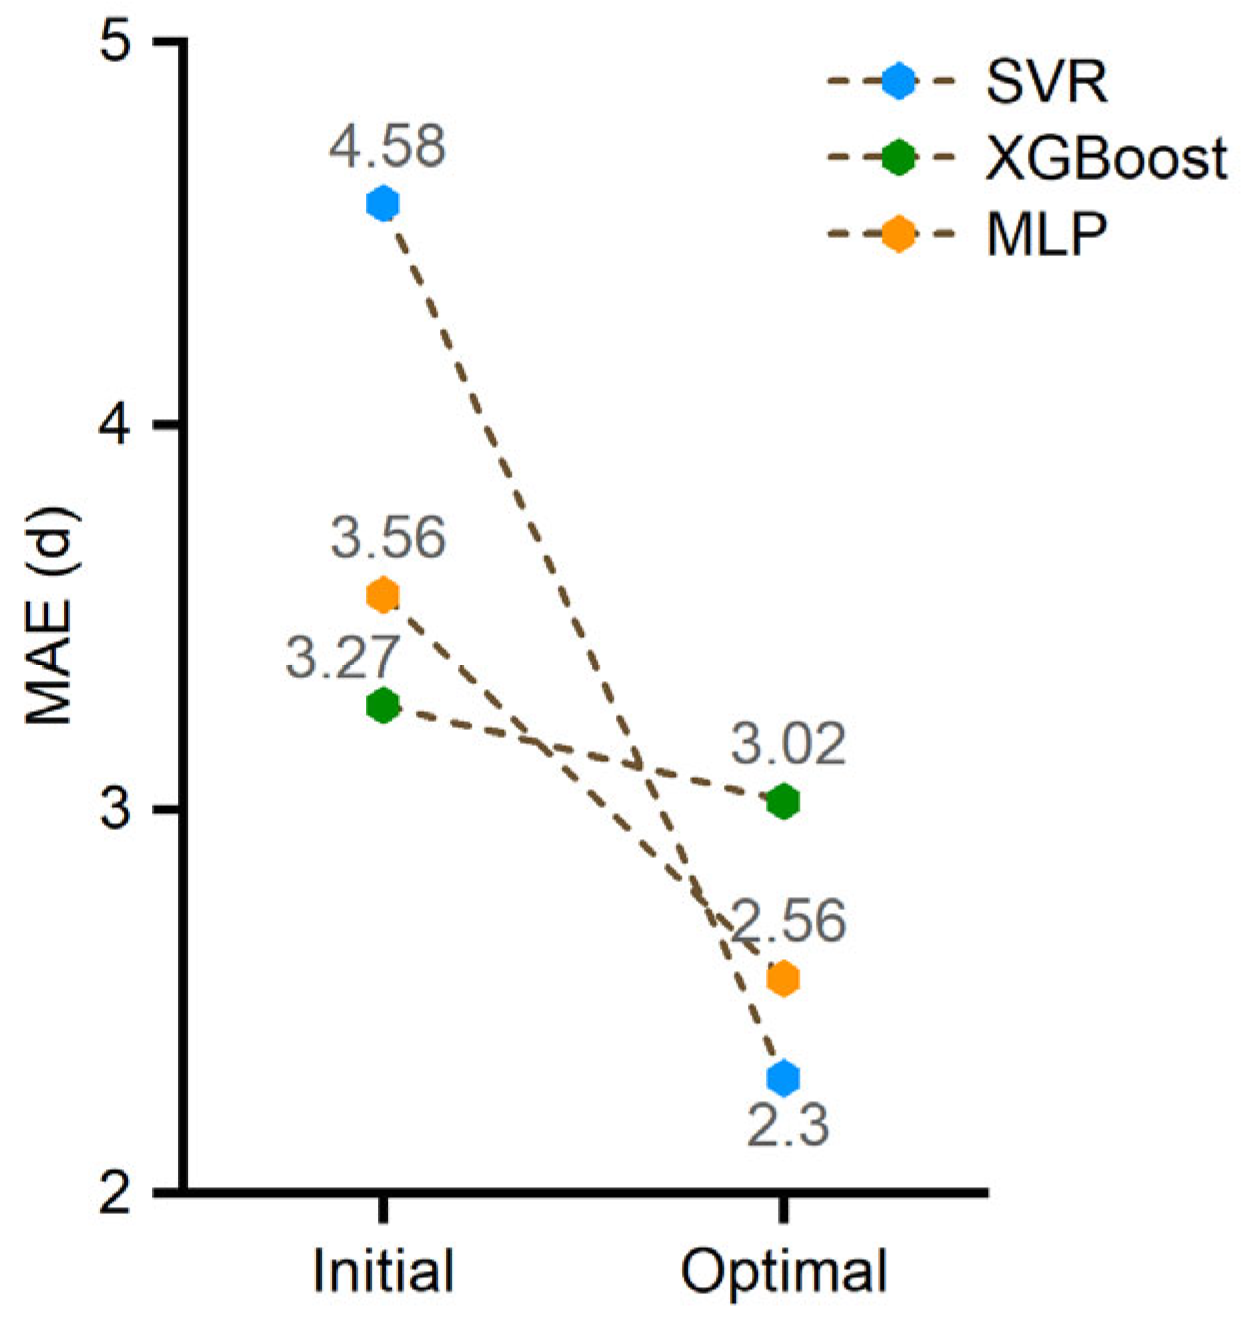
- Hyperparameter optimization enhances model accuracy, but the sensitivity to hyperparameters differs across models. MLP was the most sensitive, SVR moderately so, and XGBoost the most robust.
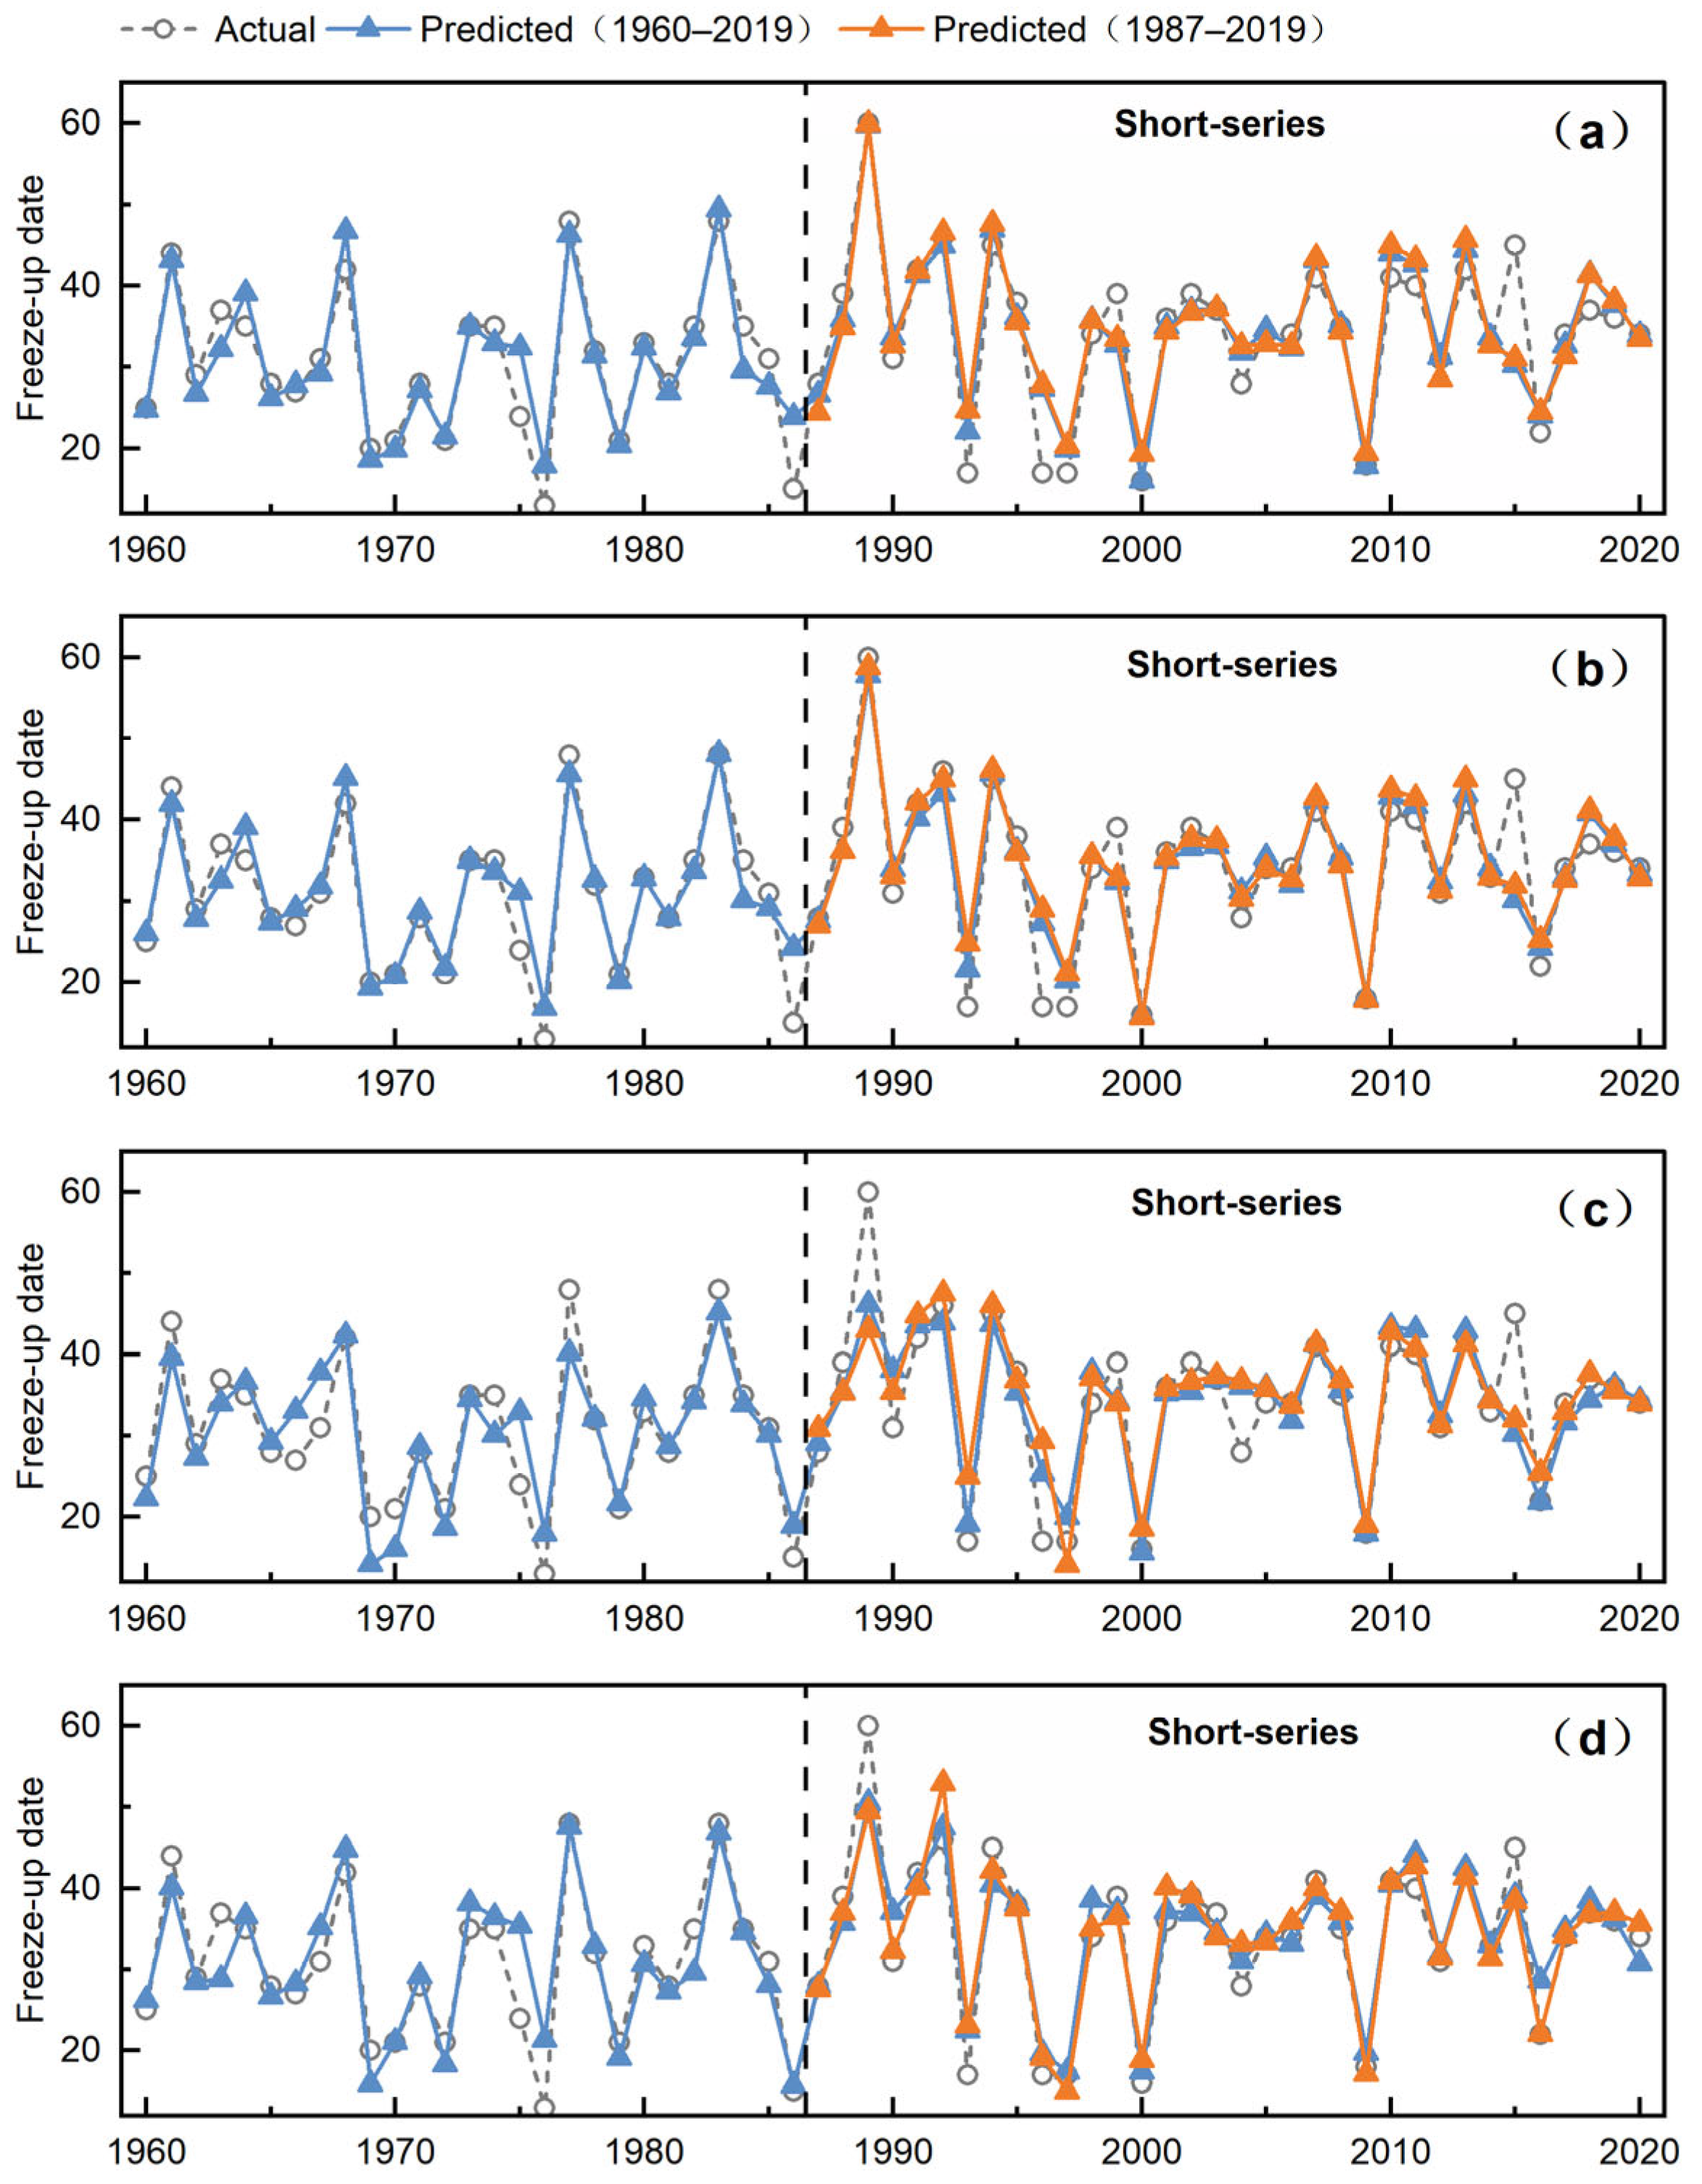
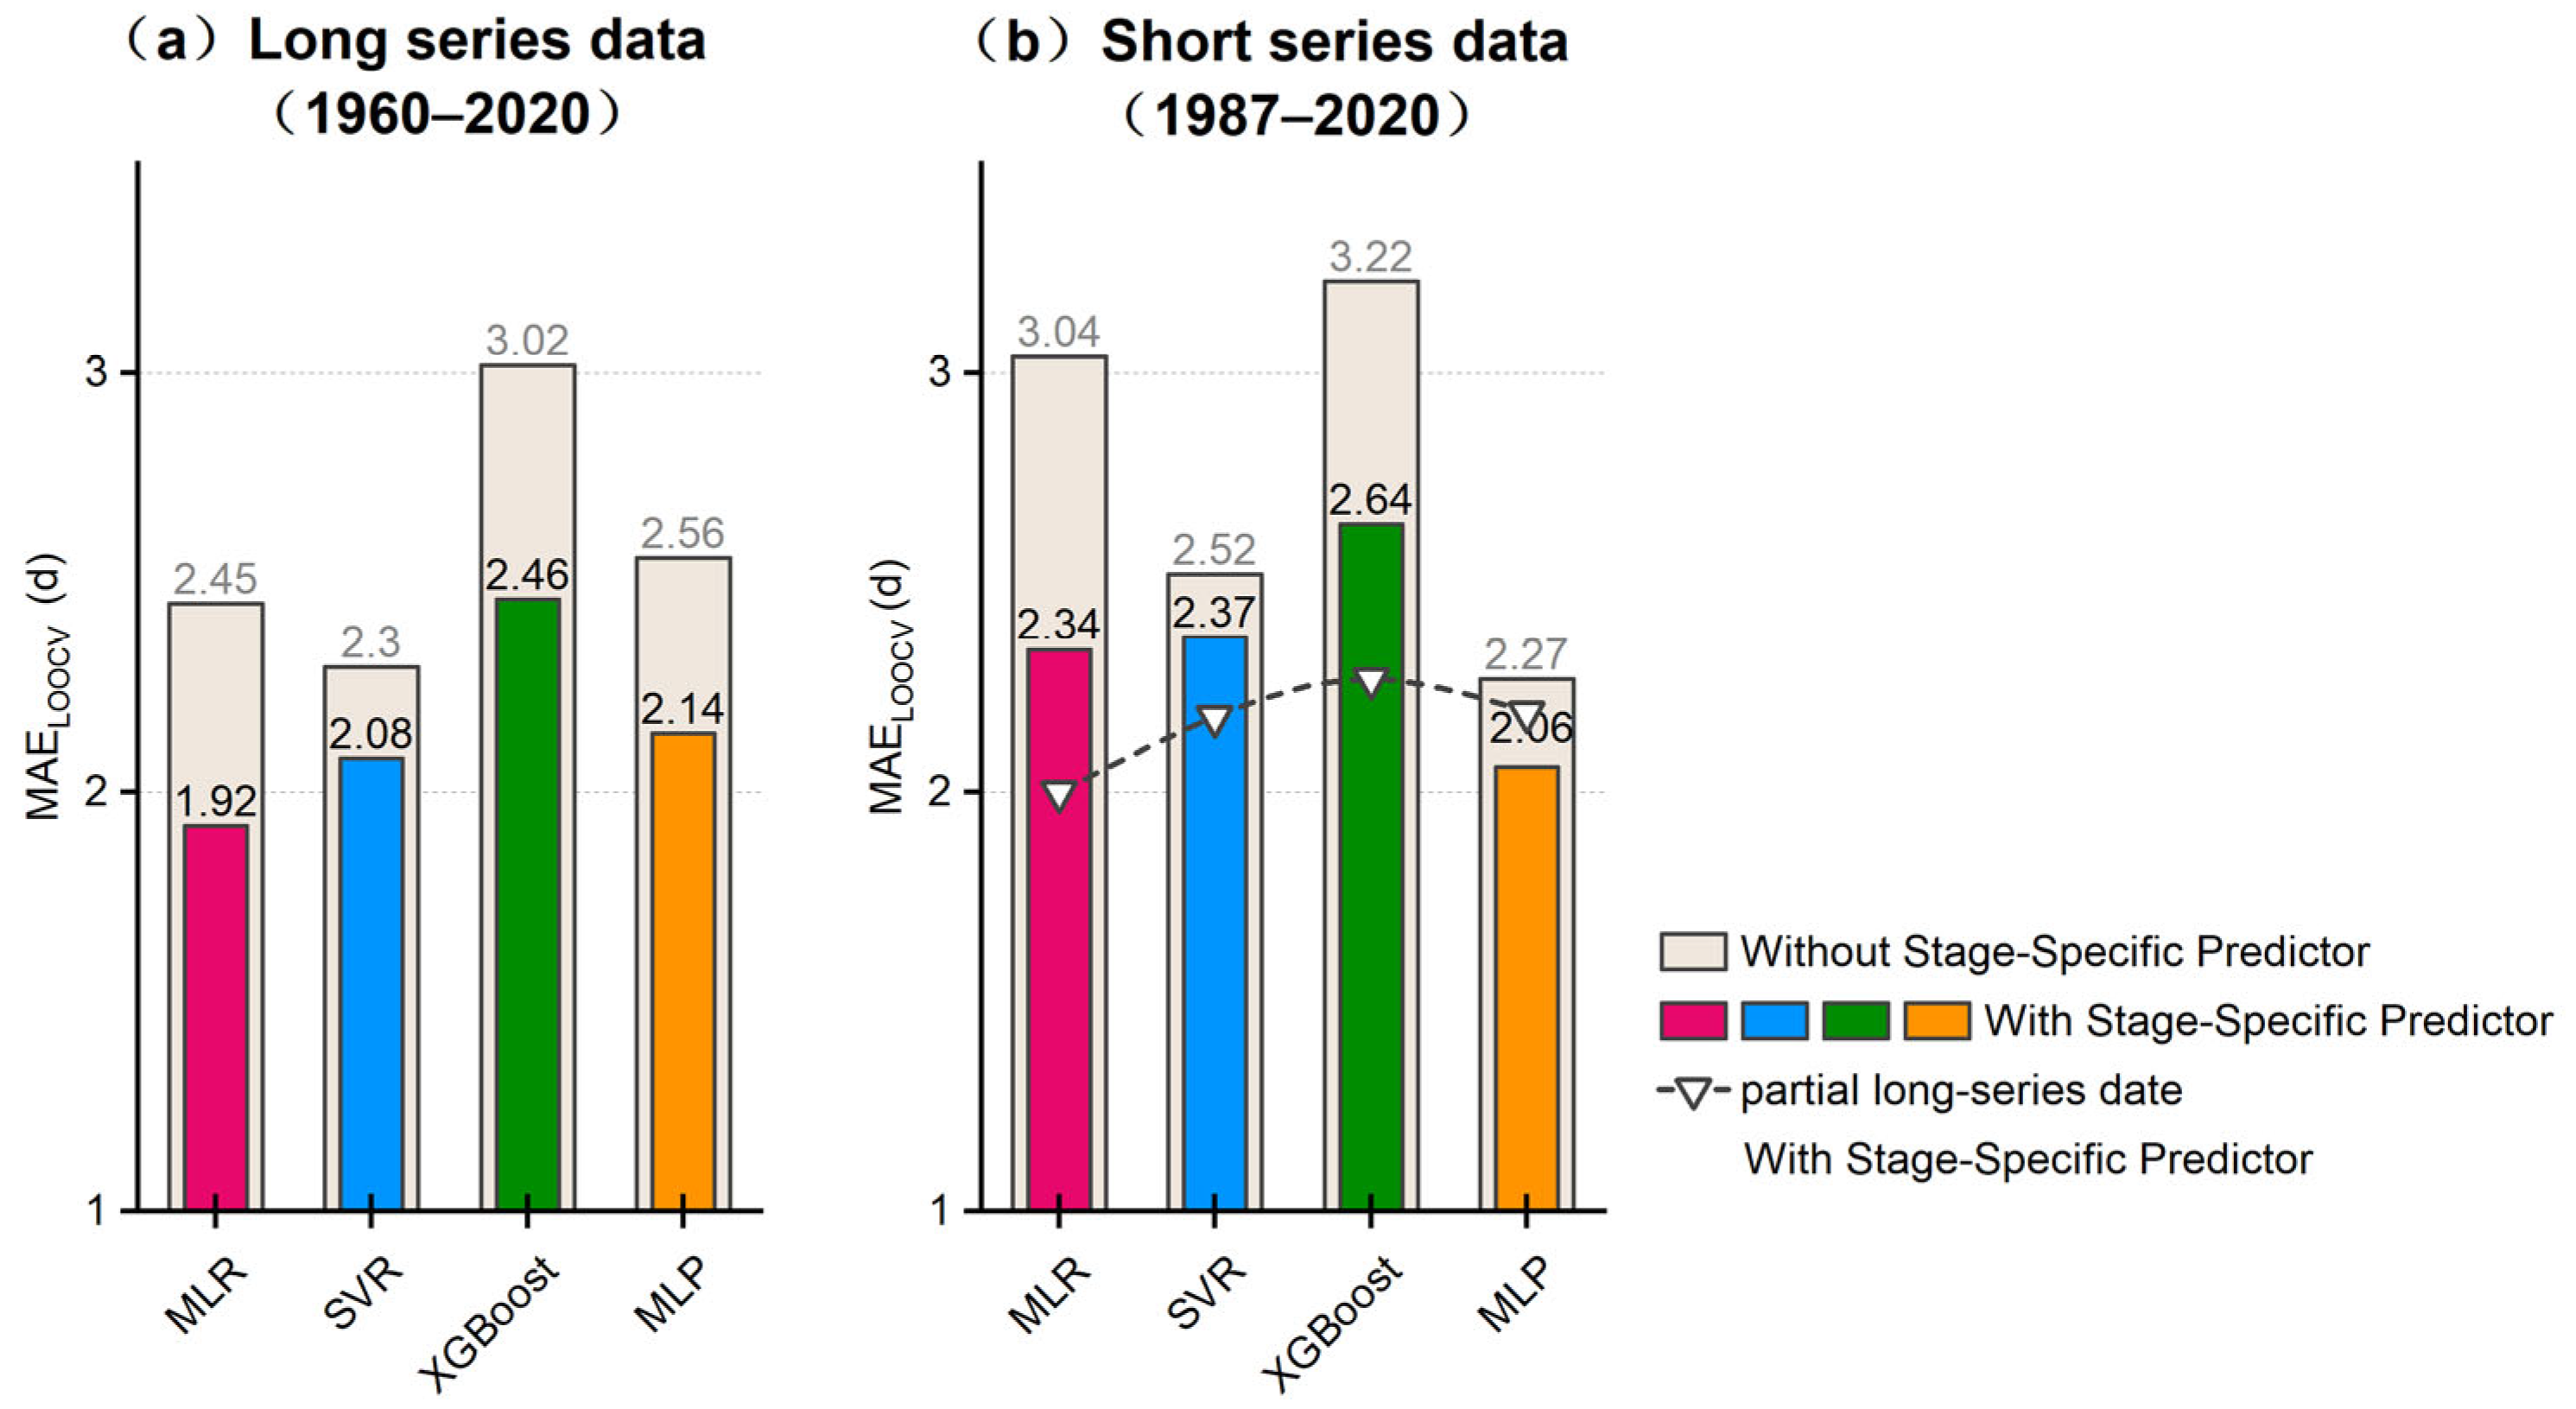
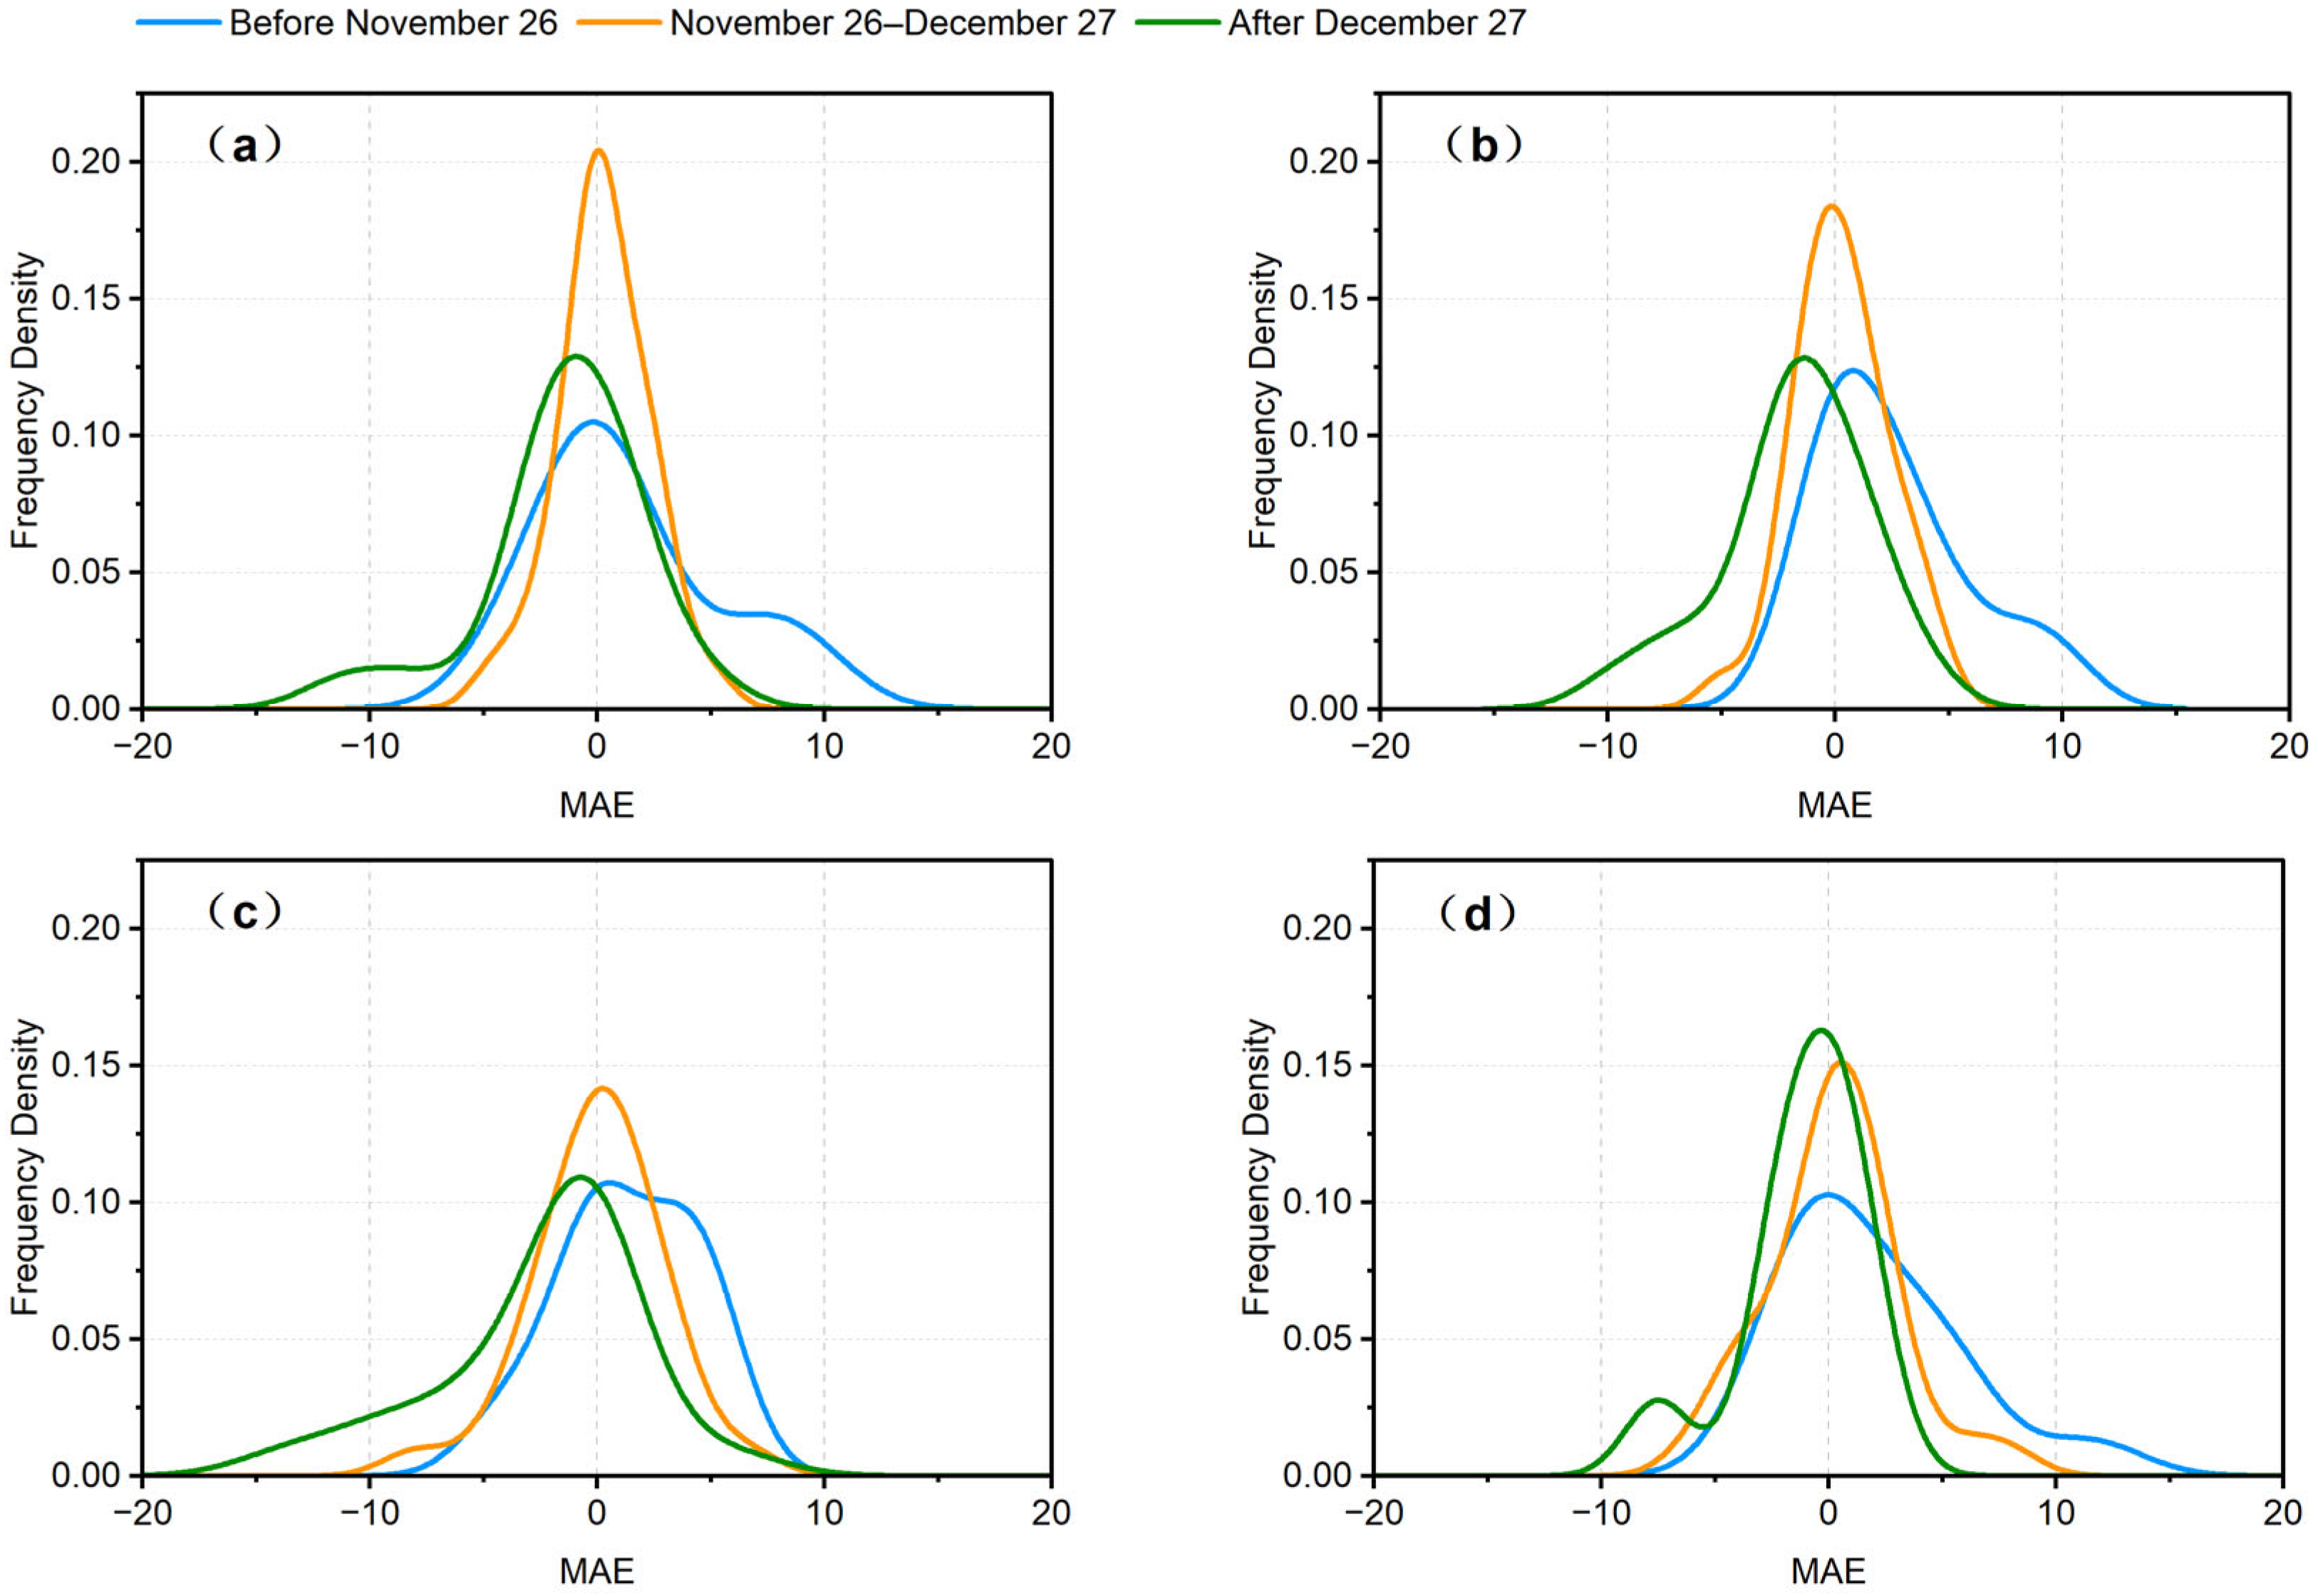
- Under human intervention, introducing the Stage-Specific Predictor improves model accuracy more effectively than discarding early data.
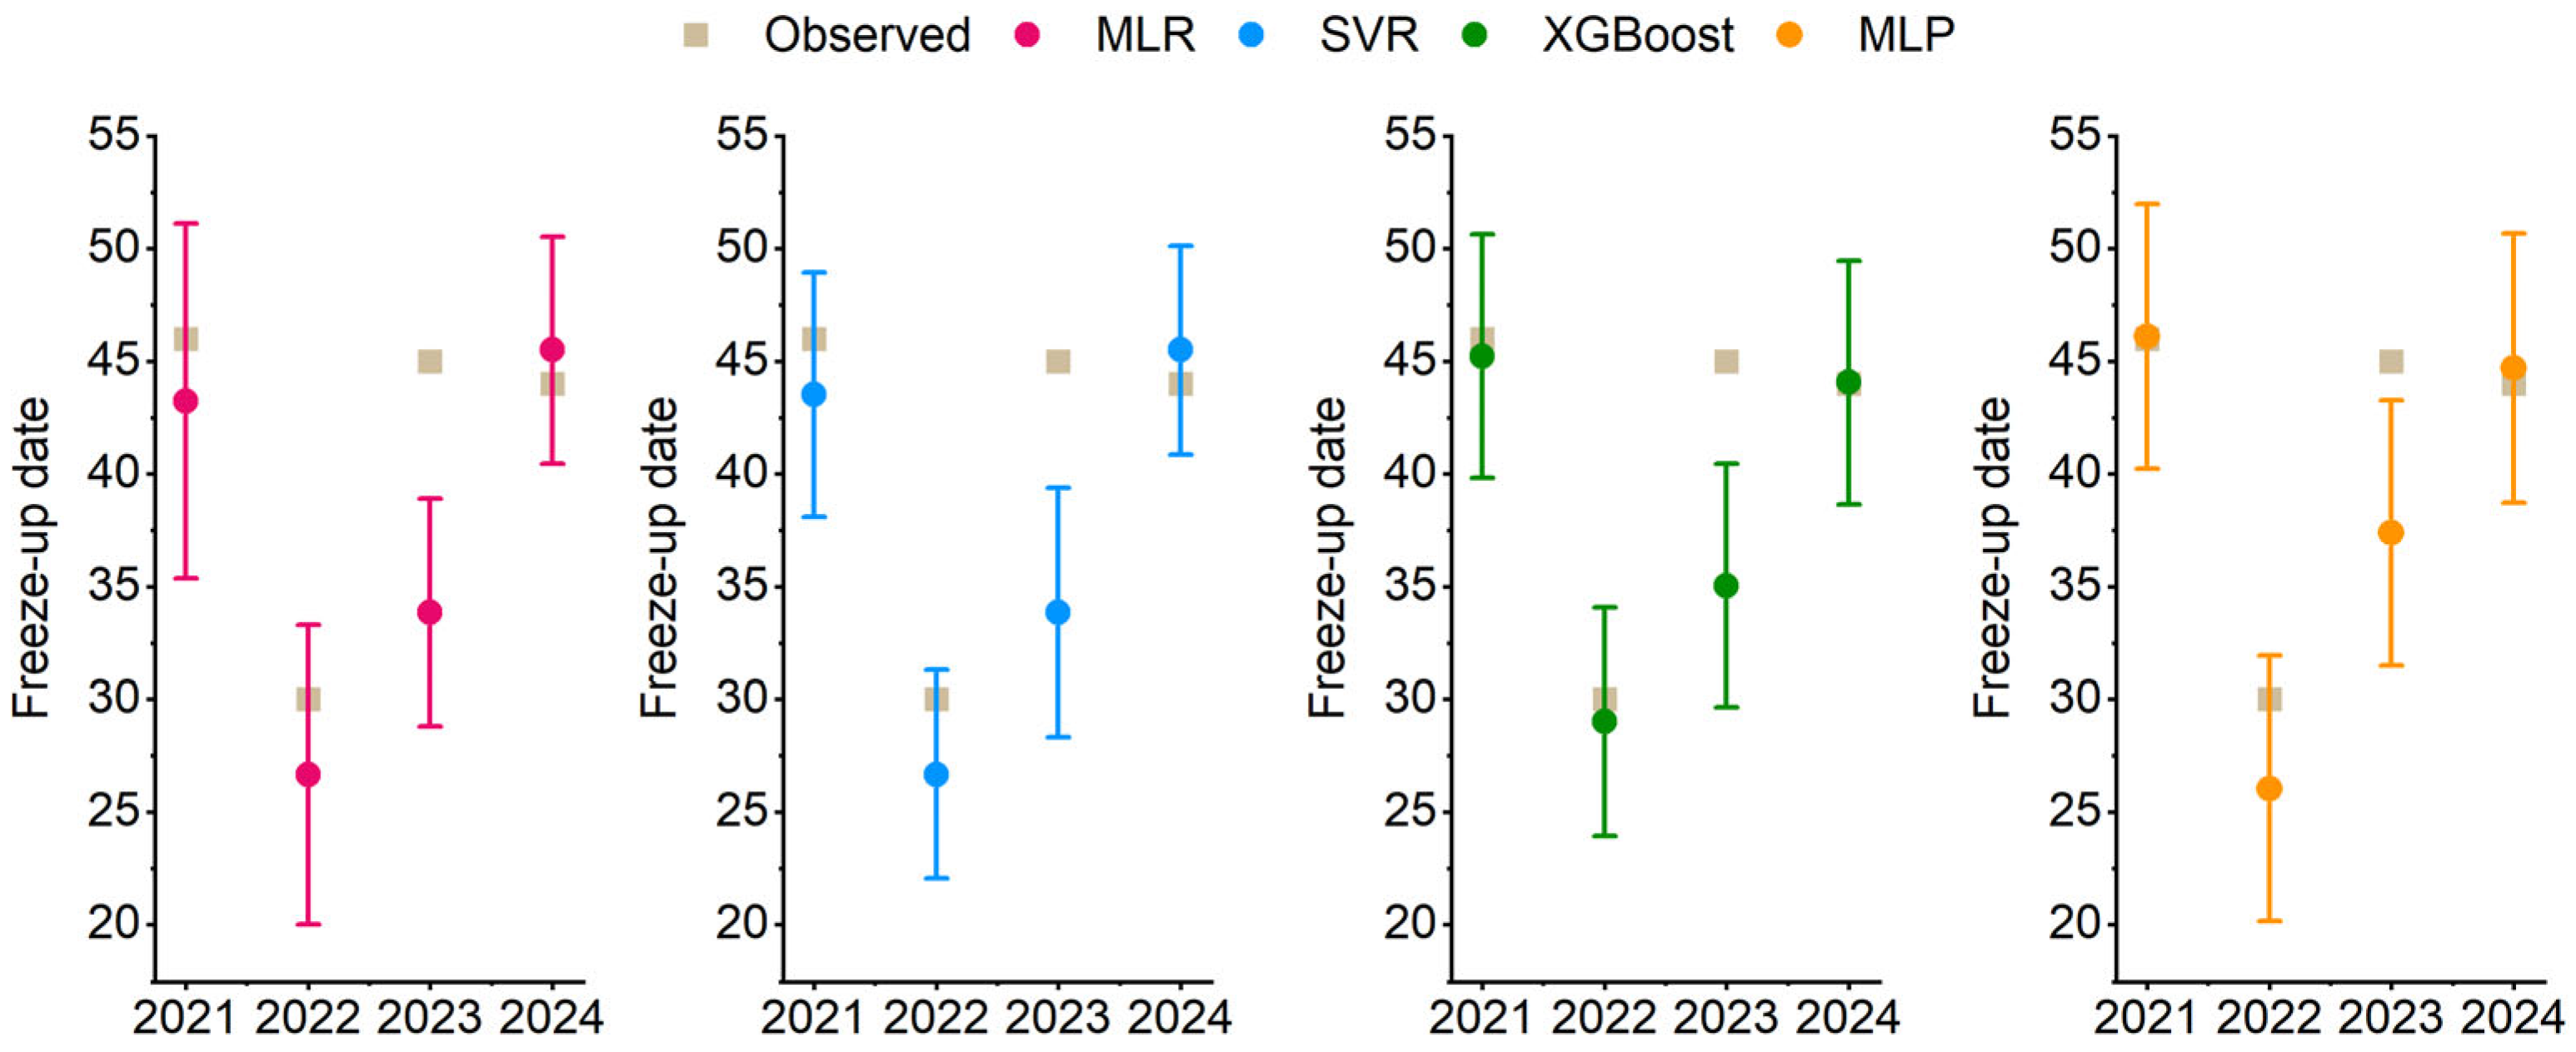
- XGBoost delivered the best performance from 2020 to 2024, while MLP excelled at predicting more complex years. Different models each have their strengths, with nonlinear models demonstrating better adaptability than linear ones in freeze-up date prediction.
Supplementary Materials
Author Contributions
Funding
Data Availability Statement
Acknowledgments
Conflicts of Interest
References
- Rokaya, P.; Budhathoki, S.; Lindenschmidt, K.-E. Ice-jam flood research: A scoping review. Nat. Hazards 2018, 94, 1439–1457. [Google Scholar] [CrossRef]
- Hou, Z.; Wang, J.; Sui, J.; Li, G.; Zhang, B.; Zhou, L. Discriminant analysis of the freeze-up and break-up conditions in the Inner Mongolia Reach of the Yellow River. J. Water Clim. Change 2023, 14, 3166–3177. [Google Scholar] [CrossRef]
- Wang, X.; Qu, Z.; Tian, F.; Wang, Y.; Yuan, X.; Xu, K. Ice-jam flood hazard risk assessment under simulated levee breaches using the random forest algorithm. Nat. Hazards 2022, 115, 331–355. [Google Scholar] [CrossRef]
- Magnuson, J.J.; Robertson, D.M.; Benson, B.J.; Wynne, R.H.; Livingstone, D.M.; Arai, T.; Assel, R.A.; Barry, R.G.; Card, V.; Kuusisto, E.; et al. Historical Trends in Lake and River Ice Cover in the Northern Hemisphere. Science 2000, 289, 1743–1746. [Google Scholar] [CrossRef]
- Guo, X.; Wang, T.; Fu, H.; Guo, Y.; Li, J. Ice-Jam Forecasting during River Breakup Based on Neural Network Theory. J. Cold Reg. Eng. 2018, 32, 04018010. [Google Scholar] [CrossRef]
- Turcotte, B.; Morse, B. The Winter Environmental Continuum of Two Watersheds. Water 2017, 9, 337. [Google Scholar] [CrossRef]
- Beltaos, S.; Prowse, T.D. Climate impacts on extreme ice-jam events in Canadian rivers. Hydrol. Sci. J. 2001, 46, 157–181. [Google Scholar] [CrossRef]
- Ma, L.; Bian, Y.; Lin, D. Research on the Causes and Defensive Measures of lce-FloodDisasters in Ningxia-Inner Mongolia Reach of the Yellow River. Yellow River 2024, 46, 62–67+85. [Google Scholar]
- Zhao, L.; Hicks, F.E.; Fayek, A.R. Applicability of multilayer feed-forward neural networks to model the onset of river breakup. Cold Reg. Sci. Technol. 2012, 70, 32–42. [Google Scholar] [CrossRef]
- Takács, K.; Kern, Z.; Nagy, B. Impacts of anthropogenic effects on river ice regime: Examples from Eastern Central Europe. Quat. Int. 2013, 293, 275–282. [Google Scholar] [CrossRef]
- Roksvåg, T.; Lenkoski, A.; Scheuerer, M.; Heinrich-Mertsching, C.; Thorarinsdottir, T.L. Probabilistic prediction of the time to hard freeze using seasonal weather forecasts and survival time methods. Q. J. R. Meteorol. Soc. 2022, 149, 211–230. [Google Scholar] [CrossRef]
- Chang, J.; Wang, X.; Li, Y.; Wang, Y. Ice regime variation impacted by reservoir operation in the Ning-Meng reach of the Yellow River. Nat. Hazards 2015, 80, 1015–1030. [Google Scholar] [CrossRef]
- Wu, X.; Hui, X. Economic Dependence Relationship and the Coordinated & Sustainable Development among the Provinces in the Yellow River Economic Belt of China. Sustainability 2021, 13, 5448. [Google Scholar] [CrossRef]
- Chen, D.; Huo, J.; Liu, J. Indexes Analysis Method for lce-Run and Freeze-Up Forecasting in Inner Mongolia Reach of the Yellow River. Yellow River 2024, 46, 28–32. [Google Scholar]
- Foltyn, E.P.; Shen, H.T. St. Lawrence River Freeze-up Forecast. J. Waterw. Port Coast. Ocean. Eng. 1986, 112, 467–481. [Google Scholar] [CrossRef]
- Wang, T.; Guo, X.; Liu, J.; Chen, Y.; She, Y.; Pan, J. Ice Process Simulation on Hydraulic Characteristics in the Yellow River. J. Hydraul. Eng. 2024, 150, 05024001. [Google Scholar] [CrossRef]
- Madaeni, F.; Chokmani, K.; Lhissou, R.; Homayouni, S.; Gauthier, Y.; Tolszczuk-Leclerc, S. Convolutional neural network and long short-term memory models for ice-jam predictions. Cryosphere 2022, 16, 1447–1468. [Google Scholar] [CrossRef]
- Shouyu, C.; Honglan, J. Fuzzy Optimization Neural Network Approach for Ice Forecast in the Inner Mongolia Reach of the Yellow River/Approche d’Optimisation Floue de Réseau de Neurones pour la Prévision de la Glace Dans le Tronçon de Mongolie Intérieure du Fleuve Jaune. Hydrol. Sci. J. 2005, 50, 330. [Google Scholar] [CrossRef]
- De Coste, M.; Li, Z.; Dibike, Y. Assessing and predicting the severity of mid-winter breakups based on Canada-wide river ice data. J. Hydrol. 2022, 607, 127550. [Google Scholar] [CrossRef]
- Liu, Z.; Han, H.; Li, Y.; Wang, E.; Liu, X. Forecasting the River Ice Break-Up Date in the Upper Reaches of the Heilongjiang River Based on Machine Learning. Water 2025, 17, 434. [Google Scholar] [CrossRef]
- Zhou, H.; Li, W.; Zhang, C.; Liu, J. Ice breakup forecast in the reach of the Yellow River: The support vector machines approach. Hydrol. Earth Syst. Sci. Discuss. 2009, 6, 3175–3198. [Google Scholar] [CrossRef]
- Madaeni, F.; Lhissou, R.; Chokmani, K.; Raymond, S.; Gauthier, Y. Ice jam formation, breakup and prediction methods based on hydroclimatic data using artificial intelligence: A review. Cold Reg. Sci. Technol. 2020, 174, 103032. [Google Scholar] [CrossRef]
- Xue, Z.; Ji, H.; Luo, H.; Liu, B. Ice velocity in the Yellow River bends using unmanned aerial vehicle imagery. Sci. Rep. 2025, 15, 22956. [Google Scholar] [CrossRef]
- Qian, X.; Wang, B.; Chen, J.; Fan, Y.; Mo, R.; Xu, C.; Liu, W.; Liu, J.; Zhong, P.-a. An explainable ensemble deep learning model for long-term streamflow forecasting under multiple uncertainties. J. Hydrol. 2025, 662, 133968. [Google Scholar] [CrossRef]
- Kaya, Y. Slope-aware and self-adaptive forecasting of water levels: A transparent model for the Great Lakes under climate variability. J. Hydrol. 2025, 662, 133948. [Google Scholar] [CrossRef]
- Rajeev, A.; Shah, R.; Shah, P.; Shah, M.; Nanavaty, R. The Potential of Big Data and Machine Learning for Ground Water Quality Assessment and Prediction. Arch. Comput. Methods Eng. 2024, 32, 927–941. [Google Scholar] [CrossRef]
- Sun, Y.; Wang, T.; Lu, J. Sensitivity analysis of BP-DEMATEL model to control parameters of ice processes. J. Hydraul. Eng. 2022, 53, 1083–1091. [Google Scholar] [CrossRef]
- Sun, Y.; Wang, T.; Zhou, Z. Ice prediction and identification of influence parameters affecting the initial freeze-up of the Inner Mongolia reach of the Yellow River. J. China Inst. Water Resour. Hydropower Res. 2024, 22, 149–158. [Google Scholar] [CrossRef]
- Tao, W.; Kailin, Y.; Yongxin, G. Application of Artificial Neural Networks to Forecasting Ice Conditions of the Yellow River in the Inner Mongolia Reach. J. Hydrol. Eng. 2008, 13, 811–816. [Google Scholar] [CrossRef]
- Zhang, Y.; He, B.; Guo, L.; Liu, J.; Xie, X. The relative contributions of precipitation, evapotranspiration, and runoff to terrestrial water storage changes across 168 river basins. J. Hydrol. 2019, 579, 124194. [Google Scholar] [CrossRef]
- Chen, D.; Liang, C.; Zhao, S. Ice-Flood Prevention Effect on Haibowan Reservoir and lts lmpact onlce Conditions. J. China Hydrol. 2020, 40, 85–90. [Google Scholar] [CrossRef]
- Wang, Y.; Li, Z.; Li, Q.; Chen, Z.; Wang, Y. Changes of Riverbeds and Water-carrying Capacity of the Yellow River Inner Mongolia Section. In E3S Web of Conferences; EDP Sciences: Les Ulis, France, 2019; Volume 81. [Google Scholar] [CrossRef]
- Chen, X.; Zhang, H.; Chen, W.; Huang, G. Urbanization and climate change impacts on future flood risk in the Pearl River Delta under shared socioeconomic pathways. Sci. Total Environ. 2021, 762, 143144. [Google Scholar] [CrossRef] [PubMed]
- Fumagalli, F.; Muschalik, M.; Hüllermeier, E.; Hammer, B. Incremental permutation feature importance (iPFI): Towards online explanations on data streams. Mach. Learn. 2023, 112, 4863–4903. [Google Scholar] [CrossRef]
- Yuan, Z.; Chen, X. Decomposition-based reconstruction scheme for GRACE data with irregular temporal intervals. J. Hydrol. 2025, 662, 134011. [Google Scholar] [CrossRef]
- Shrestha, B.; Stephen, H.; Ahmad, S. Impervious Surfaces Mapping at City Scale by Fusion of Radar and Optical Data through a Random Forest Classifier. Remote Sens. 2021, 13, 3040. [Google Scholar] [CrossRef]
- Xu, Y.; Ji, X.; Zhu, Z. A photovoltaic power forecasting method based on the LSTM-XGBoost-EEDA-SO model. Sci. Rep. 2025, 15, 30177. [Google Scholar] [CrossRef]
- Graf, R.; Kolerski, T.; Zhu, S. Predicting Ice Phenomena in a River Using the Artificial Neural Network and Extreme Gradient Boosting. Resources 2022, 11, 12. [Google Scholar] [CrossRef]
- Safari, M.-J.-S.; Aksoy, H.; Mohammadi, M. Artificial neural network and regression models for flow velocity at sediment incipient deposition. J. Hydrol. 2016, 541, 1420–1429. [Google Scholar] [CrossRef]
- Akiba, T.; Sano, S.; Yanase, T.; Ohta, T.; Koyama, M. Optuna: A Next-generation Hyperparameter Optimization Framework. In Proceedings of the 25th ACM SIGKDD International Conference on Knowledge Discovery & Data Mining, Anchorage, AK, USA, 4–8 August 2019; pp. 2623–2631. [Google Scholar]
- Sun, W. River ice breakup timing prediction through stacking multi-type model trees. Sci. Total Environ. 2018, 644, 1190–1200. [Google Scholar] [CrossRef]
- Sun, W.; Lv, Y.; Li, G.; Chen, Y. Modeling River Ice Breakup Dates by k-Nearest Neighbor Ensemble. Water 2020, 12, 220. [Google Scholar] [CrossRef]
- Beltaos, S.; Prowse, T. River-ice hydrology in a shrinking cryosphere. Hydrol. Process. 2008, 23, 122–144. [Google Scholar] [CrossRef]
- De Coste, M.; Li, Z.; Pupek, D.; Sun, W. A hybrid ensemble modelling framework for the prediction of breakup ice jams on Northern Canadian Rivers. Cold Reg. Sci. Technol. 2021, 189, 103302. [Google Scholar] [CrossRef]
- Morse, B.; Hessami, M.; Bourel, C. Mapping environmental conditions in the St. Lawrence River onto ice parameters using artificial neural networks to predict ice jams. Can. J. Civ. Eng. 2003, 30, 758–765. [Google Scholar] [CrossRef]
- Niazkar, M.; Menapace, A.; Brentan, B.; Piraei, R.; Jimenez, D.; Dhawan, P.; Righetti, M. Applications of XGBoost in water resources engineering: A systematic literature review (Dec 2018–May 2023). Environ. Model. Softw. 2024, 174, 105971. [Google Scholar] [CrossRef]
- Salimi, A.; Ghobrial, T.; Bonakdari, H. A comprehensive review of AI-based methods used for forecasting ice jam floods occurrence, severity, timing, and location. Cold Reg. Sci. Technol. 2024, 227, 104305. [Google Scholar] [CrossRef]
- Küçükoğlu, M.; Kaya, Y. Global evolution of inland water levels: Drying-speed analysis using ICESat-2 ATL13. J. Hydrol. 2020, 664, 134486. [Google Scholar] [CrossRef]
- Zhang, G.; Gao, M.; Xing, S.; Kong, R.; Dai, M.; Li, P.; Wang, D.; Xu, Q. Automated Detection and Mapping of Supraglacial Lakes Using Machine Learning From ICESat-2 and Sentinel-2 Data. IEEE Trans. Geosci. Remote Sens. 2025, 63, 1–23. [Google Scholar] [CrossRef]
- Yin, J.; Medellin-Azuara, J.; Escriva-Bou, A.; Liu, Z. Bayesian machine learning ensemble approach to quantify model uncertainty in predicting groundwater storage change. Sci. Total Environ. 2021, 769, 144715. [Google Scholar] [CrossRef] [PubMed]
- Cappelli, F.; Grimaldi, S. Feature importance measures for hydrological applications: Insights from a virtual experiment. Stoch. Environ. Res. Risk Assess. 2023, 37, 4921–4939. [Google Scholar] [CrossRef]
- Qing, Y.; Wu, J.; Luo, J.-J. Characteristics and subseasonal prediction of four types of cold waves in China. Theor. Appl. Climatol. 2025, 156, 192. [Google Scholar] [CrossRef]
- Zhu, Z.; Li, T. Statistical extended-range forecast of winter surface air temperature and extremely cold days over China. Q. J. R. Meteorol. Soc. 2017, 143, 1528–1538. [Google Scholar] [CrossRef]



| Code | Candidate Predictors | Code | Candidate Predictors |
|---|---|---|---|
| X1 | Mean river discharge during the three days preceding the freeze-up date (m3/s) | X9 | Cumulative air temperature from the date when the daily mean turns below 0 °C to the freeze-up date (°C) |
| X2 | Mean river discharge from the appearance of drift-ice to the freeze-up date(m3/s) | X10 | Cumulative air temperature in November (°C) |
| X3 | Mean river discharge in November (m3/s) | X11 | Cumulative air temperature in the ten days before freeze-up (°C) |
| X4 | Mean river discharge thirty days before freeze-up date (m3/s) | X12 | Cumulative air temperature in the twenty days before freeze-up (°C) |
| X5 | Mean river discharge twenty days before freeze-up date (m3/s) | X13 | Cumulative air temperature in the thirty days before freeze-up (°C) |
| X6 | Bankfull discharge (m3/s) | X14 | Minimum daily mean air temperature between the appearance of drift-ice and freeze-up (°C) |
| X7 | Date of drift-ice appearance (d) | X15 | Maximum daily mean air temperature between the appearance of drift-ice and freeze-up (°C) |
| X8 | Cumulative air temperature from the appearance of drift-ice to freeze-up (°C) | X16 | Number of days until the 7-day cumulative air temperature drops below −45 °C (d) |
| Model | Prediction Using All Predictors | Prediction Using Optimal Predictors | ||||
|---|---|---|---|---|---|---|
| Count | MAE (d) | Method | Count | Factors Code | MAE (d) | |
| MLR | 16 | 3.07 | PFI | 4 | X16, X5, X4, X13 | 2.45 |
| SVR | 5.51 | PFI | 4 | X16, X5, X4, X13 | 4.58 | |
| XGBoost | 3.54 | ENR | 6 | X16, X7, X11, X4, X5, X8 | 3.27 | |
| MLP | 4.60 | PCC | 8 | X16, X4, X12, X11, X5, X1, X8, X13 | 3.56 | |
| Method | Predictors (Ranked by Feature Importance) |
|---|---|
| PCC | X16, X4, X12, X11, X5, X1, X8, X13, X9, X10 |
| PFI | X16, X5, X4, X13, X12, X8, X10, X11, X1, X9 |
| ENR | X16, X7, X11, X4, X5, X8, X1, X3, X2, X6 |
| RFE | X16, X7, X14, X15, X11, X10, X12, X4, X8, X5 |
| Model | Parameter | Description | Optimal Value |
|---|---|---|---|
| SVR | C | Error penalty strength | 1.2577 |
| kernel | Input data mapping method | linear | |
| gamma | Influence range of each data point | 0.0001019 | |
| XGBoost | learning_rate | Step size controlling boosting updates | 0.1958 |
| max_depth | Tree complexity | 2 | |
| min_child_weight | Minimum samples per child node | 1 | |
| subsample | Fraction of samples used per tree | 1 | |
| MLP | learning_rate_init | Learning rate for weight updates | 0.0082 |
| hidden_layer_sizes | Network depth and width | (32,) | |
| solver | Optimization algorithm for training | lbfgs | |
| activation | Nonlinear activation function | logistic | |
| max_iter | Maximum number of training iterations | 1308 |
| Regulation Stages | Level of Human Intervention | Cumulative Temperature Thresholds | ||
|---|---|---|---|---|
| Windows (d) | Thresholds (°C) | Daily Average (°C/d) | ||
| 1960–1968 | No major reservoir regulation; ice processes largely natural | 7 | −49 | −7.0 |
| 1969–1986 | Liujiaxia Reservoir begins operation; weak human intervention Joint Regulation Stage | 5 | −38 | −7.6 |
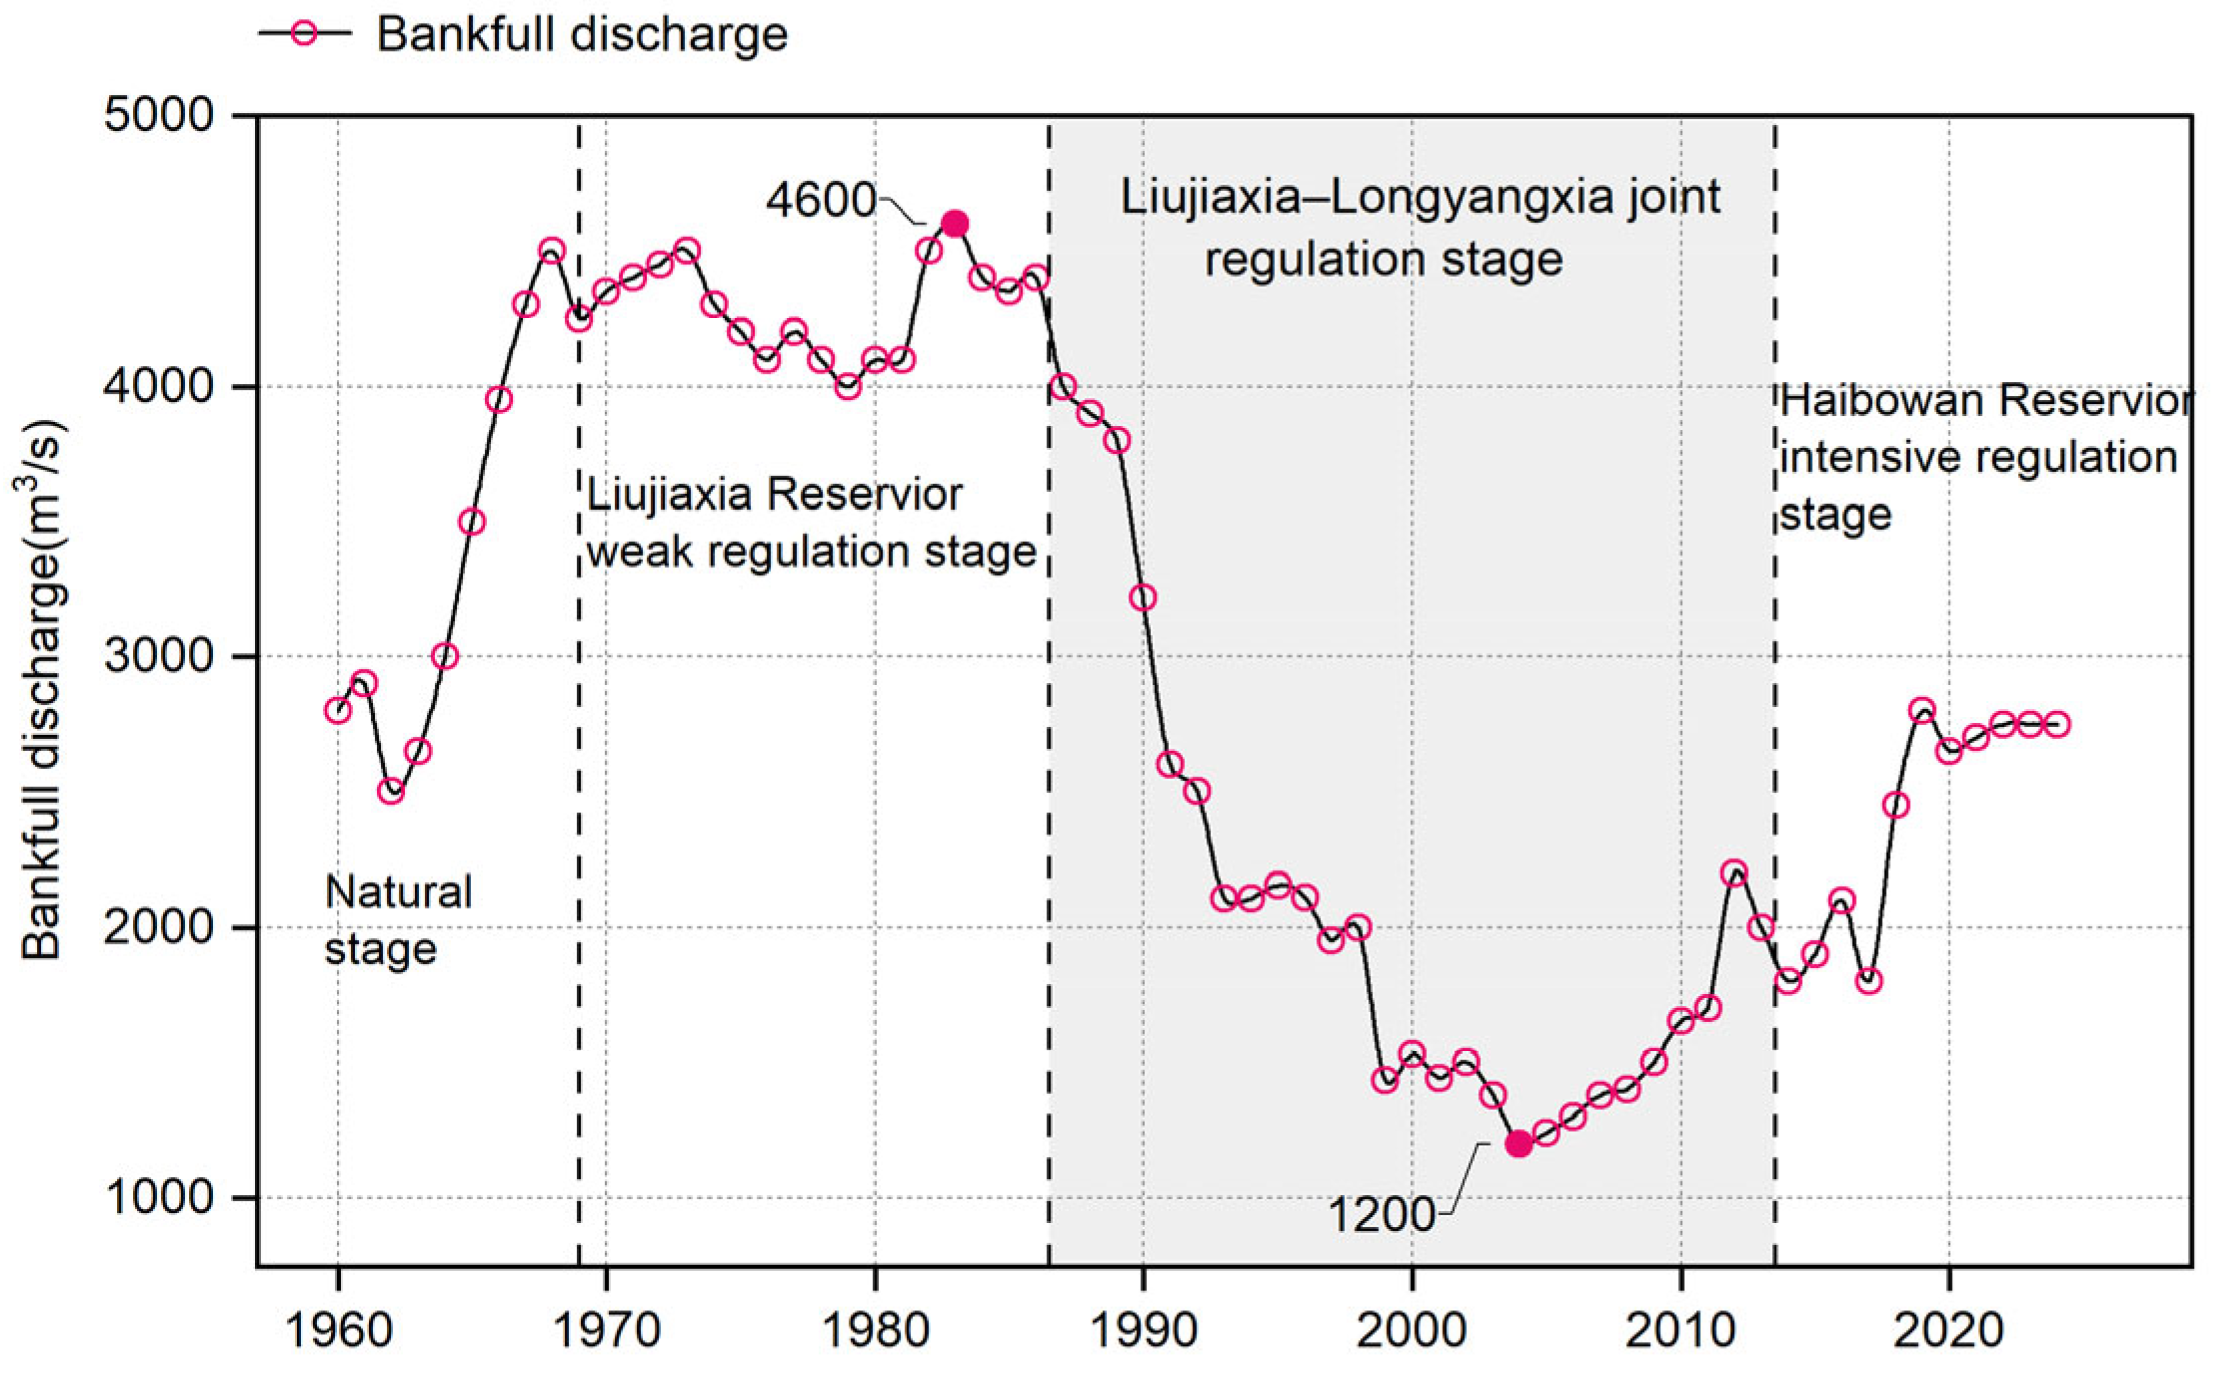
| 1987–2013 | Liujiaxia and Longyangxia reservoirs jointly regulated; moderate human intervention Deep Regulation Stage | 8 | −46 | −5.8 |
| 2014–2024 | Multi-reservoir combined regulation; intensive human intervention | 7 | −58 | −8.3 |
| Year | Prediction Error (d) | Lead Time | |||
|---|---|---|---|---|---|
| MLR | SVR | XGBoost | MLP | ||
| 2021 | −2.77 | −2.48 | −0.77 | 0.16 | 2 |
| 2022 | −3.34 | −2.18 | −0.99 | −3.97 | −6 |
| 2023 | −11.15 | −9.64 | −9.95 | −7.61 | 9 |
| 2024 | 1.51 | 1.35 | 0.07 | 0.71 | 1 |
Disclaimer/Publisher’s Note: The statements, opinions and data contained in all publications are solely those of the individual author(s) and contributor(s) and not of MDPI and/or the editor(s). MDPI and/or the editor(s) disclaim responsibility for any injury to people or property resulting from any ideas, methods, instructions or products referred to in the content. |
© 2025 by the authors. Licensee MDPI, Basel, Switzerland. This article is an open access article distributed under the terms and conditions of the Creative Commons Attribution (CC BY) license (https://creativecommons.org/licenses/by/4.0/).
Share and Cite
Zhang, L.; Liu, S.; Fan, M.; Chen, D.; Yuan, Z.; Zhang, X. Machine Learning Prediction of River Freeze-Up Dates Under Human Interventions: Insights from the Ningxia–Inner Mongolia Reach of the Yellow River. Water 2025, 17, 3357. https://doi.org/10.3390/w17233357
Zhang L, Liu S, Fan M, Chen D, Yuan Z, Zhang X. Machine Learning Prediction of River Freeze-Up Dates Under Human Interventions: Insights from the Ningxia–Inner Mongolia Reach of the Yellow River. Water. 2025; 17(23):3357. https://doi.org/10.3390/w17233357
Chicago/Turabian StyleZhang, Lu, Suyu Liu, Minhao Fan, Dongling Chen, Ze Yuan, and Xiuwei Zhang. 2025. "Machine Learning Prediction of River Freeze-Up Dates Under Human Interventions: Insights from the Ningxia–Inner Mongolia Reach of the Yellow River" Water 17, no. 23: 3357. https://doi.org/10.3390/w17233357
APA StyleZhang, L., Liu, S., Fan, M., Chen, D., Yuan, Z., & Zhang, X. (2025). Machine Learning Prediction of River Freeze-Up Dates Under Human Interventions: Insights from the Ningxia–Inner Mongolia Reach of the Yellow River. Water, 17(23), 3357. https://doi.org/10.3390/w17233357


