Article

Comprehensive Detection of Groundwater-Affected Ancient Underground Voids During Old Town Renewal: A Case Study from Wuhan, China

1
Faculty of Engineering, China University of Geosciences, Wuhan 430074, China
2
Hubei Shenlong Geological Engineering Investigation Institute Co., Ltd., Wuhan 430058, China
3
Faculty of Civil Engineering, Guangzhou Institute of Science and Technology, Guangzhou 510540, China
4
Xinjiang Water Conservancy Development and Construction Group Co., Ltd., Urumqi 830099, China
*
Author to whom correspondence should be addressed.
Water 2025, 17(23), 3356; https://doi.org/10.3390/w17233356
Submission received: 25 September 2025 / Revised: 18 November 2025 / Accepted: 21 November 2025 / Published: 24 November 2025

Abstract

Ancient underground voids present non-trivial hazards to urban redevelopment, particularly where groundwater conditions change during construction. We propose a staged, groundwater-aware workflow that integrates in-void mapping with area-scale geophysics and explicitly links water state to imaging performance. Following exposure of an undocumented masonry tunnel in a foundation pit in Wuhan (China), we acquired underwater CCTV and sonar during water-filled conditions, and, after drainage, collected ground-penetrating radar (GPR, 75–150 MHz) and ultra-high-density electrical resistivity tomography (UHD-ERT, 1 m electrode spacing) data. Calibration lines over the breach anchored the depth/geometry and reduced interpretational non-uniqueness. Analytical estimates using Archie-type and CRIM relations, together with observed signatures, indicate that drainage increased resistivity and reduced electromagnetic attenuation, improving UHD-ERT contrast and GPR penetration. The merged evidence resolves a straight-walled arch (~1.8 m wide × ~1.9 m high) at ~4–5 m depth with a sealed end 4 m south of the breach. Sonar confirms a northward segment measuring 45 ± 2 m to a sealed wall; a GPR void-type anomaly at ~57 m along trend represents a candidate continuation that remains unverified with current access. Within the resolution and sensitivity of the 2D survey, no additional voids were detected elsewhere on site. This case demonstrates that coupling in-void CCTV/sonar with post-drainage GPR and UHD-ERT, organized by hydrologic stage, yields engineering-grade constraints for risk control. The workflow and boundary conditions provide a transferable template for water-influenced, urban environments.

1. Introduction

1.1. Background

Ancient underground voids of human or natural origin—such as tunnels, tombs, abandoned culverts, underground rivers, and karst cavities—are widespread beneath cities undergoing continual construction and renewal [1,2,3]. These voids can compromise load-bearing capacity, trigger structural instability, and accelerate soil erosion, thereby threatening nearby structures and buried utilities [4,5,6]. The hazard is often amplified by shallow groundwater and transient saturation, which promote piping, softening, and collapse during excavation or dewatering. Because such voids vary in size and occur irregularly, they are frequently missed in preliminary investigations, and unexpected encounters during construction can cause accidents and substantial economic losses [7,8]. Rapid urbanization and large-scale renewal of old towns further exacerbate these safety challenges [9]. Consequently, comprehensive and effective detection of unknown ancient underground voids—explicitly accounting for water conditions—is critical for construction safety and urban resilience.
Underground voids that affect engineering projects are typically shallow—only a few to a dozen meters below ground—and may be air-filled or partly/fully filled with mud-water mixtures. Detection strategies for undocumented voids usually combine archival information, direct site investigations, and geophysical surveys [10,11,12,13]. In practice, however, direct access is often hindered by missing records, harsh internal environments, and lack of connectivity. Geophysical detection relies on pronounced contrasts in physical properties between voids and their host media. A range of methods—seismic [14,15,16], microgravity [17,18], microtremor [19,20], transient electromagnetic [21,22,23], GPR [24,25,26], and high-density electrical techniques [27,28]—provide efficient indirect evidence, but their performance is strongly conditioned by urban noise and, critically, by the water state at the time of acquisition [29,30,31]. Multi-method integration improves confidence [32,33], yet methods are often interpreted in isolation, and geophysical data alone seldom deliver the centimeter–decimeter geometry required for engineering decision-making. Overall, current practice remains constrained by single-source data and independent interpretations, limiting comprehensive assessment of underground targets in water-affected settings.

1.2. Void Types and Hydrology

Urban underground voids are not a single geological entity; rather, they comprise a mixture of natural karst and soil pipes, abandoned mine workings, coastal/transition-zone karst cavities formed by marine erosion or mixing corrosion, historic anthropogenic spaces (quarries, cisterns, tombs, tunnels), and secondary ground voids around modern municipal networks. Their hydrologic states span a continuum from air-filled, through intermittently wet, to perennially water-saturated [34,35,36]. The occurrence and behavior of these voids are closely tied to the urban geologic setting and human modification, and can be grouped as follows: (i) In inland karst and mining districts, cities underlain by carbonate or evaporite strata commonly host buried karst caves, “string-of-beads” cavities along transport corridors, paleokarst pockets, and underground rivers (e.g., along the Yangtze–Pearl River corridor in China, parts of Italy and Texas, USA [37,38,39]). These features are typically hydraulically active, with sedimented floors and aerated crowns when the water table lies below the roof; their saturation state changes with seasonal recharge or construction dewatering. Where urban expansion overlies historical mining, abandoned workings are often partly or fully flooded, and water–rubble mixtures control both resistivity/strength contrasts and stability [10,40]. (ii) In coastal and estuarine settings, sea caves produced by marine erosion are commonly hydraulically connected to seawater and strongly affected by tides and saline intrusion. Fresh–salt mixing enhances dissolution and alters bulk properties; saline backwater has been reported to influence sea caves and heritage passages in various coastal cities [41,42,43]. (iii) In loess, volcaniclastic, or alluvial terrains, sustained seepage and infrastructure defects can form soil pipes and voids, and karst river valleys may host underground rivers that fill and drain with river stage [44]. (iv) Historic anthropogenic spaces in old cities (e.g., Xi’an, Naples, Paris) [45,46,47] and modern sewer/storm networks [48,49] add further complexity: poor drainage and urban leakage lead to dripping, seepage, or ponding, and leakage/scour around defective segments creates secondary voids in the surrounding ground.
Across these types, the internal medium differs markedly and is tightly coupled to groundwater and surface-water conditions. Hydraulic connectivity to groundwater, rivers, or the sea is a primary control on void evolution and stability. In coastal and riverine cities with high water tables and abundant surface water, cavities more readily communicate with external water bodies; once connected, backwater can rapidly fill voids and erode roofs and walls. Intense rainfall injects water vertically, increasing overburden weight and weakening soils, thereby triggering abrupt collapse. In sum, urban voids are diverse and structurally complex and are strongly conditioned by hydrology—features that increase detection difficulty and collapse-hazard management challenges, especially under wet conditions [50].

1.3. Detection Methods

A range of geophysical and inspection techniques is used to detect underground voids and has yielded many successful urban applications. Common methods include CCTV, underwater sonar, GPR, and electrical resistivity tomography (ERT) (Table 1).
GPR, a near-surface electromagnetic reflection method, transmits high-frequency electromagnetic waves whose reflections/refractions image subsurface structures at centimeter-scale resolution [51,52]. Because high-frequency EM attenuates rapidly, GPR is best suited to targets shallower than ~30 m [53,54] and is particularly effective for voids or loosened zones within a few meters of the surface [55]. Performance is highly sensitive to medium properties: high moisture or salinity greatly increases attenuation; a high water table or saturated clays act as reflective barriers and create “blind zones” beneath [56]. Urban metal utilities and EM noise generate strong clutter and spurious reflections, complicating interpretation [57]. Radargrams typically require dewow, filtering, gain, background removal, and migration to obtain clear images, demanding operator experience [58]. Overall, GPR excels in dry, resistive, relatively homogeneous ground; effectiveness degrades in conductive media, high-water-table areas, or heavily reinforced environments.
Direct-current resistivity methods use multi-electrode arrays (e.g., Wenner, Schlumberger, dipole–dipole, gradient) to recover the subsurface resistivity distribution [59,60]. By combining the strengths of multiple arrays and performing joint inversion, improved images can be obtained [61,62]. ERT has proven effective for locating underground voids, assessing overburden deformation, delineating fractures, and tracking water dynamics [63,64,65,66,67]. Its principal advantage is sensitivity to deeper and larger voids: air-filled cavities typically present as high-resistivity anomalies, whereas cavities filled with conductive water or clay present as low-resistivity anomalies [68,69,70]. However, spatial resolution is limited, small or deep cavities may be smoothed out, heterogeneous host resistivity can mask anomalies, pervasive metallic utilities can distort current flow, and inversion is inherently non-unique [71,72,73,74]. In practice, ERT is best used as a regional screening tool coupled with targeted verification.
In-void optical/acoustic imaging (CCTV/sonar) is widely employed for surveying subsurface cavities and pipelines that are inaccessible to personnel, using optical and acoustic sensors to obtain precise measurements of internal geometry and condition [75,76,77]. CCTV provides intuitive imagery, high positional accuracy, and direct observation of interior defects or leakage [78,79,80], but is limited to line-of-sight and fails under highly turbid conditions [81,82,83,84]. Sonar forms images from acoustic echoes and is particularly effective for flooded or underwater voids where optical methods fail [85,86]. Because sound propagates well in turbid water, sonar can acquire geometric information under zero-visibility conditions, although it offers lower spatial resolution than optical video for small defects and may suffer from posture changes and multiple echoes [87,88].

1.4. Challenges and Objectives

In dense urban settings with complex sites, noise, interference, and fluctuating groundwater, each method faces substantive obstacles. Hardened pavements and buildings leave little open ground for surveys or equipment—especially restricting ERT (which requires electrode insertion) and internal methods (CCTV/sonar, which require access points). Subsurface infrastructure and anthropogenic heterogeneity (fills, utility trenches, legacy foundations) generate geophysical “look-alikes” that can mask or mimic real voids. Prior information greatly improves forward modeling and interpretation for both ERT and GPR [45], yet partially infilled cavities (soil, debris, rubble) remain difficult to recognize and position [89]. Moisture conditions further complicate detection: high soil water markedly reduces GPR effectiveness and depth of investigation, with continuous water layers or wet clays creating blind zones beneath; although ERT generally performs better in saturated soils, pervasive groundwater can compress resistivity contrasts. CCTV and sonar provide high-accuracy mapping inside water-bearing, accessible voids, but are constrained by internal conditions and traversability.
Most published studies emphasize a single void type or methods validated under dry, ideal conditions (e.g., dry karst or purely air-filled cavities). Actual urban settings are more complex: historic voids are old, poorly documented, and subject to dynamic hydrology (proximity to rivers/lakes, high groundwater). Systematic field evidence and mature multi-method integrations for “water-affected historic voids” are scarce. In particular, few frameworks explicitly stage data acquisition with respect to water level (water-filled vs. post-drainage) and integrate in-void “ground truth” with surface geophysics in a unified interpretation scheme.
In response to these gaps, this paper presents a case study from Wuhan, China, where an ancient man-made void was exposed during excavation for the renewal of an old residential area, prompting a construction halt due to safety concerns. We pursue four aims: (i) to determine the internal geometry of the exposed void at centimeter scale; (ii) to delineate its precise spatial position and trajectory; (iii) to assess whether additional voids exist within the study area; and (iv) to place the findings in the context of prior detection studies. To this end, we develop a groundwater-aware, staged workflow that integrates underwater CCTV and sonar (local geometry) with post-drainage GPR and UHD-ERT (area-scale mapping), explicitly leveraging water-level change (water-filled vs. post-drainage stages) to enhance geophysical contrasts and reduce interpretational ambiguity. By combining local metric measurements with area-scale coverage, the approach yields actionable detection for hazard mitigation and safer urban renewal.

2. Materials and Methods

2.1. Study Area

Wuhan, Hubei Province, China (Figure 1a), is a national historic city underlain in part by carbonate bedrock (≈1122 km2; ~13.1% of the municipal area), where widespread karstification has produced numerous undocumented cavities. Continuous renewal of old residential districts since 2011 and dense underground infrastructure have increased the likelihood of encountering such voids during excavation, with attendant safety and construction-risk concerns.
The study site lies within an old residential renewal project (Figure 1b) comprising two towers and four podiums. During west-side foundation works, the roof of a previously unrecorded masonry tunnel was breached near the center of the pit floor. Visual inspection through the opening revealed a chamber infilled by muddy water and collapse debris, trending approximately north–south and lying entirely beneath the excavation base, adjacent to the existing east-side foundation. Works were suspended pending investigation.
Locally, the stratigraphic succession is clay→clay-gravel→gravelly soil→residual soil→mudstone→marl→limestone. The marl–limestone interval shows karst features and shallow groundwater, providing plausible conduits and chambers. In the days immediately before and after the breach, the site experienced continuous rainfall: the chamber became fully water-filled, and ground around the pit turned water-saturated/muddy, restricting safe access and precluding any pre-drainage surface geophysics. Operationally, surveys were conducted on the floor of an excavation pit beneath a steel bracing truss that spanned nearly the entire site; metal stockpiles were present on the pit floor, and the proximity to an institute and residential buildings imposed strict noise/vibration limits.

2.2. Hydrologic Staging and Timeline

A two-stage acquisition strategy followed the site hydrology. A multi-day rainfall sequence spanning the day of exposure (≈day −1 to +2) left the chamber fully water-filled and the near surface saturated/muddy; thus only remotely operated in-void methods (underwater CCTV and sonar) were feasible immediately after exposure. After controlled pumping and two rain-free days, both the chamber and shallow soils drained sufficiently to enable surface geophysics (GPR and UHD-ERT). All datasets were time-stamped and referenced to a common site timeline (Table 2). For cross-modal calibration, one GPR line (L1) and one ERT line (D1) were positioned directly above the breach to tie surface responses to the in-void “ground truth.” No surface GPR/ERT were attempted prior to drainage due to strong near-surface attenuation (GPR) and unsafe, unstable deployment conditions for dense electrode arrays (ERT).

2.3. Methods

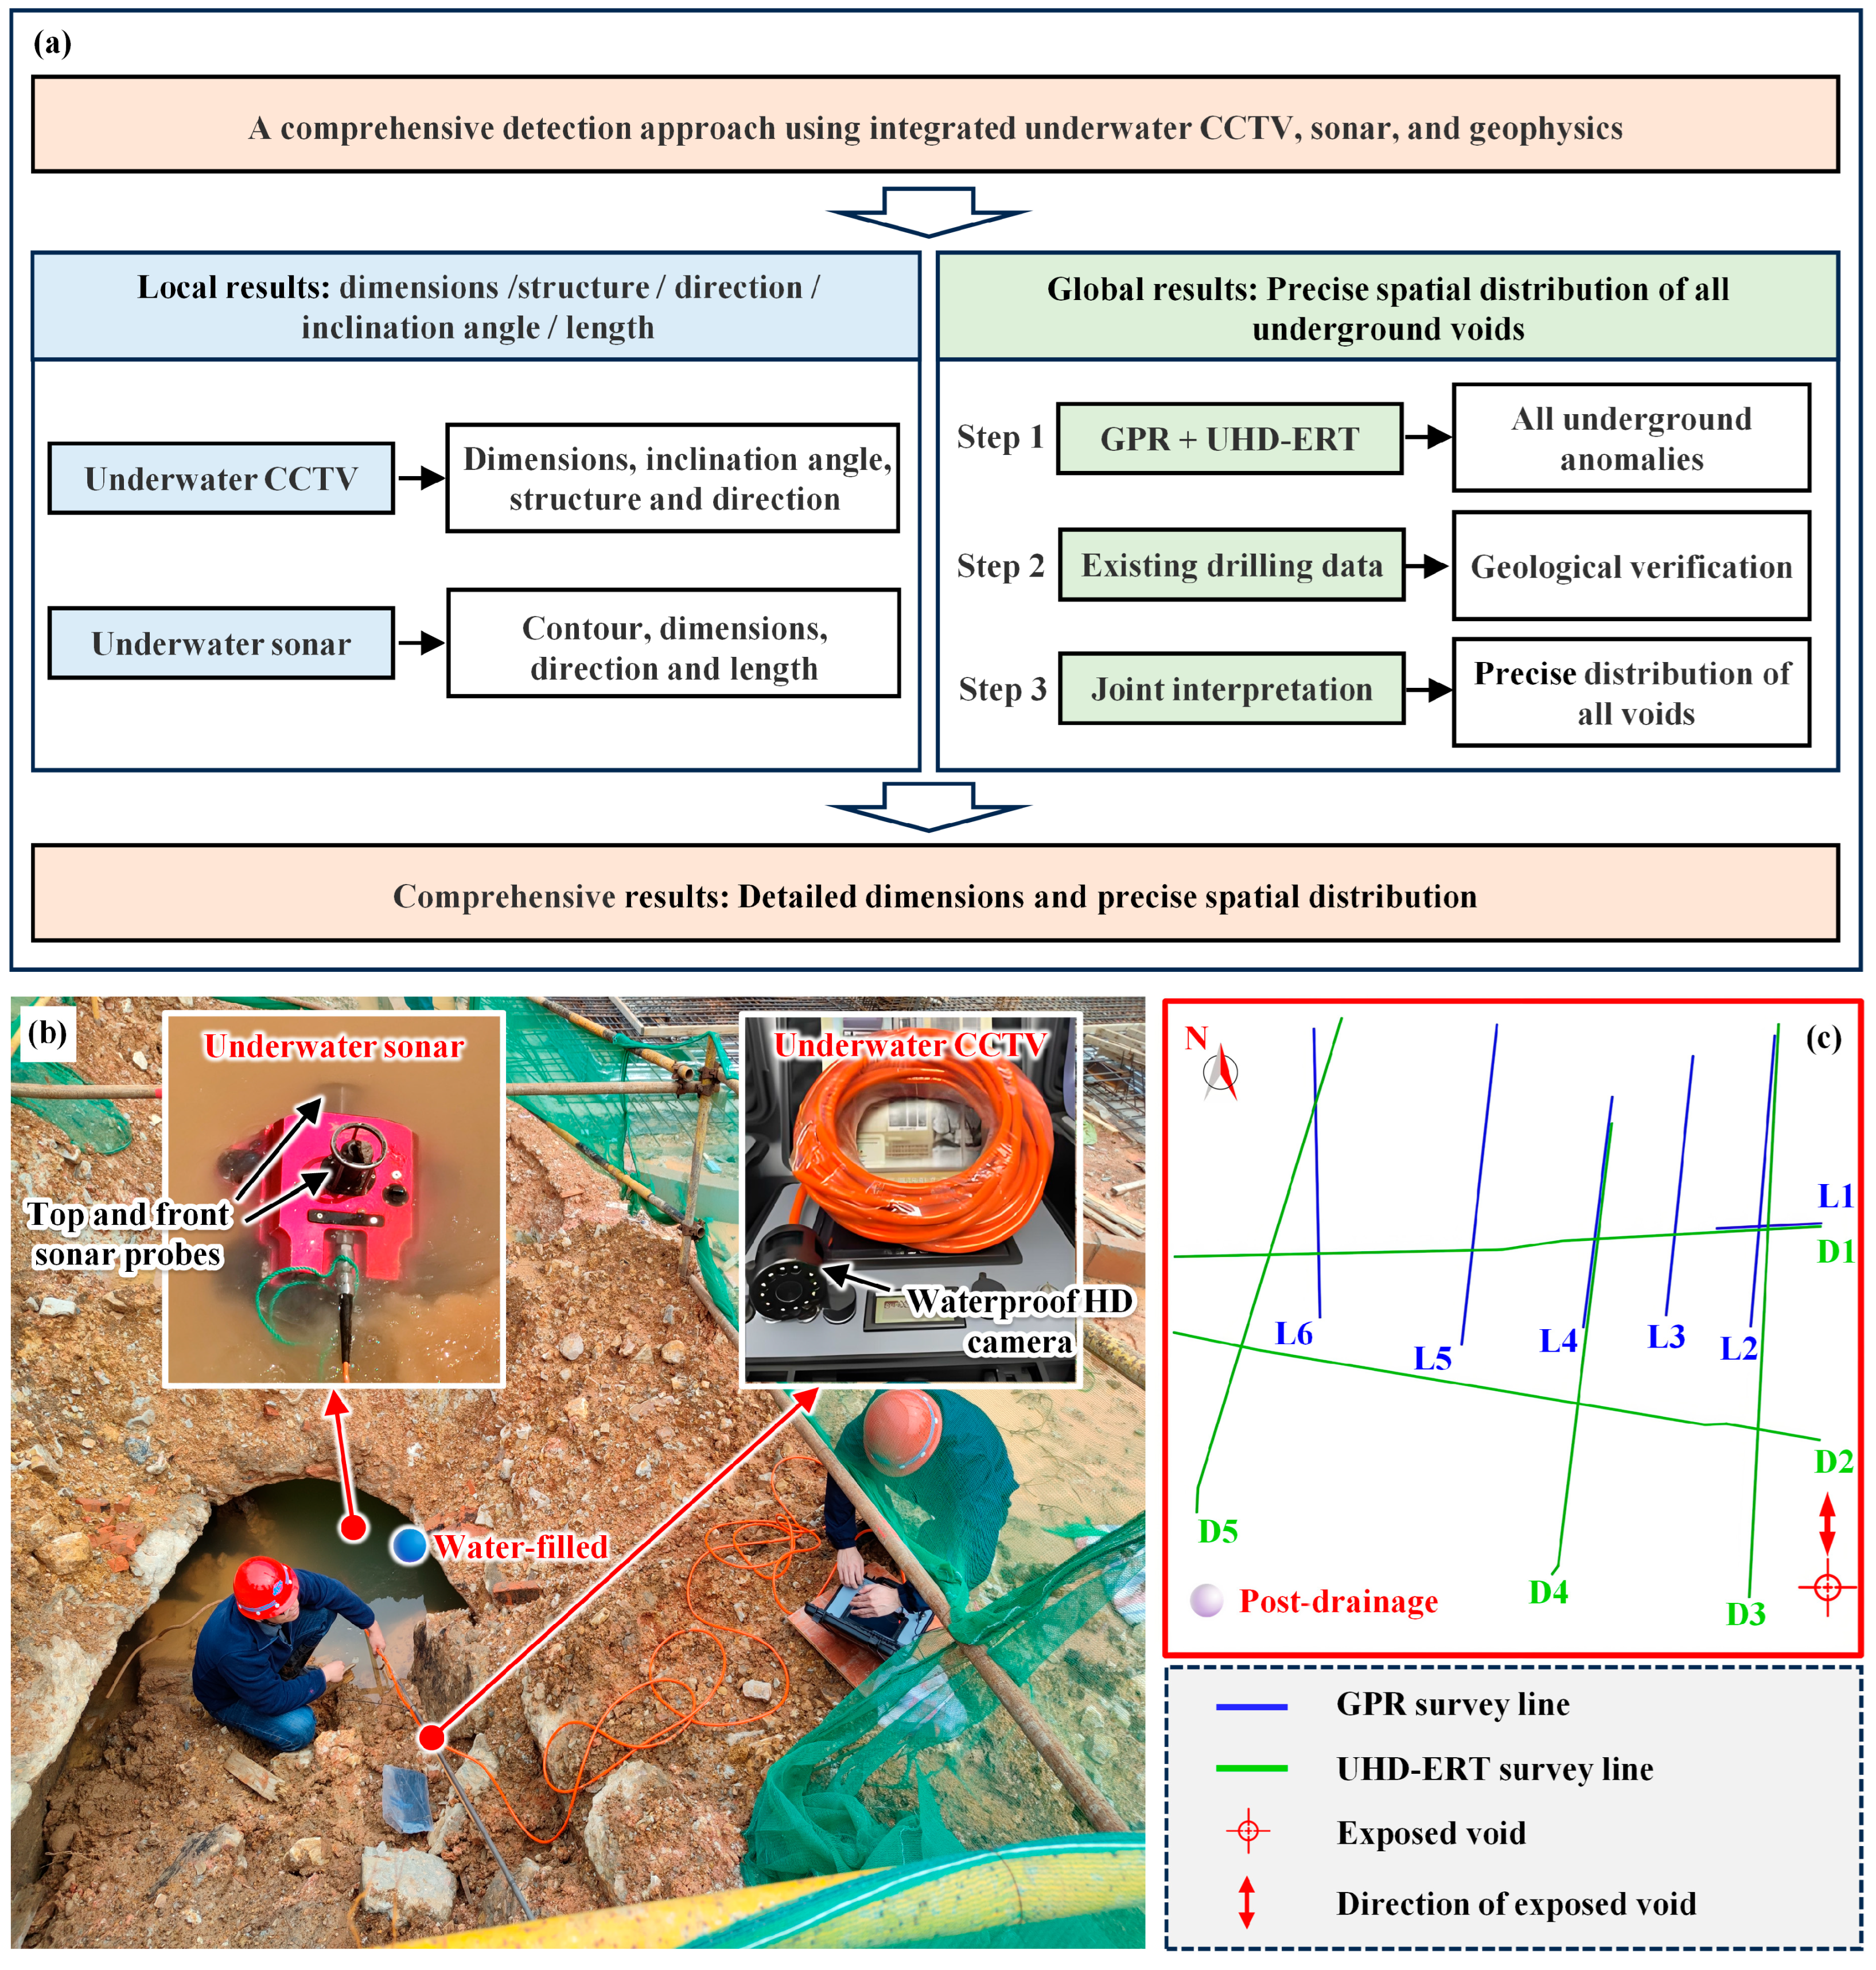
Given the lack of archival/borehole control, the requirement for engineering-grade geometry, and the need for rapid yet comprehensive coverage, we adopted a staged local-to-global workflow coupled to the site hydrology (Figure 2a). Immediately after exposure under fully water-filled conditions, underwater CCTV and sonar were inserted through the breach to document internal morphology (arched roof, straight walls, sealed end), obtain metric roof–floor distances, and constrain the along-chamber trend; the breach served as the spatial origin for all subsequent datasets. In addition, the rainy, water-saturated working surface, the overhead steel bracing that nearly covered the pit, extensive metal clutter on the pit floor, and strict noise constraints from adjacent institute and residential buildings collectively constrained instrument deployment and favored a low-noise, access-limited sequence (in-void CCTV/sonar under water-filled conditions, followed by post-drainage GPR and UHD-ERT).
Figure 2. Comprehensive detection approach for unknown ancient underground voids (a) Schematic of the technology roadmap of this study, showing the detection process and available data. (b) Underwater CCTV photogrammetry and underwater sonar imaging detection. (c) GPR and UHD-ERT survey lines in geophysical detection area.
Water 17 03356 g002
After drainage, surface geophysics targeted the CCTV/sonar-constrained area (red box in Figure 1b): transverse calibration profiles directly above the breach—L1 (GPR) and D1 (UHD-ERT)—were used to fingerprint the cavity response under post-drainage conditions, and additional longitudinal/cross lines provided area coverage (Figure 2c). All datasets were co-registered in a CAD/GIS framework and interpreted under a unified QC protocol; anomalies were retained as void candidates only when they showed cross-method consistency (compatible geometry/depth) and cross-line coherence in plan view. The quantitative effect of drainage on contrast and attenuation is evaluated in Section 4.4.

2.3.1. Underwater CCTV

A waterproof HD camera (1920 × 1080) on modular 2 m push rods was advanced ≈4 m through the breach to image the upper dry segment and a further ≈10 m into the submerged chamber (Figure 2b). Standard bricks at the breach were measured in situ (length 0.240 m, height 0.053 m) and used as a scale bar for frame-based measurements (arch span/rise, stair inclination). Processing included selection of sharp frames, lens-distortion correction from manufacturer intrinsics, and single-image measurements referenced to the brick gauge. Linear dimensions were obtained by counting bricks and multiplying by the in situ size. Uncertainty combines brick-size tolerance (±3 mm on 0.240 m; ±1 mm on 0.053 m), counting/edge-picking (±0.1 brick in width, ±0.5 brick in height), and residual perspective (≈2–3%), yielding a conservative ±3–5% relative error for CCTV-derived dimensions.

2.3.2. Underwater Sonar

A pipeline robot (X7-DS; Wuhan Easy-Sight Technology Co., Ltd., Wuhan, China) with a dual 1 MHz imaging head (conical beamwidth ≈1.1°) was inserted through the breach and driven to the sealed end, logging continuous acoustic profiles during controlled retraction (Figure 2b). The top-front mount provided forward-looking, near-roof coverage while maintaining line-of-sight to sidewalls. Vehicle speed was kept low with brief pauses at tie points to limit posture-induced smearing; data were mosaicked to plan- and profile-view images and co-registered to the breach origin. At typical stand-off distances of 1–1.5 m, the 1.1° beam yields a ≈2–3 cm lateral footprint, so roof/floor range picks carry ±2–3 cm uncertainty; minor along-track drift may blur long-axis distances but does not affect local height measurements.

2.3.3. GPR

Post-drainage, six GPR lines were acquired with a Zond-12e system using 75–150 MHz rod antennas (Figure 2c). Trace spacing was 0.10 m, enforced with a ground-laid measuring tape; line end-points were georeferenced by RTK-GPS. To display the entire disturbed clay–gravel sequence we used a 400 ns time window, 512 samples/trace (Δt ≈ 0.8 ns) and 4 stacks/trace. Processing (Zond/Reflex) followed a fixed flow: dewow→time-zero correction→background (average-trace) removal→band-pass (≈70–180 MHz) →time-varying gain→Kirchhoff migration (calibration line only)→depth conversion.
Velocity estimation and depth conversion. On calibration line L1 directly above the mapped breach, diffraction hyperbolae from the cavity roof/wall apices were fitted, yielding v = 0.09 ± 0.01 m/ns (εr ≈ 11–14), consistent with drained clay–gravel. All profiles were depth-converted with z = vt/2. Propagating the velocity bounds gives ±10–12% depth uncertainty at 5–8 m two-way times. The effective interpretation window is 0–8 (–10) m where SNR is highest and the target occurs; deeper banded features are recognized as acquisition/processing artifacts and were not used to infer additional cavities.

2.3.4. UHD-ERT

The ultra-high-density electrical resistivity tomography (UHD-ERT) technique employed in this study significantly enhances data acquisition capabilities, capturing over 40 times the data compared to conventional methods. Each electrode functions both as a power supply and a measurement electrode, with the instrument host managing various electrode combinations and spacings to create an integrated power supply, measurement, and automatic data collection system. We employed a FlashRES-64 full-channel resistivity system (ZZ Resistivity Imaging, Perth, Australia) with 64 electrodes and 61 simultaneous potential channels [90,91]. In full-channel mode the instrument energizes the subsurface with a pair of current electrodes while one reference electrode and 61 potential electrodes record voltages simultaneously, greatly increasing coverage per current injection. For each profile, electrodes were planted at 1.0 m spacing; line end-points and elevations were surveyed with RTK-GPS for subsequent topographic correction.
To exploit complementary sensitivities, the system was programmed to acquire a multi-array schedule in a single pass, including Wenner–Schlumberger, Dipole–Dipole, and Gradient arrays. This consolidated acquisition improves resolution of both lateral and vertical resistivity variations relative to any single array. Electrode contact resistances were checked by the instrument diagnostics before acquisition; failing electrodes were re-seated and wetted with brine until “pass”. Readings failing reciprocity or quality-factor thresholds were discarded. Joint 2.5-D inversions (ZZRESINV) used L2 smoothness regularization with robust data weighting, relative error floor 3–5% plus a small absolute floor, topography included; iterations stopped when ΔRMS < 1% or after 8–10 iterations.

2.3.5. Anomaly Classification Criteria

We classified anomalies into three categories using method-specific attributes and cross-line coherence: (i) Void signature. GPR: a discrete phase break with flanking diffractions whose apex depth matches the L1 calibration within ±0.5 m, hyperbola fit consistent with v = 0.09 ± 0.01 m/ns, and envelope-to-local-RMS amplitude ratio ≥ 2.5. UHD-ERT: a closed resistivity loop with contrast relative to the local background ρ a n o m / ρ h o s t ≥ 1.8 (air-dominated) or ≤0.7 (water/mud-filled), minimum size ≥ 2 electrode spacings. Cross-line rule: the feature recurs on the nearest intersecting/adjacent line within ≤2 m plan offset at compatible depth. (ii) Geological heterogeneity. Layer-parallel bands or broad zones that extend along stratigraphy or moisture gradients, lacking closed loops on UHD-ERT and lacking diagnostic GPR diffractions; resistivity contrast typically <1.5× and/or diffuse GPR texture. (iii) Geological anomaly (uncertain/non-void). Localized responses that meet a single-method threshold but fail cross-line coherence, violate depth/size plausibility (e.g., >10 m depth for man-made voids), or are unstable under inversion parameter tests. These are retained as geological or moisture-related anomalies rather than voids.
To reduce non-uniqueness, anomalies are retained only when the morphology, depth, and plan position are mutually consistent across methods and with the site stratigraphy (Figure 8). For cross-referencing, GPR anomalies are labeled A-L* and UHD-ERT anomalies A-D*; positions are reported as (along-line distance, depth) in meters. Findings directly cite the relevant figure/panel (e.g., “Figure 5a, A-L1, 1.0–1.8 m, 3.8–4.5 m”).

3. Results

3.1. Underwater CCTV Results
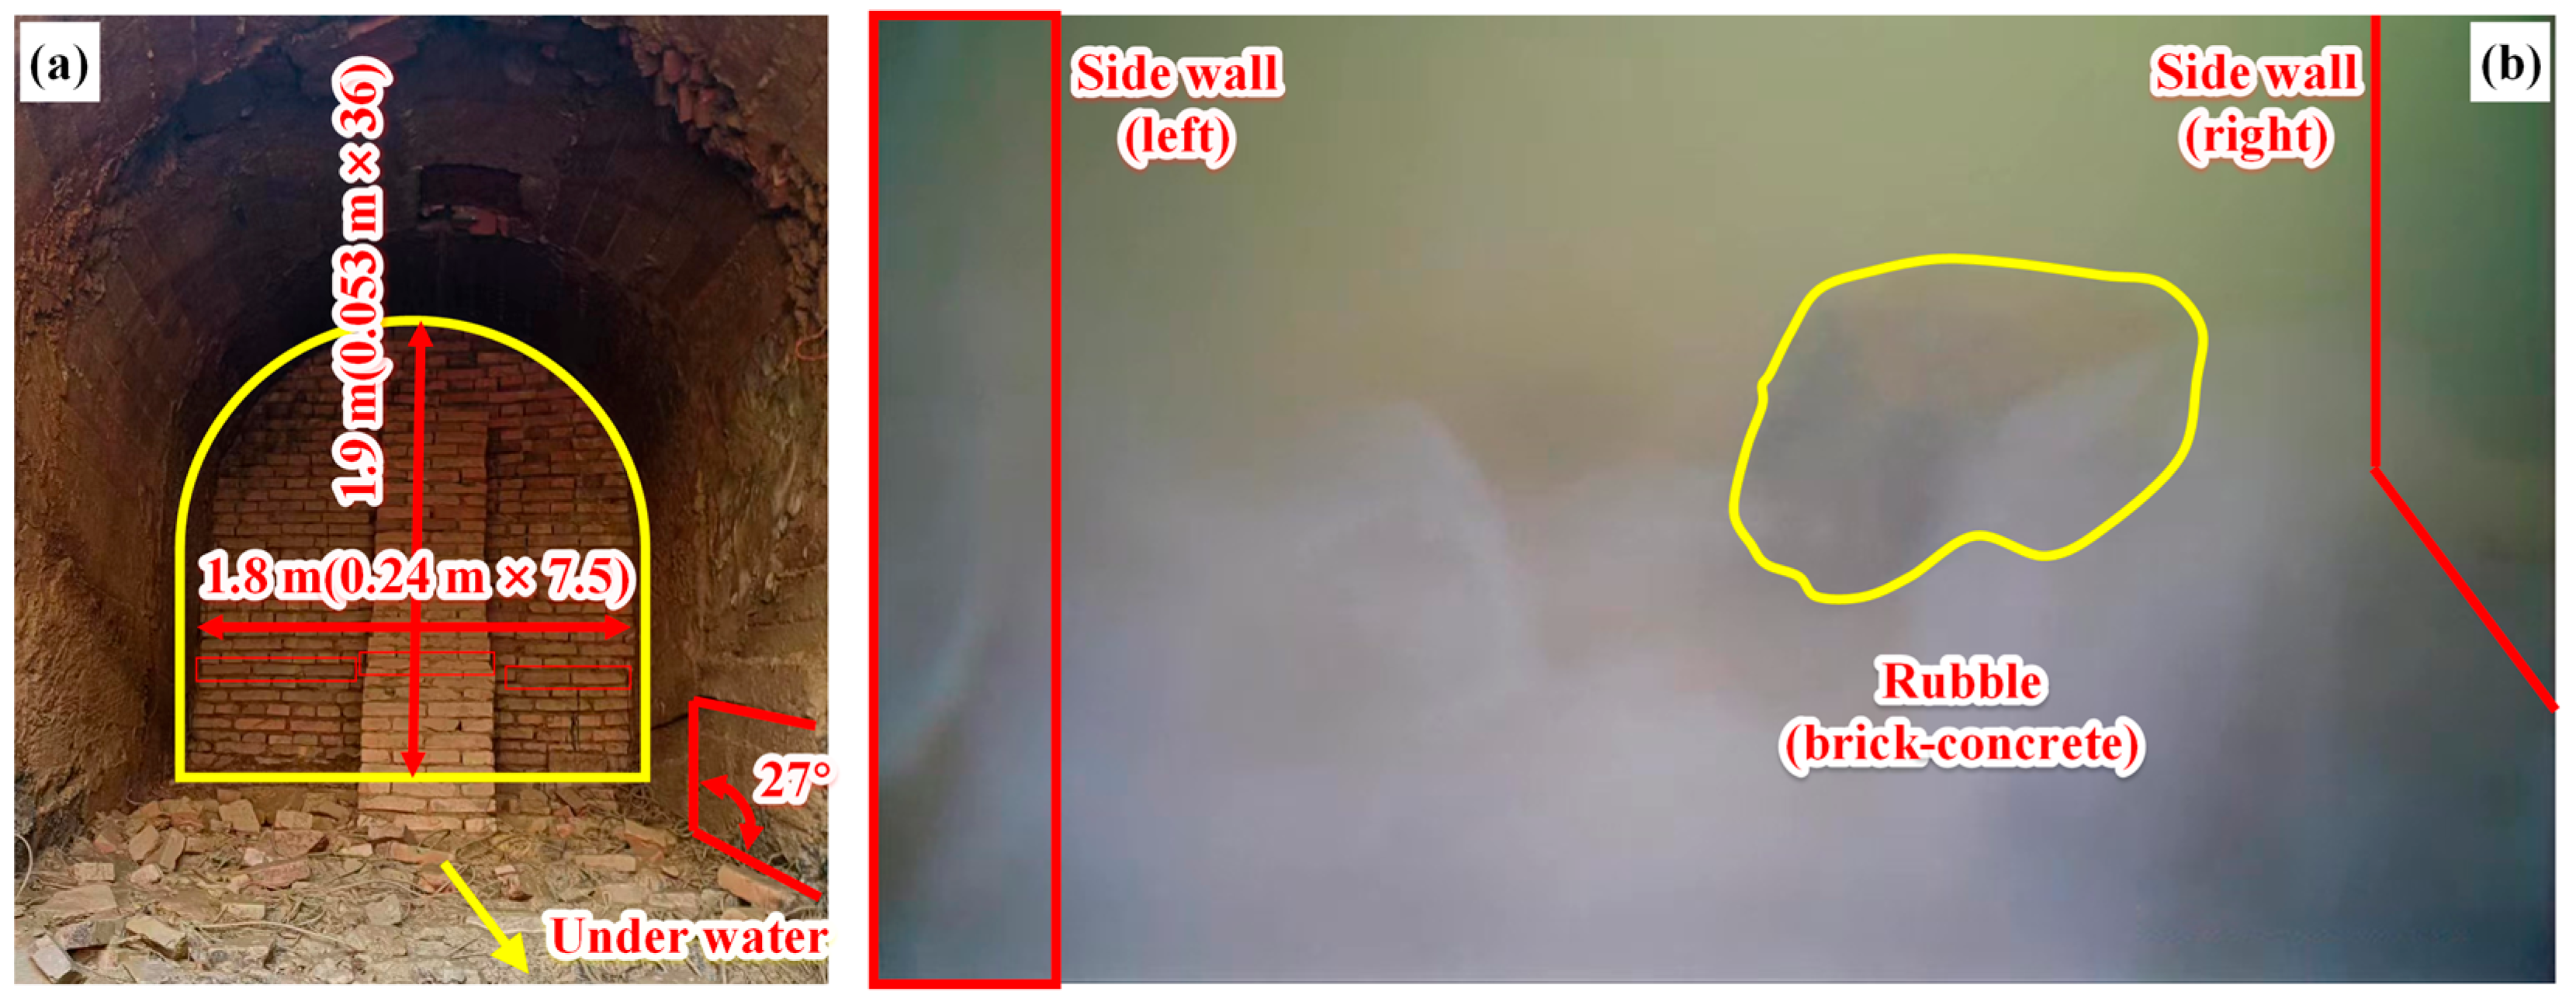
Above the waterline, the chamber exhibits a straight-walled brick-and-concrete arch that extends ~4.0 m to a sealed brick wall. Using the brick gauge, the arch span is 1.80 m (7.5 × 0.240 m) and the rise is 1.90 m (36 × 0.053 m); stairs at the breach descend at ~27° (Figure 3a). Below the breach, the camera was advanced ~10 m into the submerged segment. The interior shows extensive mud and rubble, and the sidewalls are only faintly visible under turbid conditions (Figure 3b). Within the limits of visibility, the cross-section remains consistent with a straight-walled arch comparable to that observed in the dry segment.
Figure 3. Internal views of the exposed void above and below water. (a) Image and geometric dimensions of dry cavity above the breach. (b) Structure and internal environment of the underwater section.
Water 17 03356 g003
Because linear dimensions were derived from brick-referenced image measurements, we quantified (i) brick-size tolerance (±3 mm on 0.240 m; ±1 mm on 0.053 m), (ii) counting/edge-picking uncertainty (≈±0.1 brick on width; ≈±0.5 brick on height), and (iii) residual perspective (≈2–3%). Combining these contributions yields a conservative ±3–5% relative uncertainty for CCTV-derived dimensions reported above.

3.2. Underwater Sonar Results

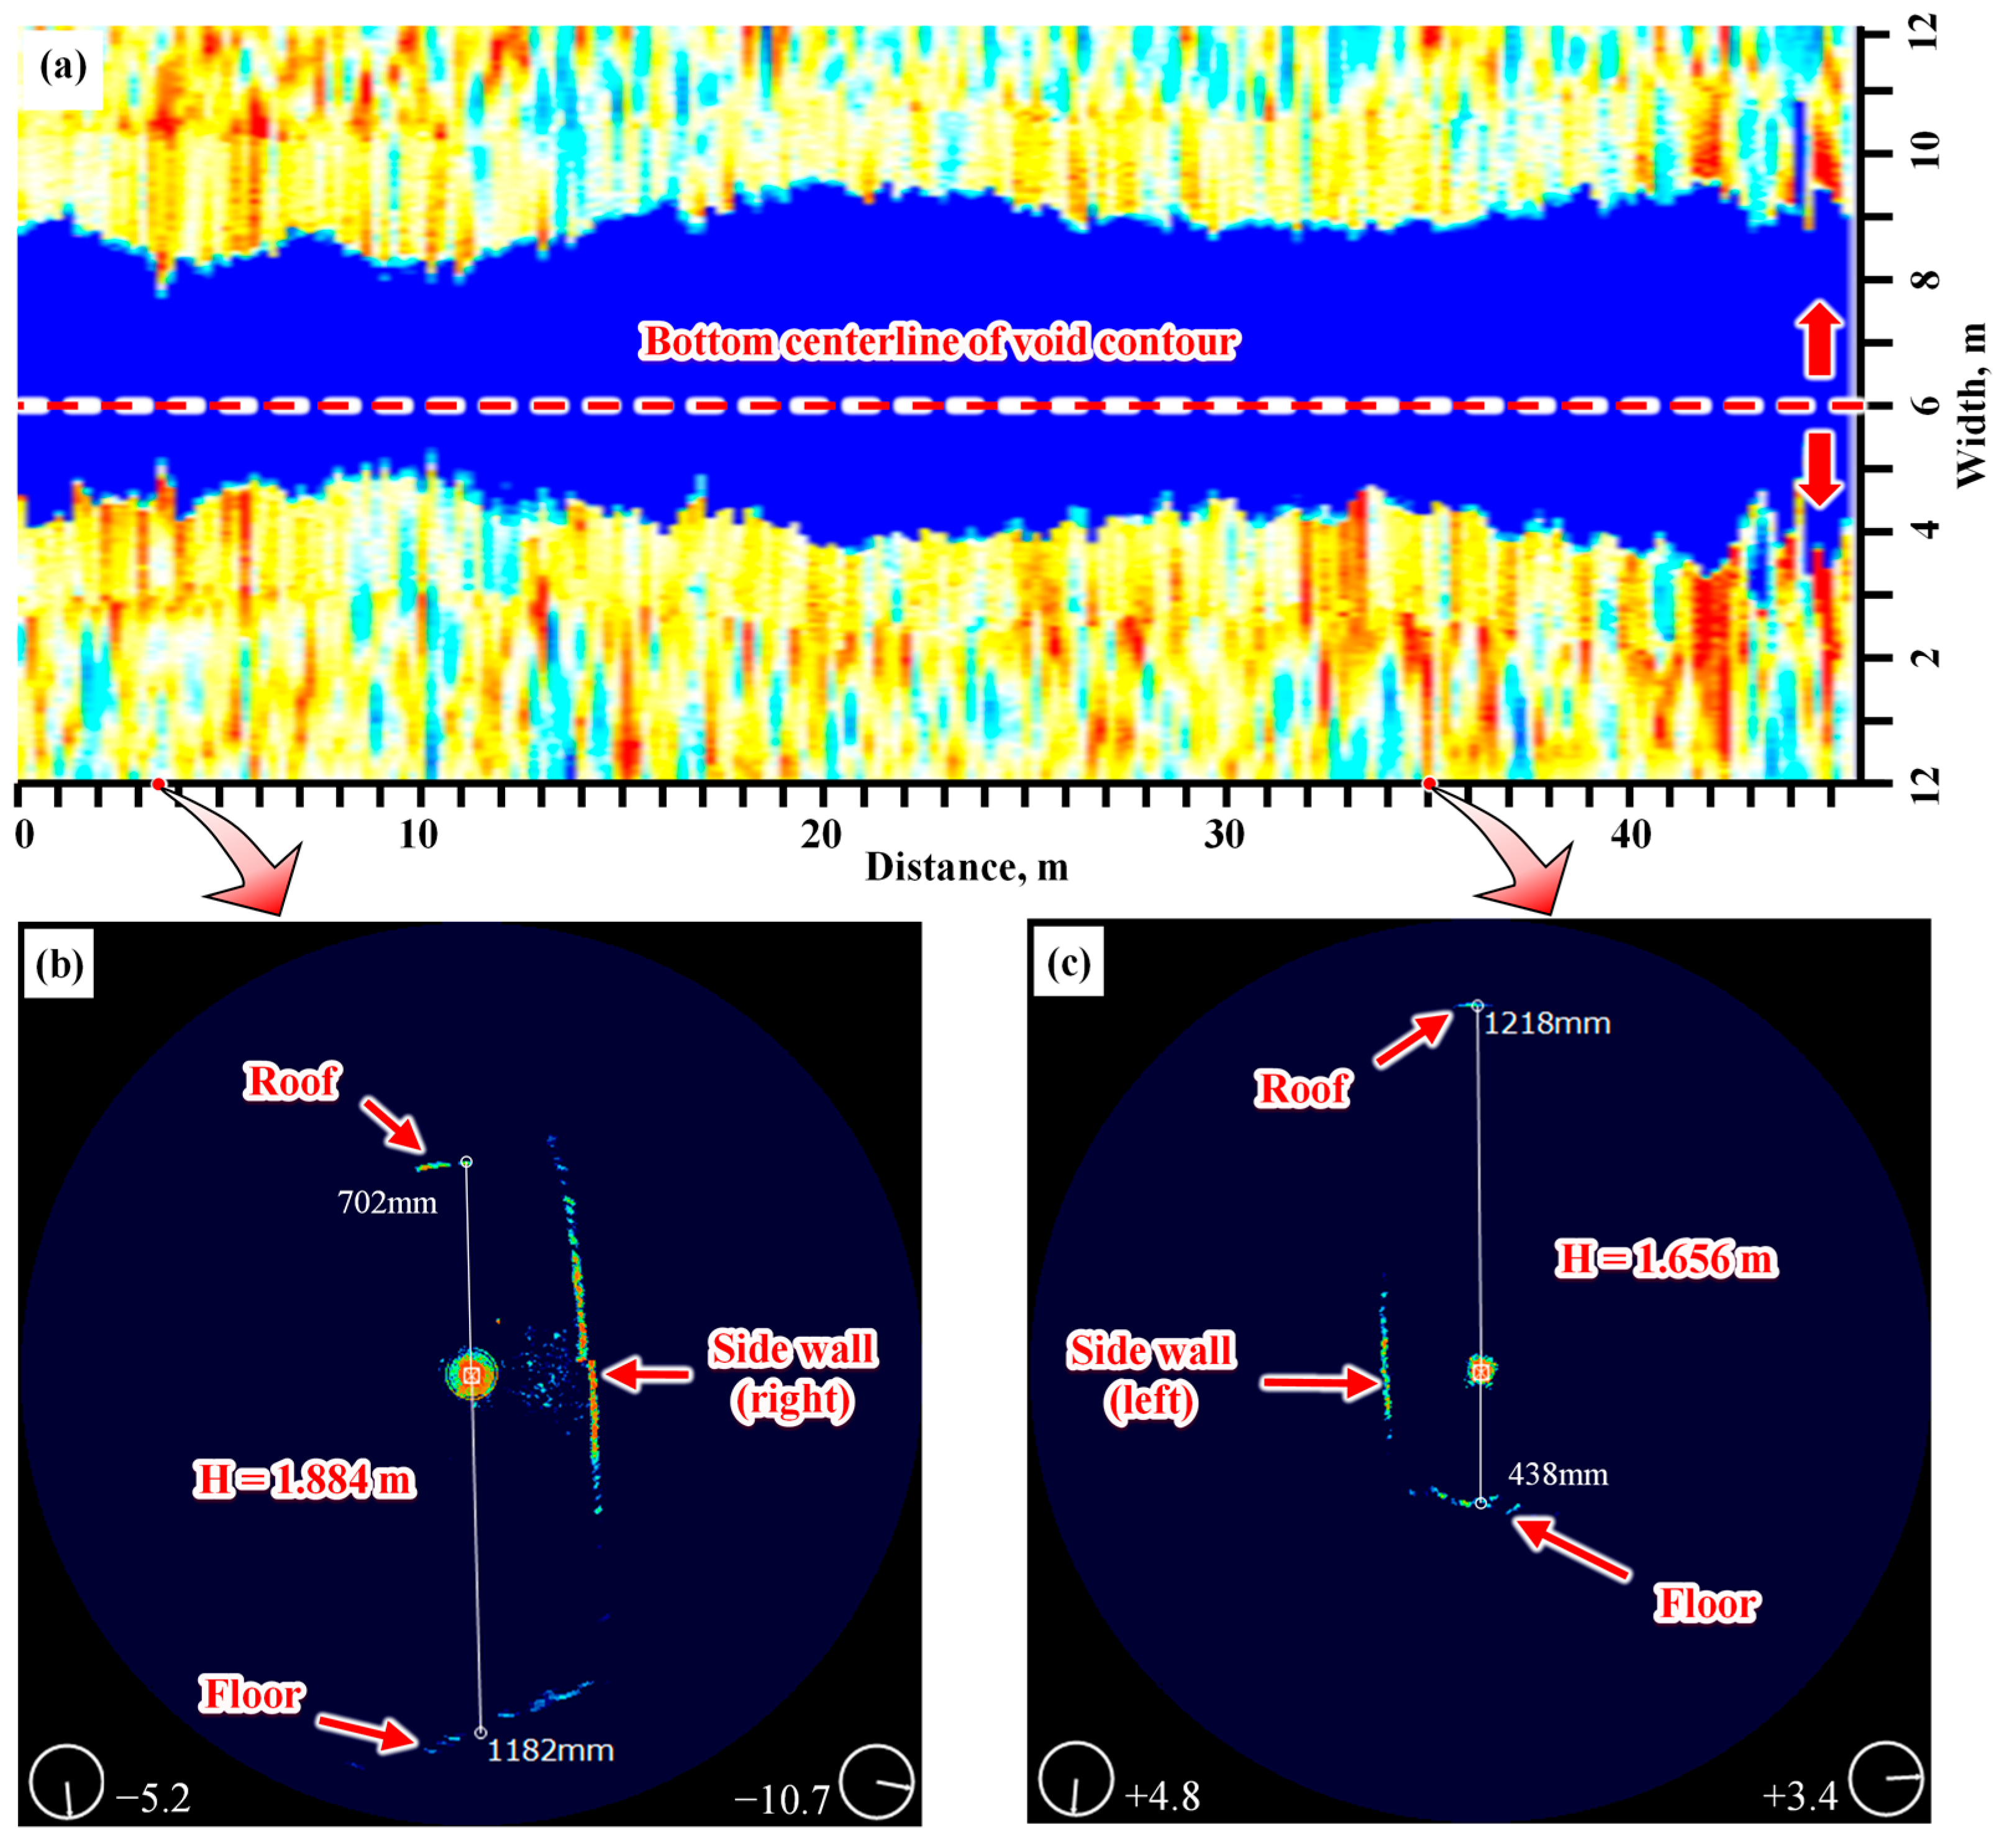
The underwater robot traversed approximately 45 m to reach the sealed end of the chamber (Figure 4a), confirming that the void extends this distance from the breach without significant deviations. Reflective signals from the interior of the exposed void were successfully obtained using the underwater robotic sonar probe, which clearly delineated the straight walls and arched ceiling.
Sonar scans provided chamber height measurements at the roof and floor as 1.884 m (Figure 4b) and 1.65 m (Figure 4c), respectively. These measurements align well with the 1.9 m documented through underwater photography. The sonar system’s ability to resolve the internal geometry under submerged conditions contributed significantly to confirming the chamber’s dimensions and structural characteristics. Additional uncertainty arises from slight deviations from the expected straight-line travel path, which can cause minor positional drift in the mosaicked data. Despite these minor artifacts, the roof and floor measurements remain reliable and are consistent with the values recorded by underwater photography.
Figure 4. Sonar scan results inside the exposed void. (a) Panoramic view of sonar profile data, unfolded from the bottom-center toward both edges. (b,c) are the cross-sectional view of sonar reflection signals.
Water 17 03356 g004

3.3. GPR Results

Across all GPR lines, three significant anomalies were identified on L1 and L2 (Figure 5). On L1, phase discontinuities with flanking diffractions at approximately 4.0 m depth coincide with the mapped position of the exposed void and are treated as the reference signature (Figure 5a, A-L1, 0.8–1.8 m along-line; 3.8–4.5 m depth) for cavity detection. On L2, the right-side packet (Figure 5b, A-L2-1, ~4–6 m, ~4.5–5.5 m depth) mirrors A-L1 and falls on the extrapolated trend, consistent with a continuation of the same void. The left-side feature (A-L2-2) is broader and deeper (to approximately 10 m), lacks cross-line support and diagnostic geometry, and is attributed to geological heterogeneity (Figure 5b, A-L2-2, ~17–22 m, to ~10 m depth), with no cross-line support. Other lines do not exhibit diagnostic void-type responses across L3–L6 (Figure 5c). Depths are converted with v = 0.09 m/ns (see Section 2.3.3), unless stated otherwise
Taken together, A-L1 and A-L2-1 show coherent void-type diffraction packets at ~4–5 m depth (Figure 5a,b), whereas A-L2-2 lacks diagnostic geometry and cross-line corroboration (Figure 5b,c). The anomalies on L1 and L2 were characterized by diffraction patterns typical of voids, with their depth and location suggesting the presence of an underground void consistent with the previously observed geological features. The spatial distribution of these anomalies in the GPR profiles further corroborates the existence of the void, extending beyond the breach and continuing along the expected void axis.
Figure 5. GPR anomalies and locations. (a) L1 with void-type packet A-L1 (red rectangle; 0.8–1.8 m along-line; 3.8–4.5 m depth). (b) L2 with A-L2-1 (void-type) and A-L2-2 (heterogeneity). (c) Plan of L1–L6; numbered red circles ①–③ correspond to A-L1, A-L2-2, A-L2-1. Depths assume v = 0.09 m/ns.
Water 17 03356 g005

3.4. UHD-ERT Results

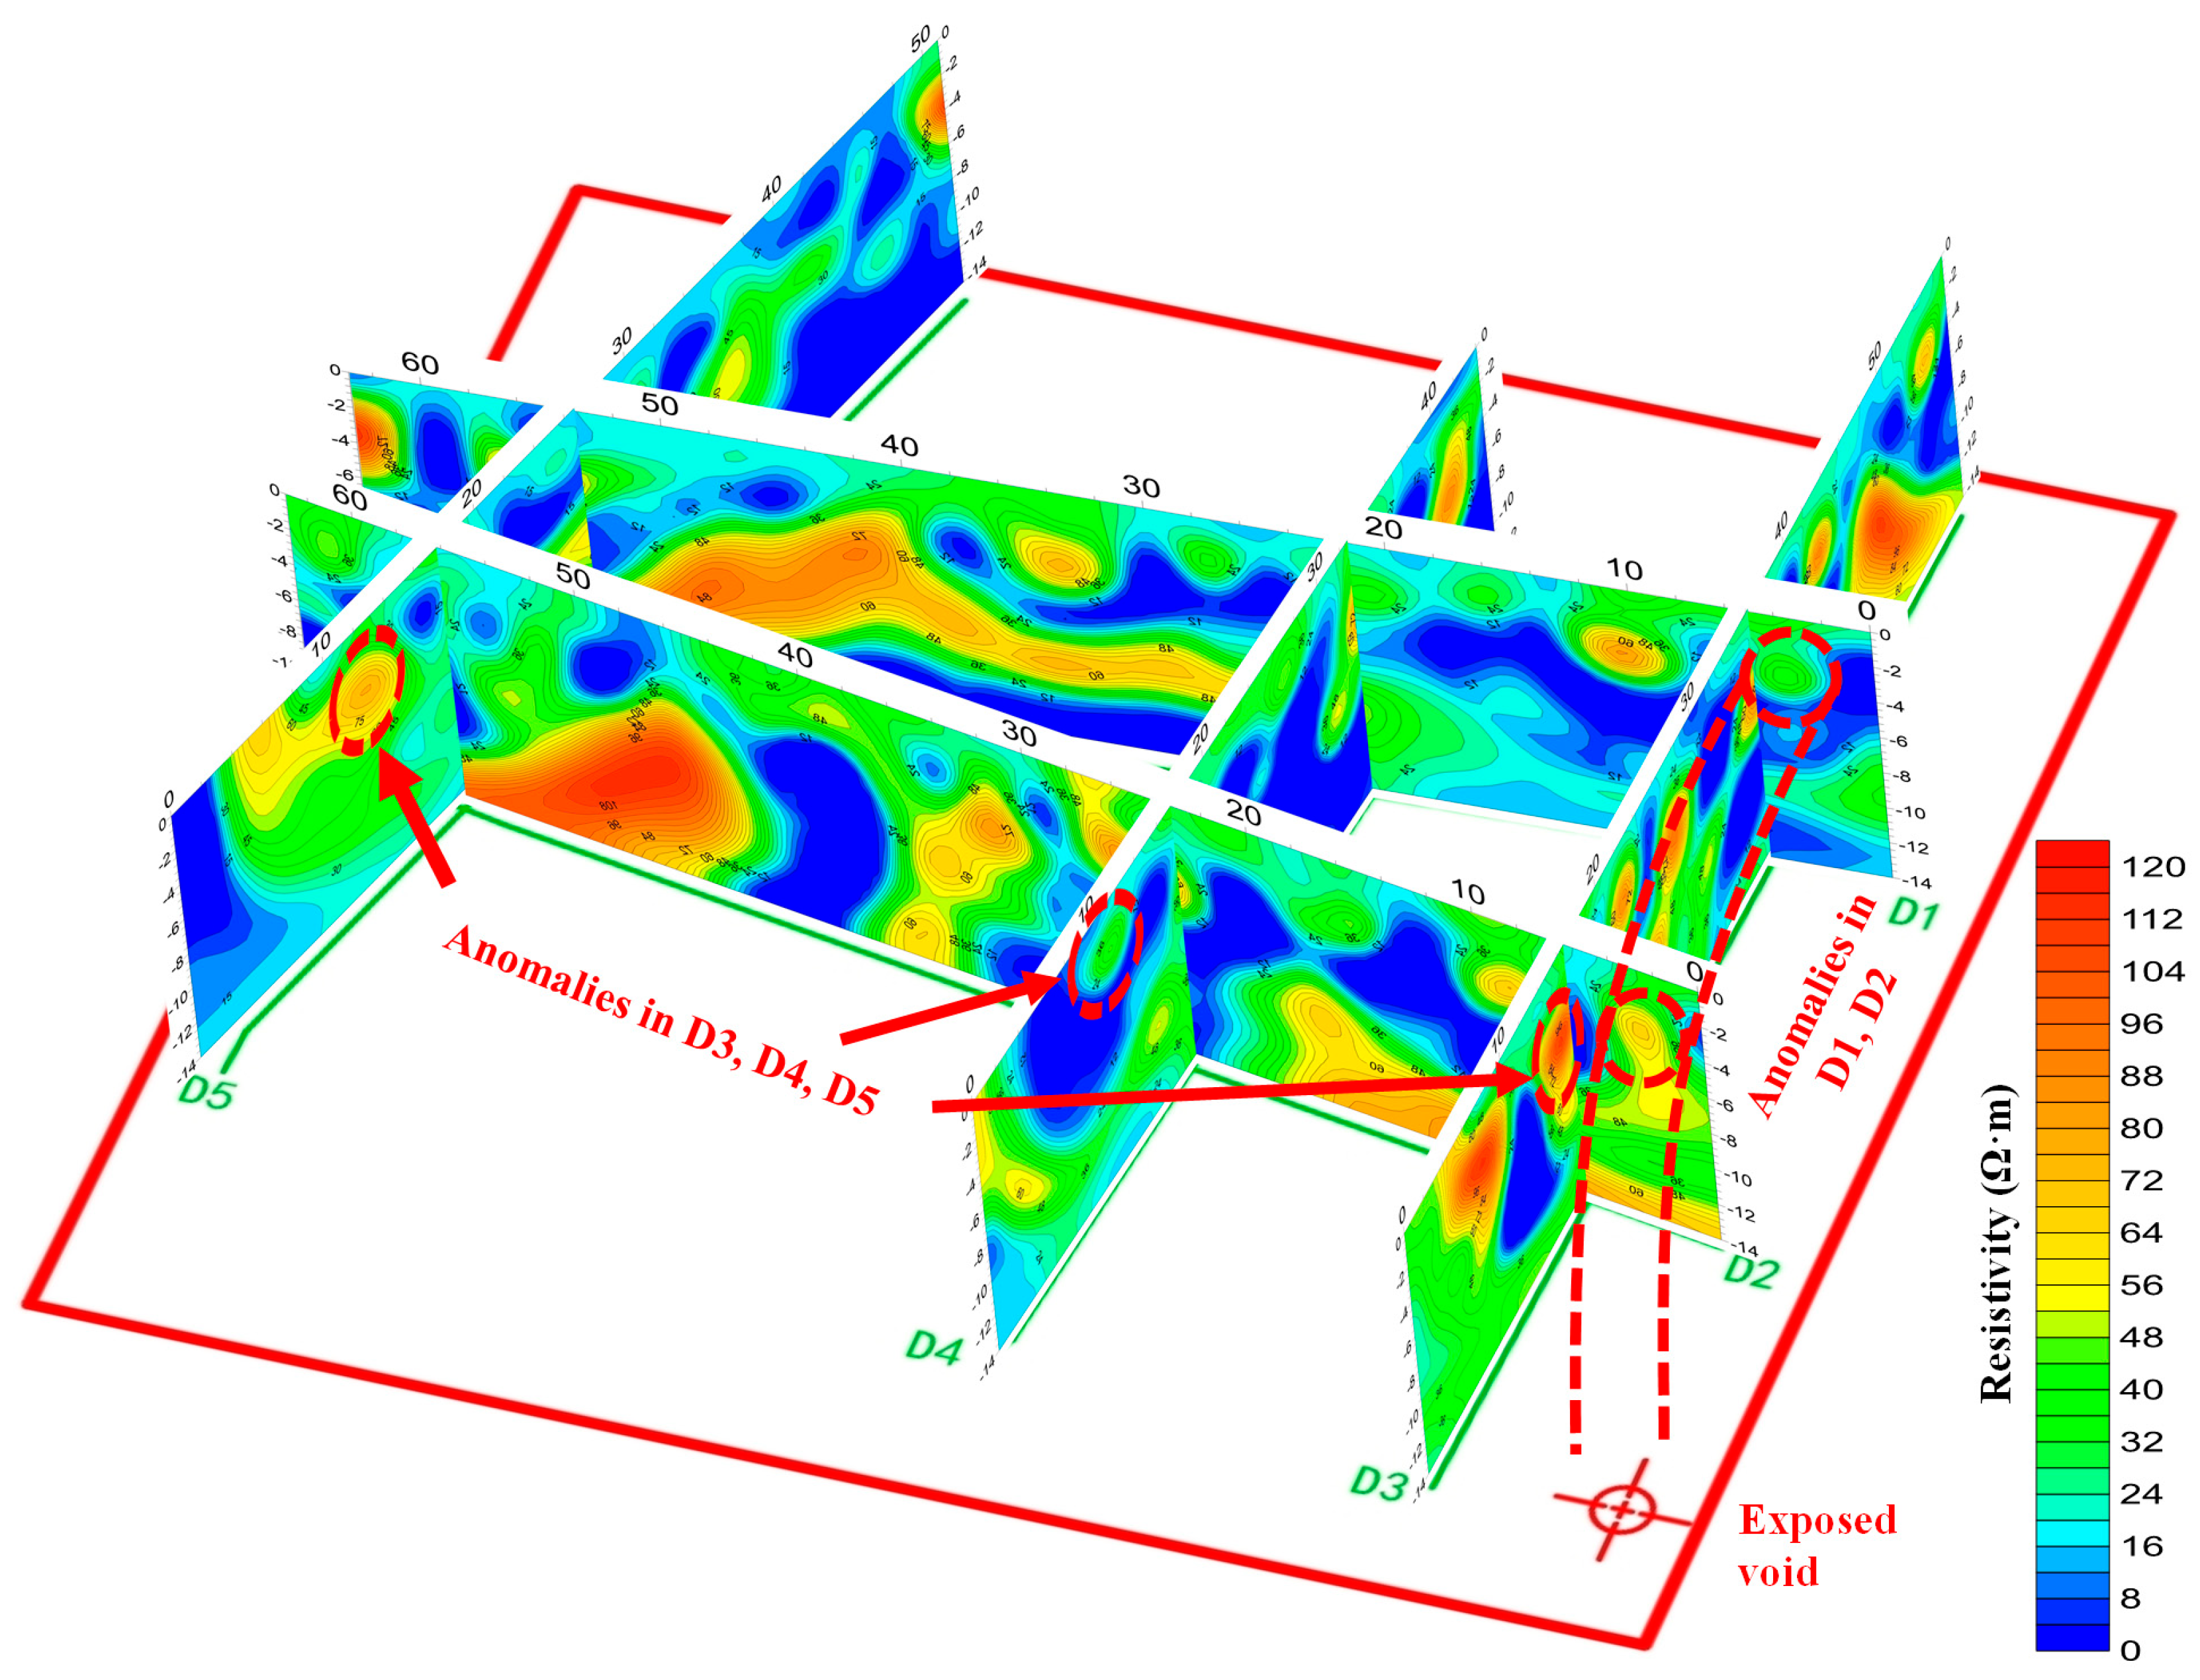
Closed high-resistivity loops occur on D1 and D2 at ~3.3–4.0 m depth beneath the breach corridor (Figure 6, A-D1, A-D2; right red ovals). In the resistivity images from lines D1 and D2, which are oriented perpendicular to the exposed void, closed-loop shapes appeared at a horizontal position of 3.5 to 4 m and a vertical depth of 3.5 m. These closed-loop areas exhibited increased resistivity, which is characteristic of underground voids detected through UHD-ERT. Conversely, the shallow regions along each survey line revealed uneven resistivity inversion images, where high-resistivity contour lines formed closed loops, initially attributed to stratum heterogeneity and elevated soil moisture due to rainfall (see the scattered shallow closures in Figure 6, away from A-D1/A-D2).
A lateral set (A-D3, A-D4, A-D5) is observed at ~3.6 m, ~2.6 m, and ~3.7 m depth, respectively (Figure 6, bottom panels). These lack plan-view coherence and void-type closure and are therefore interpreted as geological.
Figure 6. UHD-ERT sections with anomaly labels. Green solid planes = D1–D5; A-D1/A-D2 = closed high-resistivity loops (~3.3–4.0 m depth); A-D3–D5 = shallow heterogeneities. Dashed red curve = inferred void trend; color bar = resistivity (Ω·m).
Water 17 03356 g006

4. Comprehensive Interpretation and Discussion

4.1. Validation of UHD-ERT Results with Existing Drilling Data
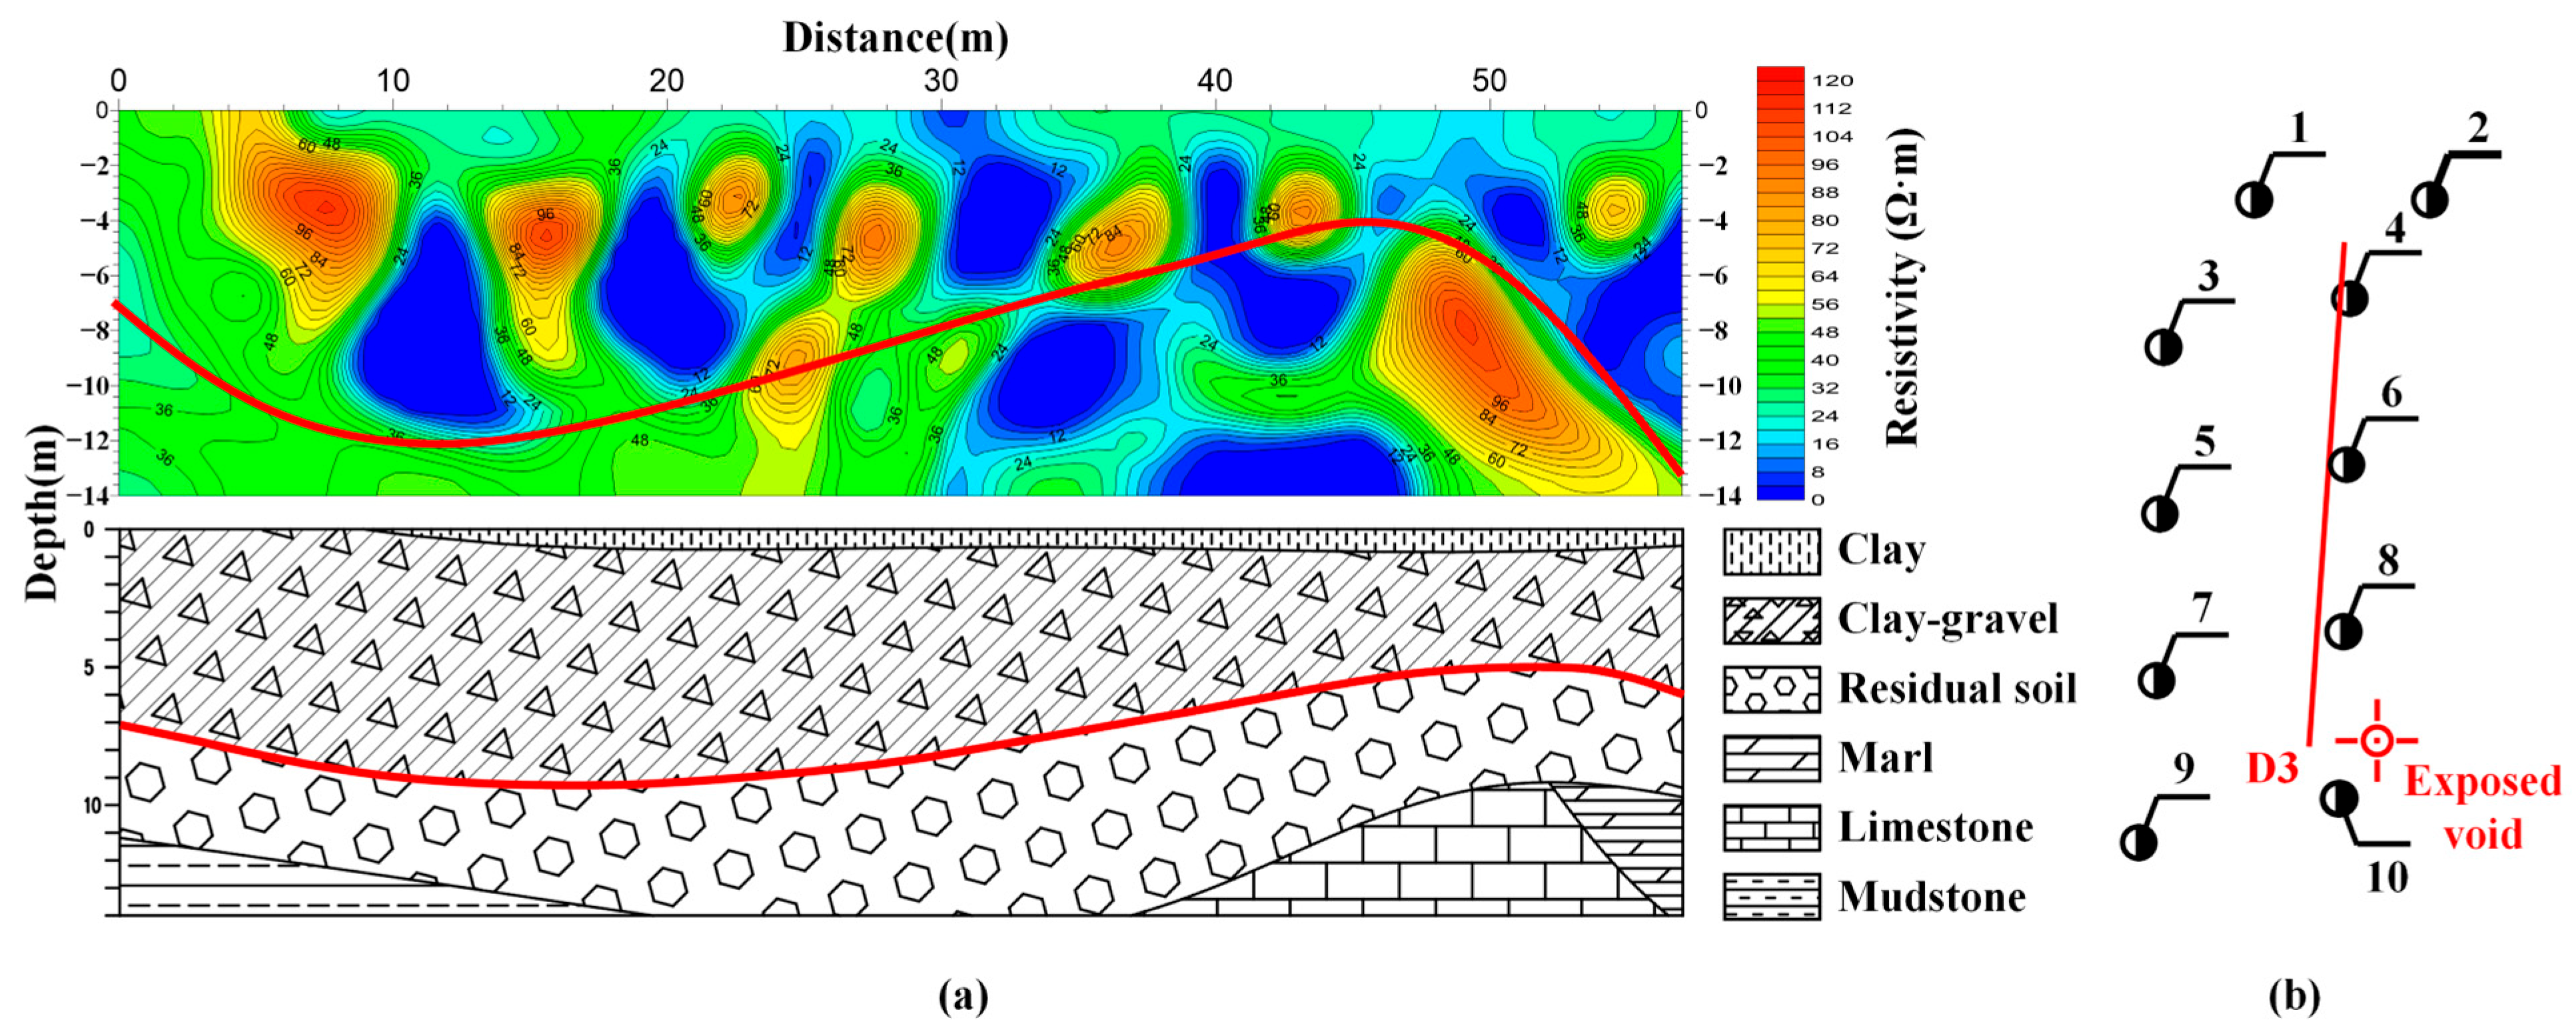
Geophysical results often present multiple interpretations, necessitating validation for accuracy. Due to engineering constraints, extensive excavation for verification within the study area was not feasible. To mitigate this limitation, we validated the apparent resistivity profile from the UHD-ERT survey line D3, which is adjacent to the exposed void’s direction (Figure 7a). The resistivity data were compared with geological profiles obtained from 10 surrounding boreholes (Figure 7b).
The comparison reveals that variations in clay-gravel composition and water content result in closed-loop shapes in the shallow parts of the resistivity profile. Specifically, high-resistivity values were associated with the moderately weathered limestone layers, while lower resistivity was observed in the more weathered marl and limestone with karst development. This pattern aligns closely with the geological data, particularly at the interface between residual soil and the non-homogeneous upper clay-gravel layers. The resistivity images from UHD-ERT correspond well with the borehole data, indicating a high degree of reliability in the geophysical results. The consistency between the geological profiles and the resistivity data further validates the accuracy of the detected features and supports the interpretation of underground voids identified through UHD-ERT. The red polyline in Figure 7a marks the residual-soil/clay-gravel interface that explains shallow closures unrelated to voiding.
Figure 7. Validation against boreholes. (a) D3 resistivity section overlain by lithologic columns; red polyline = residual-soil/clay-gravel interface. (b) Location of the geological boreholes and D3 survey line (numbers 1–10 denote borehole IDs).
Water 17 03356 g007

4.2. Joint Interpretation of Anomalous Signals from UHD-ERT and GPR
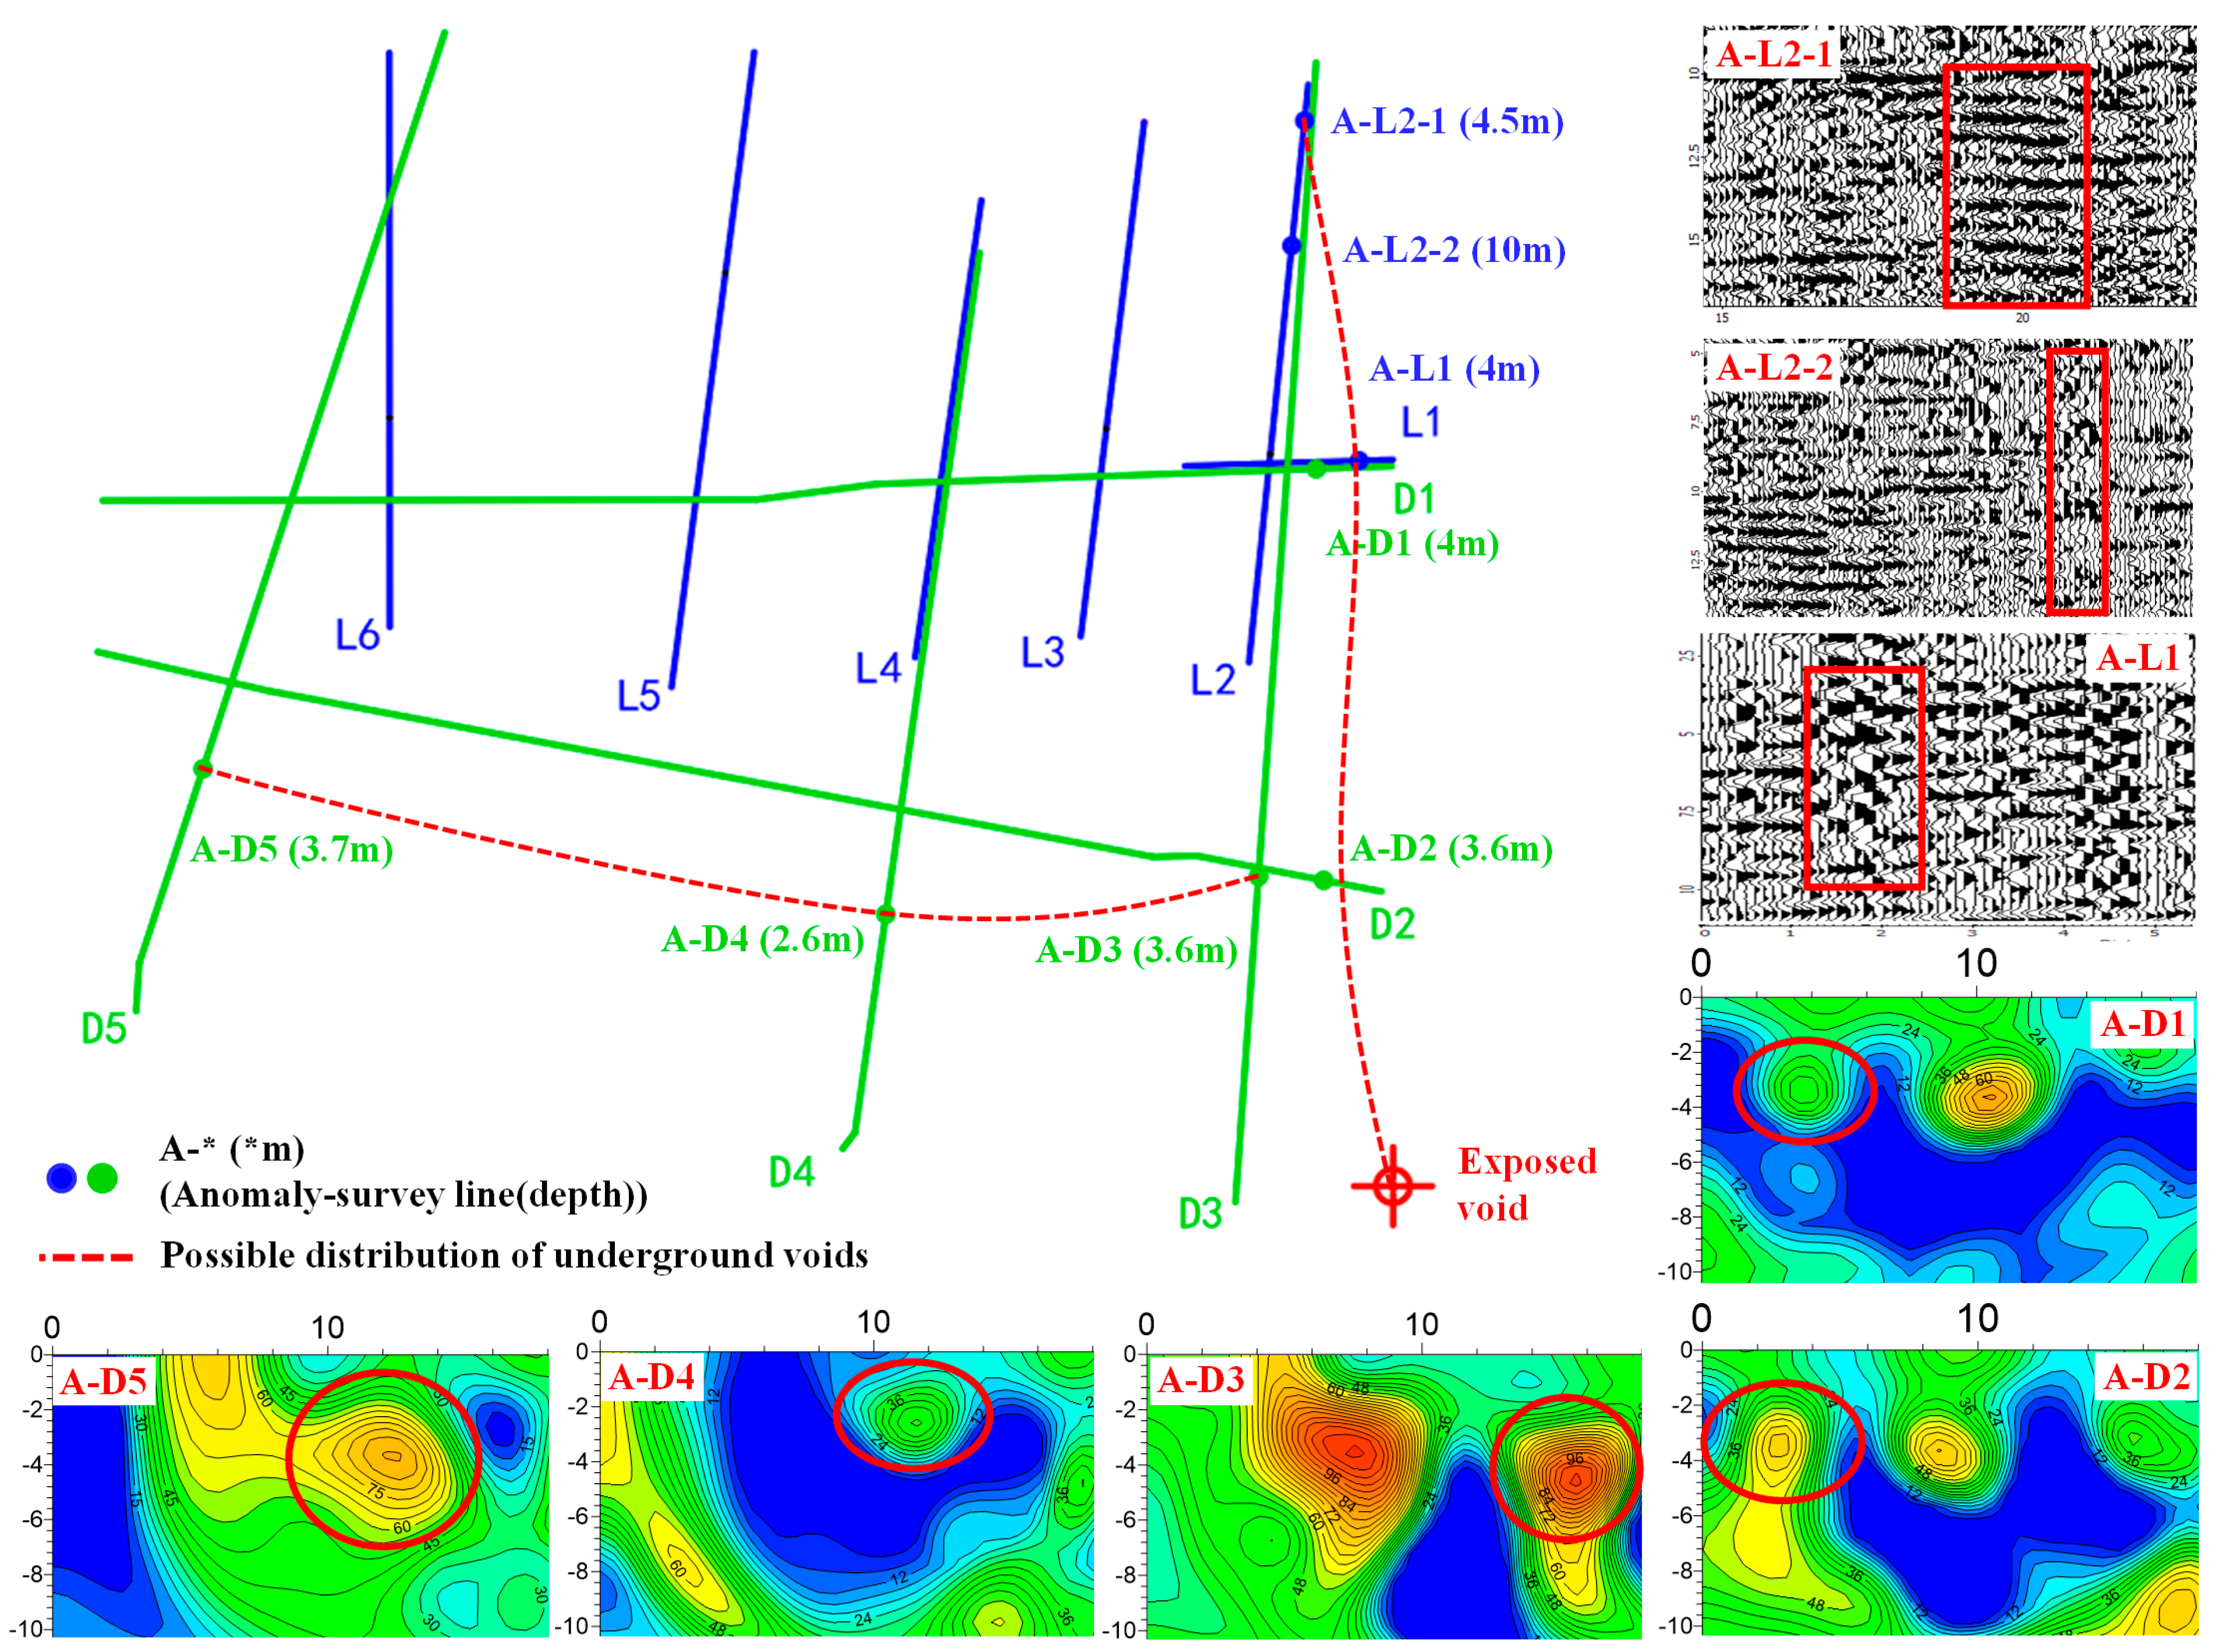
UHD-ERT and GPR detection identified a total of eight anomalies, suggesting the presence of two potential underground voids (Figure 8). The first set of anomalies, distributed longitudinally, is located along the extension direction of the exposed void. Anomalies A-L1 and A-D1, detected on the D1 and L1 survey lines, are signals emanating from the exposed void and are treated as the reference signature for cavity detection. Anomaly A-L2-2 on the L2 radar survey line extends to a depth of 10 m, exceeding typical depths for artificial voids, and is interpreted as the continuation of the same void. Conversely, anomalies A-L2-1 (on L2), A-D2 (on D2), and A-L1 (A-D1), located along the extension direction of the exposed void, exhibit progressive increases in burial depth, consistent with the characteristics of underground voids. It can therefore be concluded that these anomalies delineate the distribution path of the exposed void, extending from the breached opening to A-L2-1 (Figure 8).
Additional findings from the UHD-ERT results indicate the potential presence of another underground void anomaly, characterized by a lateral distribution. The analysis of anomalies A-D3, A-D4, and A-D5 on profiles D3, D4, and D5 demonstrated inconsistencies in image representation, particularly in resistivity values and extent. Notably, anomaly A-D5 exhibited an extensive range with no clear boundaries or definitive void characteristics. Moreover, the depths of these anomalies diverge from those typically expected for voids. These three anomalies—A-D3, A-D4, and A-D5—are therefore presumed to result from geological anomalies rather than indicative of underground voids.
Figure 8. Integrated interpretation and labels. Green lines show UHD-ERT sections D1–D5; blue lines show GPR survey lines L1–L6. The dashed red curve marks the inferred longitudinal void trend. Blue dots (A-L* (* m) mark GPR anomaly picks) and green dots (A-D* (* m) mark corresponding UHD-ERT anomalies); in the notation A-* (* m), “*” denotes the survey line code and the depth value in metres (e.g., A-D5 (3.7 m)). Red boxes highlight GPR anomaly windows on the radargrams and red circles highlight UHD-ERT anomaly areas on the resistivity slices. The right column shows representative GPR panels (A-L1, A-L2-1, A-L2-2), and the bottom row shows UHD-ERT insets (A-D1–D5).
Water 17 03356 g008

4.3. Comprehensive Results from Multiple Detection Methods
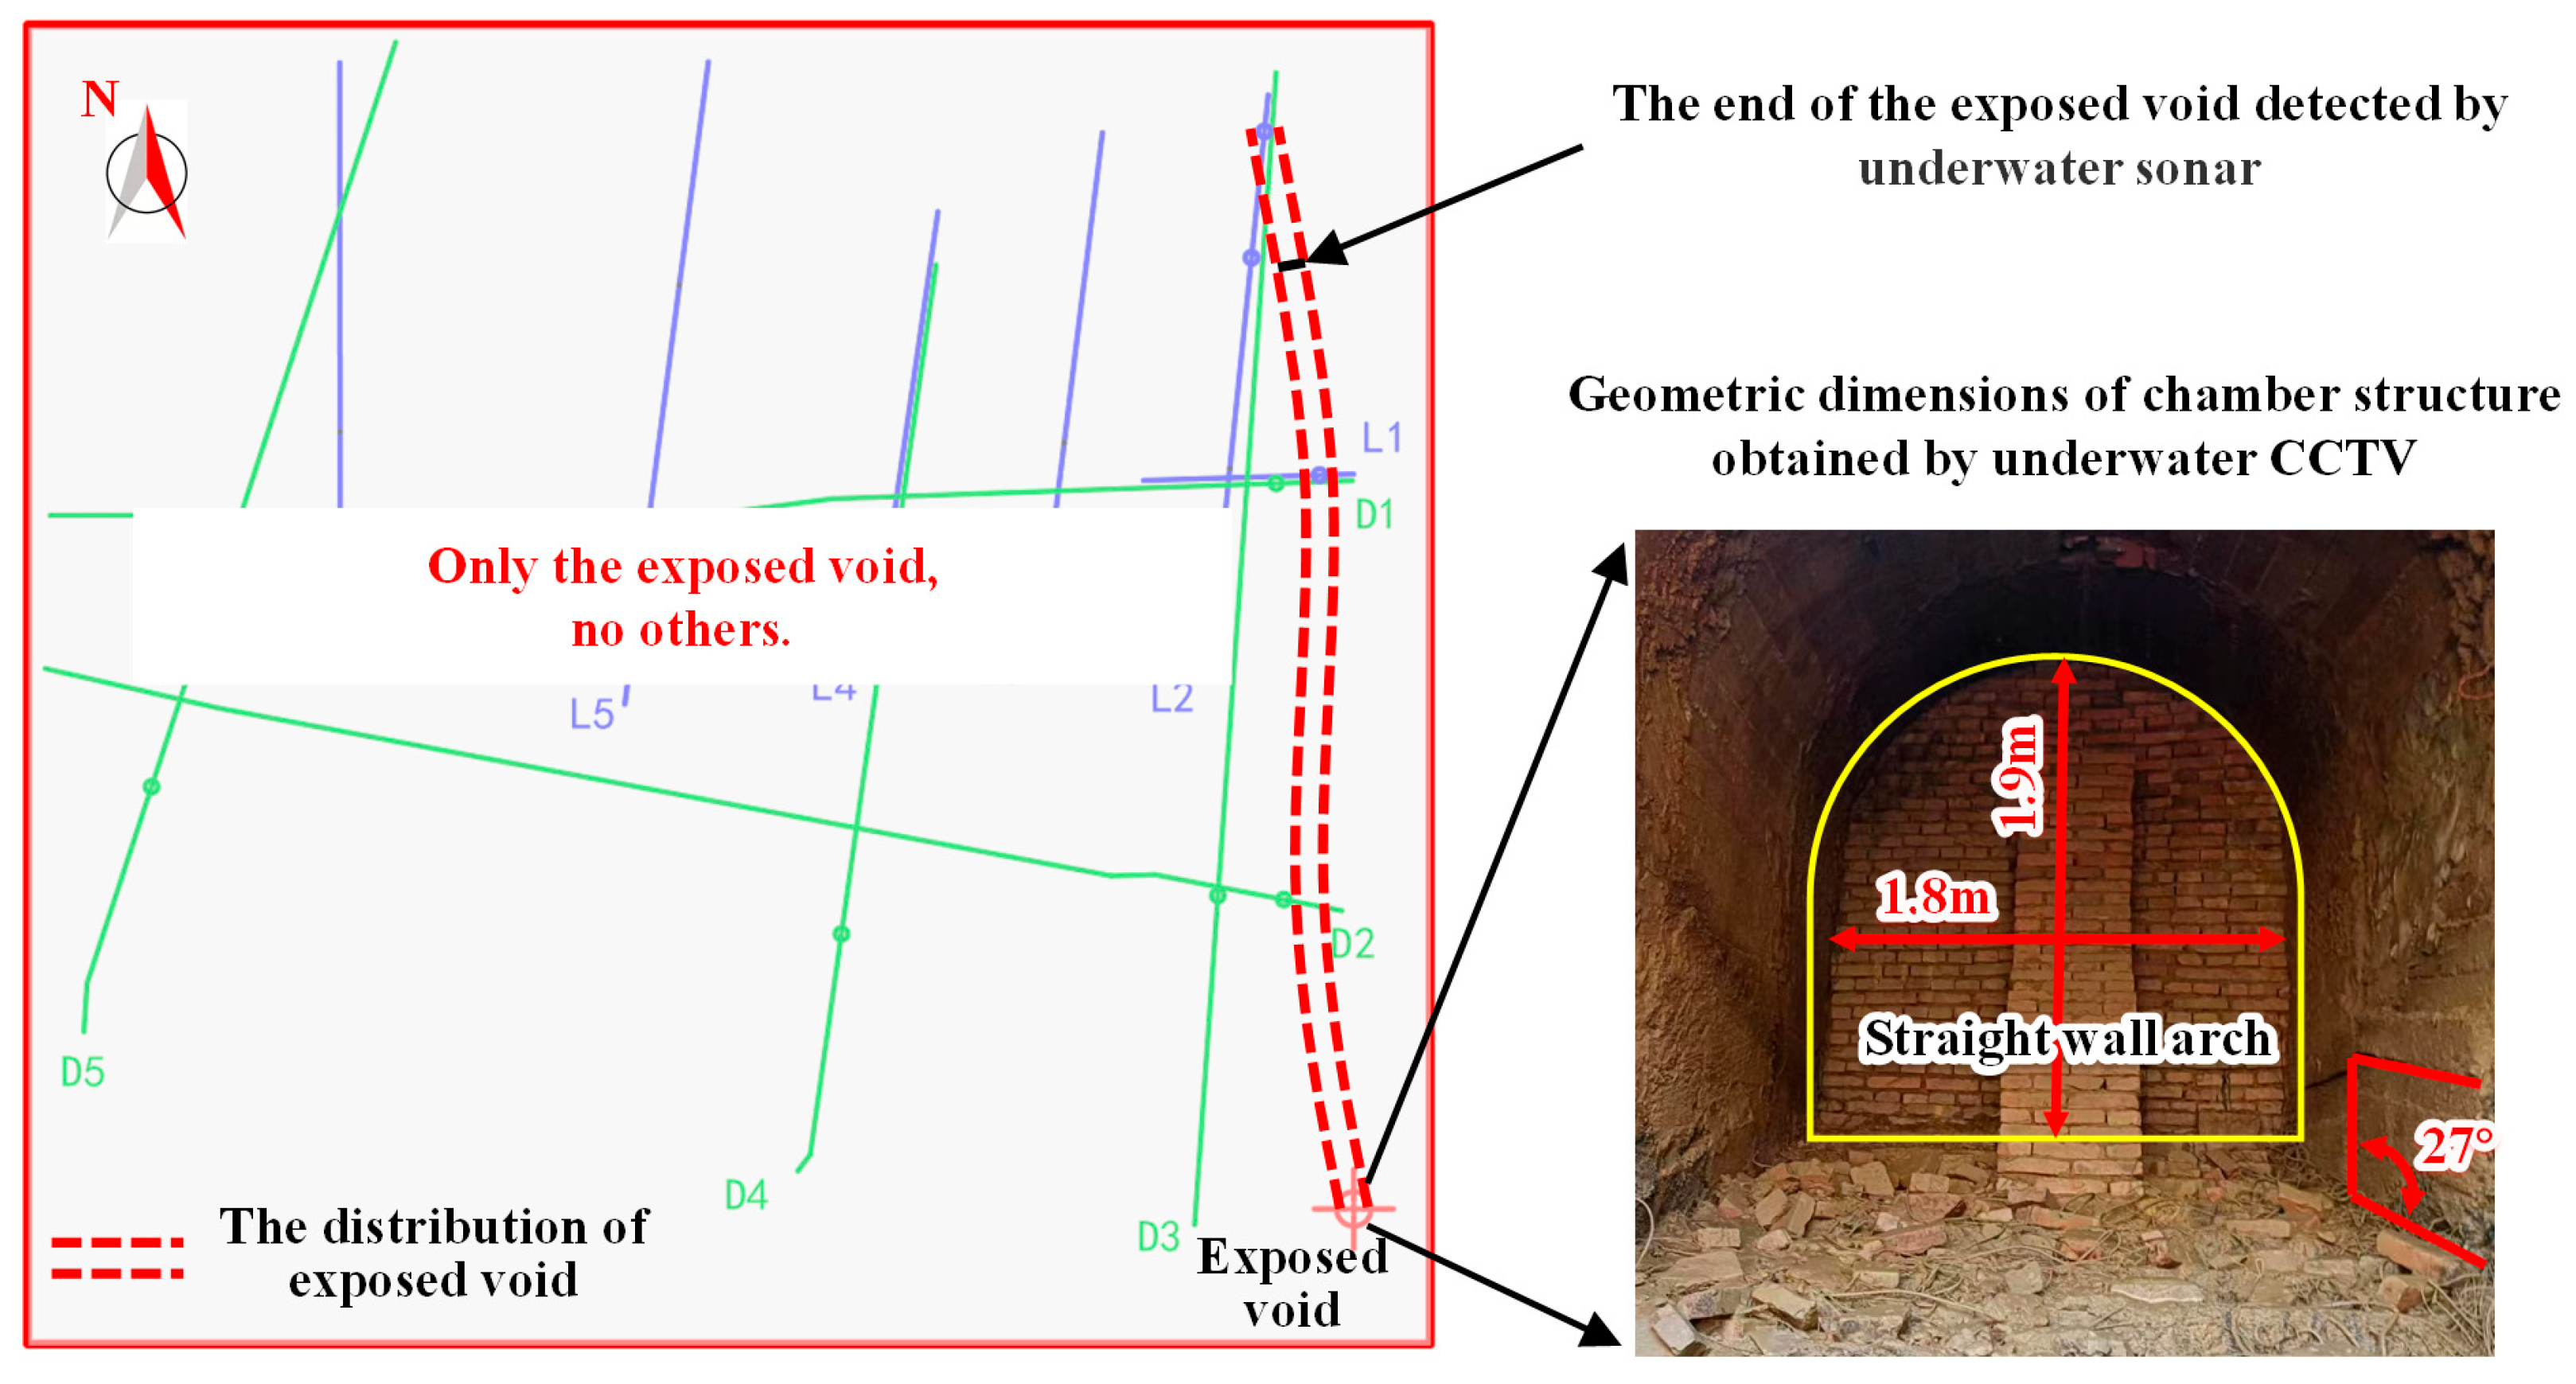
Integrating water-filled in-void observations (CCTV/sonar) with post-drainage surface geophysics (GPR/UHD-ERT) indicates a single void within the surveyed area (Figure 9). The chamber trends approximately north–south at ~4–5 m depth, with a straight-walled arch cross-section of ~1.8 m (span) × ~1.9 m (rise). A sealed wall occurs 4 m south of the breach. To the north, underwater sonar confirmed a sealed wall at a plan distance of 45 ± 2 m from the breach. In addition, GPR on L2 shows a void-type diffraction (A-L2-1) at ~57 m along the same trend and at ~4.5–5.5 m depth, consistent with a candidate continuation beyond the sonar-inaccessible wall; verification would require targeted coring or additional cross-lines.
Outside this corridor, neither the UHD-ERT sections nor the GPR profiles display anomalies meeting our cross-method/coherence criteria. Accordingly, no additional voids were detected within the resolution and sensitivity of the present 2D survey. These constraints supported construction planning and staged mitigation.
Figure 9. Comprehensive detection and interpretation of underground voids.
Water 17 03356 g009

4.4. Discussion

4.4.1. Quantitative Drainage Effects on Geophysical Responses

The post-drainage stage (two rain-free days after pumping) visibly improved UHD-ERT and GPR responses. Although strictly co-located pre-drainage profiles were not acquired, the expected magnitude and direction of changes can be quantified from standard petrophysical relations using site-appropriate parameter ranges derived from the stratigraphy (clay–gravel/residual soils over marl–limestone) and the velocity fitted on L1.
We model bulk resistivity with an Archie-type relation,
ρ b = a ρ w ϕ m S w n
where ρ b is bulk resistivity, ρ w is pore-water resistivity, S w is water saturation; remaining symbol definitions and representative site-parameter ranges are given in Table 3. Over the short staging interval, the factor ρ w , ϕ, m, a are quasi-constant, yielding drained/near-saturated resistivity ratio
ρ d r a i n e d / ρ s a t ( S d r a i n e d / S s a t ) n
With representative parameters in Table 3, we obtain
ρ d r a i n e d / ρ s a t 1.8 3.0
consistent with the stronger resistive closures and cleaner contrasts observed on post-drainage UHD-ERT sections (Figure 6; A-D1/A-D2 at 3.3–4.0 m).
For effective dielectric permittivity, we use a CRIM-type mixing law,
ε r = ( 1 ϕ ) ε s + ϕ S w ε w + ( 1 S w ) ε a
with ε a = 1 (air), ε w ≈ 80, and ϕ = 0.25–0.35. The transition from near-saturated to drained states reduces ε r from ~20–30 to ~11–14, implying a GPR velocity increase from ~0.06–0.07 to 0.09 ± 0.01 m/ns, in agreement with hyperbola fitting on L1. In the conduction-loss regime, the GPR attenuation length scales approximately as ρ / f (for antenna band 75–150 MHz), so a resistivity gain of 1.8–3.0 corresponds to a ~1.4–1.7× improvement penetration/contrast after drainage. This reconciles the sharper void-type diffractions on L1/L2 (Figure 5; A-L1/A-L2-1). Clay surface conduction can add a near-constant term; the ratio form in Equation (2) mitigates that influence. These quantitative expectations align with the observed post-drainage signatures in Figure 5 and Figure 6. A key limitation is the absence of co-located time-lapse ERT/GPR lines; future work will pair water-level logging with repeated acquisitions to directly measure the before/after differences.

4.4.2. Method Selection and Applicability

This paper adopted a staged, groundwater-aware, local-to-global workflow: in-void CCTV/sonar during water-filled conditions, followed by post-drainage GPR (75–150 MHz) and UHD-ERT (1 m spacing). This choice was dictated by site realities—shallow roof (~3–5 m), ~1.8 m span, clay–gravel over marl/limestone, an excavation pit covered by a steel bracing truss with metal clutter on the floor, and strict noise/vibration limits from nearby institutes and residences. Under such constraints, microgravity (cultural noise; station stability) [92,93], seismic/MASW (source and coupling; strong scattering beneath steel) [94,95], and FDEM/TEM/magnetics (severe steel coupling) were deprioritized [96,97,98]. Calibrated overpasses above the known void (L1/D1) anchored interpretation and reduced non-uniqueness.
The workflow presupposes limited in-void access to obtain metric “ground truth,” at least partial drainage to increase resistivity contrast and reduce EM attenuation, and a deployable ERT layout with line routing that minimizes coupling to overhead steel and surface metal. Within these bounds, stage-aware interpretation and cross-method corroboration between CCTV/sonar and GPR/UHD-ERT were essential to stabilize inference. Conversely, performance declines where clays remain highly saturated or soils are saline (weak EM penetration, compressed resistivity contrast), where drainage is infeasible, where no in-void access is possible, where dense steel directly underlies survey routes, or where targets are deeper (>15–20 m) and smaller. In such settings, time-lapse or borehole ERT, microgravity, passive seismic or cross-hole logging, denser surface grids with synthetic modeling plus targeted coring, route re-planning, or borehole-based approaches may be more effective.
In excavation-pit environments with overhead steel, metal clutter, strict noise limits, shallow targets, and water-affected backfill, the sequence CCTV/sonar → (drainage) → GPR + UHD-ERT is efficient and defensible, delivering engineering-grade constraints on span, rise, depth, trajectory, and sealed ends. Practically, the integrated evidence provided engineering-grade constraints on span, rise, depth, trajectory, and sealed ends, forming a robust foundation for subsequent risk management and enabling the project to proceed, with topping-out of all main structures in June 2024 (Figure 10). The experience and findings here offer a transferable template for similar urban renewals. Nonetheless, our method set was intentionally compact; additional modalities (e.g., pose-aware sonar with IMU/odometry, multi-view photogrammetry in clearer reaches) and quantitative indicators for method selection and sequencing (expected saturation, target depth/size, access, urban noise) should be explored to further systematize survey design and data fusion.

4.4.3. Contribution to Sustainable Development Goals (SDGs)

This study directly supports SDG 11: Sustainable Cities and Communities—particularly Targets 11.3 (inclusive, sustainable urbanization and planning) and 11.5 (reduce disaster losses). By linking groundwater state to geophysical performance and by providing a replicable, field-validated workflow for detecting unknown voids in dense urban settings, the work enables safer upgrading of existing neighborhoods, protects adjacent housing and public infrastructure, and strengthens urban resilience during renewal. Secondarily, the methodology contributes to SDG 9 (Industry, Innovation and Infrastructure) by improving diagnostic tools for critical underground infrastructure.

5. Conclusions

This paper developed and applied a groundwater-aware, stage-tagged workflow: in-void CCTV/sonar under water-filled conditions, followed by post-drainage GPR (75–150 MHz) and UHD-ERT (1 m spacing), with calibration lines over the breach to anchor velocity/geometry and reduce non-uniqueness. Analytical expectations (Archie/CRIM) and observed signatures indicate that drainage increases resistivity and decreases effective permittivity, thereby enhancing UHD-ERT contrast and GPR penetration. At the Wuhan site, the void lies at a ~4–5 m depth with a straight-walled arch (~1.8 m × ~1.9 m). The southern end is sealed at ~4 m from the breach. To the north, sonar confirms a sealed wall at 45 ± 2 m; a GPR anomaly at ~57 m represents a candidate continuation requiring verification. Beyond this corridor, no additional voids were detected within survey resolution and sensitivity.
This approach is suited to shallow targets in water-affected backfill where partial drainage is feasible and line routing avoids strong steel coupling. Limitations include the absence of strictly co-located pre-drainage lines, 2D ERT inversions in a 3D setting, and the lack of direct verification of the ~57 m feature. Future work should couple water-level logging with time-lapse ERT/GPR and, where access permits, augment in-void mapping with pose-aware sonar or multi-view imaging to further quantify stage-dependent changes.

Author Contributions

Conceptualization, methodology, J.Z. and P.G.; software, visualization, J.Z. and Z.W.; validation, formal analysis, investigation, J.Z., W.F., P.G., J.L., H.Z. and Z.W.; resources, P.G. and W.F.; data curation, J.L., H.Z. and Z.W.; writing—original draft preparation, J.Z.; writing—review and editing, J.Z., W.F., P.G., J.L., H.Z. and Z.W.; supervision, project administration, funding acquisition, P.G. All authors have read and agreed to the published version of the manuscript.

Funding

This study was supported by the National Natural Science Foundation of China (Grant No. 42227805).

Data Availability Statement

Data supporting the findings are presented in the article (figures and tables). The underlying raw data contain region-specific subsurface geological information and records of underground structures, which are subject to privacy and security restrictions; therefore, they are not publicly available. Access may be provided by the corresponding author upon reasonable request.

Acknowledgments

The authors would also express their sincere appreciation to anonymous reviewers and editors for their valuable comments and suggestions.

Conflicts of Interest

Author Wei Feng was employed by Hubei Shenlong Geological Engineering Investigation Institute Co., Ltd. Authors Junsheng Liu and Huilan Zhang were employed by Xinjiang Water Conservancy Development and Construction Group Co., Ltd. The companies had no role in the study design; data collection, analyses, or interpretation; the writing of the manuscript; or the decision to publish the results. The remaining authors declare that the research was conducted in the absence of any commercial or financial relationships that could be construed as a potential conflict of interest.

References

  1. Gutiérrez, F.; Parise, M.; De Waele, J.; Jourde, H. A Review on Natural and Human-Induced Geohazards and Impacts in Karst. Earth-Sci. Rev. 2014, 138, 61–88. [Google Scholar] [CrossRef]
  2. Cui, G.; Wei, J.; Feng, X.-T.; Liu, J.; Elsworth, D.; Chen, T.; Xiong, W. Preliminary Study on the Feasibility of Co-Exploitation of Coal and Uranium. Int. J. Rock Mech. Min. Sci. 2019, 123, 104098. [Google Scholar] [CrossRef]
  3. Veress, M. Karst Types and Their Karstification. J. Earth Sci. 2020, 31, 621–634. [Google Scholar] [CrossRef]
  4. Parise, M.; Lollino, P. A Preliminary Analysis of Failure Mechanisms in Karst and Man-Made Underground Caves in Southern Italy. Geomorphology 2011, 134, 132–143. [Google Scholar] [CrossRef]
  5. Fazio, N.L.; Perrotti, M.; Lollino, P.; Parise, M.; Vattano, M.; Madonia, G.; Di Maggio, C. A Three-Dimensional Back-Analysis of the Collapse of an Underground Cavity in Soft Rocks. Eng. Geol. 2017, 228, 301–311. [Google Scholar] [CrossRef]
  6. Chen, L.; de Borst, R. Analysis of Progressive Fracture in Fluid-Saturated Porous Medium Using Splines. Int. J. Numer. Methods Eng. 2023, 124, 264–281. [Google Scholar] [CrossRef]
  7. Zhao, Y.; Shi, Y.; Wu, F.; Sun, R.; Feng, H. Characterization of the Sinkhole Failure Mechanism Induced by Concealed Cave: A Case Study. Eng. Fail. Anal. 2021, 119, 105017. [Google Scholar] [CrossRef]
  8. Huang, F.; Zhao, L.; Ling, T.; Yang, X. Rock Mass Collapse Mechanism of Concealed Karst Cave beneath Deep Tunnel. Int. J. Rock Mech. Min. Sci. 2017, 91, 133–138. [Google Scholar] [CrossRef]
  9. Ruming, K.; McGuirk, P.; Mee, K. What Lies beneath? The Material Agency and Politics of the Underground in Urban Regeneration. Geoforum 2021, 126, 159–170. [Google Scholar] [CrossRef]
  10. Rizzo, E.; Capozzoli, L.; De Martino, G.; Grimaldi, S. Urban Geophysical Approach to Characterize the Subsoil of the Main Square in San Benedetto Del Tronto Town (Italy). Eng. Geol. 2019, 257, 105133. [Google Scholar] [CrossRef]
  11. Liu, R.; Sun, H.; Qin, J.; Zheng, Z. A Multi-Geophysical Approach to Assess Potential Sinkholes in an Urban Area. Eng. Geol. 2023, 318, 107100. [Google Scholar] [CrossRef]
  12. Pringle, J.K.; Ruffell, A.; Styles, P.; Stringfellow, M.; Stimpson, I.G.; Banham, S.G.; Wisniewski, K.D.; Owen, S.; Hobson, L.; Thompson, J. Forensic Geoscience Non-Invasive Detection and Characterisation of Underground Clandestine Complexes, Bunkers, Tunnels and Firing Ranges. Forensic Sci. Int. 2024, 359, 112033. [Google Scholar] [CrossRef] [PubMed]
  13. Thierry, P.; Debeblia, N.; Bitri, A. Geophysical and Geological Characterisation of Karst Hazards in Urban Environments: Application to Orléans (France). Bull. Eng. Geol. Environ. 2005, 64, 139–150. [Google Scholar] [CrossRef]
  14. Wadas, S.H.; Tanner, D.C.; Polom, U.; Krawczyk, C.M. Structural Analysis of S-Wave Seismics around an Urban Sinkhole: Evidence of Enhanced Dissolution in a Strike-Slip Fault Zone. Nat. Hazards Earth Syst. Sci. 2017, 17, 2335–2350. [Google Scholar] [CrossRef]
  15. Gritto, R.; Elnaiem, A.E.; Mohamed, F.A.; Sadooni, F. Seismic Detection and Characterization of a Man-Made Karst Analog—A Feasibility Study. Geophysics 2021, 86, WA35–WA48. [Google Scholar] [CrossRef]
  16. Wang, C.; Shi, Z.; Yang, W.; Wei, Y.; Huang, M. High-Resoultion Shallow Anomaly Characterization Using Cross-Hole P-and S-Wave Tomography. J. Appl. Geophys. 2022, 201, 104649. [Google Scholar] [CrossRef]
  17. Debeglia, N.; Bitri, A.; Thierry, P. Karst Investigations Using Microgravity and MASW; Application to Orléans, France. Near Surf. Geophys. 2006, 4, 215–225. [Google Scholar] [CrossRef]
  18. Jacob, T.; Pannet, P.; Beaubois, F.; Baltassat, J.-M.; Hannion, Y. Cavity Detection Using Microgravity in a Highly Urbanized Setting: A Case Study from Reims, France. J. Appl. Geophys. 2020, 179, 104113. [Google Scholar] [CrossRef]
  19. Tallini, M.; Lo Sardo, L.; Spadi, M. Seismic Site Characterisation of Red Soil and Soil-Building Resonance Effects in L’Aquila Downtown (Central Italy). Bull. Eng. Geol. Environ. 2020, 79, 4021–4034. [Google Scholar] [CrossRef]
  20. Kristekova, M.; Kristek, J.; Moczo, P.; Labak, P. The Finite-Interval Spectral Power Method for Detecting Underground Cavities Using Seismic Ambient Noise. Geophys. J. Int. 2021, 224, 945–960. [Google Scholar] [CrossRef]
  21. Chen, J.; Zhang, Y.; Lin, J. Fast Transdimensional Bayesian Transient Electromagnetic Imaging for Urban Underground Space Detection. Measurement 2022, 187, 110300. [Google Scholar] [CrossRef]
  22. Wang, H.; Fu, Z.; Wang, Y.; Tai, H.-M.; Chen, W. On-Site Calibration of Air-Coil Sensor for Transient Electromagnetic Exploration. Geophys. Prospect. 2019, 67, 1595–1610. [Google Scholar] [CrossRef]
  23. Fan, J.; Hou, E.; Jin, D.; Xi, Z.; Long, X.; Zhou, S.; Nan, S.; Liu, Y.; Guo, K.; Ning, D. Application of Opposing Coils Transient Electromagnetic Method in Urban Area with Metal Interference. J. Appl. Geophys. 2024, 228, 105467. [Google Scholar] [CrossRef]
  24. Carrière, S.D.; Chalikakis, K.; Sénéchal, G.; Danquigny, C.; Emblanch, C. Combining Electrical Resistivity Tomography and Ground Penetrating Radar to Study Geological Structuring of Karst Unsaturated Zone. J. Appl. Geophys. 2013, 94, 31–41. [Google Scholar] [CrossRef]
  25. Chamberlain, A.T.; Sellers, W.; Proctor, C.; Coard, R. Cave Detection in Limestone Using Ground Penetrating Radar. J. Archaeol. Sci. 2000, 27, 957–964. [Google Scholar] [CrossRef]
  26. Sato, M. Near Range Radar and Its Application to near Surface Geophysics and Disaster Mitigation. J. Earth Sci. 2015, 26, 858–863. [Google Scholar] [CrossRef]
  27. Martel, R.; Castellazzi, P.; Gloaguen, E.; Trépanier, L.; Garfias, J. ERT, GPR, InSAR, and Tracer Tests to Characterize Karst Aquifer Systems under Urban Areas: The Case of Quebec City. Geomorphology 2018, 310, 45–56. [Google Scholar] [CrossRef]
  28. Ducut, J.D.; Alipio, M.; Go, P.J.; Concepcion, R., II; Vicerra, R.R.; Bandala, A.; Dadios, E. A Review of Electrical Resistivity Tomography Applications in Underground Imaging and Object Detection. Displays 2022, 73, 102208. [Google Scholar] [CrossRef]
  29. Calamita, G.; Serlenga, V.; Stabile, T.A.; Gallipoli, M.R.; Bellanova, J.; Bonano, M.; Casu, F.; Vignola, L.; Piscitelli, S.; Perrone, A. An Integrated Geophysical Approach for Urban Underground Characterization: The Avigliano Town (Southern Italy) Case Study. Geomat. Nat. Hazards Risk 2019, 10, 412–432. [Google Scholar] [CrossRef]
  30. Wang, T.-P.; Chen, C.-C.; Tong, L.-T.; Chang, P.-Y.; Chen, Y.-C.; Dong, T.-H.; Liu, H.-C.; Lin, C.-P.; Yang, K.-H.; Ho, C.-J.; et al. Applying FDEM, ERT and GPR at a Site with Soil Contamination: A Case Study. J. Appl. Geophys. 2015, 121, 21–30. [Google Scholar] [CrossRef]
  31. Zhi, Q.; Deng, X.; Wu, J.; Li, X.; Wang, X.; Yang, Y.; Zhang, J. Inversion of IP-Affected TEM Responses and Its Application in High Polarization Area. J. Earth Sci. 2021, 32, 42–50. [Google Scholar] [CrossRef]
  32. Amanatidou, E.; Vargemezis, G.; Tsourlos, P. Combined Application of Seismic and Electrical Geophysical Methods for Karst Cavities Detection: A Case Study at the Campus of the New University of Western Macedonia, Kozani, Greece. J. Appl. Geophys. 2022, 196, 104499. [Google Scholar] [CrossRef]
  33. Chen, J.; Jia, W.; Zhang, Y.; Lin, J. Integrated TEM and GPR Data Interpretation for High-Resolution Measurement of Urban Underground Space. IEEE Trans. Instrum. Meas. 2021, 71, 5004409. [Google Scholar] [CrossRef]
  34. Castellanza, R.; Lollino, P.; Ciantia, M. A Methodological Approach to Assess the Hazard of Underground Cavities Subjected to Environmental Weathering. Tunn. Undergr. Space Technol. 2018, 82, 278–292. [Google Scholar] [CrossRef]
  35. Faraone, C.; Colantonio, F.; Vessia, G. Seismic Amplification Effects Induced by Ancient Shallow Cavities underneath the Urban Area of the Historical City Center of Chieti, Italy. Eng. Geol. 2023, 324, 107259. [Google Scholar] [CrossRef]
  36. Xu, J.; Lai, J.; Qiu, J.; Jiang, H.; Sun, H.; Tang, J.; Cui, G. Disasters Caused by Underground Water Pipe Leakage in Chinese Cities: Failure Modes, Influencing Factors and Prevention Countermeasures. Tunn. Undergr. Space Technol. 2026, 167, 107008. [Google Scholar] [CrossRef]
  37. Jiang, X.; Dai, J.; Zheng, Z.; Li, X.J.; Ma, X.; Zhou, W.; Lei, Q. An Overview on Karst Collapse Mechanism in China. Carbonates Evaporites 2024, 39, 71. [Google Scholar] [CrossRef]
  38. Gentili, F.; Madonna, S. Photogrammetry from UAV and Low-Cost Lidar for Sinkhole Hazard Mitigation in Urban Areas: Applications and Evaluations. Geographies 2024, 4, 343–362. [Google Scholar] [CrossRef]
  39. Saribudak, B.M.; Hauwert, N.M. Integrated Geophysical Investigations of Main Barton Springs, Austin, Texas, USA. J. Appl. Geophys. 2017, 138, 114–126. [Google Scholar] [CrossRef]
  40. Devrath, S.C.; Nag, A.; Pareek, S. Transforming Mining Regions through Sustainable Redevelopment with Urban Voids and Underground Housing. J. Min. Environ. 2025, 16, 1319–1342. [Google Scholar] [CrossRef]
  41. Zhang, N.; Sun, H.; Zhang, Z.; Liu, S.; Fan, Q. Image Subsurface Karst in Coastal Areas Using Gravity Gradient Method: A Case Study in Guangxi, China. J. Appl. Geophys. 2026, 244, 105990. [Google Scholar] [CrossRef]
  42. Baalousha, H.M. Groundwater Vulnerability Mapping of Qatar Aquifers. J. Afr. Earth Sci. 2016, 124, 75–93. [Google Scholar] [CrossRef]
  43. Frumkin, A.; Ezersky, M.; Al-Zoubi, A.; Akkawi, E.; Abueladas, A.-R. The Dead Sea Sinkhole Hazard: Geophysical Assessment of Salt Dissolution and Collapse. Geomorphology 2011, 134, 102–117. [Google Scholar] [CrossRef]
  44. Connair, D.P.; Murray, B.S. Karst Groundwater Basin Delineation, Fort Knox, Kentucky. Eng. Geol. 2002, 65, 125–131. [Google Scholar] [CrossRef]
  45. Zhang, M.; Wang, H.; Dong, Y.; Li, L.; Sun, P.; Zhang, G. Evaluation of Urban Underground Space Resources Using a Negative List Method: Taking Xi’an City as an Example in China. China Geol. 2020, 3, 124–136. [Google Scholar] [CrossRef]
  46. di Santolo, A.S.; Forte, G.; Santo, A. Analysis of Sinkhole Triggering Mechanisms in the Hinterland of Naples (Southern Italy). Eng. Geol. 2018, 237, 42–52. [Google Scholar] [CrossRef]
  47. Al Heib, M.; Duval, C.; Theoleyre, F.; Watelet, J.-M.; Gombert, P. Analysis of the Historical Collapse of an Abandoned Underground Chalk Mine in 1961 in Clamart (Paris, France). Bull. Eng. Geol. Environ. 2015, 74, 1001–1018. [Google Scholar] [CrossRef]
  48. Tan, F.; Tan, W.; Yan, F.; Qi, X.; Li, Q.; Hong, Z. Model Test Analysis of Subsurface Cavity and Ground Collapse Due to Broken Pipe Leakage. Appl. Sci. 2022, 12, 13017. [Google Scholar] [CrossRef]
  49. Cao, L.; Chen, Y.; Li, X.; Li, J.; Djamaluddine, I.; Lv, X. Impact of Soil Layer Distribution on the Morphology Characteristics of Underground Cavities. J. Perform. Constr. Facil. 2025, 39, 04025029. [Google Scholar] [CrossRef]
  50. Xiao, X.; Xu, M.; Ding, Q.; Kang, X.; Xia, Q.; Du, F. Experimental Study Investigating Deformation Behavior in Land Overlying a Karst Cave Caused by Groundwater Level Changes. Environ. Earth Sci. 2018, 77, 64. [Google Scholar] [CrossRef]
  51. Caselle, C.; Bonetto, S.; Comina, C.; Stocco, S. GPR Surveys for the Prevention of Karst Risk in Underground Gypsum Quarries. Tunn. Undergr. Space Technol. 2020, 95, 103137. [Google Scholar] [CrossRef]
  52. Li, Y.; Ren, Y.; Peng, S.S.; Cheng, H.; Wang, N.; Luo, J. Measurement of Overburden Failure Zones in Close-Multiple Coal Seams Mining. Int. J. Min. Sci. Technol. 2021, 31, 43–50. [Google Scholar] [CrossRef]
  53. Al-Fares, W.; Bakalowicz, M.; Guérin, R.; Dukhan, M. Analysis of the Karst Aquifer Structure of the Lamalou Area (Hérault, France) with Ground Penetrating Radar. J. Appl. Geophys. 2002, 51, 97–106. [Google Scholar] [CrossRef]
  54. Liu, H.; Yue, Y.; Liu, C.; Spencer, B.F.; Cui, J. Automatic Recognition and Localization of Underground Pipelines in GPR B-Scans Using a Deep Learning Model. Tunn. Undergr. Space Technol. 2023, 134, 104861. [Google Scholar] [CrossRef]
  55. Lai, W.W.-L.; Dérobert, X.; Annan, P. A Review of Ground Penetrating Radar Application in Civil Engineering: A 30-Year Journey from Locating and Testing to Imaging and Diagnosis. NDT E Int. 2018, 96, 58–78. [Google Scholar] [CrossRef]
  56. Diallo, M.C.; Cheng, L.Z.; Rosa, E.; Gunther, C.; Chouteau, M. Integrated GPR and ERT Data Interpretation for Bedrock Identification at Cléricy, Québec, Canada. Eng. Geol. 2019, 248, 230–241. [Google Scholar] [CrossRef]
  57. Lazzari, M.; Loperte, A.; Perrone, A. Near Surface Geophysics Techniques and Geomorphological Approach to Reconstruct the Hazard Cave Map in Historical and Urban Areas. Adv. Geosci. 2010, 24, 35–44. [Google Scholar] [CrossRef]
  58. Čeru, T.; Šegina, E.; Knez, M.; Benac, Č.; Gosar, A. Detecting and Characterizing Unroofed Caves by Ground Penetrating Radar. Geomorphology 2018, 303, 524–539. [Google Scholar] [CrossRef]
  59. Dahlin, T.; Zhou, B. A Numerical Comparison of 2D Resistivity Imaging with 10 Electrode Arrays. Geophys. Prospect. 2004, 52, 379–398. [Google Scholar] [CrossRef]
  60. Martorana, R.; Capizzi, P.; D’Alessandro, A.; Luzio, D. Comparison of Different Sets of Array Configurations for Multichannel 2D ERT Acquisition. J. Appl. Geophys. 2017, 137, 34–48. [Google Scholar] [CrossRef]
  61. Candansayar, M.E. Two-Dimensional Individual and Joint Inversion of Three- and Four-Electrode Array Dc Resistivity Data. J. Geophys. Eng. 2008, 5, 290–300. [Google Scholar] [CrossRef]
  62. Bharti, A.K.; Pal, S.K.; Priyam, P.; Pathak, V.K.; Kumar, R.; Ranjan, S.K. Detection of Illegal Mine Voids Using Electrical Resistivity Tomography: The Case-Study of Raniganj Coalfield (India). Eng. Geol. 2016, 213, 120–132. [Google Scholar] [CrossRef]
  63. Cheng, G.; Xu, W.; Shi, B.; Wu, J.; Sun, B.; Zhu, H. Experimental Study on the Deformation and Failure Mechanism of Overburden Rock during Coal Mining Using a Comprehensive Intelligent Sensing Method. J. Rock Mech. Geotech. Eng. 2022, 14, 1626–1641. [Google Scholar] [CrossRef]
  64. Prakash, A.; Bharti, A.K.; Verma, A. Unearthing Underground Mining-Induced Strata Disturbance by Electrical Resistivity Tomography Interpretation. Environ. Eng. Geosci. 2022, 28, 361–369. [Google Scholar] [CrossRef]
  65. Pasierb, B.; Gajek, G.; Urban, J.; Nawrocki, W. Integrated Geophysical and Geomorphological Studies of Caves in Calcarenite Limestones (Jaskinia Pod Świecami Cave, Poland). Surv. Geophys. 2024, 45, 663–694. [Google Scholar] [CrossRef]
  66. Leopold, M.; Gupanis-Broadway, C.; Baker, A.; Hankin, S.; Treble, P. Time Lapse Electric Resistivity Tomography to Portray Infiltration and Hydrologic Flow Paths from Surface to Cave. J. Hydrol. 2021, 593, 125810. [Google Scholar] [CrossRef]
  67. Bharti, A.K.; Prakash, A.; Verma, A.; Singh, K.K.K. Assessment of Hydrological Condition in Strata Associated with Old Mine Working during and Post-Monsoon Using Electrical Resistivity Tomography: A Case Study. Bull. Eng. Geol. Environ. 2021, 80, 5159–5166. [Google Scholar] [CrossRef]
  68. Maillol, J.M.; Seguin, M.-K.; Gupta, O.P.; Akhauri, H.M.; Sen, N. Electrical Resistivity Tomography Survey for Delineating Uncharted Mine Galleries in West Bengal, India. Geophys. Prospect. 1999, 47, 103–116. [Google Scholar] [CrossRef]
  69. Roth, M.; Nyquist, J. Evaluation of Multi-Electrode Earth Resistivity Testing in Karst. Geotech. Test. J. 2003, 26, 167–178. [Google Scholar] [CrossRef]
  70. Negri, S.; Barbolla, D.F. Challenges in the Detection of Water-Filled Cavities in Karst Environments Using Electrical Resistivity Tomography. Geosciences 2025, 15, 349. [Google Scholar] [CrossRef]
  71. Rahimi, M.; Wood, C.M.; Kallivokas, L.F. A Comparative Study of Using Geophysical Methods for Imaging Subsurface Voids of Various Sizes and at Different Depths. Eng. Geol. 2024, 341, 107711. [Google Scholar] [CrossRef]
  72. Fasani, G.B.; Bozzano, F.; Cardarelli, E.; Cercato, M. Underground Cavity Investigation within the City of Rome (Italy): A Multi-Disciplinary Approach Combining Geological and Geophysical Data. Eng. Geol. 2013, 152, 109–121. [Google Scholar] [CrossRef]
  73. Argote, D.L.; Tejero-Andrade, A.; Cárdenas-Soto, M.; Cifuentes-Nava, G.; Chávez, R.E.; Hernández-Quintero, E.; García-Serrano, A.; Ortega, V. Designing the Underworld in Teotihuacan: Cave Detection beneath the Moon Pyramid by ERT and ANT Surveys. J. Archaeol. Sci. 2020, 118, 105141. [Google Scholar] [CrossRef]
  74. Fu, Z.; Ren, Z.; Hua, X.; Shi, Y.; Chen, H.; Chen, C.; Li, Y.; Tang, J. Identification of Underground Water-Bearing Caves in Noisy Urban Environments (Wuhan, China) Using 3D Electrical Resistivity Tomography Techniques. J. Appl. Geophys. 2020, 174, 103966. [Google Scholar] [CrossRef]
  75. Caruana, J.; Wood, J.; Nocerino, E.; Menna, F.; Micallef, A.; Gambin, T. Reconstruction of the Collapse of the ‘Azure Window’ Natural Arch via Photogrammetry. Geomorphology 2022, 408, 108250. [Google Scholar] [CrossRef]
  76. Zhang, S.; Zhao, S.; An, D.; Liu, J.; Wang, H.; Feng, Y.; Li, D.; Zhao, R. Visual SLAM for Underwater Vehicles: A Survey. Comput. Sci. Rev. 2022, 46, 100510. [Google Scholar] [CrossRef]
  77. Mallios, A.; Ridao, P.; Ribas, D.; Carreras, M.; Camilli, R. Toward Autonomous Exploration in Confined Underwater Environments. J. Field Robot. 2016, 33, 994–1012. [Google Scholar] [CrossRef]
  78. Ma, Y.; Wang, S.; Xin, G.; Li, B.; Fang, H.; Lei, J.; Du, X.; Wang, N.; Di, D. A State-of-the-Art-Review of Underground Concrete Sewage Pipelines Detection Technologies. Measurement 2025, 242, 116268. [Google Scholar] [CrossRef]
  79. Rayhana, R.; Jiao, Y.; Zaji, A.; Liu, Z. Automated Vision Systems for Condition Assessment of Sewer and Water Pipelines. IEEE Trans. Autom. Sci. Eng. 2021, 18, 1861–1878. [Google Scholar] [CrossRef]
  80. De Waele, J.; Fabbri, S.; Santagata, T.; Chiarini, V.; Columbu, A.; Pisani, L. Geomorphological and Speleogenetical Observations Using Terrestrial Laser Scanning and 3D Photogrammetry in a Gypsum Cave (Emilia Romagna, N. Italy). Geomorphology 2018, 319, 47–61. [Google Scholar] [CrossRef]
  81. Parrott, C.; Dodd, T.J.; Boxall, J.; Horoshenkov, K. Simulation of the Behavior of Biologically-Inspired Swarm Robots for the Autonomous Inspection of Buried Pipes. Tunn. Undergr. Space Technol. 2020, 101, 103356. [Google Scholar] [CrossRef]
  82. Dirksen, J.; Clemens, F.H.L.R.; Korving, H.; Cherqui, F.; Le Gauffre, P.; Ertl, T.; Plihal, H.; Müller, K.; Snaterse, C.T.M. The Consistency of Visual Sewer Inspection Data. Struct. Infrastruct. Eng. 2011, 9, 214–228. [Google Scholar] [CrossRef]
  83. Calantropio, A.; Chiabrando, F. Underwater Cultural Heritage Documentation Using Photogrammetry. J. Mar. Sci. Eng. 2024, 12, 413. [Google Scholar] [CrossRef]
  84. Song, Y.; She, M.; Köser, K. Advanced Underwater Image Restoration in Complex Illumination Conditions. ISPRS J. Photogramm. Remote Sens. 2024, 209, 197–212. [Google Scholar] [CrossRef]
  85. Zhou, Y.; Chen, H.; Gao, L.; Li, G.; Chen, Y. An Automatic Method of Siltation Depth Detection and 3D Modeling in Water-Filled Sewer Pipelines Based on Sonar Point Clouds. Measurement 2025, 242, 115954. [Google Scholar] [CrossRef]
  86. Li, C.; Chen, K.; Li, H.; Luo, H. Multisensor Data Fusion Approach for Sediment Assessment of Sewers in Operation. Eng. Appl. Artif. Intell. 2024, 132, 107965. [Google Scholar] [CrossRef]
  87. Moisan, E.; Charbonnier, P.; Foucher, P.; Grussenmeyer, P.; Guillemin, S.; Koehl, M. Adjustment of Sonar and Laser Acquisition Data for Building the 3D Reference Model of a Canal Tunnel. Sensors 2015, 15, 31180–31204. [Google Scholar] [CrossRef]
  88. Wang, Z.; Chen, F.; Li, H.; Huang, G.; Yang, C. Development and Experimental Study of China’s First Pressurized Cavern Testing Device for Salt Caverns. Measurement 2026, 257, 118930. [Google Scholar] [CrossRef]
  89. Deiana, R.; Bonetto, J.; Mazzariol, A. Integrated Electrical Resistivity Tomography and Ground Penetrating Radar Measurements Applied to Tomb Detection. Surv. Geophys. 2018, 39, 1081–1105. [Google Scholar] [CrossRef]
  90. Zhe, J.; Greenhalgh, S.; Marescot, L. Multichannel, Full Waveform and Flexible Electrode Combination Resistivity-Imaging System. Geophysics 2007, 72, F57–F64. [Google Scholar] [CrossRef]
  91. Lei, X.; Li, Z.; Zhe, J. Applications and Research of the High Resolution Resistivity Method in Explovation of Caves, Mined Regions and Karst Region. Prog. Geophys. 2009, 24, 340–347. (In Chinese) [Google Scholar]
  92. Boddice, D.; Atkins, P.; Rodgers, A.; Metje, N.; Goncharenko, Y.; Chapman, D. A Novel Approach to Reduce Environmental Noise in Microgravity Measurements Using a Scintrex CG5. J. Appl. Geophys. 2018, 152, 221–235. [Google Scholar] [CrossRef]
  93. Pazzi, V.; Di Filippo, M.; Di Nezza, M.; Carlà, T.; Bardi, F.; Marini, F.; Fontanelli, K.; Intrieri, E.; Fanti, R. Integrated Geophysical Survey in a Sinkhole-Prone Area: Microgravity, Electrical Resistivity Tomographies, and Seismic Noise Measurements to Delimit Its Extension. Eng. Geol. 2018, 243, 282–293. [Google Scholar] [CrossRef]
  94. Maurer, H.; Greenhalgh, S.A.; Manukyan, E.; Marelli, S.; Green, A.G. Receiver-Coupling Effects in Seismic Waveform Inversions. Geophysics 2012, 77, R57–R63. [Google Scholar] [CrossRef]
  95. Rahimi, S.; Wood, C.M.; Teague, D.P. Performance of Different Transformation Techniques for MASW Data Processing Considering Various Site Conditions, Near-Field Effects, and Modal Separation. Surv. Geophys. 2021, 42, 1197–1225. [Google Scholar] [CrossRef]
  96. Delefortrie, S.; Hanssens, D.; De Smedt, P. Low Signal-to-Noise FDEM in-Phase Data: Practical Potential for Magnetic Susceptibility Modelling. J. Appl. Geophys. 2018, 152, 17–25. [Google Scholar] [CrossRef]
  97. McLachlan, P.; Christiensen, N.B.; Grombacher, D.; Christiansen, A.V. Evaluating the Impact of Correlated Noise for Time-lapse Transient Electromagnetic (TEM) Monitoring Studies. Near Surf. Geophys. 2023, 21, 333–342. [Google Scholar] [CrossRef]
  98. Nabighian, M.N.; Grauch, V.J.S.; Hansen, R.O.; LaFehr, T.R.; Li, Y.; Peirce, J.W.; Phillips, J.D.; Ruder, M.E. The Historical Development of the Magnetic Method in Exploration. Geophysics 2005, 70, 33ND–61ND. [Google Scholar] [CrossRef]
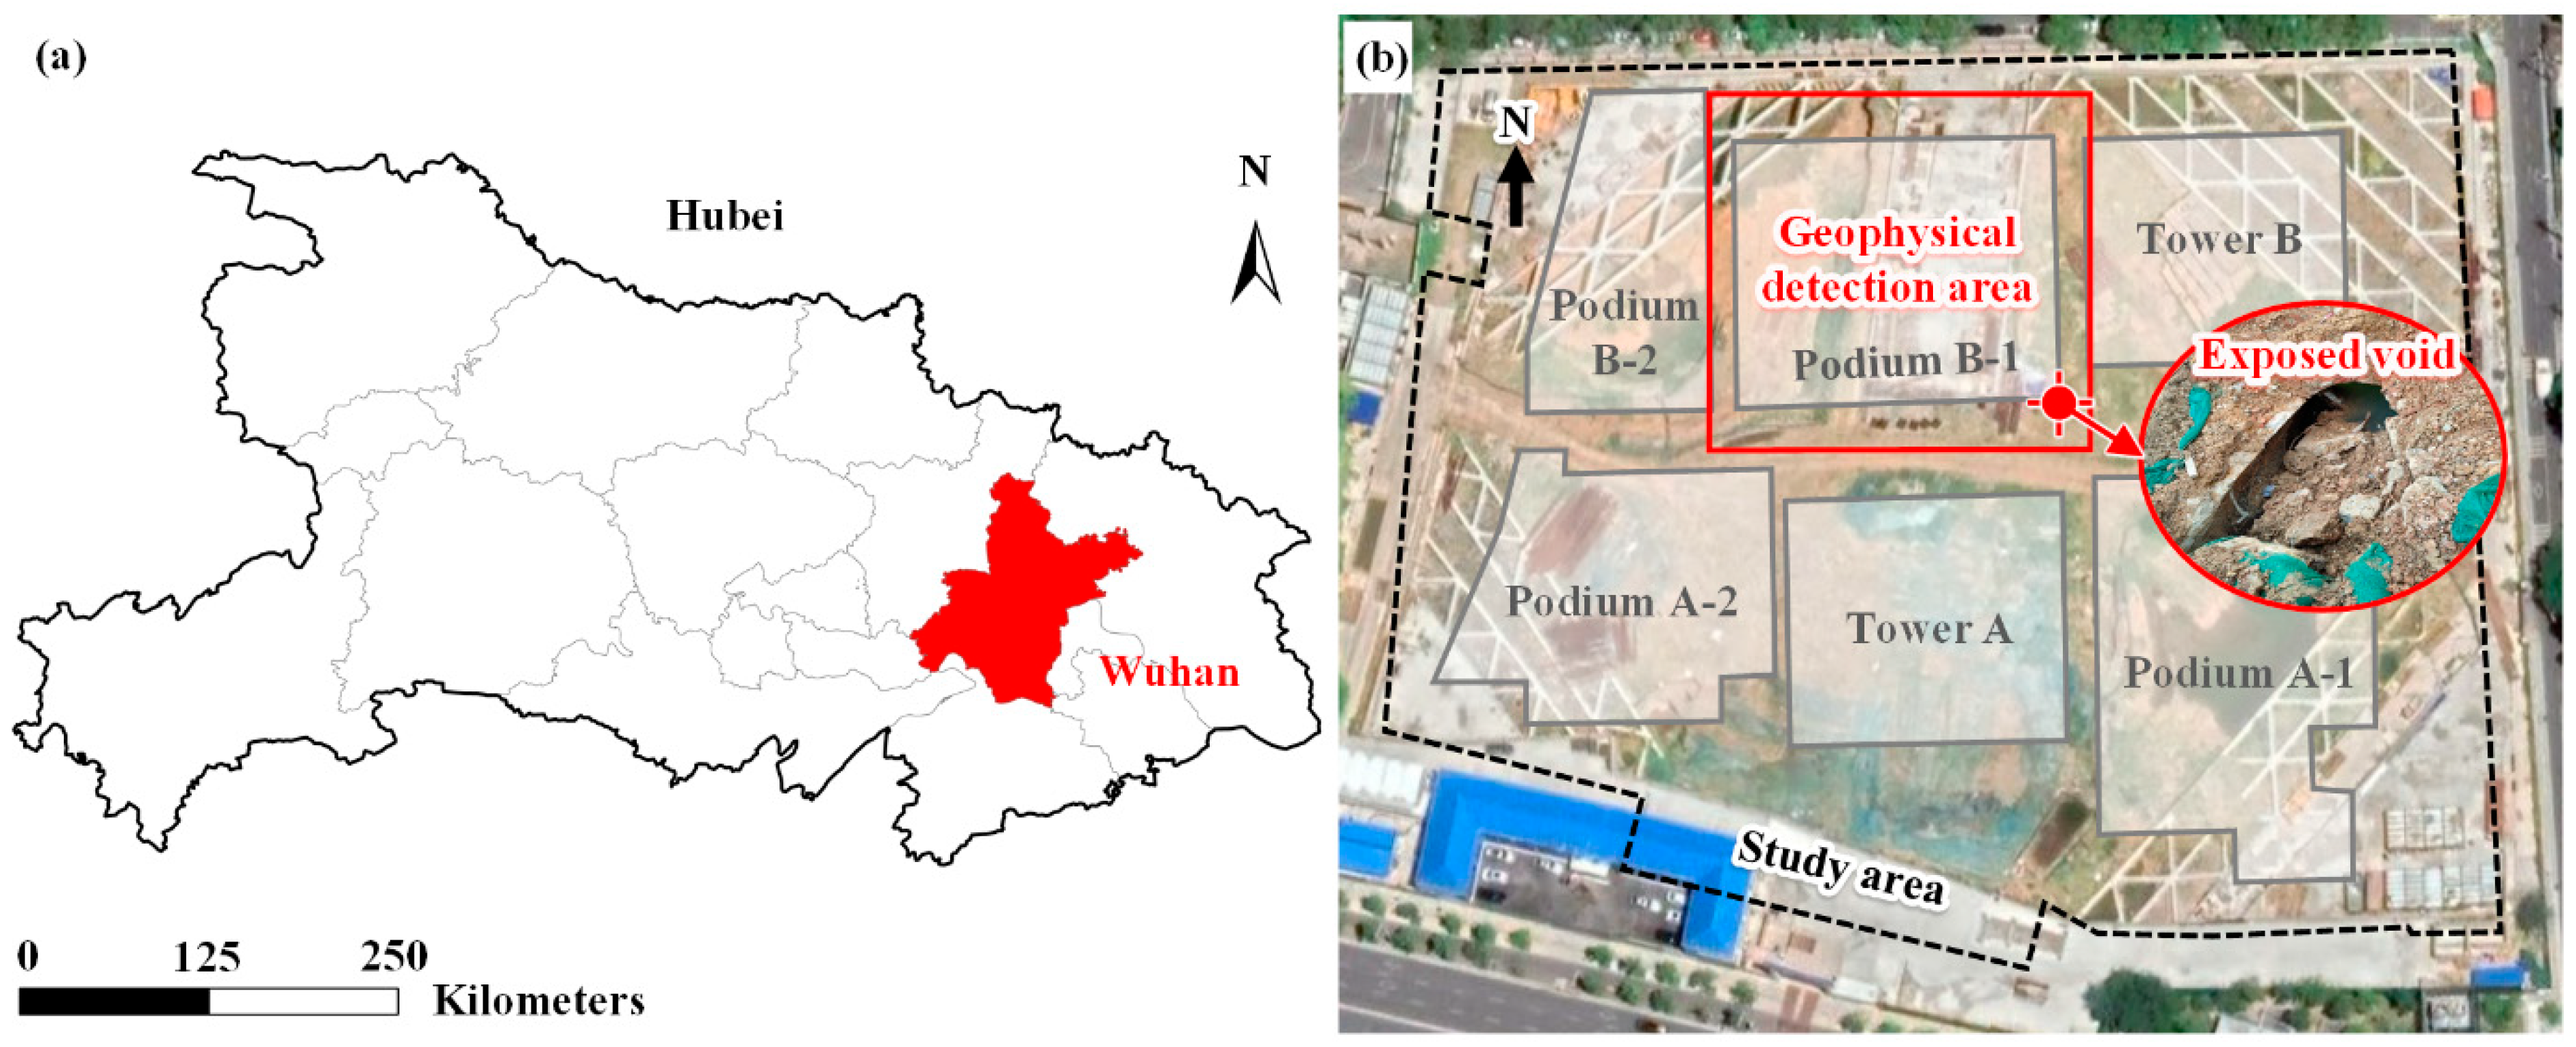
Figure 1. Location and site map. (a) Wuhan in eastern Hubei Province, China. (b) Detailed conditions of the study area, showing the exposed void and the geophysical detection area.
Water 17 03356 g001
Figure 10. Safe completion of the Main Project Structure, achieved by mitigating safety threats from unknown ancient underground voids, supported by findings from this study.
Water 17 03356 g010
Table 1. Comparison of four detection methods for urban underground voids under water-affected conditions.
MethodStrengthsLimitationsAccess NeedsSensitivity to Water
CCTVIntuitive imagery;
precise defect location
Line-of-sight only;
requires entry;
fails in turbid water
Manhole/
borehole
High
Underwater SonarOperates in zero-visibility;
good geometric accuracy
Requires water-filled cavity;
pose/odometry drift
Manhole/
borehole
Water-dependent
GPRHigh resolution;
rapid areal coverage;
effective for shallow small voids
Highly sensitive to moisture/clay;
limited depth (<~10 m typical);
EM/utility clutter
Surface antenna scanningHigh
ERTGreater depth range;
detects air- and water-filled voids
Limited resolution;
urban layout constraints;
non-unique resistivity anomalies
Surface electrode layoutLower
Table 2. Event timeline and water state.
DayActivityWater StateSite MoistureMethod/SensorPrimary OutputsPrimary Outputs
0Exposure of historic tunnelPartially water-filledBaselineVisual inspectionBreach location; initial geometryFigure 1b
1Rainfall eventWater-filledElevatedSite logMoisture context
3Underwater CCTV (dry + submerged)Water-filledElevatedHD camera a
(1920 × 1080)
Arch shape; inclination; sealed wall; scale-calibrated dimensionsFigure 2b and Figure 3
3Underwater sonar scan (full-length)Water-filledElevatedX7-DS robot b, dual 1 MHz sonarTrajectory; internal contour; roof/floor heights; sealed ends distanceFigure 2b and Figure 4
4Pumping of exposed chamberDrainedDecreasing Pump/drain logLowered water level
5Post-drainage check (fair weather)DrainedNear-baselineVisual inspectionConfirm low water; plan geophysics
6GPR acquisitionDrainedNear-baselineZond-12e c, 75–150 MHzVoid-type signature on L1; anomalies on L2Figure 2c and Figure 5
6UHD-ERT acquisitionDrainedNear-baselineFlashRES-64 d, 1 m electrode spacingClosed high-resistivity loops on D1–D2Figure 2c and Figure 6
7Integration and decisionDrainedBaselineGIS/CAD + boreholesFinal map: only exposed void presentFigure 7, Figure 8 and Figure 9
Notes: a Institute of Rock and Soil Mechanics, Chinese Academy of Sciences, Wuhan, China; b Wuhan Easy-Sight Technology Co., Ltd., Wuhan, China; c Radar Systems, Inc., Riga, Latvi; d ZZ Resistivity Imaging, Perth, Australia.
Table 3. Parameters for quantifying drainage-induced contrast changes.
SymbolMeaningRepresentative ValueBasis
ϕPorosity0.25–0.35Clay–gravel/residual soils
mCementation exponent1.5–2.0Unconsolidated sands/gravels
nSaturation exponent≈2(1.8–2.0)Common for sands/gravels
ε s Mineral permittivity4–7Quartz–clay mixtures
ε w Water permittivity~80Room temperature
S s a t Near-saturated saturation0.9–1.0Post-rain, pre-drainage
S d r a i n e d Drained saturation0.5–0.7Two fair-weather days + pumping
ρ d r a i n e d / ρ s a t UHD-ERT resistivity contrast1.8–3.0Archie ratio with n ≈ 2
ε r (sat→drained)Effective permittivity~20–30→~11–14CRIM with ϕ range
v (sat→drained)GPR velocity~0.06–0.07→0.09 m/nsCRIM + L1 fit
GPR attenuation lengthPenetration/contrast~1.4–1.7× increase ρ / f
Disclaimer/Publisher’s Note: The statements, opinions and data contained in all publications are solely those of the individual author(s) and contributor(s) and not of MDPI and/or the editor(s). MDPI and/or the editor(s) disclaim responsibility for any injury to people or property resulting from any ideas, methods, instructions or products referred to in the content.