Article

Optimization of Aluminum Electrocoagulation Parameters for Nutrient Removal from Hydroponic Wastewater Using Response Surface Methodology

1
Department of Chemical Engineering, College of Engineering, Qatar University, Doha P.O. Box 2713, Qatar
2
Center for Advanced Materials (CAM), Qatar University, Doha P.O. Box 2713, Qatar
3
Gas Processing Center, College of Engineering, Qatar University, Doha P.O. Box 2713, Qatar
4
Department of Petroleum and Chemical Engineering, College of Engineering, Sultan Qaboos University, Muscat 123, Oman
*
Author to whom correspondence should be addressed.
Water 2025, 17(23), 3346; https://doi.org/10.3390/w17233346 (registering DOI)
Submission received: 12 October 2025 / Revised: 13 November 2025 / Accepted: 19 November 2025 / Published: 22 November 2025

Abstract

Hydroponic systems represent a sustainable, soil-less alternative to conventional agriculture, offering high water-use efficiency and reduced land demand. However, the resulting hydroponic wastewater solution (HWS) requires proper treatment to prevent environmental contamination and enable nutrient recovery. This study systematically optimized the electrocoagulation (EC) process for nitrate and phosphate removal from HWS using Response Surface Methodology (RSM) based on the Box–Behnken Design (BBD). The effects of three key factors—applied current (0.03–0.80 A), electrolysis time (10–60 min), and number of aluminum electrodes (2, 4, 6)—were examined to maximize nutrient removal efficiency while minimizing energy consumption. Statistical modeling in Minitab software 2021, confirmed the strong influence of these parameters on removal performance (p < 0.05, high R2 values). Phosphate removal was highly efficient, reaching 99.7% under optimal conditions (0.415 A, four-electrode configuration, 35–60 min). However, nitrate removal was low at lower levels of applied current (0.03 A), with the best performance (Greater than 95%) achieved at 0.8 A and 60 min using six electrodes. Higher current and electrode numbers improved removal efficiency, though excessive current occasionally caused electrode passivation. Energy analysis showed that increasing the current and electrode number enhanced removal efficiency but also elevated power consumption. Overall, the results demonstrate that fine-tuning current intensity and electrolysis duration is critical to balance removal performance and energy demand. The study concludes that electrocoagulation is an effective and treatment option for nutrient recovery and decentralized management of hydroponic wastewater.

1. Introduction

Hydroponic systems are an advancement in agriculture for the growth of plants without the use of soil [1]. The system works with the roots of the plants being imbedded in nutrient rich water solutions to provide plants with essential minerals for their growth [2]. The process occurs in controlled environments such as indoor farms and greenhouses. There are many benefits to hydroponics, where they utilize 90% less water than traditional farming and are ideal for urban or vertical farming [1,3]. In addition, risks are reduced due to the controlled environments and allow year-round farming. Hydroponic solutions contain many different macro- and micro- nutrients to allow for plant development; however, even though the system is sustainable, the wastewater produced contains high levels of nutrients that can pollute water bodies and soil affecting the environment and human health [4,5,6,7]. Moreover, when this solution is repeatedly reused in closed-loop systems, it can negatively affect plant growth. This occurs due to imbalances in the NO3/NH4+ ratio, potential nitrite toxicity, and the accumulation of undesirable substances such as sodium, chloride, and heavy metals [6]. Therefore, proper treatment of this type of wastewater is essential to maintain system efficiency and prevent environmental harm.
Numerous studies have examined the potential for recycling and treating hydroponic wastewater solution (HWS), specifically for nutrient recovery. Recovering nutrients from hydroponic wastewater is essential for promoting sustainable and resource-efficient agriculture. Depending on the type of hydroponic system used, either open system or closed system [8], the investigated treatment approaches span physical, chemical, and biological methods, including sand filtration, activated carbon adsorption, advanced oxidation processes, constructed wetlands, microalgae cultivation, and denitrification. Findings indicate that recycling drainage water from hydroponic systems can recover 35–54% of nutrients while simultaneously reducing potable water consumption for irrigation by approximately 33–40% [9,10].
Over the past several years, removing and nutrient recovery (nitrogen and phosphorus) from HWS has attracted great attention. In a study conducted by Seo et al. [11], constructed wetlands were utilized with different injection methods and filter media for the removal of pollutants from the hydroponic wastewater system. The retention time and contact between wastewater and filter media impacted the nutrient removal in the system. The removal of phosphorus was observed to vary between 50 and 70% depending on the media adsorption capacity; however, the removal of nitrogen varied from 50 to 80% based on the improved contact time of the wastewater with the injection. In another study by Gagnon et al. [12], the nutrient removal in the wastewater was examined at low temperatures to understand the effect of the biological process. It was determined that the low temperatures slowed down the microbial activity that nitrifies and denitrifies the system that affected the removal of nitrogen in the system. In addition, phosphorus was also affected but less than that of nitrogen with a removal rate ranging between 50 and 70%, while nitrogen had a removal between 30 and 50%. It can be understood that temperature plays an important role in the removal occurring in the system. The filter media depth, wetland configuration, and loading rate were also examined in a study examined by Park et al. [13] to optimize the design parameters for optimal nutrient removal. The study finds the ideal balance between media depth and load to remove as much nitrogen and phosphorus as possible without using excessive money or land. It was observed that phosphorus and nitrogen were removed at rates greater than 60 and 70%.
Technologies other than constructed wetlands that were utilized are denitrification by Park et al. [14]. In his study, nitrogen removal was improved by utilizing denitrification filters, where plant trimmings were utilized as an organic carbon source. The nitrogen in the system was removed with the filters at a rate of 60–85%; however, the removal of phosphorus is limited with denitrification leading to a removal of about 30% or less. As for the ammonia in the system, it was converted to nitrate that was reduced by nitrification. Another study conducted by Castellar et al. [15] utilized cork as a natural carbon source for the process of denitrification of the system. The cork allowed denitrifying bacteria to have high activity that helped release organic carbon that provided high nitrate removal efficiencies. Under controlled conditions, the removal of nitrate was around 75 to 90%, while the phosphate removal in the system was minimal due to cork being less effective with phosphate. Denitrification was also utilized for hydroponic wastewater treatment by Rodziewicz et al. [16] that investigated nitrogen removal with electrobiological contactor treating. The nitrogen removal in the system was enhanced by combining biological denitrification and electrochemical reduction, where a 80–90% removal rate was obtained. As for the phosphate in the system, the electrochemical process helped with its removal.
Another technology for the treatment of hydroponic wastewater is microalgae-based treatment methods. A study by Hultberg et al. [17] utilized microalgae for the removal of nitrate, ammonia, and phosphate to produce biomass. The removal rate achieved for nitrogen was 50–90% and 60–95% for phosphorus removal in the system. However, the removal rates depend on multiple factors such as light, temperature, and hydraulic loading for the microalgae to survive and remove the nutrients. An additional study is Saxena and Bassi [18] combined algae with chemical precipitation for nutrient removal. Through the formation of insoluble phosphate molecules, alkali precipitation can rapidly remove 70–95% of phosphorus. Through biological means, algae farming further eliminates nitrogen and leftover phosphorus, where the nitrogen is removed at a rate of 65–80%. In the case of denitrification and microalgae-based treatment, electrocoagulation in the case of phosphate provides better outcomes; however, when it comes to nitrate removal it depends on the conditions provided. Phosphates easily adsorb onto positively charged metal hydroxides formed during electrocoagulation. These flocs settle or can be separated, effectively removing phosphorus quickly and efficiently. Denitrification does not target phosphate removal, as it is a biological process specialized for nitrogen removal, specifically nitrate. On the other hand, microalgae assimilate phosphorus into their biomass, but their efficiency in removing phosphorus is generally slower and highly dependent on other conditions. As for nitrate removal, electrocoagulation can remove nitrate through direct electrochemical reduction, but it is generally less efficient and less selective for nitrate removal compared to biological denitrification. The removal depends heavily on electrode material, current, pH, and reactor design. Denitrification is highly specific and effective for nitrate removal because it biologically converts nitrate to harmless nitrogen gas. As for microalgae, nitrate is removed by assimilation into biomass, incorporating nitrogen into proteins and other cellular components.
Over the past few decades, electrochemical methods have been recognized as effective techniques for wastewater treatment, utilizing direct current applied to electrodes to remove pollutants from aqueous solutions. Among these methods, electrocoagulation (EC) has emerged as a particularly efficient electrochemical process capable of eliminating various contaminants from wastewater such as heavy metals [19,20], nutrients [21,22], dyes [23,24], microplastics [25,26], chemical oxygen demand (COD), color, turbidity and other organic loads under various operating conditions from gray water [27,28]. Moreover, the EC has been proposed as disinfection technique in wastewater treatment [29]. These findings collectively indicate that electrocoagulation is a versatile and environmentally friendly treatment alternative for diverse wastewater streams. In EC systems, an electrical current is passed through electrodes to generate coagulants. The anode dissolves and releases metal ions, typically iron ions (Fe3+) or aluminum ions (Al3+) depending on the electrode material used [30,31]. These ions undergo hydrolysis in water to form metal hydroxides, which act as inorganic coagulants [32,33]. Pollutants particles adhere to these hydroxides, forming flocs that subsequently settle or float [8]. Moreover, EC technique offers several advantages in comparison with chemical coagulation, including the elimination of external coagulant addition, reduced sludge production, and enhanced potential for water reuse. In addition, electrocoagulation was beneficial in reducing the negative health and environmental effects on humans and aquatic life by reducing the solid waste generation [34]. Several studies have also highlighted the promising performance of continuous electrocoagulation processes (CEPs) for the treatment of both inorganic and organic industrial pollutants, offering improved scalability and operational stability compared to batch systems [35,36]. Furthermore, EC can contribute to a circular economy approach by enabling resource recovery from treatment residues. For example, phosphorus-rich sludge generated during EC can be valorized for phosphorus recovery, adding economic value while minimizing waste generation [37].
Although EC treatment method has been applied to various types of wastewaters, limited research has explored its application to HWS. Ultimately, this study provides practical insights into the potential of EC as an effective and sustainable technology for systematically aims to optimize the aluminum electrocoagulation process using Response Surface Methodology (RSM) based on the Box–Behnken Design (BBD). The study rigorously evaluates the influence of key operational and design parameters such as applied current, electrocoagulation time, and number of electrodes on nutrient removal efficiency. By identifying the optimal operating conditions, this work advances the understanding of EC process dynamics and contributes to improving pollutant removal performance, energy efficiency, and overall process sustainability in hydroponic wastewater treatment.

2. Materials and Methods

2.1. Preparation of Hydroponic Wastewater Solution (HWS)

A synthetic HWS was prepared and characterized prior to the electrocoagulation experiments. The solution was produced by dissolving six chemical compounds—sodium acetate anhydrous (0.512 g) (Fischer Chemical, Zurich, Switzerland), sodium chloride (0.05 g) (VWR chemicals BDH, Radnor, PA, USA), potassium phosphate tribasic monohydrate (0.1 g) (Samchun chemical, Seoul, Republic of Korea), ammonium nitrate (0.15 g) (Sigma Aldrich, St. Louis, MO, USA), calcium chloride dehydrate (Sigma Aldrich, St. Louis, MO, USA) (0.035 g), and magnesium chloride hexahydrate (Sigma Aldrich, St. Louis, MO, USA) (0.05 g)—in 2 L of deionized (DI) water. The mixture was prepared in a 600 mL beaker placed on a magnetic stirrer plate equipped with a stir bar, and each chemical was added sequentially under continuous stirring until complete dissolution was achieved. The physicochemical characteristics of the prepared synthetic HWS are summarized in Table 1.

2.2. Experimental Setup and Procedure

A laboratory-scale batch electrocoagulation experiments were performed (Figure 1) in a glass beaker reactor (600 mL) served as EC reactor with a working volume of 400 mL of synthetic HWS. The HWS was introduced into the beaker and maintained at 25 °C with an initial pH of 7.2. The initial pH of each experiment was measured using a calibrated pH meter and adjusted when required to target values using 0.1 M HCl or 0.1 M NaOH. Aluminum plate electrodes (15.0 × 2.0 × 0.10 cm) were arranged in a parallel monopolar configuration (anode and cathode alternating) with an inter-electrode spacing of 1 cm measured edge-to-edge. Three electrode configurations were investigated, using 2, 4, and 6 electrodes. The electrodes were fixed vertically and held in position by a non-conductive clamp to maintain constant spacing. To minimize surface passivation and achieve reproducible anodic dissolution, electrodes were pretreated and cleaned before the first use and between experimental runs. The electrodes were immersed in a diluted hydrochloric acid solution for approximately 2 h and then rinsed with distilled water before each EC run. The solution was stirred at 200 rpm using a magnetic stirrer during electrolysis to maintain homogeneity and avoid concentration gradients. A DC power supply (ISO-TECH IPS 1603D, Northants, UK), was used to apply constant current. Currents tested ranged from 0.03 to 0.8 A. Cell voltage was recorded during each run and used to compute energy consumption. All experiments were conducted three times (triplicate) and the results in this study presented the average value.

2.3. Analytical Methods

Nutrient concentrations in mg/L (PO43− and NO3) were measured using 7600 UV–VIS spectrophotometer (Tintometer GmbH, Lovibond Water Testing, Dortmund, Germany), which was calibrated at least twice daily with standard reagents. Electrical conductivity (µS/cm) and pH were measured using a Hanna HI 5521 conductivity and pH meter (Woonsocket, RI, USA), calibrated before each use. For selected experiments, and at the end of electrocoagulation treatment, the generated sludge was collected by filtration, air-dried for 24 h, and then oven-dried at 105 °C to constant weight. The dried sludge was ground and homogenized prior to nutrient analysis. The sludge composition in terms of nutrient was determined using Inductively Coupled Plasma–Optical Emission Spectroscopy (ICP-OES, Perkin Elmer, Waltham, MA, USA). Results were expressed as mg/g of dry sludge.

2.4. Calculations

For each electrocoagulation (EC) experiment, the percentage removal of nitrate and phosphate was determined after treatment using the following equation:
Removal (100%) = [(Ci − Cf)/Ci] × 100%
where Ci is the initial nitrate or phosphate concentration in the HWS before treatment (mg/L) and Cf is the final nitrate or phosphate concentration after EC treatment (mg/L). The specific energy consumption (kWh/m3) of the EC process was calculated using the following equation:
Energy Consumption = (v × I × t)/V
where v represents the applied voltage (V), I denotes the applied current (A), t is the electrocoagulation time (sec), and V is the volume of the treated solution in (m3). The electrode (anode) consumption (kg/m3) in the system was calculated using the following equation based on Faraday’s law of electrolysis:
Electrode Consumption = (I × t × M)/(z × F × V)
where M represents the molar mass of aluminum (g/mol), z is the number of electrons, and F is Faraday’s constant (96,485 C/mol).
The effective wetted electrode area (A) used for current density calculations was 24.8 cm2 per electrode (6.2 cm immersed × 2.0 cm width × 2 sides = 24.8 cm2 = 0.00248 m2). Current density (J) was computed as J = I/A using the corrected wetted area A = 0.00248 m2.

3. Optimization Performance Using Box–Behnken Design

Response surface methodology (RSM) is a statistical method that utilizes design experiments under fixed parameters to obtain optimal responses [28,38]. The parameters impact on the response functions can be determined with Box–Behnken design (BBD), which is one RSM technique. BBD is favored over other methods due to it requiring fewer experiments to identify the complex response functions and can yield designs with appropriate statistical features [39]; therefore, BBD was selected is the way of approach for hydroponic wastewater treatment. In the BBD, there should be an equal number of replicates for each combination of factor. An equatorial distance separates the experiment sites from the center of the hydro cube. A second-order polynomial model can fit the generated complex response in Equation (4).
Y = C0 + a = ∑ CaXa + ∑ CaaXa2 + ∑∑ CabXaXb
where Y is the complex response linked to each level factor combination. C0, Ca, Caa, and Cab represent the intercept, linear, and quadratic term coefficient, respectively, while the independent variables are denoted by a, Xa, and Xb. The coefficients were computed using least-square regression after analysis of variance. After fitting the data using a quadratic equation, RSM was utilized to determine how three parameters affected HWS treatment by EC technique.
In the Minitab software 2021 analysis, three electrode configurations—comprising 2, 4, and 6 electrodes—were employed to evaluate the removal efficiency of two nutrients: phosphate and nitrate. The experimental runs were randomized using Minitab software 2021 based on a Box–Behnken design (BBD) to generate 3D surface and contour plots illustrating the interactions among the system’s variables and to determine optimal conditions. A total of 15 experimental runs were conducted for three selected factors: current (A, in amperes), electrocoagulation time (B, in minutes), and number of electrodes (C). The input ranges for these parameters were 0.03–0.8 A, 10–60 min, and 2–6 electrodes, respectively, as shown in Table 2. Table 3 presents the factor coding and interaction levels for each run, where the coded values of −1, 0, and 1 represent the low, medium, and high levels of each variable, respectively. All experiments were conducted under the interaction condition three times (triplicate) and record of their average of each response in Table 4.

4. Results and Discussion

Table 4 presents the experimental runs obtained from the RSM along with the corresponding results. A total of 15 runs were conducted under varying operating conditions. Following analysis of the treated wastewater, nutrient removal efficiencies were determined using Equations (1)–(3). The predicted removal rates for nitrate and phosphate were calculated using Minitab, and their values are shown in Table 4. Overall, the predicted values followed trends similar to those of the experimental data, although some deviations were observed. In certain cases, the model either overestimated or underestimated removal efficiency at different current and time settings. This discrepancy arises because Minitab generates predictions statistically based on model parameters, whereas real experimental systems often involve complex, non-linear relationships and inherent variability. Noise and fluctuations in the experimental data may also contribute to these differences. Given the complexity of the electrocoagulation process, which involves multiple interacting factors, variations in removal efficiency are expected. The quadratic model used in this study captures the non-linear and interactive effects between variables, providing reliable predictions that generally align with experimental outcomes. Nevertheless, it should be emphasized that nitrate and phosphate responded differently within the system, reinforcing the importance of experimental validation to complement the optimization and surface response analysis.
The percentage error between the experimental data and the predicted fits was calculated. For both nitrate and phosphate, most predicted errors were within 5%; however, in a few cases, deviations exceeded this threshold. In the case of nitrate, the model occasionally overestimated removal efficiency, likely due to its inherent limitations in accounting for experimental anomalies or non-linear behavior at lower current levels. A similar pattern was observed for phosphate, although in this case the model consistently underestimated removal. Phosphate is generally more easily removed compared to other nutrients, and the systematic under prediction across most runs suggests limitations in the modeling approach. In particular, the model struggled to accurately reflect the near-complete removal efficiencies (often above 95%), as its predictions appeared conservatively biased away from the upper limit to avoid potential overfitting. Moreover, the simplified quadratic model was unable to fully capture the non-linear behavior of phosphate removal. Key influencing factors, such as pH, initial phosphate concentration, and chemical interactions, were not included in the model, further constraining its predictive accuracy. As a result, the model tended to regress toward the mean, leading to underestimations in scenarios with consistently high removal rates. The predicted values at 100% especially for phosphate, which is produced by model compared to less than 100% values by experiments were observed.
The F-value and p-value are key parameters used to assess the significance of each coefficient in the regression model. The p-value indicates whether the corresponding F-value is sufficiently large to demonstrate statistical significance. At a 95% confidence level, a parameter is considered statistically significant when the p-value is less than 0.05. The ANOVA results presented in Table 5 summarize the F- and p-values for nitrate and phosphate removal. For nitrate, current and electrocoagulation time were found to be highly significant factors, with p-values equal to zero. In contrast, the number of electrodes was less significant, with a p-value of 0.054, which is slightly above the 0.05 threshold and therefore considered borderline significant. These results suggest that current and treatment time are the most influential factors for nitrate removal, while the number of electrodes plays a comparatively minor role. However, it should be noted that Minitab relies on a relatively small experimental dataset with inherent variability and collinearity, which may influence the precision of the model and its predicted fits. Similar trends were observed for phosphate removal. Current and electrocoagulation time were significant factors, whereas the number of electrodes was highly insignificant, with a p-value of 0.897. This confirms that current and treatment duration are the dominant variables in phosphate removal, while electrode number has negligible impact. In addition to p-values, the regression quality was evaluated using the coefficient of determination (R2) and the adjusted R2. For nitrate, the model achieved an R2 of 89.38% and an adjusted R2 of 86.48%, indicating an excellent fit and demonstrating that current, electrocoagulation time, and electrode number collectively contribute meaningfully to nitrate removal. For phosphate, the model produced an R2 of 73.52% and an adjusted R2 of 66.30%, suggesting a moderate fit, with a larger portion of variability remaining unexplained. Based on these findings, electrocoagulation is highly effective for nitrate removal and moderately effective for phosphate removal, with current and treatment time identified as the most influential operational parameters.
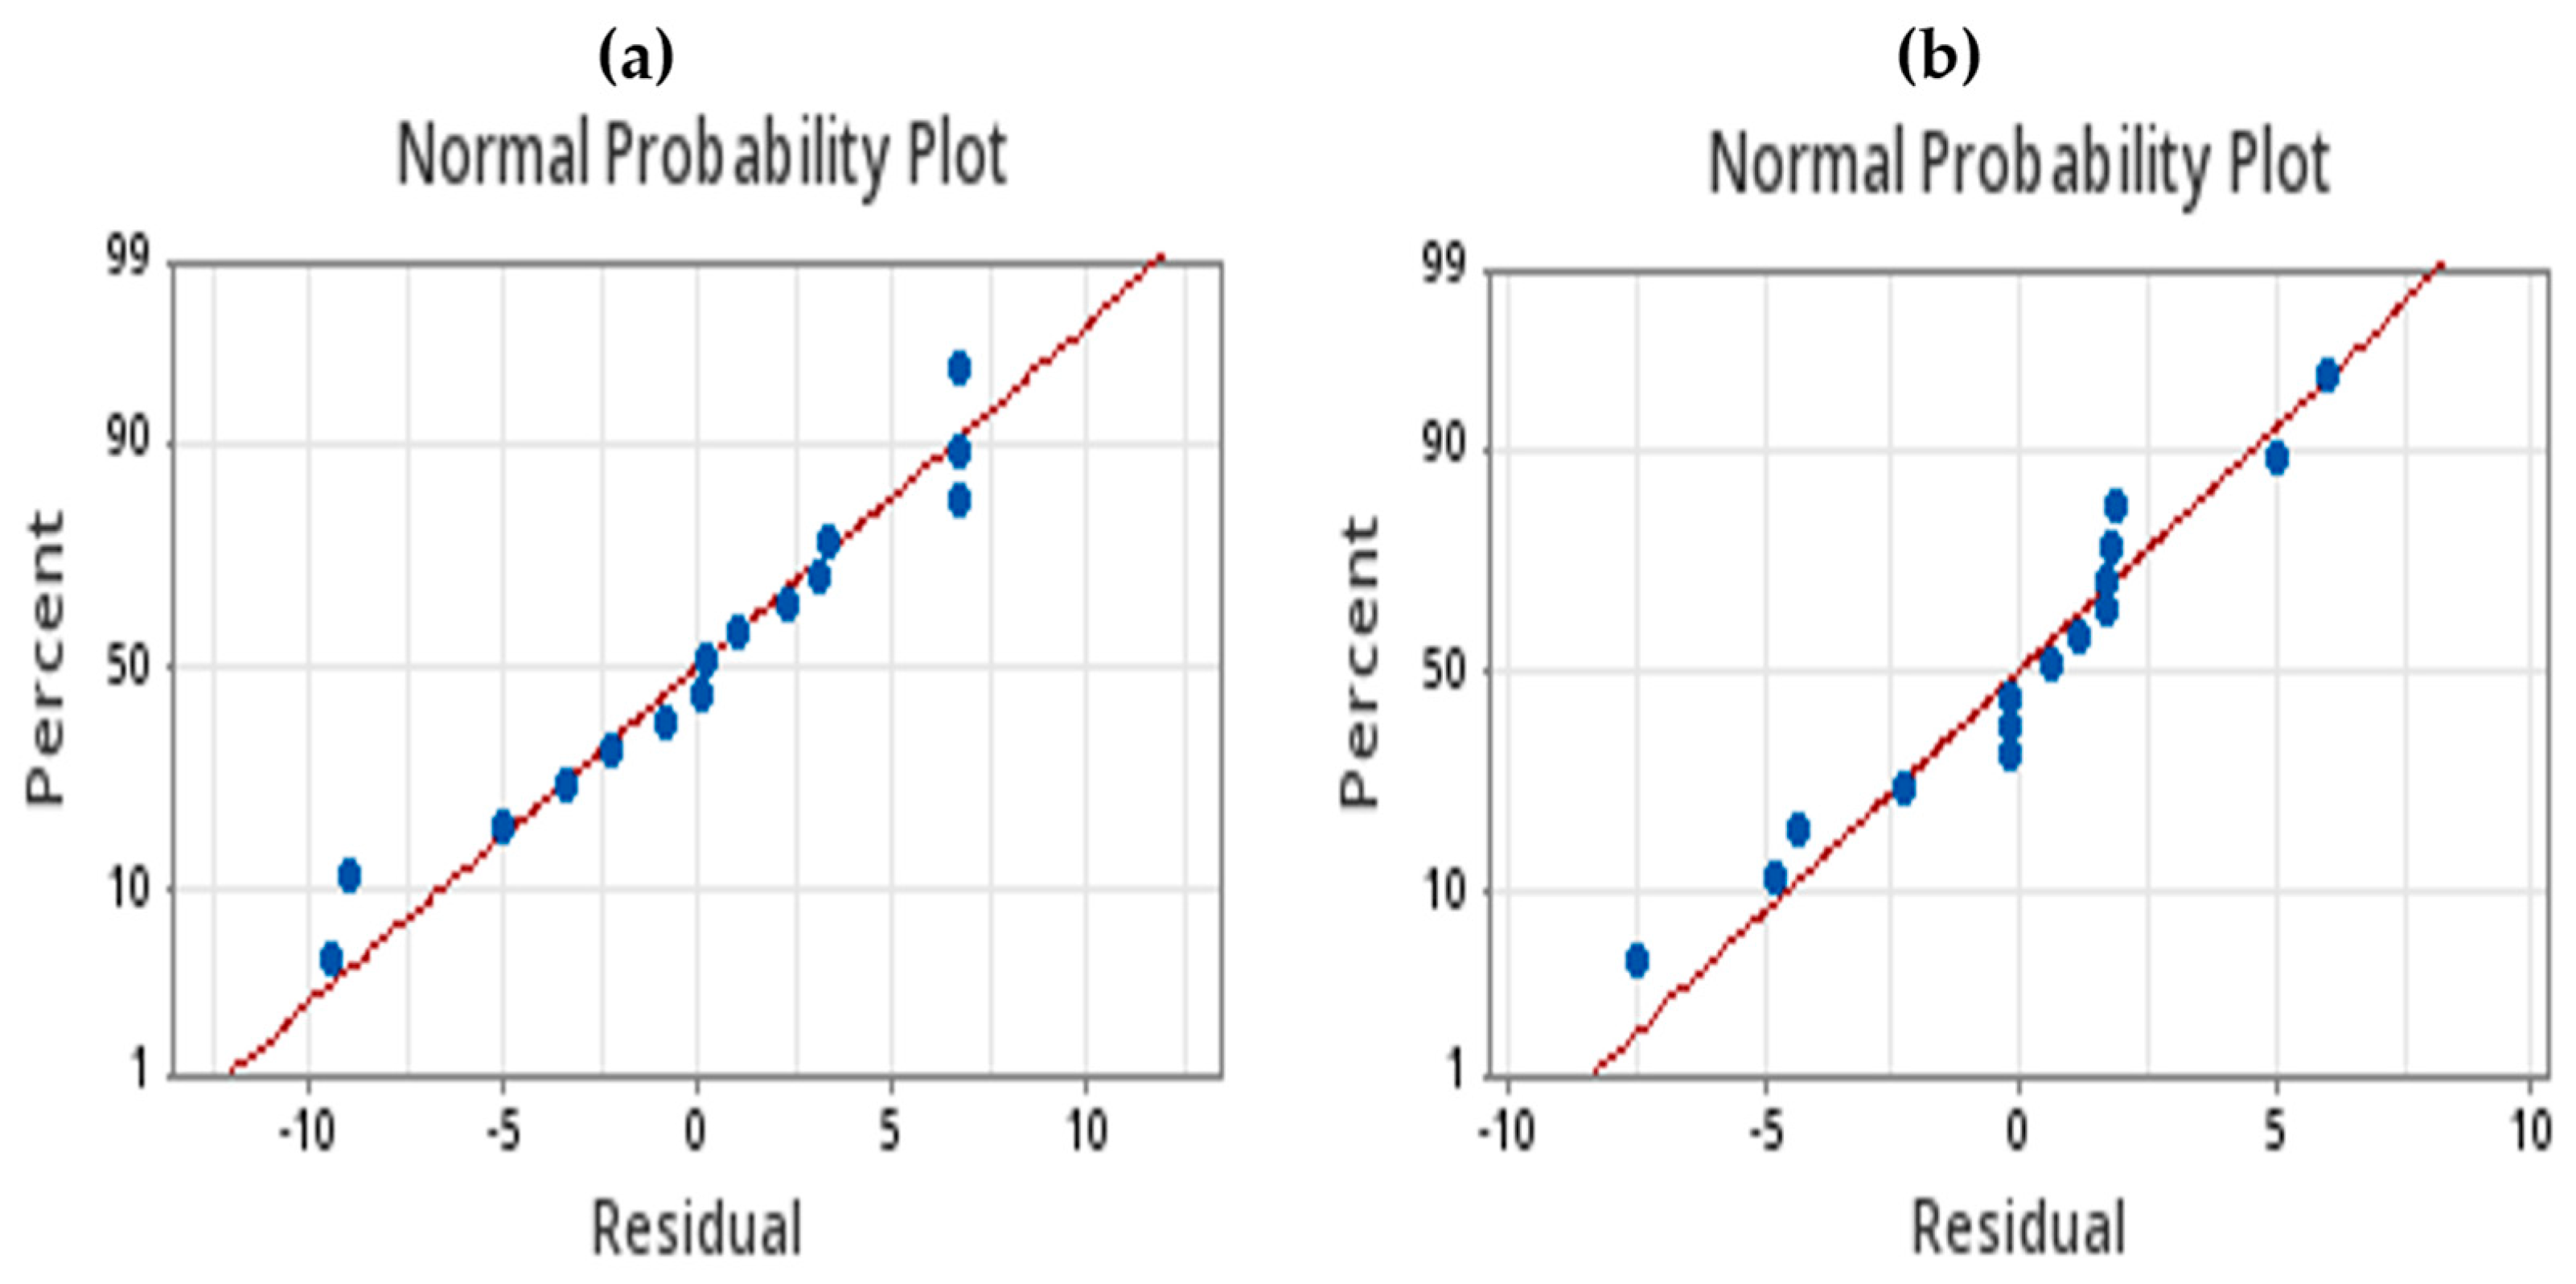
Figure 2 illustrates the standardized residuals plotted against the normal probability for (a) phosphate and (b) nitrate removal. In the phosphate plot (Figure 2a), the data points generally follow the reference (red) line, although slight deviations are observed, indicating a minor departure from normality likely due to data asymmetry. However, the overall pattern remains consistent, suggesting that the normality assumption is reasonably satisfied. Conversely, the nitrate plot (Figure 2b) exhibits points that align closely with the red line, with only minimal deviations at the tails, signifying an excellent fit and confirming that the residuals are approximately normally distributed. This observation supports the validity of the design of experiments (DOE) assumptions. It is worth noting that significant deviations from the reference line in such plots could undermine the model’s predictive reliability; however, no such major deviations are evident in this case [40].
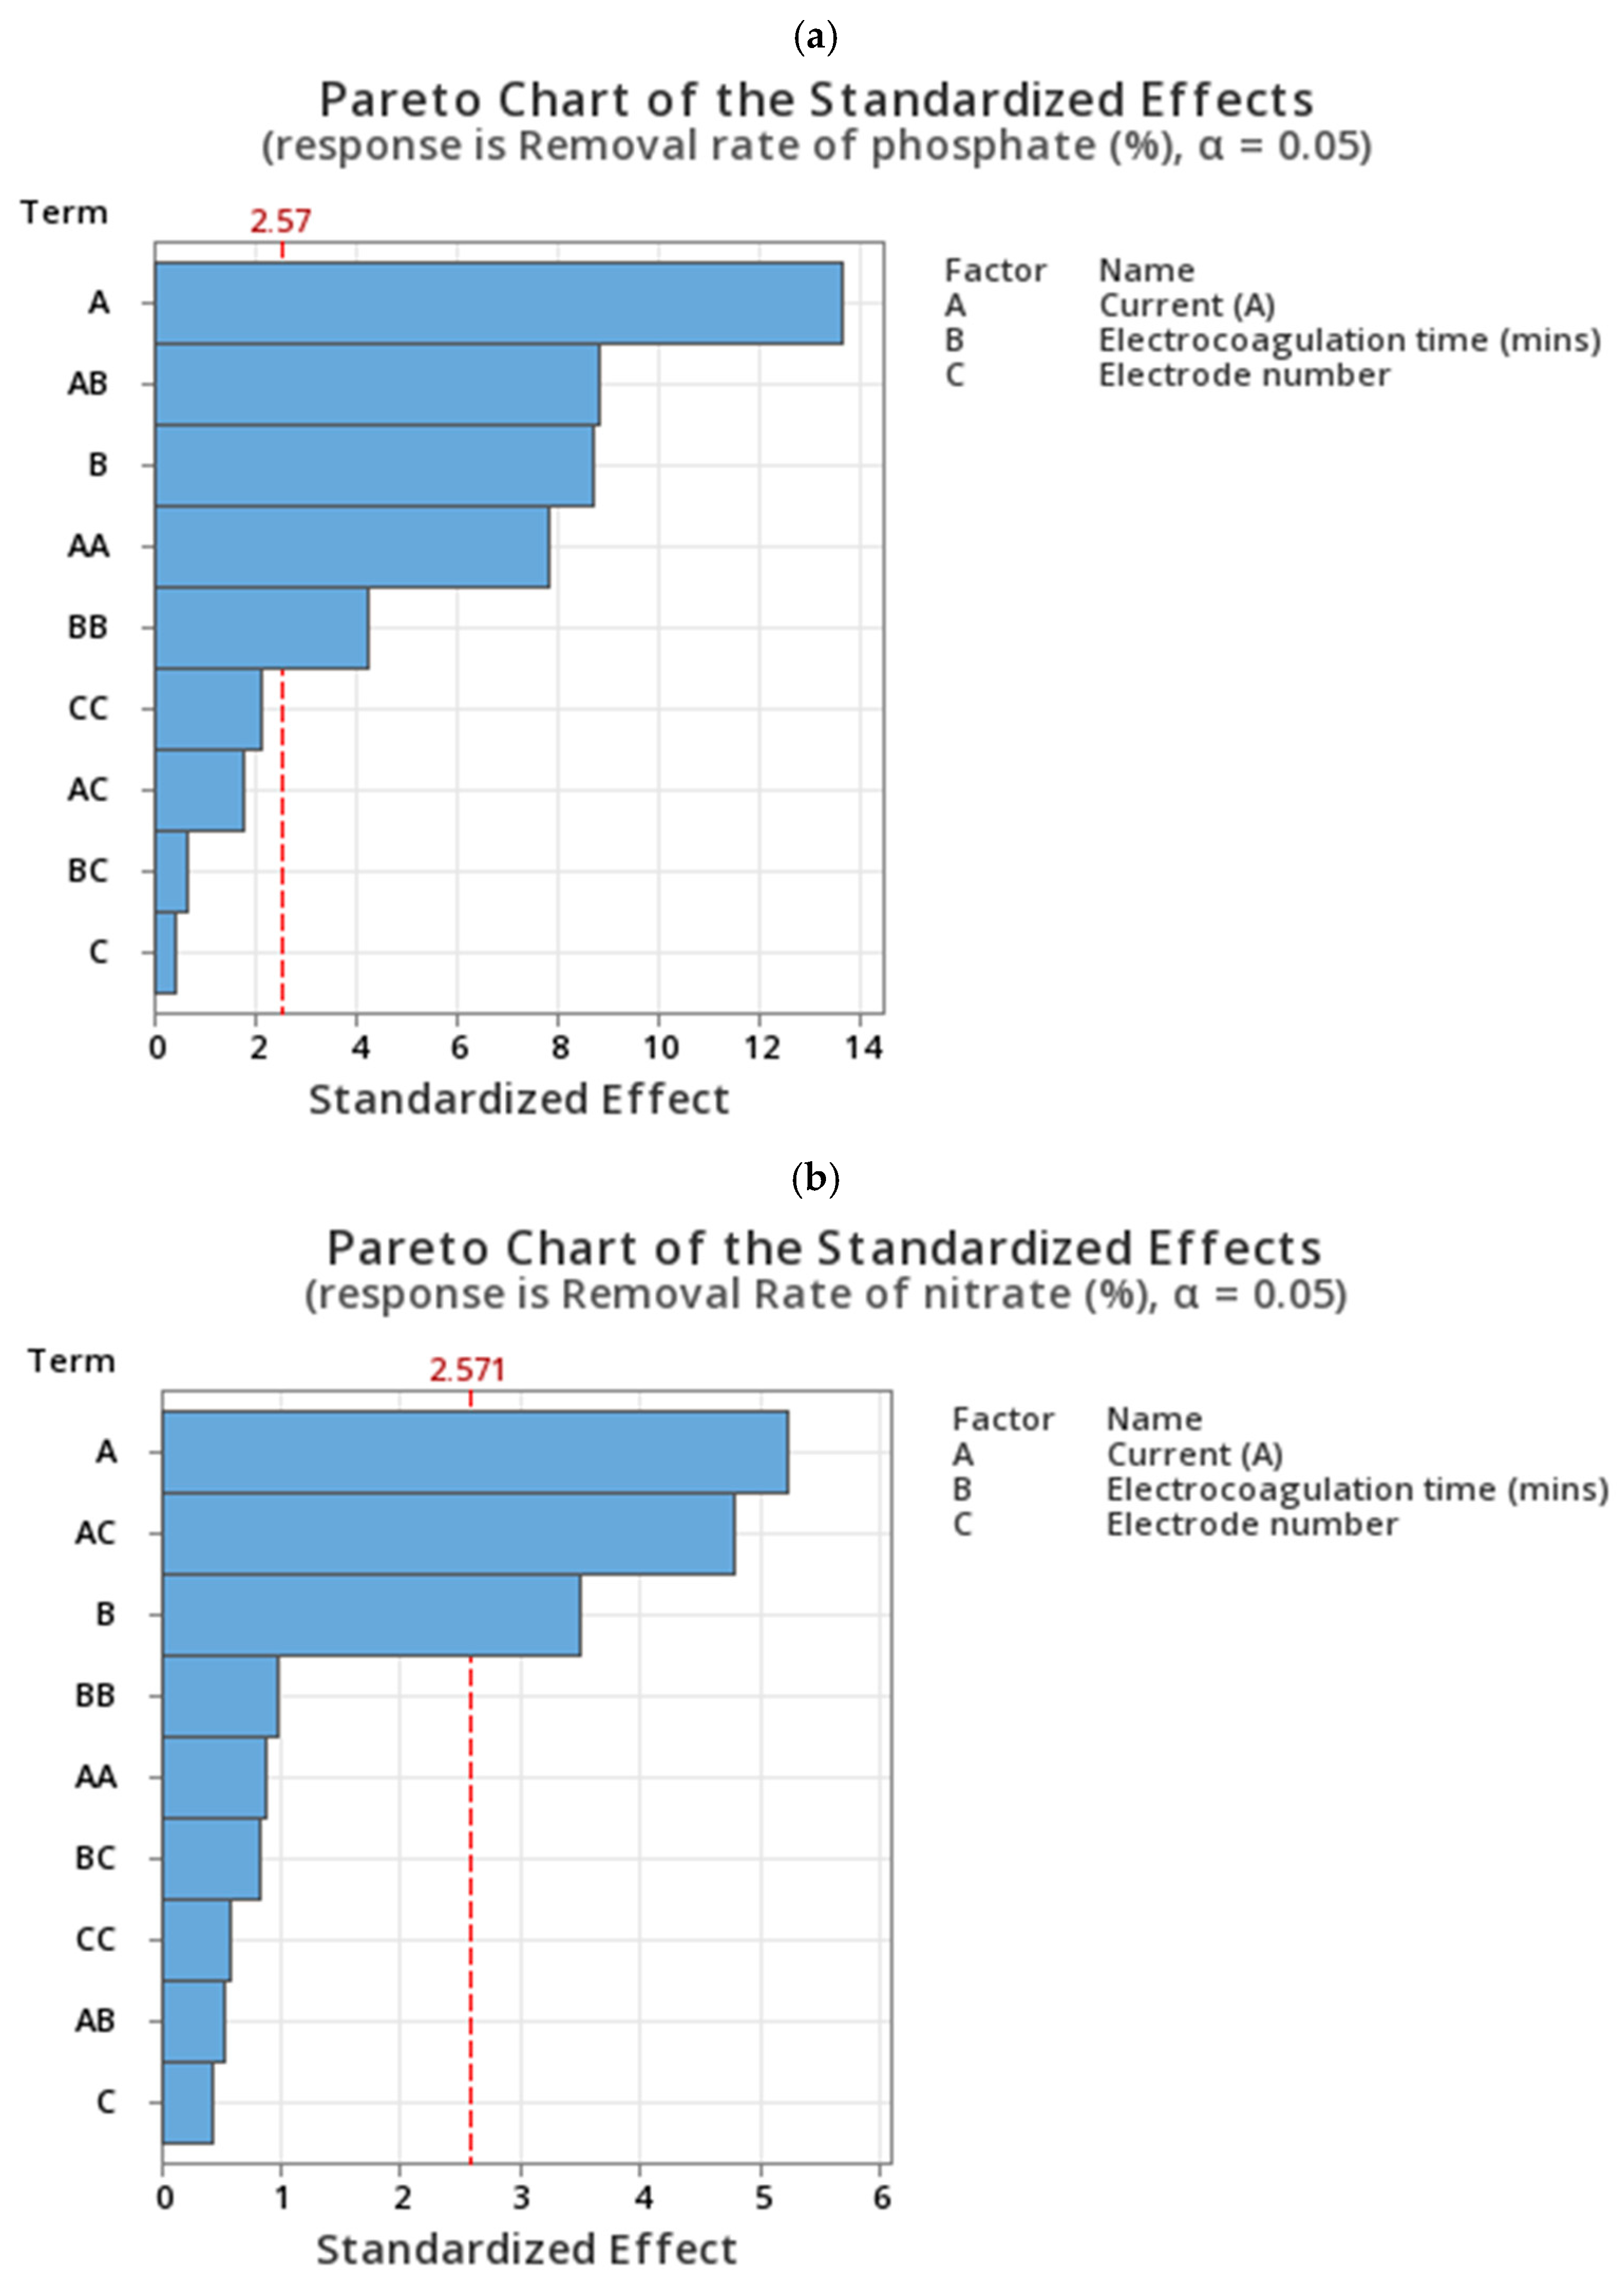
A Pareto chart analysis was employed to evaluate the influence of each variable, including their linear and quadratic interactions, on the removal efficiency, as shown in Figure 3, which presents the Pareto charts for (a) phosphate and (b) nitrate removal. For phosphate removal, the applied current (A) was identified as the most significant factor influencing the process, while electrocoagulation time (B) and their interaction (AB) also demonstrated notable effects. In contrast, the number of electrodes exhibited only a minor influence on phosphate removal efficiency. Similarly, for nitrate removal, current (A) emerged as the dominant factor, exceeding the critical significance level of 2.571. The interaction between current and electrode number (AC), along with electrocoagulation time (B), also contributed to the removal performance, though the individual effect of electrode number remained statistically insignificant.
The RSM was employed to model and optimize nutrient removal performance, and a second-order polynomial regression was developed for both nitrate and phosphate removal, as presented in Equations (5) and (6) for the electrode system. The model incorporates three key factors: current (A), electrocoagulation time (B), and electrode number (C), each contributing to the overall removal efficiency. The regression equations include linear, quadratic, and interaction terms, reflecting the complex interdependencies among these variables. A positive coefficient indicates that increasing the corresponding factor enhances nutrient removal, whereas a negative coefficient suggests a reduction in performance. However, the inclusion of quadratic and interaction terms reveals that these effects are not purely linear. Analysis of the model suggests that an optimal number of electrodes is required to achieve maximum removal efficiency, while current exhibits a moderate negative influence at higher levels due to the quadratic effect, which may reduce efficiency beyond an optimal range. Similarly, electrocoagulation time demonstrates a non-linear behavior, with nutrient removal being most effective at intermediate durations but decreasing at very short or prolonged times. The varying signs and magnitudes of the coefficients across the two nutrient models indicate that each factor influences nitrate and phosphate removal differently. Overall, the model confirms that the factors interact rather than act independently, enabling the generation of response surface plots and the determination of optimal operating conditions for maximum nutrient removal.
NO3 = 64.34 − 6.1(Current) + 0.118(Electrocoagulation time) − 2.46(Electrode number) + 2.6(Current)2 − 0.00017(Electrocoagulation time)2 + 0.027(Electrode number)2 + 0.173(Current × Electrocoagulation time) + 6.79(Current × Electrode number) + 0.0278(Electrocoagulation time × Electrode number)
PO43− = 48.11 + 75.24(Current) + 0.9242(Electrocoagulation time) + 5.12C(Electrode number) − 43.63(Current)2 − 0.00505(Electrocoagulation time)2 − 0.710(Electrode number)2 − 0.6479(Current × Electrocoagulation time) + 2.049(Current × Electrode number) − 0.0121(Electrocoagulation time × Electrode number)

4.1. Phosphate Removal

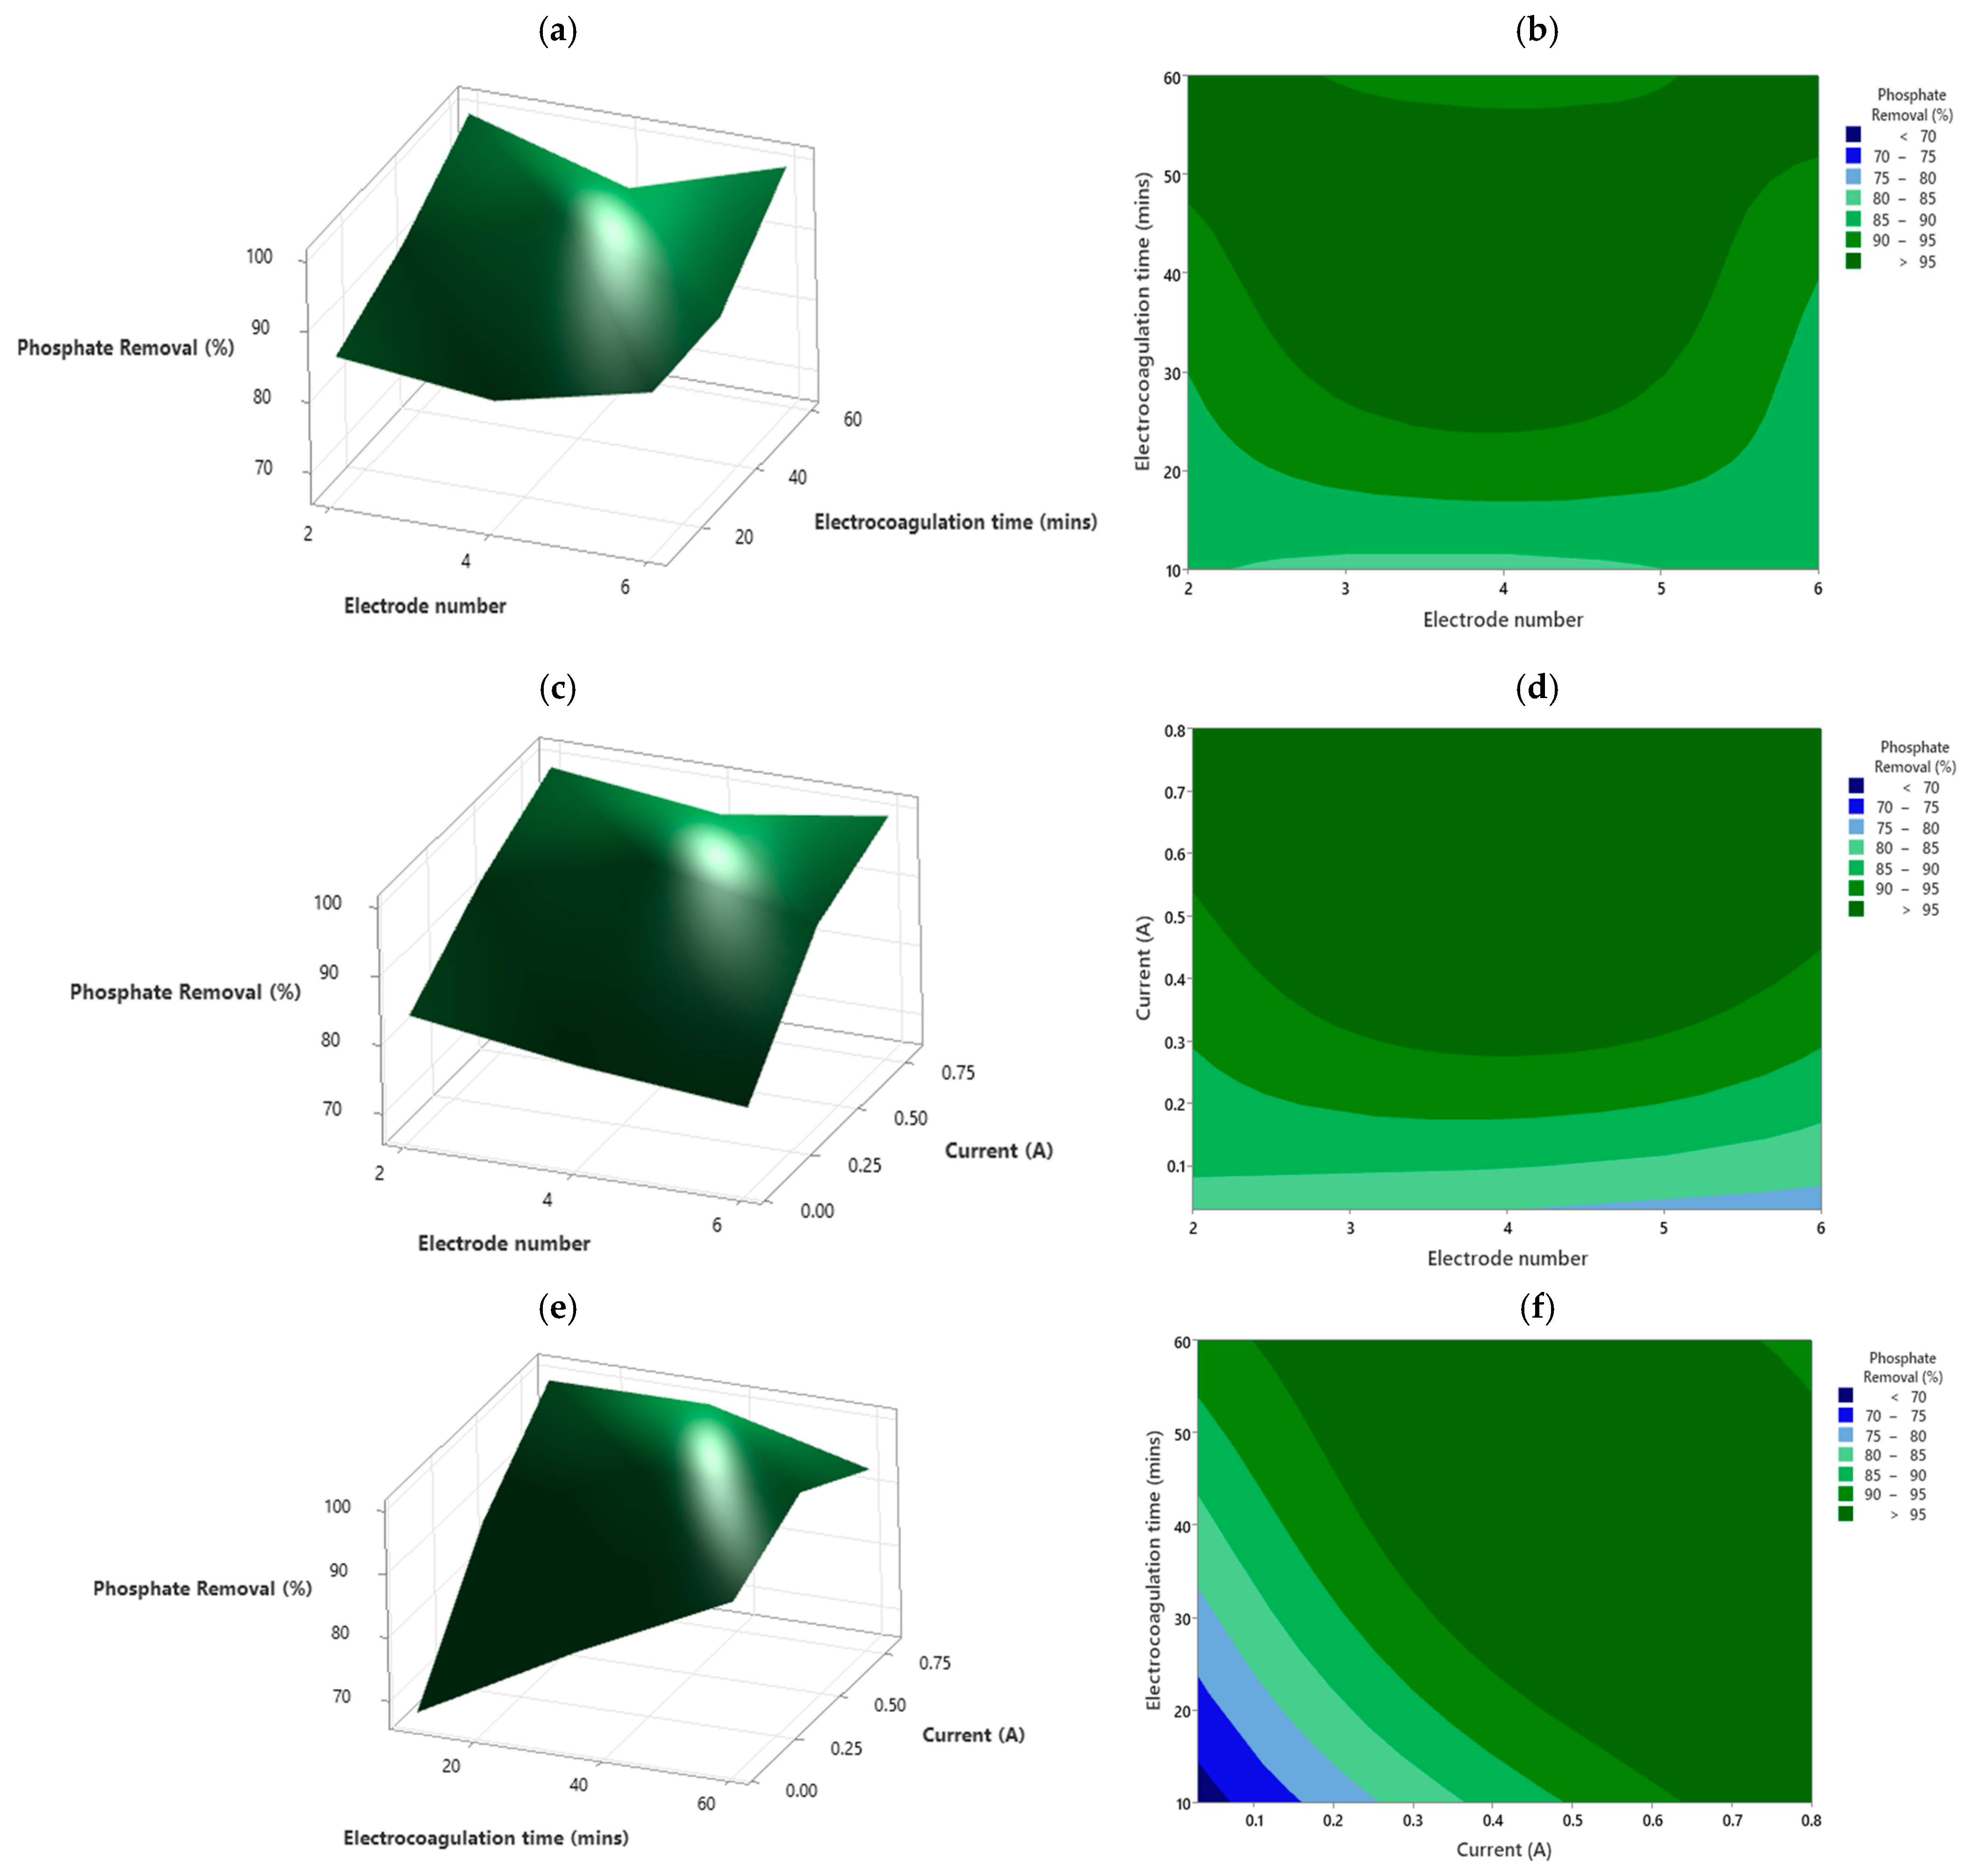
Figure 4 presents the phosphate removal results through three-dimensional (3D) surface plots and corresponding contour plots. Specifically, Figure 4a,c,e show the 3D surface plots, while Figure 4b,d,f display the contour plots illustrating the effects of different parameters on phosphate removal. As shown in Figure 4a, phosphate concentration decreased progressively with increasing reaction time. The initial concentration of 14.8 mg/L in the synthetic hydroponic wastewater was reduced to 3.15 mg/L within 10 min at a current of 0.03 A using the two-electrode configuration. As the EC time increased, the process proceeded more completely, enhancing floc formation and thereby improving phosphate removal efficiency. The final phosphate concentration reached 0.153 mg/L when the electrocoagulation time exceeded 10 min. Figure 4b further demonstrates that phosphate removal efficiency surpassed 90% after 60 min of electrocoagulation. Among the tested configurations, the four-electrode system exhibited higher phosphate removal efficiency compared with the two- and six-electrode setups, confirming its superior performance under the studied conditions.
The four-electrode system exhibited higher phosphate removal efficiency than the six-electrode configuration, likely due to factors such as electrode passivation, reduced mixing, or excessive generation of coagulant species. Similar observations were reported by Tian et al. [41], Chen et al. [42], and Tian et al. [43]. In the study by Tian et al. [41], phosphate concentrations decreased from 1 mg/L to 0 mg/L within 10 min, while Chen et al. [42] reported a reduction from 7 mg/L to 2 mg/L within 60 min. These findings suggest that phosphate is more readily removed from wastewater than other nutrients, as fewer competing side reactions interfere with its removal efficiency. The reduced performance observed in certain configurations can be attributed to the smaller active surface area available for the generation of coagulant species, resulting in lower production of aluminum hydroxide flocs responsible for phosphate precipitation. In contrast, systems with four or six electrodes offer a larger total electrode surface area, thereby increasing the rate of electrochemical dissolution, enhancing hydroxide formation, and promoting more effective destabilization and aggregation of phosphate ions.
As shown in Figure 4c, increasing the applied current significantly enhanced phosphate removal efficiency. When the current exceeded 0.03 A, the phosphate removal rate ranged between 95.4% and 99.3%. At lower current levels, extending the reaction time improved removal to some extent; however, higher current intensities yielded markedly superior performance. The optimal operating conditions for phosphate removal were achieved at a current of 0.415 A using a six-electrode configuration, resulting in a removal efficiency of approximately 99.7%. Figure 4d further illustrates that high phosphate removal efficiencies, exceeding 90%, were obtained across a wide range of current levels and electrode numbers. At lower current ranges (0.1–0.2 A), removal efficiencies remained above 85%, while the lowest value (77.86%) was observed at 0.03 A in the six-electrode system. As the current increased to 0.5 A, phosphate removal exceeded 95% across all electrode configurations (2–6 electrodes). These results confirm that higher current intensities enhance phosphate removal by generating a greater number of aluminum ions, which promote more complete electrocoagulation reactions. The highest removal efficiency, approximately 99.45%, was achieved at a current of 0.415 A using a four-electrode configuration. At elevated currents, the increased generation of gas bubbles further improved coagulation, resulting in complete (100%) phosphate removal.
Numerous studies have investigated phosphate removal from wastewater at varying current densities. Yang et al. [44] reported that increasing the current density led to higher removal rates, achieving complete phosphate removal (100%) at 25 mA/cm2. In that study, a lower current density was sufficient because the initial phosphate concentration was only 1.3 mg/L, which is lower than in the present study. Similarly, studies by Zeng et al. [45], Shirkoohi et al. [46], and Li et al. [47] varied the current density to optimize phosphate removal. These studies consistently demonstrated that higher current densities enhanced phosphate removal efficiency. Among them, Li et al. [47] observed the lowest removal efficiency (79.7%) using a current density of 9 mA/cm2, whereas Zeng et al. [45] and Shirkoohi et al. [46] reported higher removal efficiencies of 90.24% and 95%, respectively.
Figure 4e presents the 3D surface plot illustrating phosphate removal as a function of electrocoagulation time and current. It is evident that increasing the applied current significantly enhances the removal rate over time. At a current of 0.03 A, phosphate removal reached 88.3% as the reaction time increased from 10 to 60 min. However, at currents exceeding 0.03 A, complete phosphate removal was achieved, although reaction time remained an important factor influencing overall efficiency. Specifically, at currents of 0.415 A and 0.8 A, 100% phosphate removal was attained after 60 and 35 min, respectively. These results demonstrate that higher currents reduce the reaction time required to achieve maximum phosphate removal. Figure 4f shows the corresponding contour plot, which further illustrates the combined effects of current and electrocoagulation time on phosphate removal. Complete (100%) removal was observed at currents between 0.415 A and 0.8 A when the electrocoagulation time exceeded 30 min. At lower currents, removal efficiencies of 77.9% and 88.3% were obtained. Regarding reaction time, the phosphate concentration decreased from 14.8 mg/L to 1.215 mg/L within 10 min at a high current of 0.8 A, highlighting the rapid kinetics of the electrocoagulation process under these conditions. Li et al. [47] investigated the effect of electrode spacing on phosphate removal, using distances of 2 and 4 cm. Their results showed that larger electrode spacing enhanced removal efficiency, although prolonged operation reduced effectiveness. After 15 min of reaction time, phosphate removal was 60% and 81% at spacings of 2.5 cm and 1 cm, respectively. Similarly, Jiang et al. [48] and Najari et al. [49] reported increased removal efficiencies at electrode distances of 2 and 3 cm (76% and 92.3%) that subsequently decreased to 62% and 88.1% at 3 and 4 cm, respectively.

4.2. Nitrate Removal

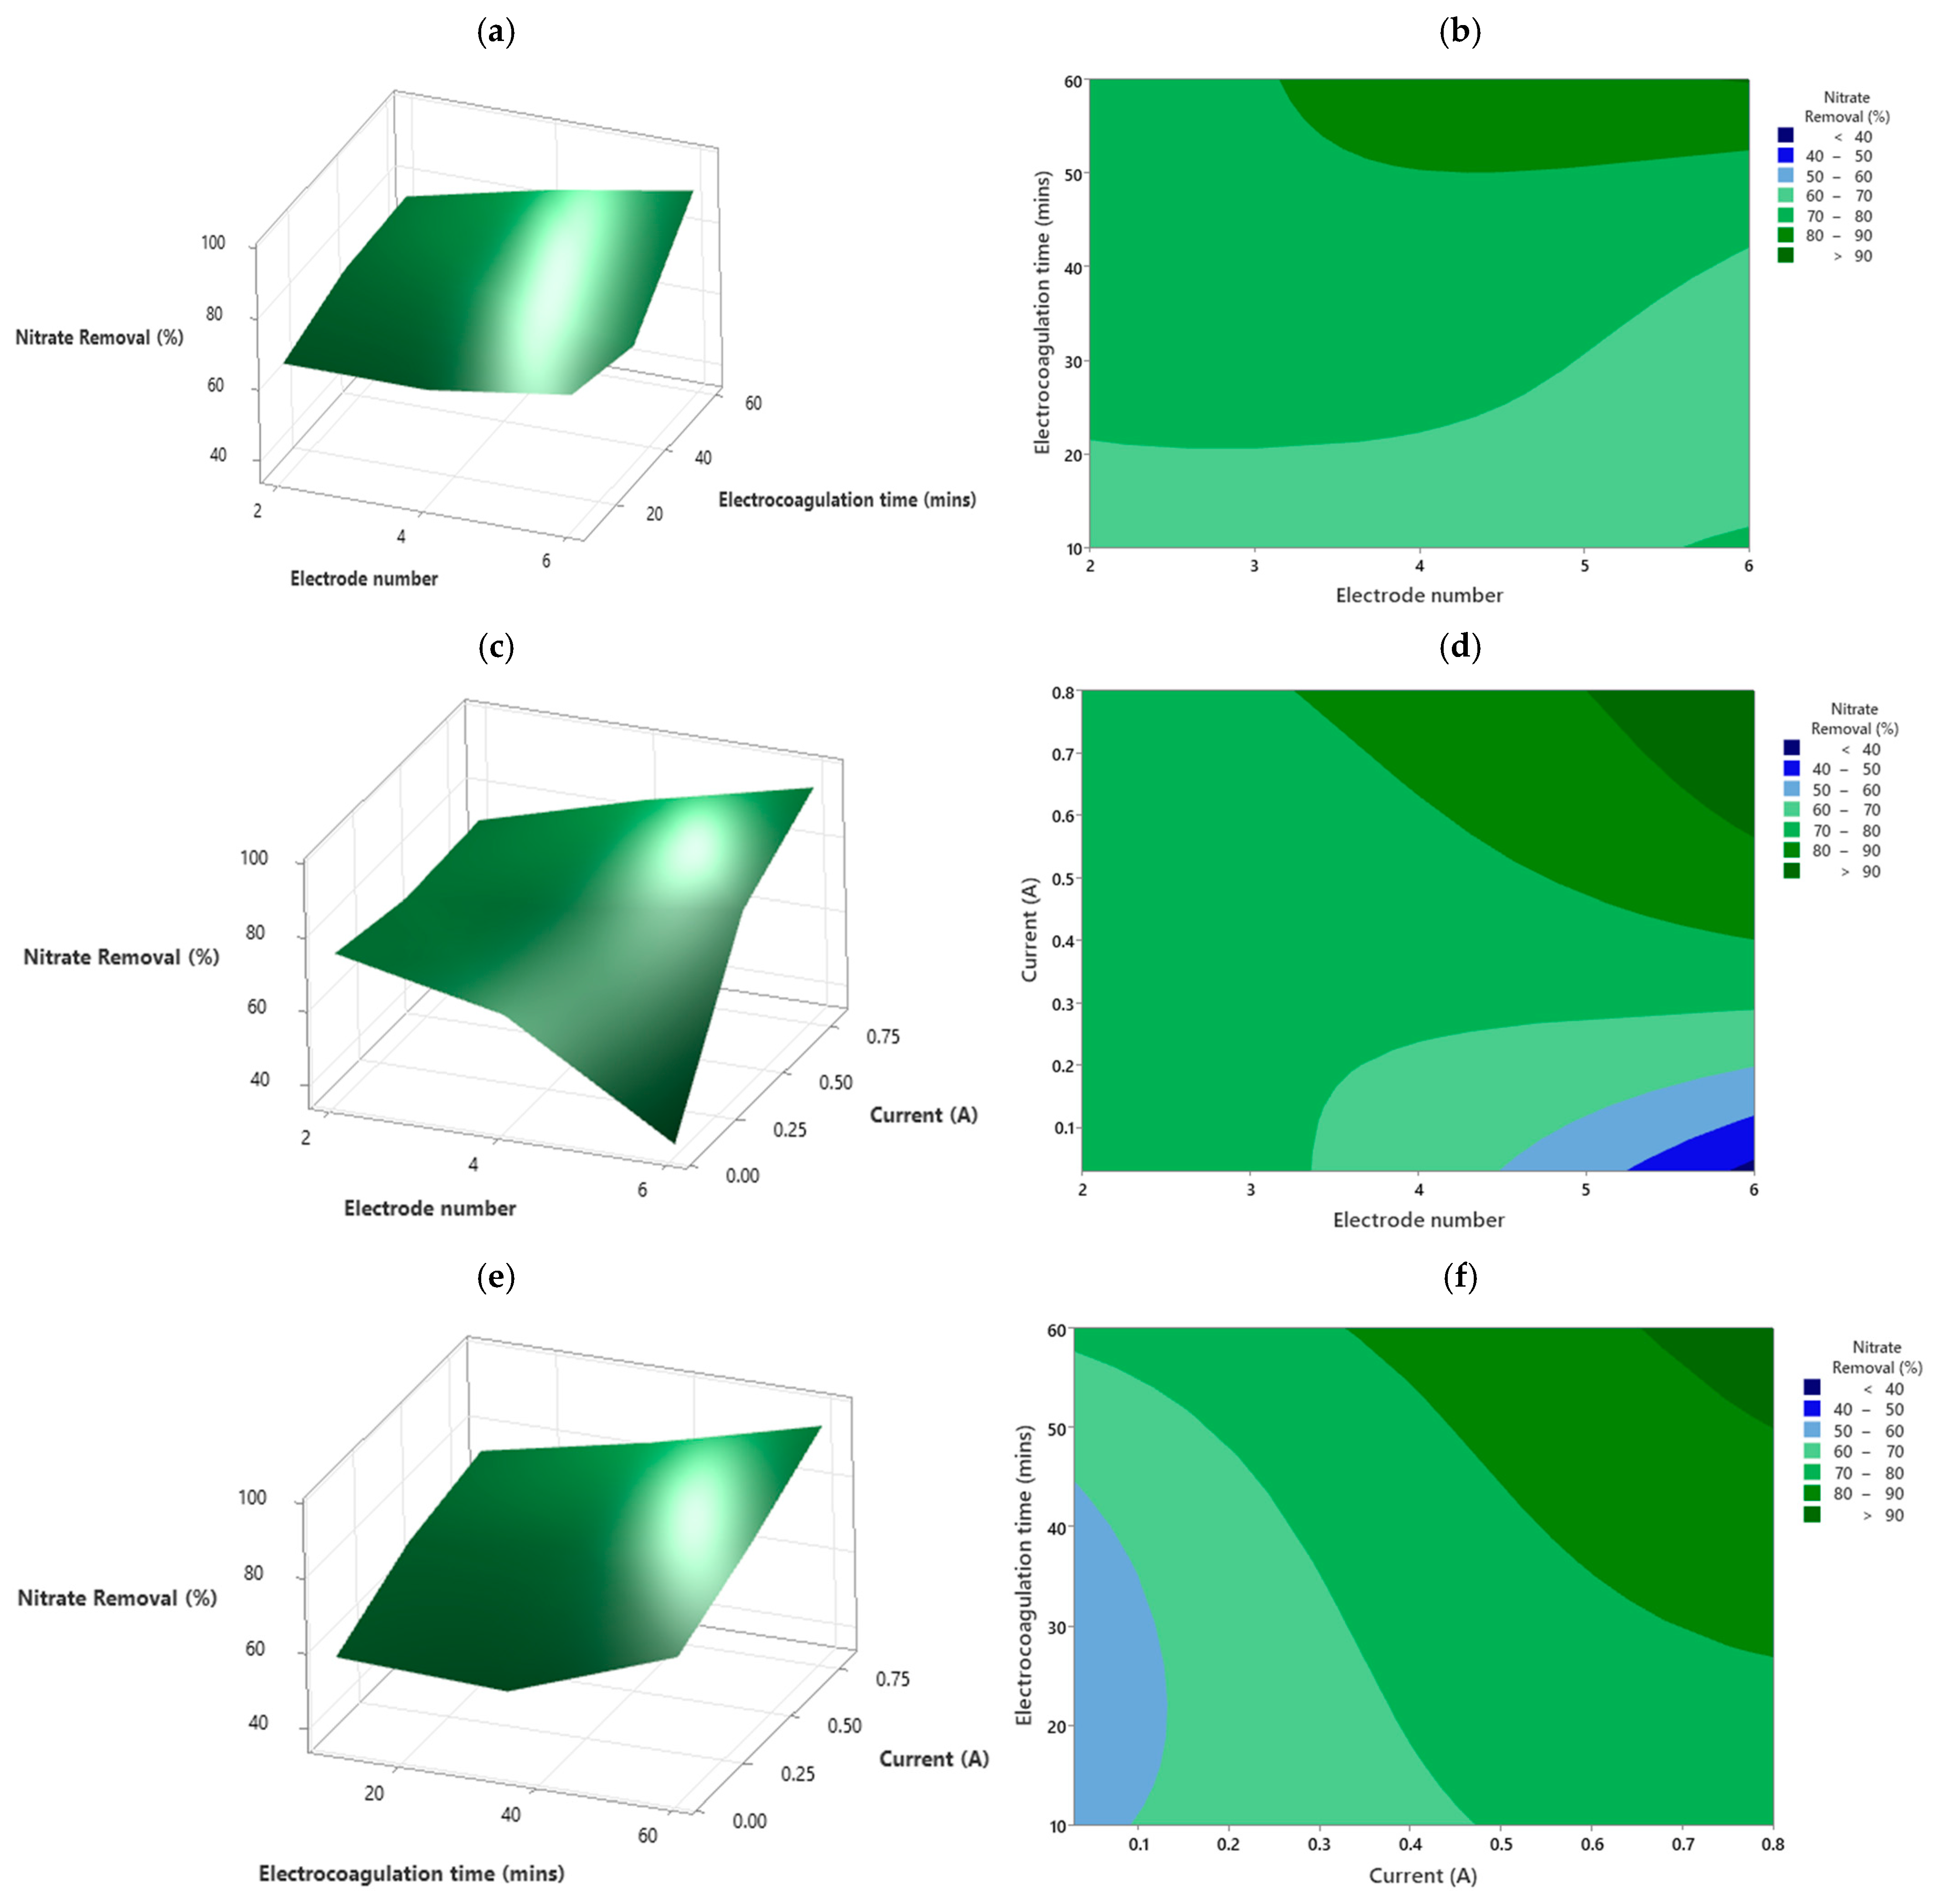
The effects of current, electrocoagulation time, and electrode number on nitrate removal efficiency were systematically investigated. Figure 5 presents these results through both 3D surface and contour plots. Specifically, Figure 5a,c,e display the 3D surface plots illustrating the relationships among current, electrocoagulation time, electrode number, and nitrate removal, while Figure 5b,d,f show the corresponding contour plots. As shown in Figure 5a, increasing both the electrocoagulation time and the number of electrodes generally enhanced nitrate removal efficiency. At a reaction time of 35 min, nitrate removal remained below 80%, even when treatment was extended to 60 min. This trend can be attributed to the longer reaction period allowing more complete electrochemical reactions, greater coagulant generation, and increased interaction between coagulant species and nitrate ions. The optimal condition was achieved using a six-electrode configuration, where a 35 min reaction time resulted in a nitrate removal efficiency of approximately 95%. Figure 5b further indicates that longer electrocoagulation times improved nitrate removal, particularly in systems with four or six electrodes, achieving efficiencies above 95% when the reaction time exceeded 50 min. Systems with fewer electrodes exhibited lower removal efficiencies under similar conditions. These trends are consistent with findings reported in previous studies. Benekos et al. [50], Han et al. [51], and Bhatt et al. [52] reported decreasing nitrate concentrations with increasing electrocoagulation time. Within 60 min, Benekos et al. [50] and Bhatt et al. [52] achieved reductions exceeding 90%, whereas Han et al. [51] required 600 min to reduce nitrate from 22 mg/L to 2.5 mg/L. Conversely, Galvão et al. [53] observed an increase in nitrate concentration from 0 to 21.3 mg/L within 240 min, likely due to side reactions associated with ammonia removal that interfered with nitrate reduction.
Figure 5c illustrates the effect of current and electrode number on nitrate removal efficiency. In the two-electrode system, nitrate removal remained around 70%, with increasing current having minimal impact. A similar trend was observed in the four-electrode configuration, where removal efficiency increased from 72.2% at 0.03 A to 93.4% at 0.8 A. The six-electrode system exhibited the most pronounced improvement, with nitrate removal rising from 37.2% at 0.03 A to an impressive 95% at 0.8 A. As shown in Figure 5d, the applied current plays a critical role in nitrate removal, particularly when considered alongside electrode number. In the two-electrode setup, nitrate removal ranged from 60% to 70% as the current increased from 0.03 to 0.8 A. Increasing the number of electrodes further enhanced removal efficiency, with higher electrode counts exhibiting significantly better performance. At currents above 0.415 A, factors such as gas evolution, scaling, or localized passivation may temporarily reduce the active electrode surface area, lowering removal efficiency. However, further increasing the current to 0.8 A enhanced coagulant generation and mixing, overcoming these limitations and restoring high nitrate removal efficiency. These findings are consistent with trends reported in previous studies. Dan and Luu [54], Galvão et al. [53], and Bouhaous et al. [55] demonstrated that increasing current density generally increases nitrate removal. Galvão et al. [53] reported 95% removal at a current density of 800 mA/cm2, whereas Dan and Luu [54] achieved only 50% removal at 42 mA/cm2 due to the low current density used. Compared to phosphate, nitrate removal generally requires higher current densities because the reaction kinetics are slower and more dependent on both reaction time and electron availability.
The combined effects of current and electrocoagulation time on nitrate removal were evaluated using a 3D surface plot, as shown in Figure 5e. The results demonstrate a nearly linear increase in nitrate removal efficiency with increasing current. As the applied current rose, the removal rate also increased correspondingly. At higher current levels, reaction time had a lesser influence, as current became the dominant factor governing nitrate removal from wastewater, and vice versa at lower currents. The optimal removal efficiency of 97.8% was achieved at a current level of 0.8 A and a reaction time of 60 min using the six-electrode configuration. Figure 5f further illustrates the effect of current (ranging from 0.03 to 0.8 A) and electrocoagulation time (10–60 min) on nitrate removal in the six-electrode system. As the current increased to 0.8 A, nitrate removal reached its highest efficiency. Compared to the four-electrode configuration, the six-electrode system achieved superior performance due to enhanced interaction between generated flocs and nitrate ions, facilitating more effective removal. Overall, the results indicate that nitrate removal requires a longer reaction time because of the chemical stability of nitrate ions and their relatively slow precipitation and reduction mechanisms compared to phosphate.

5. Sludge Characterization

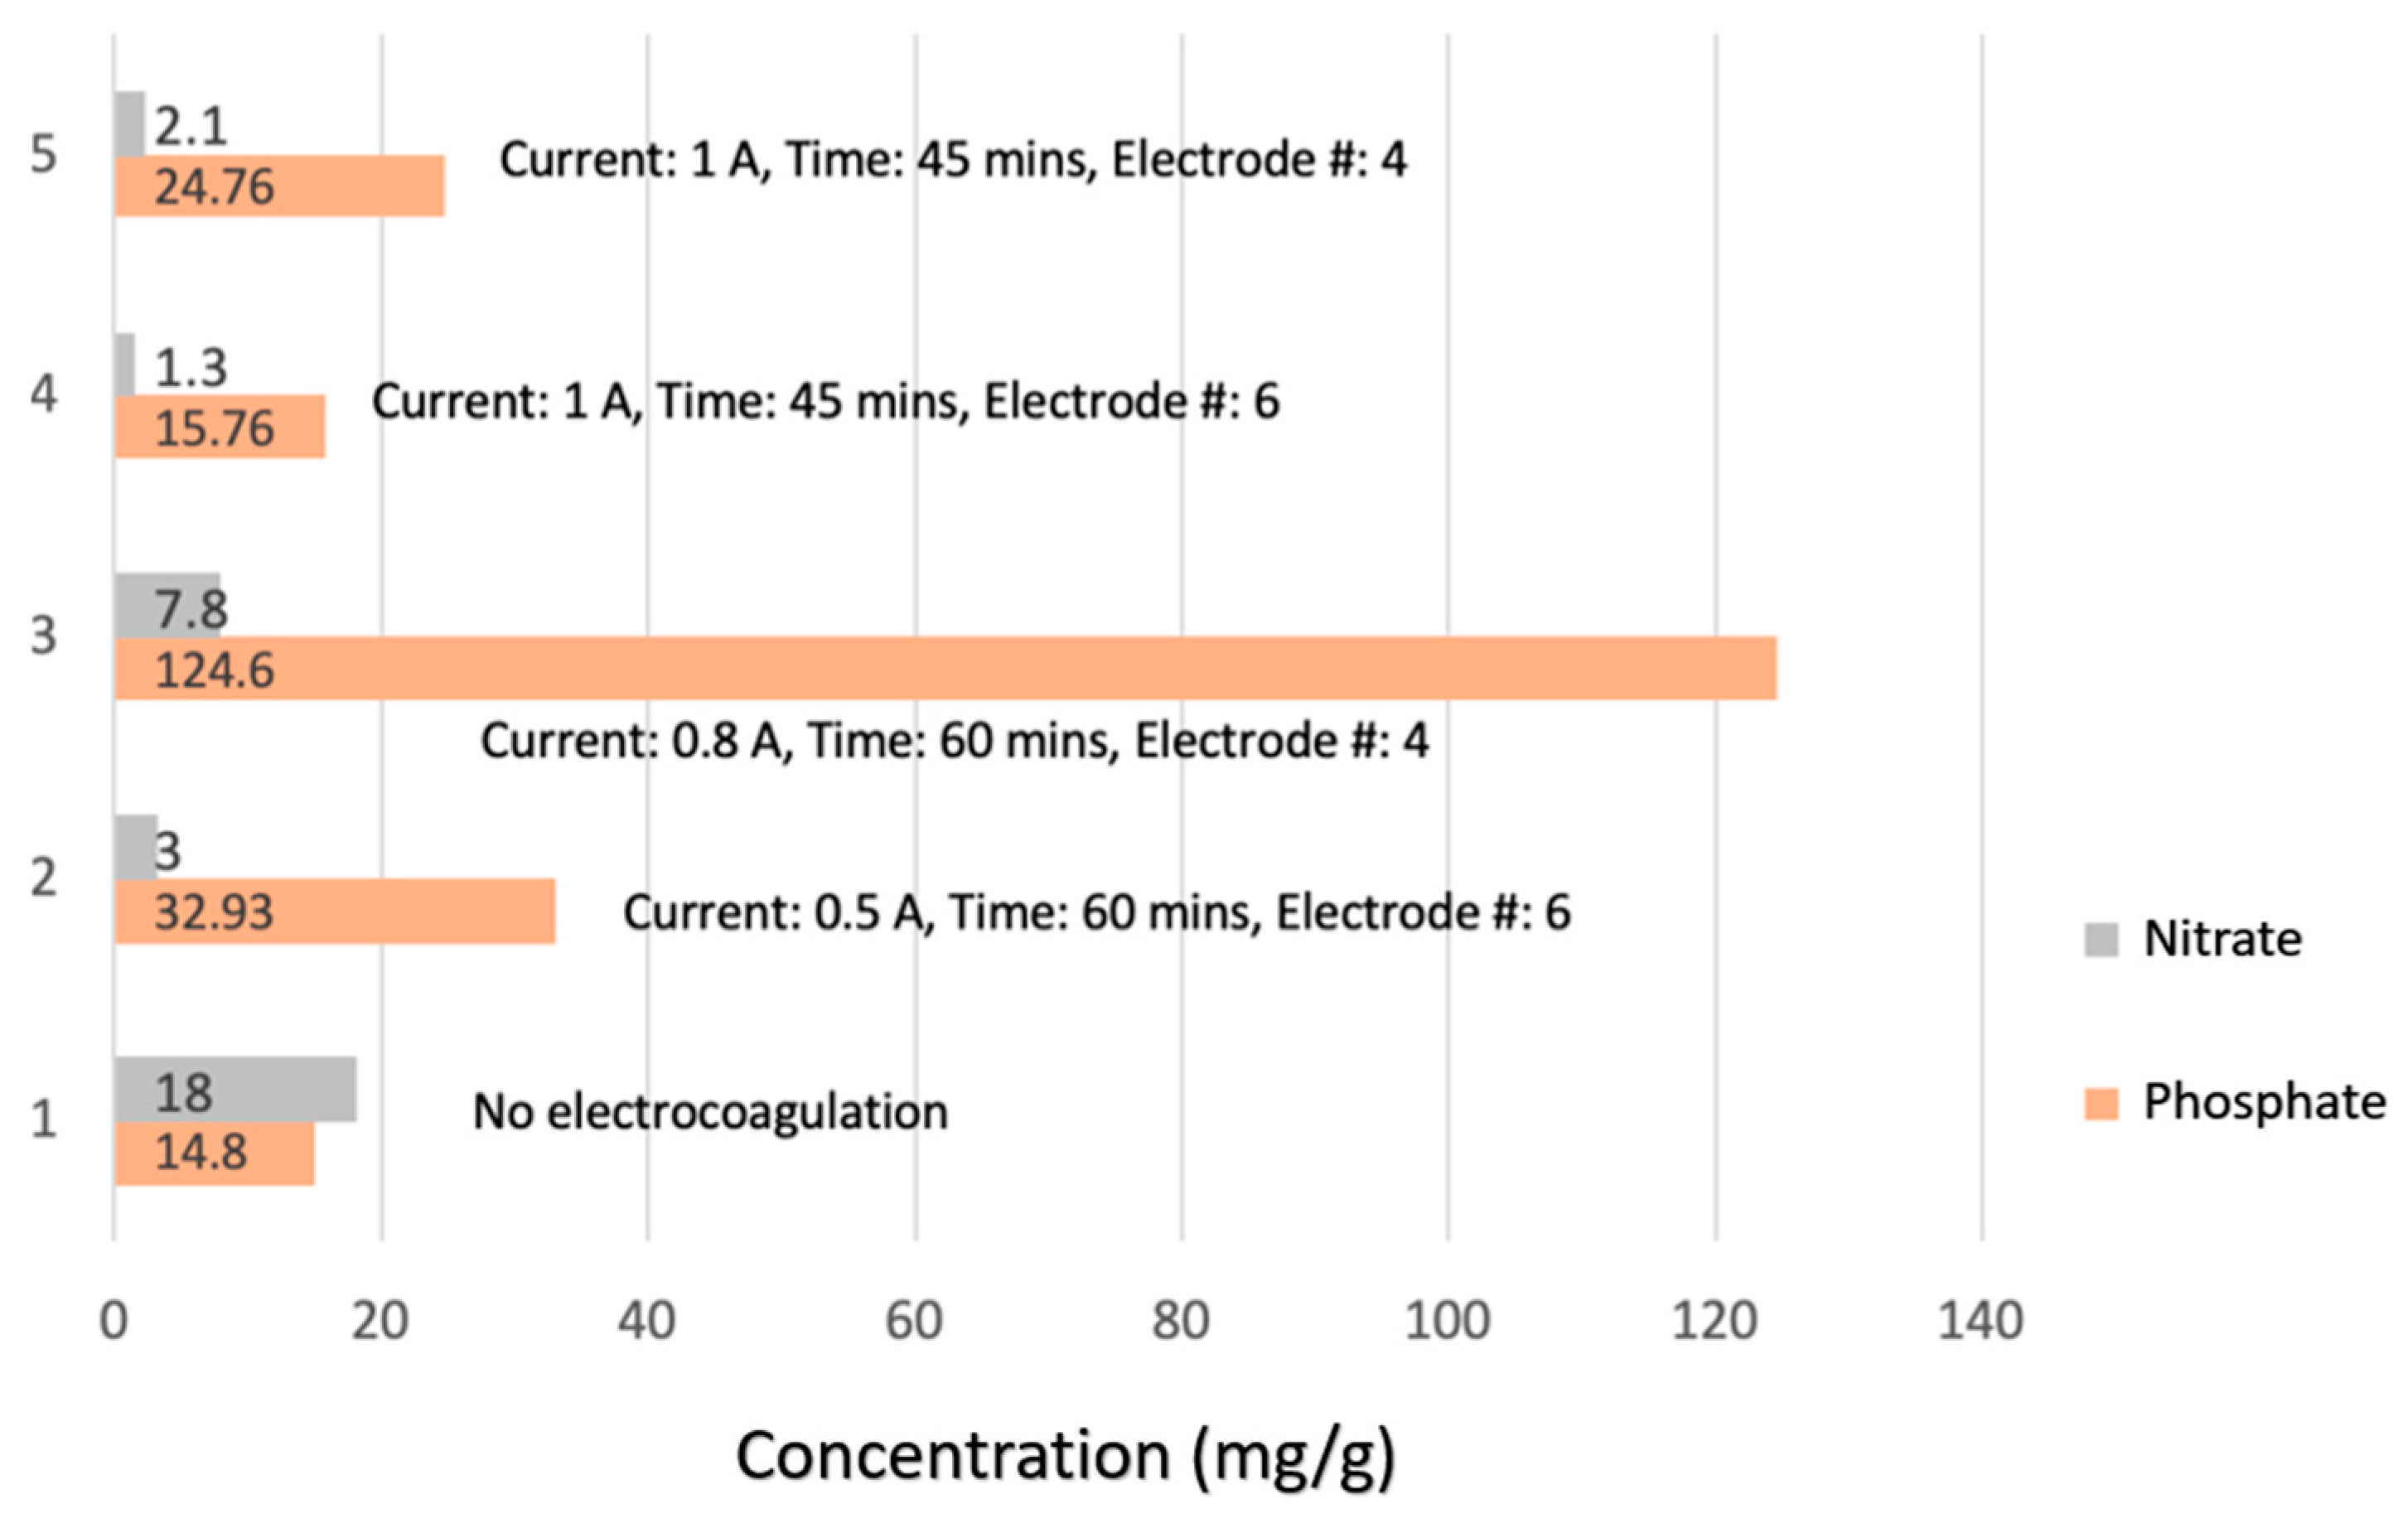
Electrocoagulation (EC) treatment of hydroponic wastewater leads to the formation of sludge, as dissolved contaminants are converted into insoluble particles that subsequently settle out of the solution [56]. The produced sludge can be valorized for recovery some elements and/or nutrients [57,58,59,60,61]. In this study, sludge formation was observed in approximately four hydroponic wastewater samples. At a current of 0.8 A and electrocoagulation times ranging from 30 to 60 min, varying sludge quantities were produced depending on the operating conditions. Figure 6 illustrates the concentrations of phosphate and nitrate accumulated in the sludge following EC treatment. The initial hydroponic solution contained 14.8 mg/L of phosphate and 18 mg/L of nitrate. After treatment, phosphate concentrations in the sludge increased substantially under all tested conditions, while nitrate concentrations varied with operational parameters. At an electrocoagulation time of 60 min, phosphate levels in the sludge ranged from 32.93 to 124.6 mg/g, depending on the applied current and the number of electrodes. This increase in phosphate concentration is attributed to the coagulation process, in which the applied current facilitates the formation of aluminum hydroxide and phosphate precipitates that aggregate into insoluble flocs. These flocs settle as sludge, effectively transferring phosphate from the aqueous phase to the solid phase. Additionally, phosphate ions are adsorbed onto aluminum hydroxide flocs, further enhancing their removal efficiency. The highest phosphate removal was achieved at a current of 0.8 A, an electrocoagulation time of 60 min, and six electrodes, demonstrating the system’s high efficiency in capturing and transferring phosphate from the liquid phase into the sludge.
As previously reported in the literature, the aluminum hydroxide generated during the electrocoagulation process exhibits the distinctive property of forming “sweep flocs” with a large surface area, which effectively promotes the rapid adsorption of soluble phosphorus [62,63]. Moreover, excess aluminum ions (Al3+) can react with phosphate ions to form insoluble aluminum phosphate (AlPO4), which subsequently precipitates within the electrocoagulation unit, as represented by Equation (7) [56,64].
Al3+ + PO43− → AlPO4(s)
Regarding nitrate in the sludge, its concentration was significantly lower than the initial value prior to electrocoagulation. Unlike phosphate, nitrate remains highly soluble in water and does not form solid precipitates with metal ions. Under specific electrocoagulation conditions, nitrate can be converted into various nitrogen species, including nitrite (NO2), ammonia (NH3), nitrogen gas (N2), and nitrogen oxides. Consequently, the reduction in nitrate concentration in the aqueous phase is primarily due to its transformation into these species rather than incorporation into the sludge. Nitrate concentrations in the sludge were observed to be 3, 7.8, 1.3, and 2.1 mg/g at a current of 0.8 A and a reaction time of 30 min. Since nitrate is neither significantly precipitated nor adsorbed, it largely remains dissolved or converted, resulting in lower concentrations in the sludge compared to its initial value.

6. Energy and Electrodes Consumption

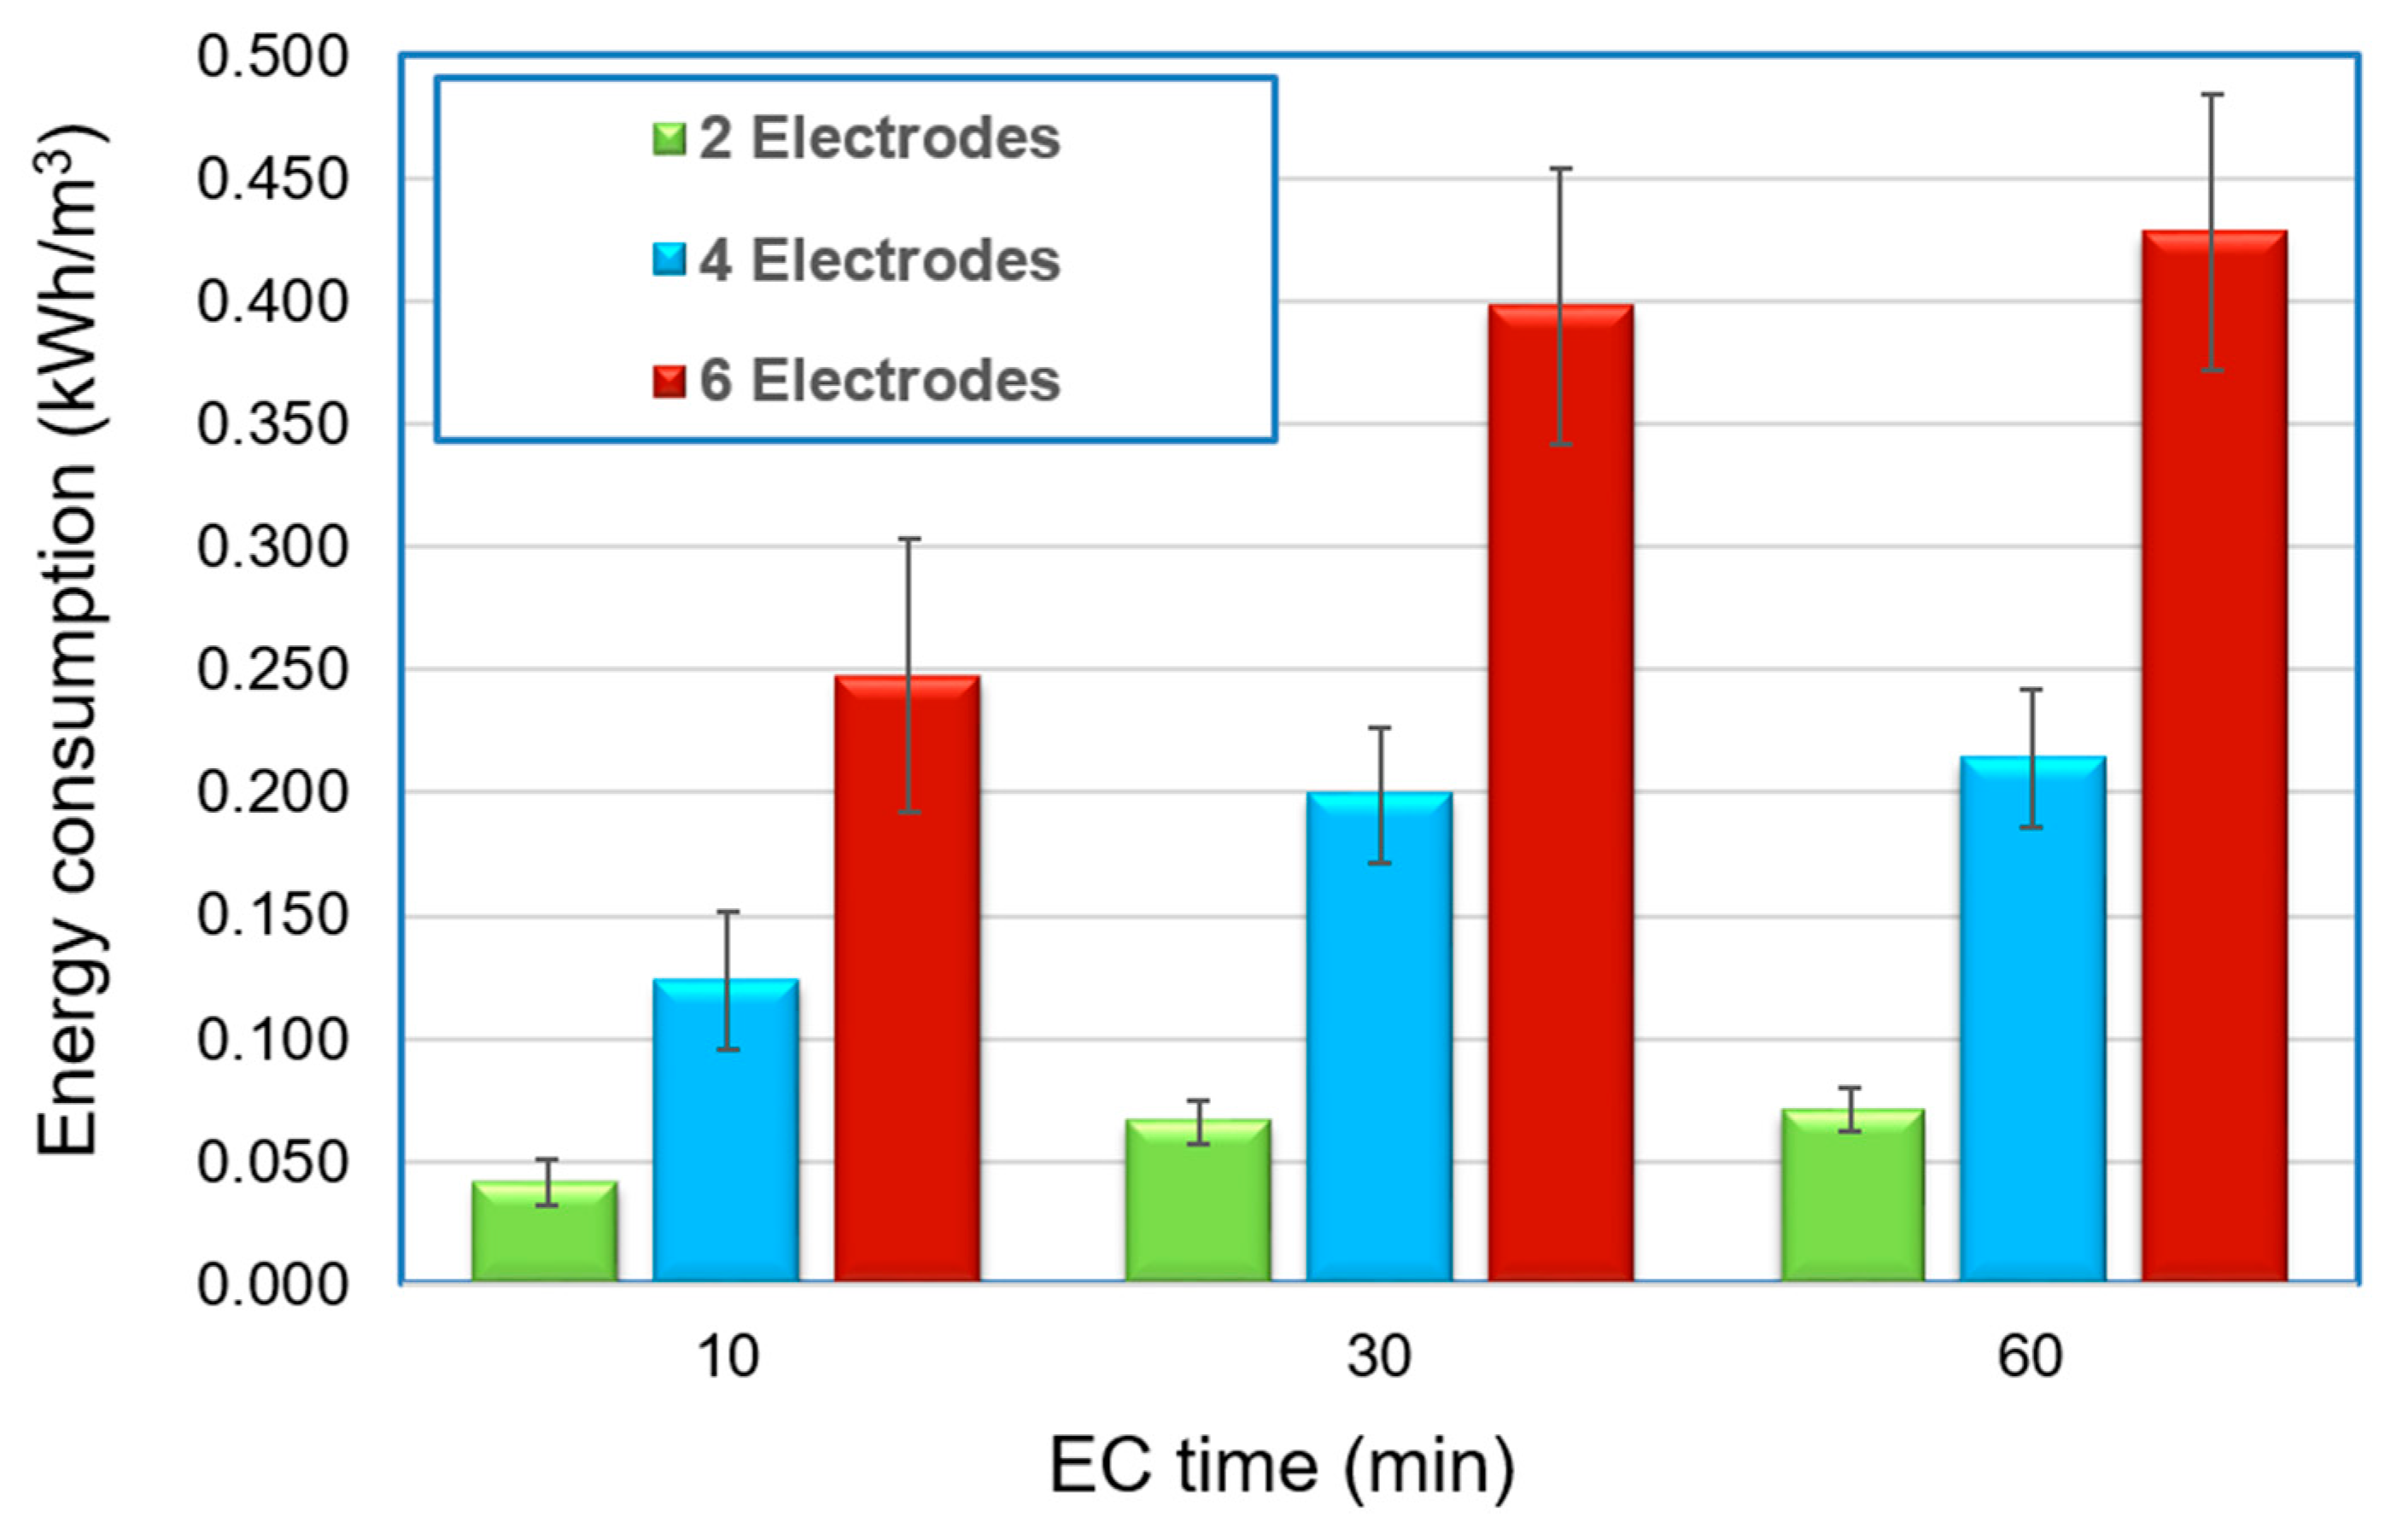
Electrochemical processes are often energy-intensive when applied to wastewater treatment [65]. In electrocoagulation (EC), several operational parameters, such as applied current, reaction time, electrode number, and electrode configuration, strongly influence overall energy consumption [66]. Figure 7 illustrates the relationship between energy consumption and reaction time for various electrode configurations at low applied current (0.03 A). The results indicate that energy consumption increases with longer reaction times and with a higher number of electrodes, reflecting the greater electrical demand associated with extended operation and larger active electrode surface areas.
In the two-electrode system, energy consumption increased from 0.041 to 0.248 kWh/m3 as reaction time extended from 10 to 60 min. For the four-electrode system, energy usage rose from 0.066 to 0.398 kWh/m3 over the same period, while in the six-electrode system, it increased from 0.071 to 0.428 kWh/m3. These results indicate that energy consumption depends not only on reaction time but also on electrode number. Decreasing electrode spacing and arranging electrodes in a parallel configuration allow higher current densities, which further accelerate energy consumption. Therefore, both electrode configuration and the number of electrodes significantly contribute to the overall energy usage in the electrocoagulation system.
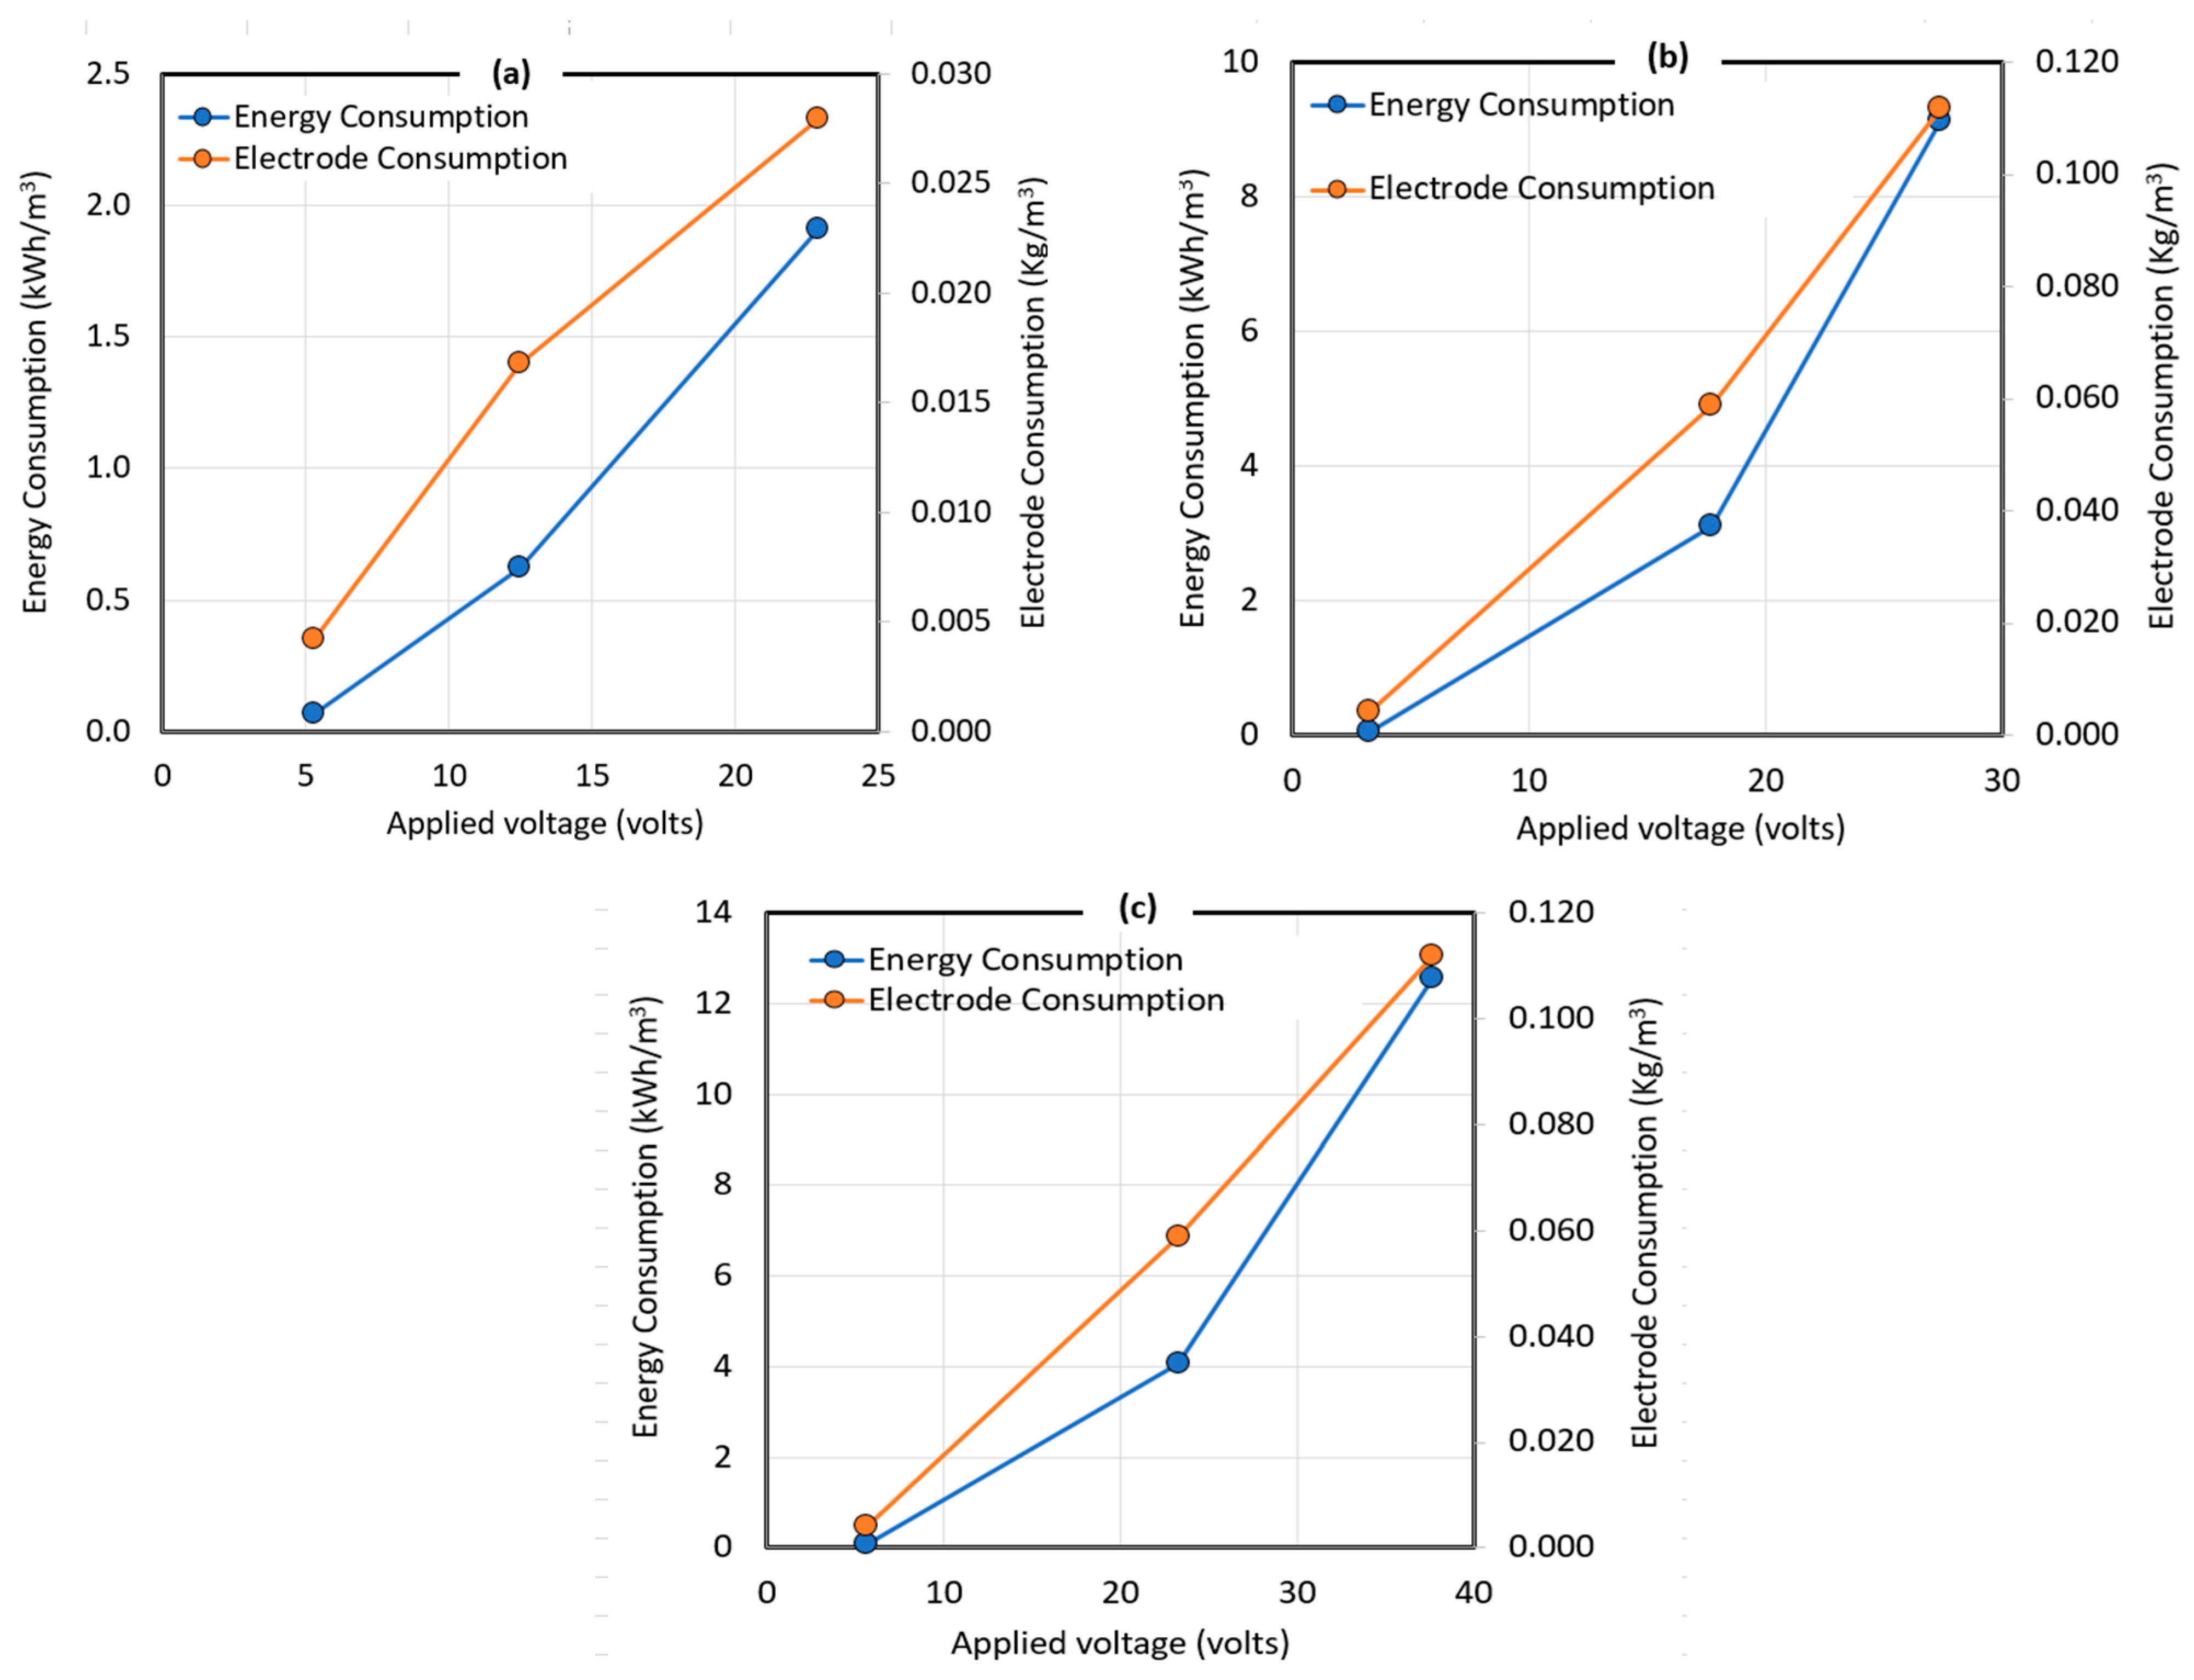
Regarding energy and electrode consumption at high levels of applied voltages and currents, Figure 8 illustrates their variation as a function of applied voltage for electrode configurations of 2, 4, and 6 electrodes. In all three systems, both energy and electrode consumption increased with rising voltage. For the two-electrode configuration, the maximum energy and electrode consumption values were 1.908 kWh/m3 and 0.028 kg/m3, respectively, at an applied voltage of 22.9 V. This behavior can be attributed to the limited current flow resulting from the smaller number of electrodes, which in turn reduces energy demand and minimizes electrode wear. In contrast, the four-electrode configuration (Figure 8b) exhibited moderate energy and electrode consumption, reaching peak values of 9.133 kWh/m3 and 0.112 kg/m3 at 27.4 V. As illustrated in Figure 8c, a pronounced increase in both energy and electrode consumption is observed with rising voltage, reaching peak values of 12.567 kWh/m3 and 0.112 kg/m3 at 37.7 V.
The use of a greater number of electrodes enhances the effective surface area, allowing higher current flow through the system, which consequently leads to increased energy consumption and accelerated electrode wear. Overall, energy and electrode consumption were found to increase proportionally with applied voltage. Elevated voltages generate stronger currents, thereby intensifying power demand and electrode degradation. The number of electrodes also plays a decisive role, following the order: two-electrode < four-electrode < six-electrode configurations. Considering both removal performance and sustainability, the four-electrode configuration operated at a moderate current (~0.415 A) provided the optimal balance between high nutrient removal efficiency (≈99%) and acceptable energy consumption, representing the most energy-efficient and cost-effective operating condition for the EC system.
In comparison with previously reported EC studies for phosphorus removal, the present work demonstrated superior performance in terms of removal efficiency, achieving approximately 99% phosphorus removal under optimized operating conditions. This value exceeds those reported in several studies, such as Tian et al. [67], who achieved 98% removal with Fe electrodes at a lower energy input (0.039 kWh/m3). Although the energy consumption in the current study (ranging from 0.041 to 9.13 kWh/m3 depending on configuration) was higher than in some low-strength wastewater systems, it remains within the typical range observed for intensified EC operations as reported by Svilović et al. [68]. The slightly higher energy demand can be attributed to the higher nutrient loading and the multi-electrode configuration used to maximize treatment efficiency. Overall, the present system achieved a favorable balance between phosphorus removal and operational energy cost, particularly at the four-electrode configuration, which provided both high removal efficiency and acceptable energy consumption compared with previous EC investigations.

7. Conclusions

This study investigated the performance of aluminum-based electrocoagulation (EC) for the simultaneous removal of phosphate and nitrate from synthetic hydroponic wastewater. The effects of applied current, electrocoagulation time, and electrode configuration were systematically evaluated to optimize nutrient removal efficiency and energy consumption using a response surface methodology. Phosphate removal was highly efficient, reaching up to 99.7% under optimal conditions (0.415 A, four-electrode configuration, 35–60 min). The rapid reduction in phosphate concentration was attributed to effective aluminum ion generation, enhanced floc formation, and accelerated precipitation mechanisms. In contrast, nitrate removal proceeded at a slower rate due to its higher chemical stability and weaker precipitation tendency. The maximum nitrate removal of 97.8% was achieved at 0.8 A and 60 min using a six-electrode configuration. Energy consumption analysis revealed that both energy and electrode wear increased proportionally with applied current, voltage, and electrode number. The four-electrode configuration operated at moderate current (≈0.415 A) provided the most favorable balance between high nutrient removal efficiency (≈99%) and acceptable energy consumption, representing the most sustainable and cost-effective operational condition. Overall, the findings demonstrate the potential of electrocoagulation as a reliable and efficient technique for nutrient removal from hydroponic wastewater. Compared to conventional methods, EC offers faster treatment and higher removal efficiencies under optimized conditions. However, excessive current or electrode numbers can increase energy demand and electrode wear, emphasizing the importance of operational optimization. Future research should focus on evaluating system scalability, long-term electrode stability, and the treatment of real hydroponic or agricultural effluents to validate field applicability and economic feasibility.

Author Contributions

Conceptualization, Y.S., K.B.-M. and F.A.; methodology, Y.S.; software, Y.S. and M.B.-A.; validation, Y.S. and M.B.-A.; formal analysis, Y.S. and M.B.-A.; investigation, Y.S., M.B.-A., K.B.-M. and F.A.; resources, K.B.-M., A.A.-M. and F.A.; data curation, Y.S.; writing—original draft preparation, Y.S.; writing—review and editing, M.B.-A., K.B.-M., A.A.-M. and F.A.; visualization, Y.S.; supervision, K.B.-M. and F.A.; project administration, K.B.-M. and F.A.; funding acquisition, K.B.-M. and F.A. All authors have read and agreed to the published version of the manuscript.

Funding

This research was supported by Qatar University (Grant No. IRCC-2025-777).

Data Availability Statement

The raw data supporting the conclusions of this article will be made available by the authors on request.

Acknowledgments

The authors are indebted to the team of the Central Lab Unit (CLU) at Qatar University for their assistance with the required analyses. This work was made possible by the support of the institutional collaboration between Qatar University and Sultan Qaboos University (IRCC-2025-777). The findings achieved herein are solely the responsibility of the authors.

Conflicts of Interest

The authors declare no conflicts of interest.

Abbreviations

The following abbreviations are used in this manuscript:
AlAluminum
BBDBox–Behnken design
CODChemical oxygen demand
DIDeionized water
ECElectrocoagulation
FFaraday’s constant (96,485 C/mol)
HWSHydroponic wastewater solution
IApplied current
MMolar mass of aluminum
RSMResponse Surface Methodology
R2R-squared
R2 adjR-squared adjusted
tElectrocoagulation time
VVolume of the treated solution
vApplied voltage
zNumber of electrons

References

  1. Rajendran, S.; Domalachenpa, T.; Arora, H.; Li, P.; Sharma, A.; Rajauria, G. Hydroponics: Exploring Innovative Sustainable Technologies and Applications across Crop Production, with Emphasis on Potato Mini-Tuber Cultivation. Heliyon 2024, 10, e26823. [Google Scholar] [CrossRef]
  2. Chatterjee, A.; Ghosh, P.; Winkler, B.; V, V.; Debnath, S.; Cichocki, J.; Trenkner, M.; Vanicela, B.; Riethmueller, C.; Walz, M.; et al. Demystifying the Integration of Hydroponics Cultivation System Reinforcing Bioeconomy and Sustainable Agricultural Growth. Sci. Hortic. 2025, 341, 113973. [Google Scholar] [CrossRef]
  3. Naresh, R.; Jadav, S.K.; Singh, M.; Patel, A.; Singh, B.; Beese, S.; Pandey, S.K. Role of Hydroponics in Improving Water-Use Efficiency and Food Security. IJECC 2024, 14, 608–633. [Google Scholar] [CrossRef]
  4. Santos, O.; Vaz, D.; Sebastião, F.; Sousa, H.; Vieira, J. Wastewater as a Nutrient Source for Hydroponic Production of Lettuce: Summer and Winter Growth. Agric. Water Manag. 2024, 301, 108966. [Google Scholar] [CrossRef]
  5. Mai, C.; Mojiri, A.; Palanisami, S.; Altaee, A.; Huang, Y.; Zhou, J.L. Wastewater Hydroponics for Pollutant Removal and Food Production: Principles, Progress and Future Outlook. Water 2023, 15, 2614. [Google Scholar] [CrossRef]
  6. Hofmann, A.H.; Liesegang, S.L.; Keuter, V.; Eticha, D.; Steinmetz, H.; Katayama, V.T. Nutrient Recovery from Wastewater for Hydroponic Systems: A Comparative Analysis of Fertilizer Demand, Recovery Products, and Supply Potential of WWTPs. J. Environ. Manag. 2024, 352, 119960. [Google Scholar] [CrossRef] [PubMed]
  7. Al-Bsoul, A.; Al-Qodah, Z.; Tawalbeh, M.; Bani-Melhem, K.; Al Bkoor Alrawashdeh, K.; Hailat, M.; Al-Taani, A.A.; Gul, E. From Waste to Solution: Modeling and Characterization of Grape Seed Bio-Waste for Phosphate Removal from Wastewater. Processes 2025, 13, 2464. [Google Scholar] [CrossRef]
  8. Richa, A.; Touil, S.; Fizir, M.; Martinez, V. Recent Advances and Perspectives in the Treatment of Hydroponic Wastewater: A Review. Rev. Env. Sci. Biotechnol. 2020, 19, 945–966. [Google Scholar] [CrossRef]
  9. Grewal, H.S.; Maheshwari, B.; Parks, S.E. Water and Nutrient Use Efficiency of a Low-Cost Hydroponic Greenhouse for a Cucumber Crop: An Australian Case Study. Agric. Water Manag. 2011, 98, 841–846. [Google Scholar] [CrossRef]
  10. Rufí-Salís, M.; Petit-Boix, A.; Villalba, G.; Sanjuan-Delmás, D.; Parada, F.; Ercilla-Montserrat, M.; Arcas-Pilz, V.; Muñoz-Liesa, J.; Rieradevall, J.; Gabarrell, X. Recirculating Water and Nutrients in Urban Agriculture: An Opportunity towards Environmental Sustainability and Water Use Efficiency? J. Clean. Prod. 2020, 261, 121213. [Google Scholar] [CrossRef]
  11. Seo, D.-C.; Park, J.-H.; Cheon, Y.-S.; Park, S.-K.; Kim, A.-R.; Lee, W.-G.; Lee, S.-W.; Lee, S.-T.; Cho, J.-S.; Heo, J.-S. Treatment Efficiency of Pollutants in Constructed Wetlands under Different Hydroponic Wastewater Injection Methods and Characteristic of Filter Media. Korean J. Environ. Agric. 2010, 29, 146–151. [Google Scholar] [CrossRef]
  12. Gagnon, V.; Maltais-Landry, G.; Puigagut, J.; Chazarenc, F.; Brisson, J. Treatment of Hydroponics Wastewater Using Constructed Wetlands in Winter Conditions. Water Air Soil Pollut. 2010, 212, 483–490. [Google Scholar] [CrossRef]
  13. Park, W.-Y.; Seo, D.-C.; Lim, J.-S.; Park, S.-K.; Cho, J.-S.; Heo, J.-S.; Yoon, H.-S. Optimum Configuration, Filter Media Depth and Wastewater Load of Small-Scale Constructed Wetlands for Treating the Hydroponic Waste Solution in Greenhouses. Korean J. Environ. Agric. 2008, 27, 217–224. [Google Scholar] [CrossRef]
  14. Park, J.B.K.; Craggs, R.J.; Sukias, J.P.S. Treatment of Hydroponic Wastewater by Denitrification Filters Using Plant Prunings as the Organic Carbon Source. Bioresour. Technol. 2008, 99, 2711–2716. [Google Scholar] [CrossRef]
  15. Castellar, J.A.C.; Formosa, J.; Fernández, A.I.; Jové, P.; Bosch, M.G.; Morató, J.; Brix, H.; Arias, C.A. Cork as a Sustainable Carbon Source for Nature-Based Solutions Treating Hydroponic Wastewaters—Preliminary Batch Studies. Sci. Total Environ. 2019, 650, 267–276. [Google Scholar] [CrossRef] [PubMed]
  16. Rodziewicz, J.; Mielcarek, A.; Janczukowicz, W.; Jóźwiak, T.; Struk—Sokołowska, J.; Bryszewski, K. The Share of Electrochemical Reduction, Hydrogenotrophic and Heterotrophic Denitrification in Nitrogen Removal in Rotating Electrobiological Contactor (REBC) Treating Wastewater from Soilless Cultivation Systems. Sci. Total Environ. 2019, 683, 21–28. [Google Scholar] [CrossRef] [PubMed]
  17. Hultberg, M.; Carlsson, A.S.; Gustafsson, S. Treatment of Drainage Solution from Hydroponic Greenhouse Production with Microalgae. Bioresour. Technol. 2013, 136, 401–406. [Google Scholar] [CrossRef]
  18. Saxena, P.; Bassi, A. Removal of Nutrients from Hydroponic Greenhouse Effluent by Alkali Precipitation and Algae Cultivation Method. J. Chem. Tech. Biotech. 2013, 88, 858–863. [Google Scholar] [CrossRef]
  19. Bakry, S.A.; Matta, M.E.; Noureldin, A.M.; Zaher, K. Performance Evaluation of Electrocoagulation Process for Removal of Heavy Metals from Wastewater Using Aluminum Electrodes under Variable Operating Conditions. Desalination Water Treat. 2024, 318, 100396. [Google Scholar] [CrossRef]
  20. Atallah, C.; Mosadeghsedghi, S.; Dashtban Kenari, S.L.; Hudder, M.; Morin, L.; Volchek, K.; Mortazavi, S.; Ben Salah, I. Removal of Heavy Metals from Mine Water Using a Hybrid Electrocoagulation-Ceramic Membrane Filtration Process. Desalination Water Treat. 2024, 320, 100730. [Google Scholar] [CrossRef]
  21. Garomsa, F.S.; Mehari, Y.; Desta, W.M.; Bidira, F.; Asaithambi, P. Removal of NO3-, PO3-, and Color from Brewery Wastewater by the Use of Indigenous Bio-Coagulant-Assisted Electrocoagulation. Prog. Eng. Sci. 2024, 1, 100032. [Google Scholar] [CrossRef]
  22. García-Colindres, M.A.; Requena-Alvarez, B.L.; Castillo-Suárez, L.A.; Linares-Hernández, I.; Martínez-Miranda, V. Removal of Nitrates in Drinking Water Polluted with Landfill Leachate by an Electrocoagulation System with Mg-Zn. Water Air Soil Pollut. 2024, 235, 269. [Google Scholar] [CrossRef]
  23. Gasmi, A.; Elboughdiri, N.; Ghernaout, D.; Hannachi, A.; Halim, K.S.A.; Khan, M.I. Electrocoagulation Process for Removing Dyes and Chemical Oxygen Demand from Wastewater: Operational Conditions and Economic Assessment—A Review. Desalination Water Treat. 2022, 271, 74–107. [Google Scholar] [CrossRef]
  24. Hasnaoui, A.; Chikhi, M.; Balaska, F.; Seraghni, W.; Boussemghoune, M.; Dizge, N. Electrocoagulation Employing Recycled Aluminum Electrodes for Methylene Blue Remediation. Desalination Water Treat. 2024, 319, 100453. [Google Scholar] [CrossRef]
  25. Shen, M.; Zhang, Y.; Almatrafi, E.; Hu, T.; Zhou, C.; Song, B.; Zeng, Z.; Zeng, G. Efficient Removal of Microplastics from Wastewater by an Electrocoagulation Process. Chem. Eng. J. 2022, 428, 131161. [Google Scholar] [CrossRef]
  26. Elkhatib, D.; Oyanedel-Craver, V.; Carissimi, E. Electrocoagulation Applied for the Removal of Microplastics from Wastewater Treatment Facilities. Sep. Purif. Technol. 2021, 276, 118877. [Google Scholar] [CrossRef]
  27. Al-Kilani, M.R.; Bani-Melhem, K. The Performance of Electrocoagulation Process for Decolorization and COD Removal of Highly Colored Real Grey Water under Variable Operating Conditions. Desalination Water Treat. 2025, 321, 100924. [Google Scholar] [CrossRef]
  28. Bani-Melhem, K.; Alnaief, M.; Al-Qodah, Z.; Al-Shannag, M.; Elnakar, H.; AlJbour, N.; Alu’datt, M.; Alrosan, M.; Ezelden, E. On the Performance of Electrocoagulation Treatment of High-Loaded Gray Water: Kinetic Modeling and Parameters Optimization via Response Surface Methodology. Appl. Water Sci. 2025, 15, 114. [Google Scholar] [CrossRef]
  29. Ditta, A.; Tabish, A.N.; Farhat, I.; Razzaq, L.; Fouad, Y.; Miran, S.; Mujtaba, M.A.; Kalam, M.A. The Optimization of Operational Variables of Electrochemical Water Disinfection Using Response Surface Methodology. Sustainability 2023, 15, 4390. [Google Scholar] [CrossRef]
  30. Ankoliya, D.; Mudgal, A.; Sinha, M.K.; Patel, V.; Patel, J. Application of Electrocoagulation Process for the Treatment of Dairy Wastewater: A Mini Review. Mater. Today Proc. 2023, 77, 117–124. [Google Scholar] [CrossRef]
  31. Bani-Melhem, K.; Rasool Al-Kilani, M. A Comparison between Iron and Mild Steel Electrodes for the Treatment of Highly Loaded Grey Water Using an Electrocoagulation Technique. Arab. J. Chem. 2023, 16, 105199. [Google Scholar] [CrossRef]
  32. Das, P.P.; Sharma, M.; Purkait, M.K. Recent Progress on Electrocoagulation Process for Wastewater Treatment: A Review. Sep. Purif. Technol. 2022, 292, 121058. [Google Scholar] [CrossRef]
  33. Sadaf, S.; Roy, H.; Fariha, A.; Rahman, T.U.; Tasnim, N.; Jahan, N.; Sokan-Adeaga, A.A.; Safwat, S.M.; Islam, M.S. Electrocoagulation-Based Wastewater Treatment Process and Significance of Anode Materials for the Overall Improvement of the Process: A Critical Review. J. Water Process Eng. 2024, 62, 105409. [Google Scholar] [CrossRef]
  34. Bani-Melhem, K.; Al-Kilani, M.R.; Tawalbeh, M. Evaluation of Scrap Metallic Waste Electrode Materials for the Application in Electrocoagulation Treatment of Wastewater. Chemosphere 2023, 310, 136668. [Google Scholar] [CrossRef]
  35. Al-Qodah, Z.; AL-Rajabi, M.M.; Da’na, E.; Al-Shannag, M.; Bani-Melhem, K.; Assirey, E. Continuous Electrocoagulation Processes for Industrial Inorganic Pollutants Removal: A Critical Review of Performance and Applications. Water 2025, 17, 2639. [Google Scholar] [CrossRef]
  36. Al-Qodah, Z.; AL-Rajabi, M.M.; Al Amayreh, H.H.; Assirey, E.; Bani-Melhem, K.; Al-Shannag, M. Performance of Continuous Electrocoagulation Processes (CEPs) as an Efficient Approach for the Treatment of Industrial Organic Pollutants: A Comprehensive Review. Water 2025, 17, 2351. [Google Scholar] [CrossRef]
  37. Duduković, N.; Slijepčević, N.; Kulić Mandić, A.; Pešić, V.; Leovac Maćerak, A.; Kerkez, Đ. Electroprecipitation Technology for Nutrient Recovery: Unlocking Wastewater’s Potential. Environ. Technol. Innov. 2025, 40, 104402. [Google Scholar] [CrossRef]
  38. Yazıcı Karabulut, B. Electrochemical Coagulant Generation via Aluminum-Based Electrocoagulation for Sustainable Greywater Treatment and Reuse: Optimization Through Response Surface Methodology and Kinetic Modelling. Molecules 2025, 30, 3779. [Google Scholar] [CrossRef]
  39. Sahu, J.N.; Acharya, J.; Meikap, B.C. Response Surface Modeling and Optimization of Chromium(VI) Removal from Aqueous Solution Using Tamarind Wood Activated Carbon in Batch Process. J. Hazard. Mater. 2009, 172, 818–825. [Google Scholar] [CrossRef]
  40. Ba-Abbad, M.M.; Chai, P.V.; Benamour, A.; Ewis, D.; Mohammad, A.W.; Mahmoudi, E. Optimizing and Control of Effective Synthesize Parameters for Fe3O4 Nanoparticles Using Response Surface Methodology. Chem. Pap. 2022, 76, 6359–6370. [Google Scholar] [CrossRef]
  41. Tian, Y.; Chen, N.; Yang, X.; Li, C.; He, W.; Ren, N.; Liu, G.; Yang, W. Migration Electric-Field Assisted Electrocoagulation with Sponge Biochar Capacitive Electrode for Advanced Wastewater Phosphorus Removal. Water Res. 2023, 231, 119645. [Google Scholar] [CrossRef] [PubMed]
  42. Chen, P.; Li, J.; Xie, N. Study on Influencing Parameters of Total Phosphorus Degradation in Cattle Farm Wastewater by Electrocoagulation Using Magnesium, Aluminum, and Iron Electrodes. Water 2023, 15, 4134. [Google Scholar] [CrossRef]
  43. Tian, Y.; Chen, N.; Yang, X.; Zhang, R.; Xu, J.; Li, C.; Yang, W.; Ren, N.; Feng, Y.; He, W. Achieved Advanced Wastewater Phosphate Removal via Improved Ionic Interference Resistance in a Migration-Electric-Field Assisted Electrocoagulation (MEAEC) System with Modified-Biochar Pseudocapacitor Electrode. Sep. Purif. Technol. 2024, 328, 124972. [Google Scholar] [CrossRef]
  44. Yang, Y.; Li, Y.; Mao, R.; Shi, Y.; Lin, S.; Qiao, M.; Zhao, X. Removal of Phosphate in Secondary Effluent from Municipal Wastewater Treatment Plant by Iron and Aluminum Electrocoagulation: Efficiency and Mechanism. Sep. Purif. Technol. 2022, 286, 120439. [Google Scholar] [CrossRef]
  45. Zeng, J.; Ji, M.; Zhao, Y.; Helmer Pedersen, T.; Wang, H. Optimization of Electrocoagulation Process Parameters for Enhancing Phosphate Removal in a Biofilm-Electrocoagulation System. Water Sci. Technol. 2021, 83, 2560–2574. [Google Scholar] [CrossRef]
  46. Shirkoohi, M.G.; Tyagi, R.D.; Vanrolleghem, P.A.; Drogui, P. A Comparison of Artificial Intelligence Models for Predicting Phosphate Removal Efficiency from Wastewater Using the Electrocoagulation Process. Digit. Chem. Eng. 2022, 4, 100043. [Google Scholar] [CrossRef]
  47. Li, G.; Zheng, B.; Zhang, W.; Liu, Q.; Li, M.; Zhang, H. Phosphate Removal Efficiency and Life Cycle Assessment of Different Anode Materials in Electrocoagulation Treatment of Wastewater. Sustainability 2024, 16, 3836. [Google Scholar] [CrossRef]
  48. Jiang, C.; Liu, Y.; Zhang, C.; Li, X. Study on Influencing Parameters and Long-Term Operation of Electrocoagulation Phosphorus Removal from Small Rural Domestic Sewage. Water Sci. Technol. 2023, 87, 1866–1878. [Google Scholar] [CrossRef] [PubMed]
  49. Najari, S.; Delnavaz, M.; Bahrami, D. Application of Electrocoagulation Process for the Treatment of Reactive Blue 19 Synthetic Wastewater: Evaluation of Different Operation Conditions and Financial Analysis. Chem. Phys. Lett. 2023, 832, 140897. [Google Scholar] [CrossRef]
  50. Benekos, A.K.; Tziora, F.E.; Tekerlekopoulou, A.G.; Pavlou, S.; Qun, Y.; Katsaounis, A.; Vayenas, D.V. Nitrate Removal from Groundwater Using a Batch and Continuous Flow Hybrid Fe-Electrocoagulation and Electrooxidation System. J. Environ. Manag. 2021, 297, 113387. [Google Scholar] [CrossRef]
  51. Han, X.; Qu, Y.; Dong, Y.; Chen, D.; Liang, D.; Liu, J.; Zhang, J.; Ren, N.; Feng, Y. Simultaneous Electricity Generation and Eutrophic Water Treatment Utilizing Iron Coagulation Cell with Nitrification and Denitrification Biocathodes. Sci. Total Environ. 2021, 782, 146436. [Google Scholar] [CrossRef]
  52. Bhatt, P.; Engel, B.A.; Shivaram, K.B.; Turco, R.F.; Zhou, Z.; Simsek, H. Treatment and Optimization of High-Strength Egg-Wash Wastewater Effluent Using Electrocoagulation and Electrooxidation Methods. Chemosphere 2024, 347, 140632. [Google Scholar] [CrossRef]
  53. Galvão, N.; Dutra, A.J.B.; Bassin, J.P. Understanding the Conversion of Nitrogen Compounds during Ammonia Electrooxidation: Effect of Current Density, Chloride Concentration and pH on Nitrate Formation. J. Chem. Technol. Biotechnol. 2024, 99, 2270–2277. [Google Scholar] [CrossRef]
  54. Dan, N.H.; Le Luu, T. Continuous Flow Sequencing Bed Biofilm Reactor Bio-Digested Landfill Leachate Treatment Using Electrocoagulation-Persulfate. J. Environ. Manag. 2021, 297, 113409. [Google Scholar] [CrossRef] [PubMed]
  55. Bouhaous, M.; Bengharez, Z.; Nacer, A.; Bellebia, S.; Bendaoudi, A.A.; Goosen, M.F.A.; Mahmoudi, H. Assessment of Nitrate Contamination of Domestic Wells and Remedial Treatment by Electrocoagulation. Desalination Water Treat. 2024, 317, 100010. [Google Scholar] [CrossRef]
  56. Bani-Melhem, K.; Elektorowicz, M.; Oleszkiewicz, J. Submerged Membrane Electro-Bioreactor (SMEBR) Reduces Membrane Fouling and Achieves Phosphorus Removal. Proc. Water Environ. Fed. 2009, 2009, 2771–2783. [Google Scholar] [CrossRef]
  57. Rajaniemi, K.; Tuomikoski, S.; Lassi, U. Electrocoagulation Sludge Valorization—A Review. Resources 2021, 10, 127. [Google Scholar] [CrossRef]
  58. Belgada, A.; Lamhar, R.; Charik, F.Z.; Ounouss, I.; Dani, A.; Ma, W.; Necibi, M.C.; Younssi, S.A. Sustainable Valorization of Electrocoagulation Sludge in Ceramic Kaolinite Membrane Fabrication and Its Application to Seawater Pretreatment for SWRO Desalination. J. Water Process Eng. 2025, 74, 107747. [Google Scholar] [CrossRef]
  59. Oktiawan, W.; Sarminingsih, A.; Hadiwidodo, M.; Purwono, P. Electrocoagulation Process for Phosphate Recovery of Agricultural Wastewater: Effect of Calcium Adding, Voltage, and Time. Env. Monit. Assess. 2024, 196, 842. [Google Scholar] [CrossRef]
  60. Emana, B.B.; Bulge, T.B. Integrated Electrodes for the Nutrient Removal from Municipal Wastewater Using Electrocoagulation Technology. Sci. Rep. 2025, 15, 28244. [Google Scholar] [CrossRef]
  61. Ammar, M.; Yousef, E.; Ashraf, S.; Baltrusaitis, J. Removal of Inorganic Pollutants and Recovery of Nutrients from Wastewater Using Electrocoagulation: A Review. Separations 2024, 11, 320. [Google Scholar] [CrossRef]
  62. Bani-Melhem, K.; Elektorowicz, M.; Tawalbeh, M.; Al Bsoul, A.; El Gendy, A.; Kamyab, H.; Yusuf, M. Integrating of Electrocoagulation Process with Submerged Membrane Bioreactor for Wastewater Treatment under Low Voltage Gradients. Chemosphere 2023, 339, 139693. [Google Scholar] [CrossRef]
  63. Reza, A.; Haller, S.; Mao, X. Electrocoagulation as a Remedial Approach for Phosphorus Removal from Onsite Wastewater: A Review. Water 2024, 16, 3206. [Google Scholar] [CrossRef]
  64. Bani-Melhem, K.; Smith, E. Grey Water Treatment by a Continuous Process of an Electrocoagulation Unit and a Submerged Membrane Bioreactor System. Chem. Eng. J. 2012, 198–199, 201–210. [Google Scholar] [CrossRef]
  65. Bani-Melhem, K.Q. Development of a Novel Submerged Membrane Electro-Bioreactor for Wastewater Treatment. Ph.D. Thesis, Concordia University, Montreal, QC, Canada, 2008. [Google Scholar]
  66. Patel, S.K.; Shukla, S.C.; Natarajan, B.R.; Asaithambi, P.; Dwivedi, H.K.; Sharma, A.; Singh, D.; Nasim, M.; Raghuvanshi, S.; Sharma, D.; et al. State of the Art Review for Industrial Wastewater Treatment by Electrocoagulation Process: Mechanism, Cost and Sludge Analysis. Desalination Water Treat. 2025, 321, 100915. [Google Scholar] [CrossRef]
  67. Tian, Y.; He, W.; Liang, D.; Yang, W.; Logan, B.E.; Ren, N. Effective Phosphate Removal for Advanced Water Treatment Using Low Energy, Migration Electric–Field Assisted Electrocoagulation. Water Res. 2018, 138, 129–136. [Google Scholar] [CrossRef]
  68. Svilović, S.; Vukojević Medvidović, N.; Vrsalović, L.; Gudić, S.; Bašić, A.; Dujmović, K. Intensification of Electrocoagulation in Compost-Derived Wastewater. Processes 2025, 13, 3207. [Google Scholar] [CrossRef]
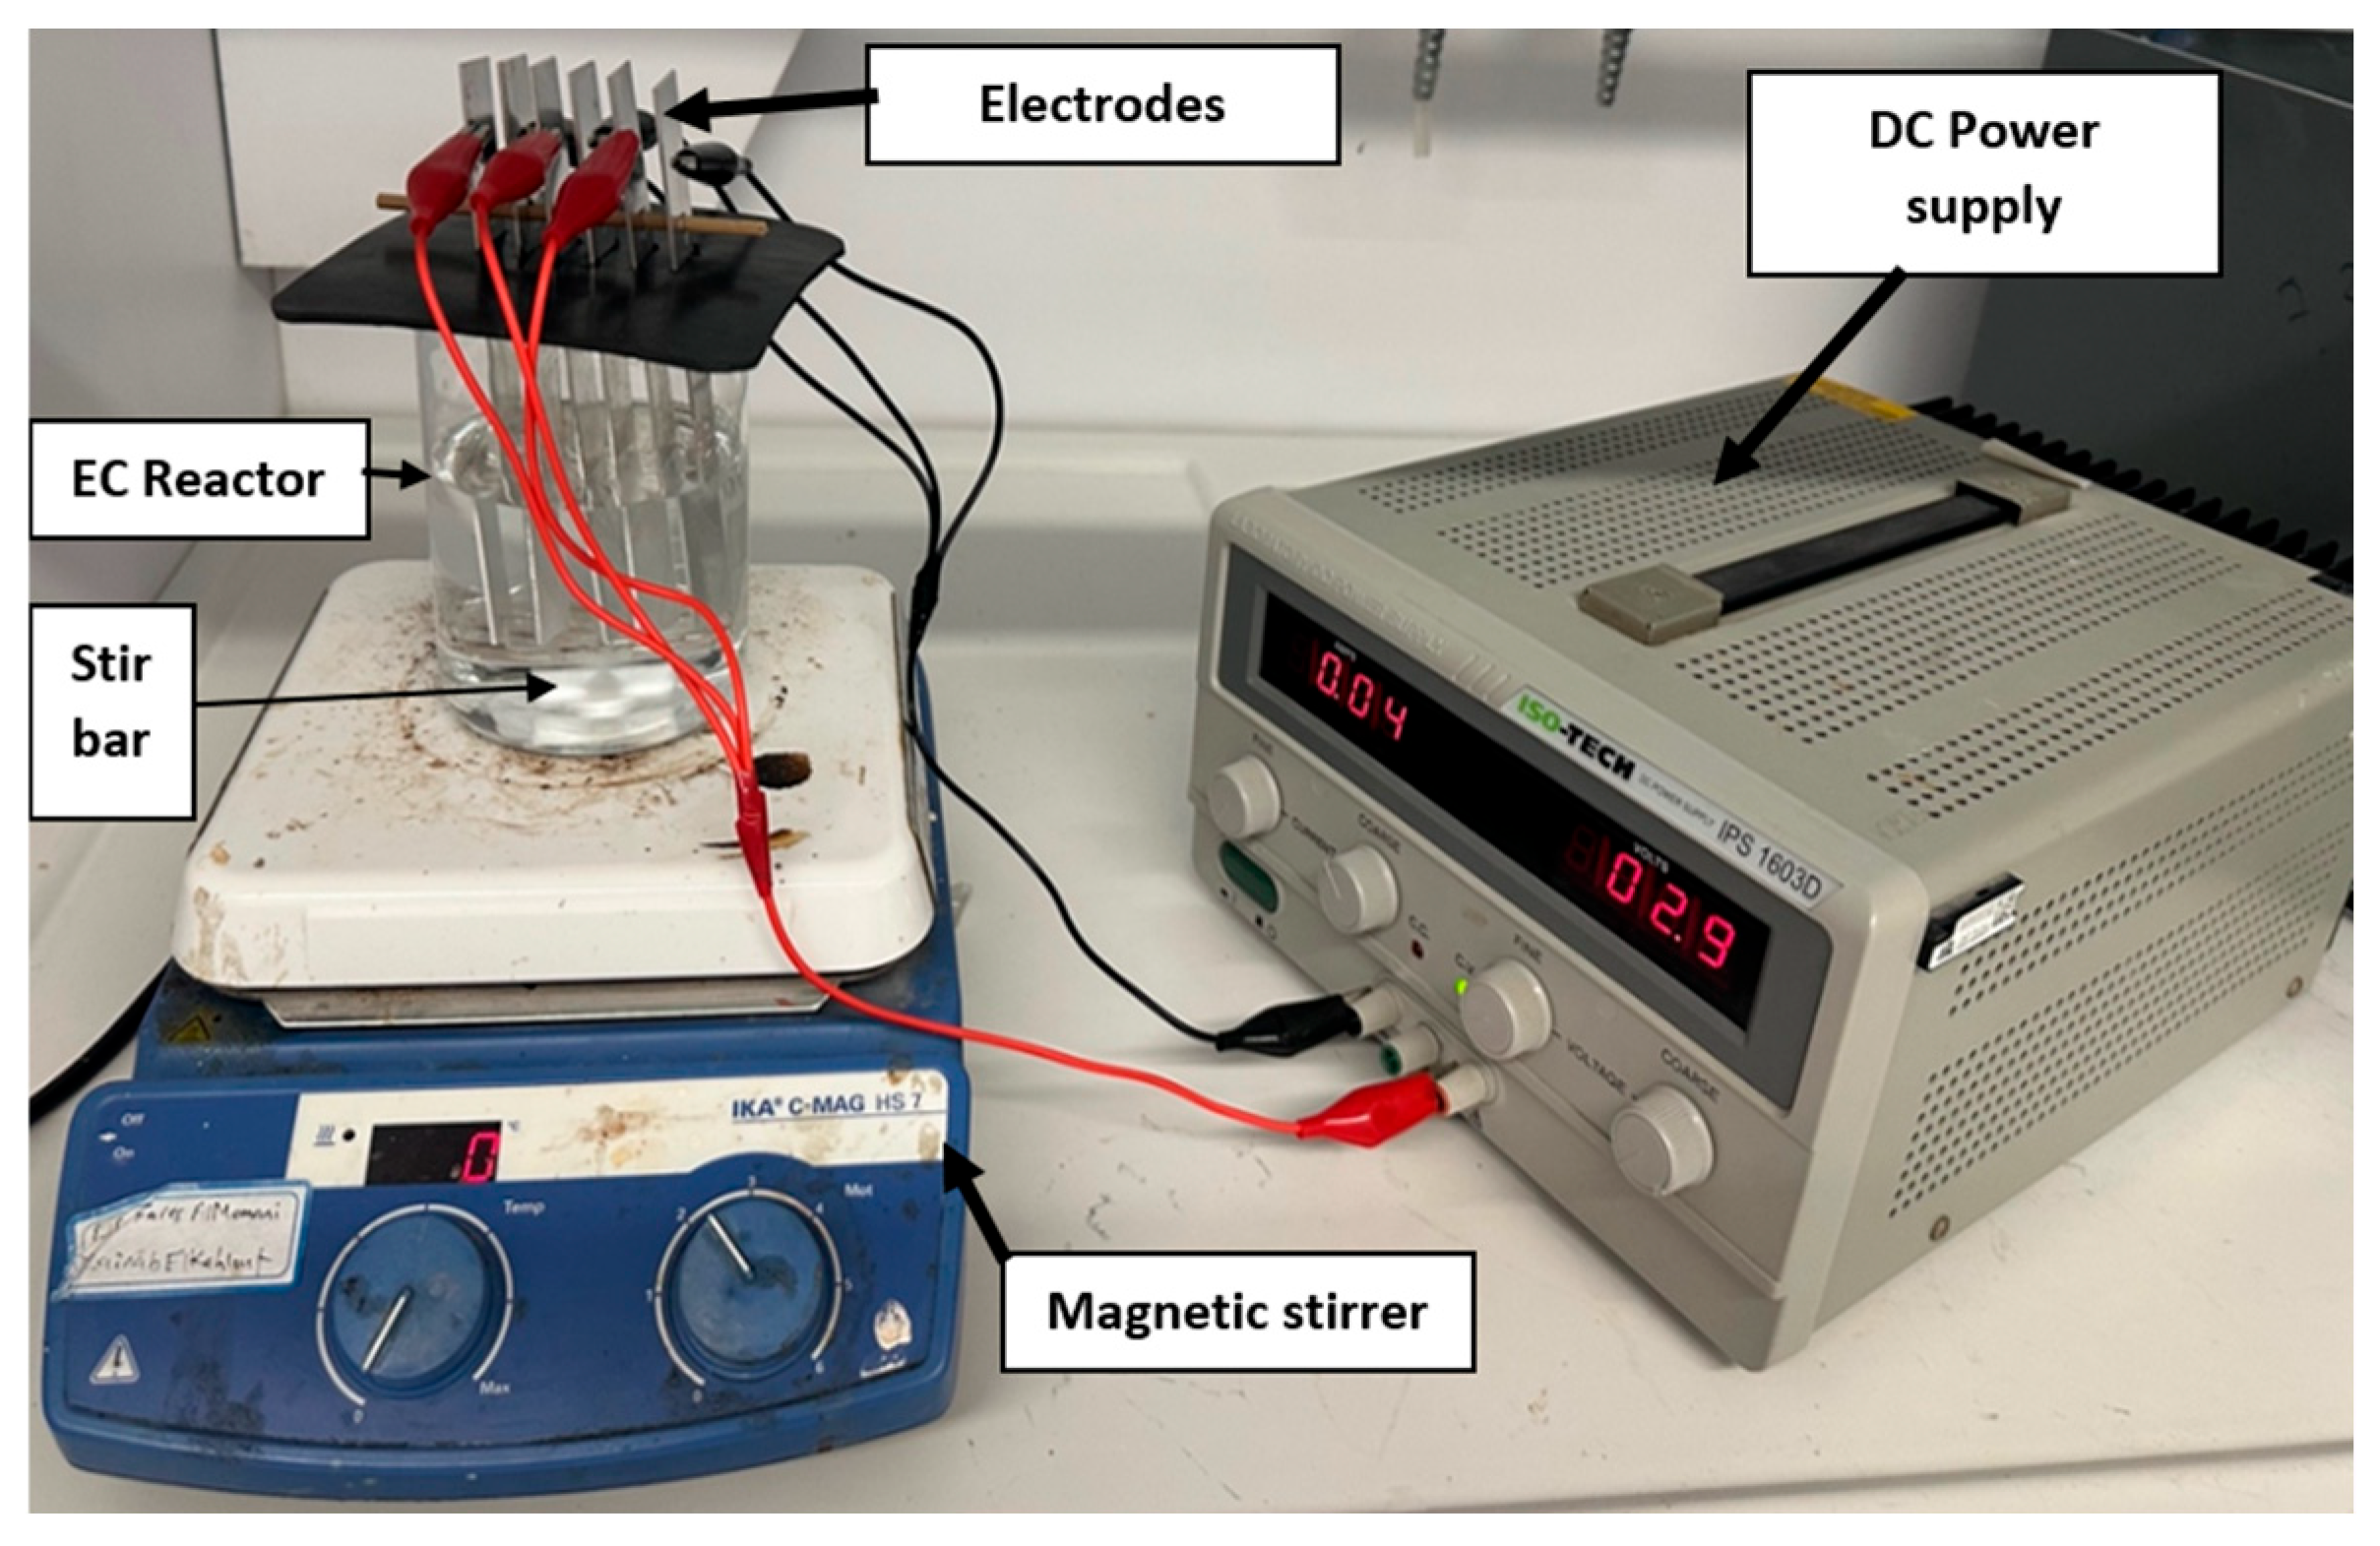
Figure 1. Experimental setup for HWS treatment with six-electrode configuration.
Water 17 03346 g001
Figure 2. Normal probability plot for the removal of (a) phosphate and (b) nitrate removal.
Water 17 03346 g002
Figure 3. Pareto chart of the standardized effects for (a) phosphate and (b) nitrate removal.
Water 17 03346 g003
Figure 4. Phosphate removal is illustrated with 3 varying parameters, where plots (a,c,e) depict a 3D surface plot and (b,d,f) depicts the contour plots.
Water 17 03346 g004
Figure 5. Nitrate removal is illustrated with 3 varying parameters, where (a,c,e) depicts a 3D surface plot and (b,d,f) shows the contour plots.
Water 17 03346 g005
Figure 6. Characterization of sludge generated from HWS treatment.
Water 17 03346 g006
Figure 7. Variation in energy consumption with EC time for 2, 4, and 6 electrodes at an applied current of 0.03 A.
Water 17 03346 g007
Figure 8. Energy and electrode consumption as a function of applied voltage for (a) 2 electrodes, (b) 4 electrodes, and (c) 6 electrodes.
Water 17 03346 g008
Table 1. Characteristics of synthesized hydroponic wastewater solution used in experiments of this study.
Parameter IndexUnitValue
pH-7.2
Temperature Celsius (°C)25.0
Conductivity(µS/cm)432
Phosphate (PO43−)mg/L14.8
Nitrate (NO3)mg/L18.0
Dissolved oxygen (DO)mg/L6.8
Table 2. Independent variables and their three levels for HWS treatment optimization.
Independent VariablesLevels
−101
Current (A)0.030.4150.8
Electrocoagulation time (min)103560
Number of Electrodes246
Table 3. Factor coding of Box–Behnken design.
RunBlkCurrent (A)Electrocoagulation Time (min)Electrode Number
110.8352
210.03352
310.415106
410.03104
510.03604
610.415354
710.8604
810.415354
910.8104
1010.415606
1110.415354
1210.03356
1310.415102
1410.8356
1510.415602
Table 4. The removal rate calculated and predicted fits from Minitab for nitrate and phosphate removal.
RunOrderCurrent (A)Electrocoagulation Time (min)Electrode NumberRemoval Rate of Nitrate (%)Predicted Fits of NitrateRemoval Rate of Phosphate (%)Predicted Fits of Phosphate
10.835280.5382.8499.04100.00
20.0335265.3260.2883.6583.56
30.41510671.6770.5288.4486.13
40.0310457.7856.1567.5076.95
50.0360472.2270.6092.7689.62
60.41535474.4474.6599.3992.74
70.860495.0093.1599.55100.00
80.41535474.4474.6599.3992.74
90.810473.8978.7099.2395.85
100.41560685.5684.9699.7898.80
110.41535474.4474.6599.3992.74
120.0335658.8966.4677.9683.01
130.41510266.1164.3485.7986.68
140.835695.0089.0199.66100.00
150.41560274.4478.7899.5599.35
Table 5. ANOVA analysis for nitrate and phosphate removal in the system.
SourceDFAdj SSAdj MSF Valuep Value
Phosphate
Regression31510.81503.630.86<0.001
Current (A)11017.231017.2362.33<0.001
Electrocoagulation time (min)1417.28417.2825.57<0.001
Electrode number176.376.34.670.054
Error11179.5316.32
Lack-of-Fit9179.5319.95
Pure Error200
Total141690.34
Nitrate
Regression31036.26345.4210.180.002
Current (A)1714.62714.6221.070.001
Electrocoagulation time (min)1321.04321.049.460.011
Electrode number10.60.5990.020.897
Error11373.1433.922
Lack-of-Fit9373.1441.46
Pure Error200
Total141409.4
Disclaimer/Publisher’s Note: The statements, opinions and data contained in all publications are solely those of the individual author(s) and contributor(s) and not of MDPI and/or the editor(s). MDPI and/or the editor(s) disclaim responsibility for any injury to people or property resulting from any ideas, methods, instructions or products referred to in the content.