Article

Surface Soil Moisture Retrieval over Winter Wheat Fields Based on Fused Multispectral and L-Band MiniSAR Data

1
School of Water Conservancy and Transportation, Zhengzhou University, Zhengzhou 450001, China
2
Department of Remote Sensing Engineering, Henan College of Surveying and Mapping, Zhengzhou 451464, China
3
Henan Academy of Geology, Zhengzhou 450001, China
4
Institute of Farmland Irrigation, Chinese Academy of Agricultural Sciences, Xinxiang 453002, China
*
Authors to whom correspondence should be addressed.
Water 2025, 17(23), 3345; https://doi.org/10.3390/w17233345 (registering DOI)
Submission received: 22 October 2025 / Revised: 20 November 2025 / Accepted: 20 November 2025 / Published: 22 November 2025
(This article belongs to the Section Soil and Water)

Abstract

Surface soil moisture (SSM) is a critical indicator of crop growth conditions, and its accurate retrieval is essential for agricultural monitoring. Integrating multispectral and microwave remote sensing data can enhance SSM estimation, but discrepancies among platforms often reduce accuracy at local scales. In this study, we fused Sentinel-2 and UAV multispectral images through resampling to generate fusion data, which were then combined with miniature synthetic aperture radar (MiniSAR) data. A modified water cloud model (WCM) was applied to mitigate vegetation effects on radar backscattering coefficients. Three machine learning algorithms—random forest (RF), extreme gradient boosting (XGBoost), and extreme learning machine (ELM)—were employed to retrieve SSM. Field measurements at two depths (0–10 cm and 0–20 cm) over winter wheat fields in Xunxian, Hebi City, Henan Province, China, were used for validation. Results showed the following: (1) Fused multispectral data improved retrieval accuracy compared with single-satellite data, with the best configuration (fused data + VV + RF) achieving an R2 of 0.85 and an RMSE of 1.51% at 0–10 cm. (2) At 0–20 cm, the fused data combined with VV polarization and XGBoost achieved the best performance (R2 = 0.67, RMSE = 2.61%). (3) ELM exhibited the largest accuracy improvement after incorporating fused data, with R2 increases up to 0.40 and RMSE reductions up to 18.24%. These results demonstrate the strong potential of multi-platform multispectral fusion combined with MiniSAR data for improving field-scale SSM retrieval in winter wheat regions.

1. Introduction

Surface soil moisture (SSM), as a vital indicator, links land–atmosphere interactions and regulates both energy and water exchanges within the Earth’s systems [1,2,3]. As a fundamental variable, it underpins a wide range of studies in hydrology, meteorology, ecology, and agriculture, particularly influencing crop dynamics in arid and semi-arid regions [4,5]. However, accurately mapping SSM over large scales remains a major challenge due to the heterogeneity and complexity of natural surface conditions [6,7].
Research on the retrieval of SSM using remote sensing technology has a history of more than three decades [8,9,10]. Among various remote sensing approaches, most optical methods estimate SSM based on spectral reflectance indices, which are easy to implement but highly susceptible to atmospheric and weather conditions [11]. In thermal infrared approaches, SSM is primarily estimated according to the thermal inertia of the surface [12]. It should be noted that vegetation canopies obscure soil emission signals, thereby reducing the retrieval accuracy of SSM in areas with dense vegetation cover [13]. In contrast, microwave remote sensing offers stronger penetration capability and, due to its longer wavelength, is largely unaffected by cloud cover.
Building upon microwave radar data, multi-sensor synergistic approaches for SSM retrieval have gained increasing attention, with the integration of synthetic aperture radars (SAR) and optical data emerging as one of the most widely adopted strategies [14,15,16]. Based on the synergistic use of C-band SAR data from Sentinel-1 and multispectral imagery from Sentinel-2, several studies have demonstrated the potential of combining radar and optical observations for SSM retrieval. Bousbih et al. employed VV-polarized Sentinel-1 data together with the normalized difference vegetation index (NDVI) to retrieve SSM over the Kairouan Plain and subsequently generated an irrigation map for the region [17]. Esmaeili Sarteshnizi et al. compared different processing methods of Sentinel-1 and Sentinel-2 data for SSM retrieval in the southern part of Malard city, Tehran Province (Iran), and found that optical data generally provided better retrieval accuracy than radar data, while their integration exhibited great potential for improvement [18]. Benninga et al. proposed an SSM retrieval scheme suitable for grassland areas by combining Sentinel-1 SAR backscatter with the integral equation model (IEM) and the tor vergata (TV) vegetation scattering model. The inclusion of vegetation correction (TV-IEM) slightly improved the retrieval performance, indicating the operational applicability and practical potential of this approach at the field scale [19].
Unmanned aerial vehicles (UAVs), as emerging remote sensing platforms, can carry various sensors such as spectrometers, SAR, and thermal infrared imagers [20,21]. The miniature synthetic aperture radar (MiniSAR) system operates in the L-band and is mounted on a UAV platform. Compared with the C-band, the L-band offers greater penetration depth, higher spatial resolution, portability, and operational flexibility, making it more suitable for SSM retrieval under vegetated conditions [22].
Previous studies had primarily focused on the joint retrieval of SSM using C-band SAR and optical data from satellite platforms, which were well suited for large-scale monitoring but often suffer from limited retrieval accuracy [23]. Few researchers have investigated SSM retrieval based on the fusion of L-band and optical data across multiple platforms. Theoretically, combining the advantages of large-scale monitoring from satellites with the high-precision observations provided by UAV could enable wide-area, high-accuracy monitoring of SSM content.
Considering this, the main objective of this study is to evaluate the synergistic use of fused multispectral data and L-band MiniSAR observations for retrieving SSM over winter wheat fields, with a focus on developing a high-accuracy and scalable SSM retrieval method. To this end, UAV multispectral imagery and Sentinel-2 satellite multispectral data are fused, and vegetation spectral indices derived from the fused data are incorporated into the water cloud model (WCM). The fused data are then combined with L-band data under four different polarization modes. In addition, random forest (RF), extreme gradient boosting (XGBoost), and extreme learning machine (ELM) algorithms are applied to retrieve SSM.

2. Materials and Methods

2.1. Study Area

The study area is located in the central region of Xunxian, Hebi City, Henan Province, China (centered at 114°28′24″ E, 35°39′30″ N). The study area features flat terrain and is situated within a warm temperate, semi-humid monsoon climate zone, characterized by high temperatures and abundant precipitation in summer, and cold, dry conditions in winter. The annual average temperature ranges from 14.2 °C to 15.5 °C, and annual precipitation ranges from 349.2 mm to 970.1 mm. The predominant soil type is calcareous fluvo-aquic soil. The soil texture in the topsoil layer (0–20 cm depth) is primarily loam. Based on field sampling and laboratory analysis, the soil exhibits moderate permeability and good water-holding capacity. Winter wheat is the dominant crop cultivated in this region, and during the field data collection period, the wheat is in the jointing stage. The location of the study area and the distribution of sampling points are shown in Figure 1.

2.2. Data Collection and Preprocessing

2.2.1. Soil Sampling and Preprocessing

SSM was conducted concurrently with UAV remote sensing data acquisition. During the field campaign, a systematic spatial sampling strategy was adopted, in which sampling points were arranged as uniformly as possible to achieve broad spatial coverage over the study area. As shown in Figure 1, 24 sampling points were established for measuring vegetation water content (VWC), and 40 typical sampling points were selected for measuring SSM content across the study area. The geographic coordinates of all sampling points were recorded using a handheld GPS device (Hefei Zhuolin Electronic Technology Co., Ltd., Hefei, China; WGS84 coordinate system). Field measurements were carried out from 26 to 28 April 2024, under clear weather conditions. At each SSM sampling point, soil samples were collected from two depth intervals: 0–10 cm and 0–20 cm, using the ring knife method. The samples were placed in aluminum containers and transported to the laboratory for oven-drying and weighing to calculate gravimetric soil moisture (GSM). The GSM was then converted into volumetric soil moisture (VSM) using the following formula:
V S M = G S M × ρ
where ρ is the soil bulk density (g/cm3).

2.2.2. UAV Data and Preprocessing

Multispectral data were acquired using a DJI M300 RTK UAV (DJI, Shenzhen, China) equipped with a RedEdge-MX multispectral camera (Golden Way Scientific, Beijing, China). The flight was conducted at an altitude of 70 m, with a flight line spacing of 17 m, a flight speed of 6 m/s, and an image capture interval of 2 s. The resulting imagery had a spatial resolution of 0.08 m and was collected on 26 April 2024. The RedEdge-MX sensor (MicaSense, Seattle, WA, USA) includes 10 spectral bands, covering the blue (center wavelength: 475 nm, bandwidth: 20 nm), green (560 nm, 20 nm), red (668 nm, 10 nm), near-infrared (840 nm, 40 nm), and red-edge (717 nm, 10 nm) regions. After the flight, the raw images were processed using Pix4Dmapper 4.5.6 software, including radiometric calibration, image mosaicking, and geometric correction. The final output was multispectral remote sensing imagery in TIFF format, containing surface reflectance data for each band.
Radar data were acquired using the MiniSAR system developed by the Aerospace Information Research Institute, Chinese Academy of Sciences. The system operates in the L-band and was mounted on a DJI M600 UAV platform (DJI, Shenzhen, China). It supports four polarization modes: vertical transmit and vertical receive (VV), vertical transmit and horizontal receive (VH), horizontal transmit and vertical receive (HV), and horizontal transmit and horizontal receive (HH). The flight was conducted at an altitude of 350 m with a speed of approximately 10 m/s. Both the central viewing angle and incidence angle were set to 33°. Data acquisition was performed on 29 April 2024. The raw SAR imagery was first radiometrically calibrated separately for each polarization channel. The MiniSAR system was calibrated using trihedral corner reflectors deployed in the study area prior to data acquisition. The corner reflector had a right-angle side length of 0.60 m. The radiometric accuracy of the calibrated MiniSAR images is estimated to be within ±1 dB, which is typical for airborne L-band SAR systems and sufficient for the soil moisture retrieval application in this study. The equations related to the radiometric calibration are as follows:
R C S = 4 π L 4 3 λ 2
where R C S denotes the radar cross section, L is the effective side length of the corner reflector, and λ is the wavelength of the operating frequency band.
d B = 10 · l o g 10 ( D N 2 × k p )
where d B is the backscatter coefficient expressed in decibels, D N is the digital number of each pixel, k p   is a calibration parameter corresponding to each polarization channel, and p   indicates the four polarization modes (VV, VH, HV, HH).
Subsequently, to reduce the influence of speckle noise in the MiniSAR images, a 3 × 3 rectangular moving-window mean filter (Focal Statistics, Mean in ArcGIS 10.2) was applied to the calibrated backscattering intensity images. The final products were backscattering intensity images with a spatial resolution of 0.6 m × 0.6 m, expressed in dB.

2.2.3. Sentinel-2 Data and Preprocessing

Sentinel-2 satellite imagery was obtained from the Copernicus Data Space Ecosystem platform provided by the European Space Agency (https://dataspace.copernicus.eu/, accessed on 21 June 2024). The selected image was acquired on 26 April 2024, coinciding with the UAV flight and ground-based sampling campaign. Sentinel-2 has a revisit cycle of 5 days and offers multispectral imaging capabilities at spatial resolutions of 10 m, 20 m, and 60 m. This study primarily used the 10 m resolution bands in the visible and near-infrared spectrum, including the blue band (center wavelength: 490 nm), green (560 nm), red (665 nm), and near-infrared (842 nm). After downloading, the imagery was preprocessed using SNAP 10.0.0 software, including radiometric calibration, atmospheric correction, and geometric correction. Band stacking and regional clipping were then performed to generate remote sensing imagery covering the study area.

2.3. Modeling Process and Methods

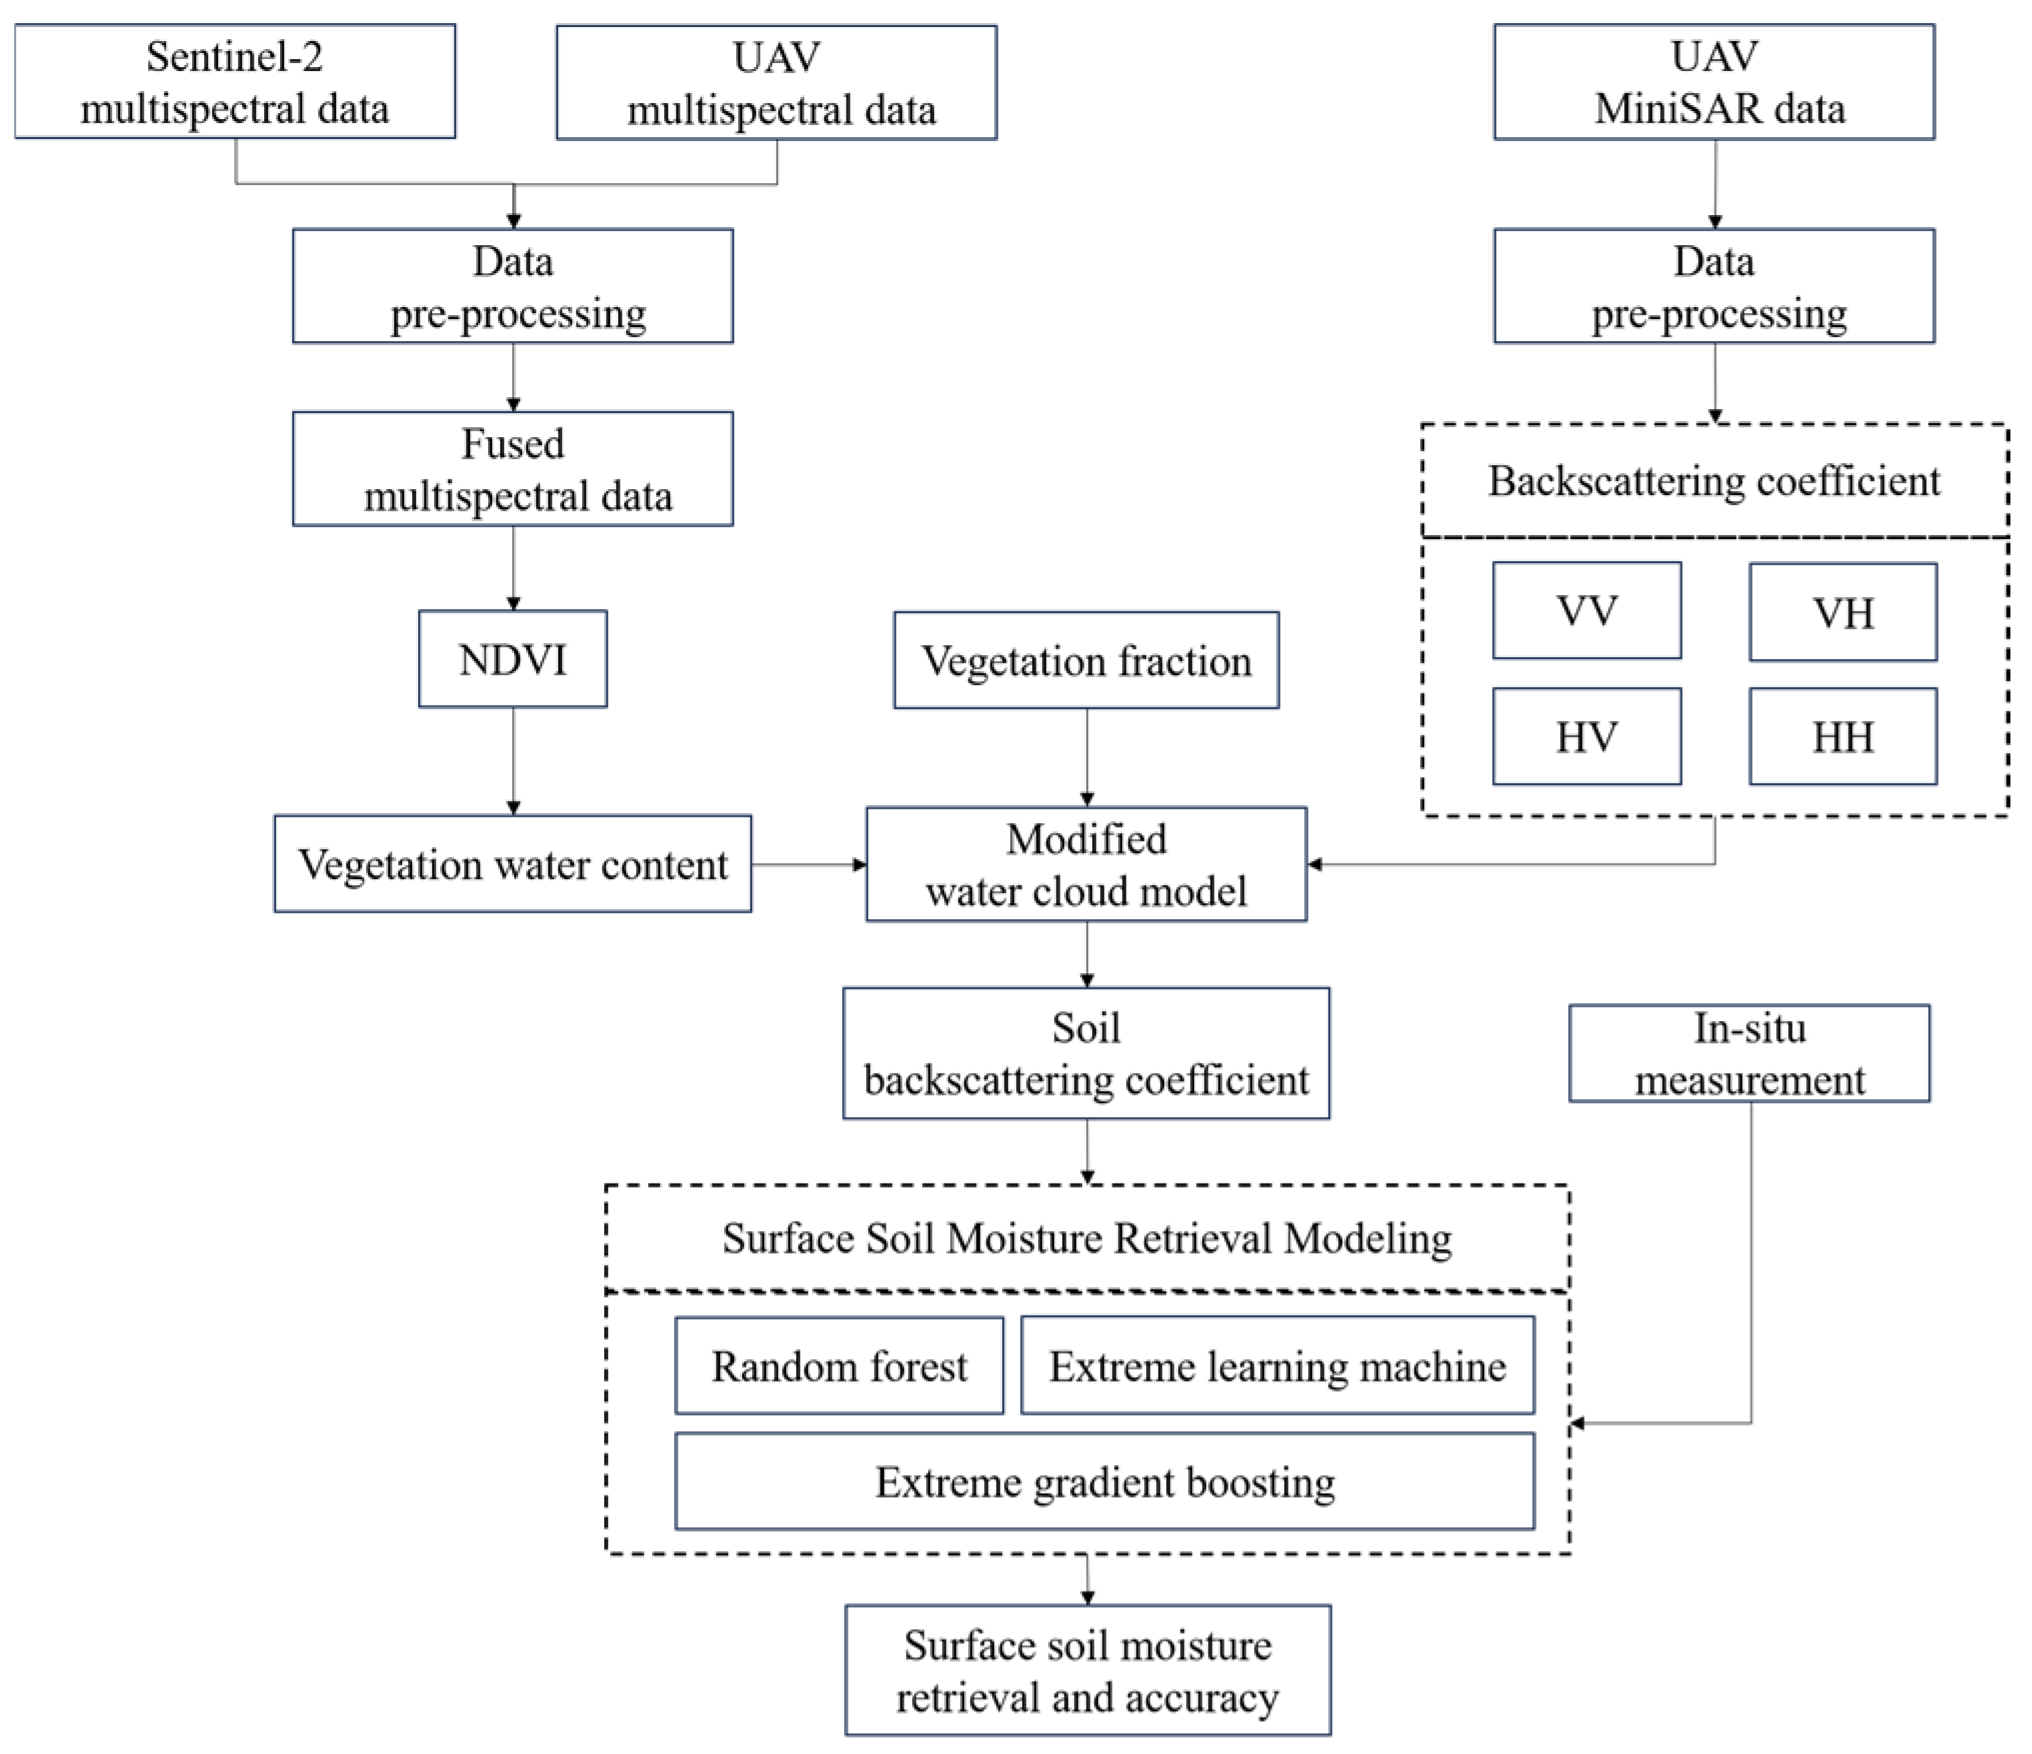
In this study, the flowchart of SSM retrieval process is shown in Figure 2. The process consists of four main stages. In the first stage, model parameters were obtained from satellite and UAV remote sensing data, namely, multispectral reflectance images from Sentinel-2, multispectral reflectance images from UAVs, and UAV-based MiniSAR backscattering coefficient images after preprocessing. In the second stage, to take advantage of the complementary strengths of different sensors, Sentinel-2 multispectral images and UAV multispectral images were resampled and fused. The resulting fused data were used as the multispectral input in subsequent retrieval steps. In the third stage, modified WCM was applied to reduce the influence of vegetation on radar backscattering, producing soil backscattering coefficients under different polarization modes. Finally, three machine learning methods were employed to retrieve SSM by modeling nonlinear relationships between input features and SSM, and the retrieved SSM was mapped at a spatial resolution of 1 m × 1 m. The retrieval accuracy was evaluated using R2, RMSE, and MAE.

2.3.1. Scale Conversion and Data Fusion

The original imagery included UAV multispectral images with a spatial resolution of 0.08 m, MiniSAR images at 0.6 m, and Sentinel-2 multispectral satellite images at 10 m resolution. Given the large disparity in pixel numbers for the same area across these three datasets, a resampling approach was adopted for scale conversion. To unify spatial resolution, improve data fusion and modeling accuracy, and control computational cost and processing time, 1 m was selected as the target resolution. The UAV and radar images were downscaled to 1 m, while the Sentinel-2 imagery was upscaled to 1 m. This ensured consistent pixel dimensions across all datasets. Specifically, the study area was extracted from the UAV multispectral images, MiniSAR images, and Sentinel-2 images. Using ArcGIS 10.2, all datasets were resampled and adjusted to the target resolution through bilinear interpolation.
Since the coverage area of the UAV multispectral imagery was smaller than that of the Sentinel-2 imagery, UAV data were used to enhance the Sentinel-2 imagery through pixel-level fusion. This approach not only improved spectral completeness within the study area but also leveraged the strengths of different remote sensing platforms. The fusion method, performed under a unified spatial resolution framework, used UAV imagery as a reference to adjust pixel-level spectral differences in the corresponding regions of Sentinel-2 imagery, achieving complementary information across data sources. Given the temporal proximity of the two acquisitions, the number of matched pixels within the overlapping area was nearly identical after processing, thereby minimizing errors caused by spatial resolution mismatch and temporal differences.

2.3.2. Modified Water Cloud Model

The WCM was originally proposed by Attema and Ulaby in 1978, based on radiative transfer theory [24]. It was developed to describe the formation mechanism of radar backscattering signals under vegetation-covered surfaces. The model assumes that the vegetation layer consists of uniformly distributed and isotropic scatterers. The total backscattering signal was composed of two parts: the scattering contribution from vegetation itself, and the soil backscattering component attenuated twice by the vegetation layer. The WCM was widely used for the remote sensing retrieval of SSM under vegetated conditions. The basic form of the model can be expressed as:
σ c 0 θ = σ v 0 θ + γ 2 θ σ s 0 θ
σ v 0 θ = A V 1 cos θ 1 γ 2 θ
γ 2 θ = exp 2 B V 2 · sec θ
V 1 = V 2 = m v
where σ c 0 is the total backscattering coefficient, σ v 0 is the vegetation backscattering component, and σ s 0 is the soil backscattering component attenuated twice by the vegetation layer. A and B are empirical coefficients; since the crop in the study area is winter wheat [25], A is set to 0.0018 and B to 0.138 in this study. γ 2 is the two-way attenuation factor, θ is the radar incidence angle, m v is the VWC, and V 1 and V 2 are vegetation-related parameters.
The VWC is estimated by fitting a vegetation index [26], with the NDVI selected as the vegetation index. The formulas are calculated as follows:
m v = f N D V I
N D V I = ρ N I R ρ R e d   ρ N I R + ρ R e d  
where f is the fitting function; ρ N I R and ρ R e d represent the reflectance in the near-infrared and red bands, respectively.
To account for multiple scattering effects during electromagnetic wave propagation, the WCM was improved by introducing a vegetation coverage parameter. The vegetation coverage was estimated using the Dimidiate Pixel Model (DPM) in combination with NDVI [27]. The formula is expressed as follows:
f v = N D V I N D V I m i n N D V I m a x N D V I m i n
where   f v represents the vegetation coverage; N D V I m a x and N D V I m i n correspond to the NDVI values under fully vegetated and completely bare soil conditions, respectively.
Based on the above, the modified WCM can be expressed as follows:
σ c 0 θ = f v σ v 0 θ + γ 2 θ σ s 0 θ + 1 + f v σ s 0 θ

2.3.3. Construction of SSM Retrieval Model

In this study, the model input variables were divided into two groups: (1) Sentinel-2 spectral data and (2) fused spectral data combining satellite and UAV imagery. Each group was combined with the four polarization modes of MiniSAR data. Three machine learning algorithms—RF, XGBoost, and ELM—were then applied to construct winter wheat SSM retrieval models based on the Modified WCM at two soil depths. In total, 48 SSM retrieval models were developed. Different models exhibit varying performances on the same data due to their unique algorithmic characteristics.
RF is an ensemble algorithm that builds multiple decision trees from bootstrap samples of the training data, forming a “forest” of independently trained trees [28,29,30]. In this study, the number of trees was set to 100, the maximum depth to 10, the minimum samples per leaf to 4, the minimum samples required for node splitting to 10, and the maximum number of features considered at each split was set to ‘sqrt’.
XGBoost proposed by Chen et al. in 2016, extends gradient boosting decision trees (GBDT) [31]. By applying a second-order Taylor expansion of the objective function, it enables more efficient optimization [32]. In this work, the number of boosting rounds was set to 150, the learning rate to 0.1, the maximum depth to 6, the subsample ratio to 0.8, the column subsample ratio to 0.8, and the L2 regularization parameter to 1.0.
ELM is based on single-hidden-layer feedforward neural networks (FNNs) [33]. Compared with traditional neural networks, ELM avoids slow training, sensitivity to learning rates, and local optima, while offering high computational efficiency and strong generalization [34]. In this study, the number of hidden neurons was set to 50, the activation function was sigmoid, and the regularization coefficient was set to 10.
Three machine learning algorithms were implemented using the scikit-learn (sklearn) and elm libraries in Python 3.12. The overall modeling process was divided into two main stages: the training stage and the estimation stage.
In the training stage, field measurements and features extracted from remote sensing data were used to establish the relationship between input features and output target values. The remote sensing features were derived using the modified WCM, which reduces the ambiguity in SAR signals caused by vegetation. The dataset was divided into two subsets: 75% (30 samples) for training and 25% (10 samples) for performance estimation and quantitative evaluation.
After the training stage, the trained models were applied in the estimation stage. In this stage, independent test samples were used, and the estimation performance was quantitatively assessed with common metrics including the coefficient of determination (R2), root mean squared error (RMSE), and mean absolute error (MAE).

3. Results

3.1. SSM Data Analysis

A statistical analysis was conducted on the SSM collected from 40 sampling points at two depths. The results are presented in Table 1. At 0–10 cm, the SSM ranged from 19.40% to 33.95%, with an average of 26.57%, a standard deviation of 3.66%, and a 95% confidence interval of 25.40–27.75%. At 0–20 cm, the moisture content ranged from 22.08% to 35.05%, with an average of 27.96%, a standard deviation of 3.40%, and a 95% confidence interval of 26.87–29.04%. Overall, the 0–20 cm depth exhibited slightly higher average moisture content compared to 0–10 cm, while the small difference in standard deviation indicates that the moisture distribution was relatively stable at both depths.

3.2. Comparison Between the Original and Modified Water Cloud Model

40 SSM sampling points were randomly divided into two groups: 30 points were used for model training and 10 for validation. The original and modified WCM were used to calculate soil backscattering coefficients under different polarization modes. These coefficients were then used as inputs to construct simple LR models for retrieving SSM at the 10 cm and 20 cm. The model performance was evaluated using three metrics: R2, RMSE, and MAE. The results are presented in Table 2.
As shown in Table 2, the modified WCM, which incorporates vegetation coverage as an additional factor, outperformed the original WCM across all polarization modes and at both depths. At 0–10 cm, under VV, the R2 increased from 0.29 to 0.47. The RMSE remained relatively stable (from 3.64% to 3.73%), and the MAE slightly increased from 2.90% to 2.93%. For VH, HV, and HH, although RMSE and MAE exhibited only minor fluctuations, the R2 values improved significantly from 0.12, 0.13, and 0.23 to 0.29, 0.25, and 0.40, respectively. At 0–20 cm, a similar trend was observed. For example, under VV, the R2 increased from 0.17 to 0.48, RMSE changed from 3.29% to 3.23%, and MAE from 2.58% to 2.60%. Notably, under HH, the R2 rose from 0.23 to 0.41, RMSE decreased from 3.23% to 3.05%, and MAE dropped from 2.56% to 2.42%, representing a more substantial improvement. These results indicate that incorporating vegetation coverage into the WCM enhances the accuracy of SSM retrieval over winter wheat field.

3.3. SSM Retrieval Modeling Using Sentinel-2 Data

The NDVI derived from Sentinel-2 multispectral imagery was combined with soil backscattering coefficients calculated using the modified WCM. These variables were used as input features for three machine learning regression models: RF, XGBoost, and ELM. Separate models were trained to retrieve SSM at two depths: 0–10 cm and 0–20 cm. Model performance was evaluated using R2, RMSE, MAE. The results are summarized in Table 3.
As shown in Table 3, both RF and XGBoost models demonstrated consistent improvements in R2 across all polarization modes and depths compared to the LR model. The ELM model performed well only under specific polarization–depth combinations, but overall, it was inferior to both RF and XGBoost.
At 0–10 cm, XGBoost achieved the best performance under all polarization modes. The R2 under VV, VH, HV, and HH were 0.70, 0.62, 0.47, and 0.68, respectively; the RMSEs were 2.29%, 2.57%, 3.22%, and 2.24%; and the MAEs were 1.57%, 1.64%, 2.03%, and 1.18%. The RF model ranked second, with R2 improvements over the LR model of 0.05 (VV), 0.19 (VH), 0.17 (HV), and 0.16 (HH). The ELM model showed the weakest performance, with R2 improvements only under VH and HV (by 0.09 and 0.11, respectively), while performing worse than LR model in all other cases.
At 0–20 cm, XGBoost again delivered the best performance under VV, VH, and HH, with R2 of 0.66, 0.50, and 0.64, RMSEs of 2.10%, 2.63%, and 2.58%, and MAEs of 1.49%, 1.97%, and 2.17%, respectively. The ELM model followed closely under VV, VH, and HV polarization modes, with R2 of 0.57, 0.41, and 0.61, RMSEs of 2.64%, 10.8%, and 26.3%, and MAEs of 1.39%, 4.15%, and 8.56%. The RF model showed the weakest performance for VV, VH, and HH, and only performed best under HV, yet still fell short of the LR model, with an R2 of 0.36, RMSE of 2.93%, and MAE of 2.29%.

3.4. SSM Retrieval Modeling Using Fused Multispectral Data

After fusing UAV multispectral data with Sentinel-2 satellite imagery, the resulting NDVI was combined with soil backscattering coefficients derived from the modified WCM. These features were used as inputs for three machine learning regression models: RF, XGBoost, ELM. Models were developed to retrieve SSM at two depths: 0–10 cm and 0–20 cm. The model performance was evaluated using R2, RMSE, and MAE. The results are presented in Table 4.
As shown in Table 3 and Table 4, the integration of UAV and Sentinel-2 multispectral data led to a noticeable improvement in model performance across all machine learning models and polarization modes, compared to using Sentinel-2 data alone. The enhancement was particularly significant at 0–10 cm. Both the RF and XGBoost models continued to outperform the ELM model overall. Notably, at 0–10 cm, the R2 of nearly all combinations were considerably higher than those reported in Table 3.
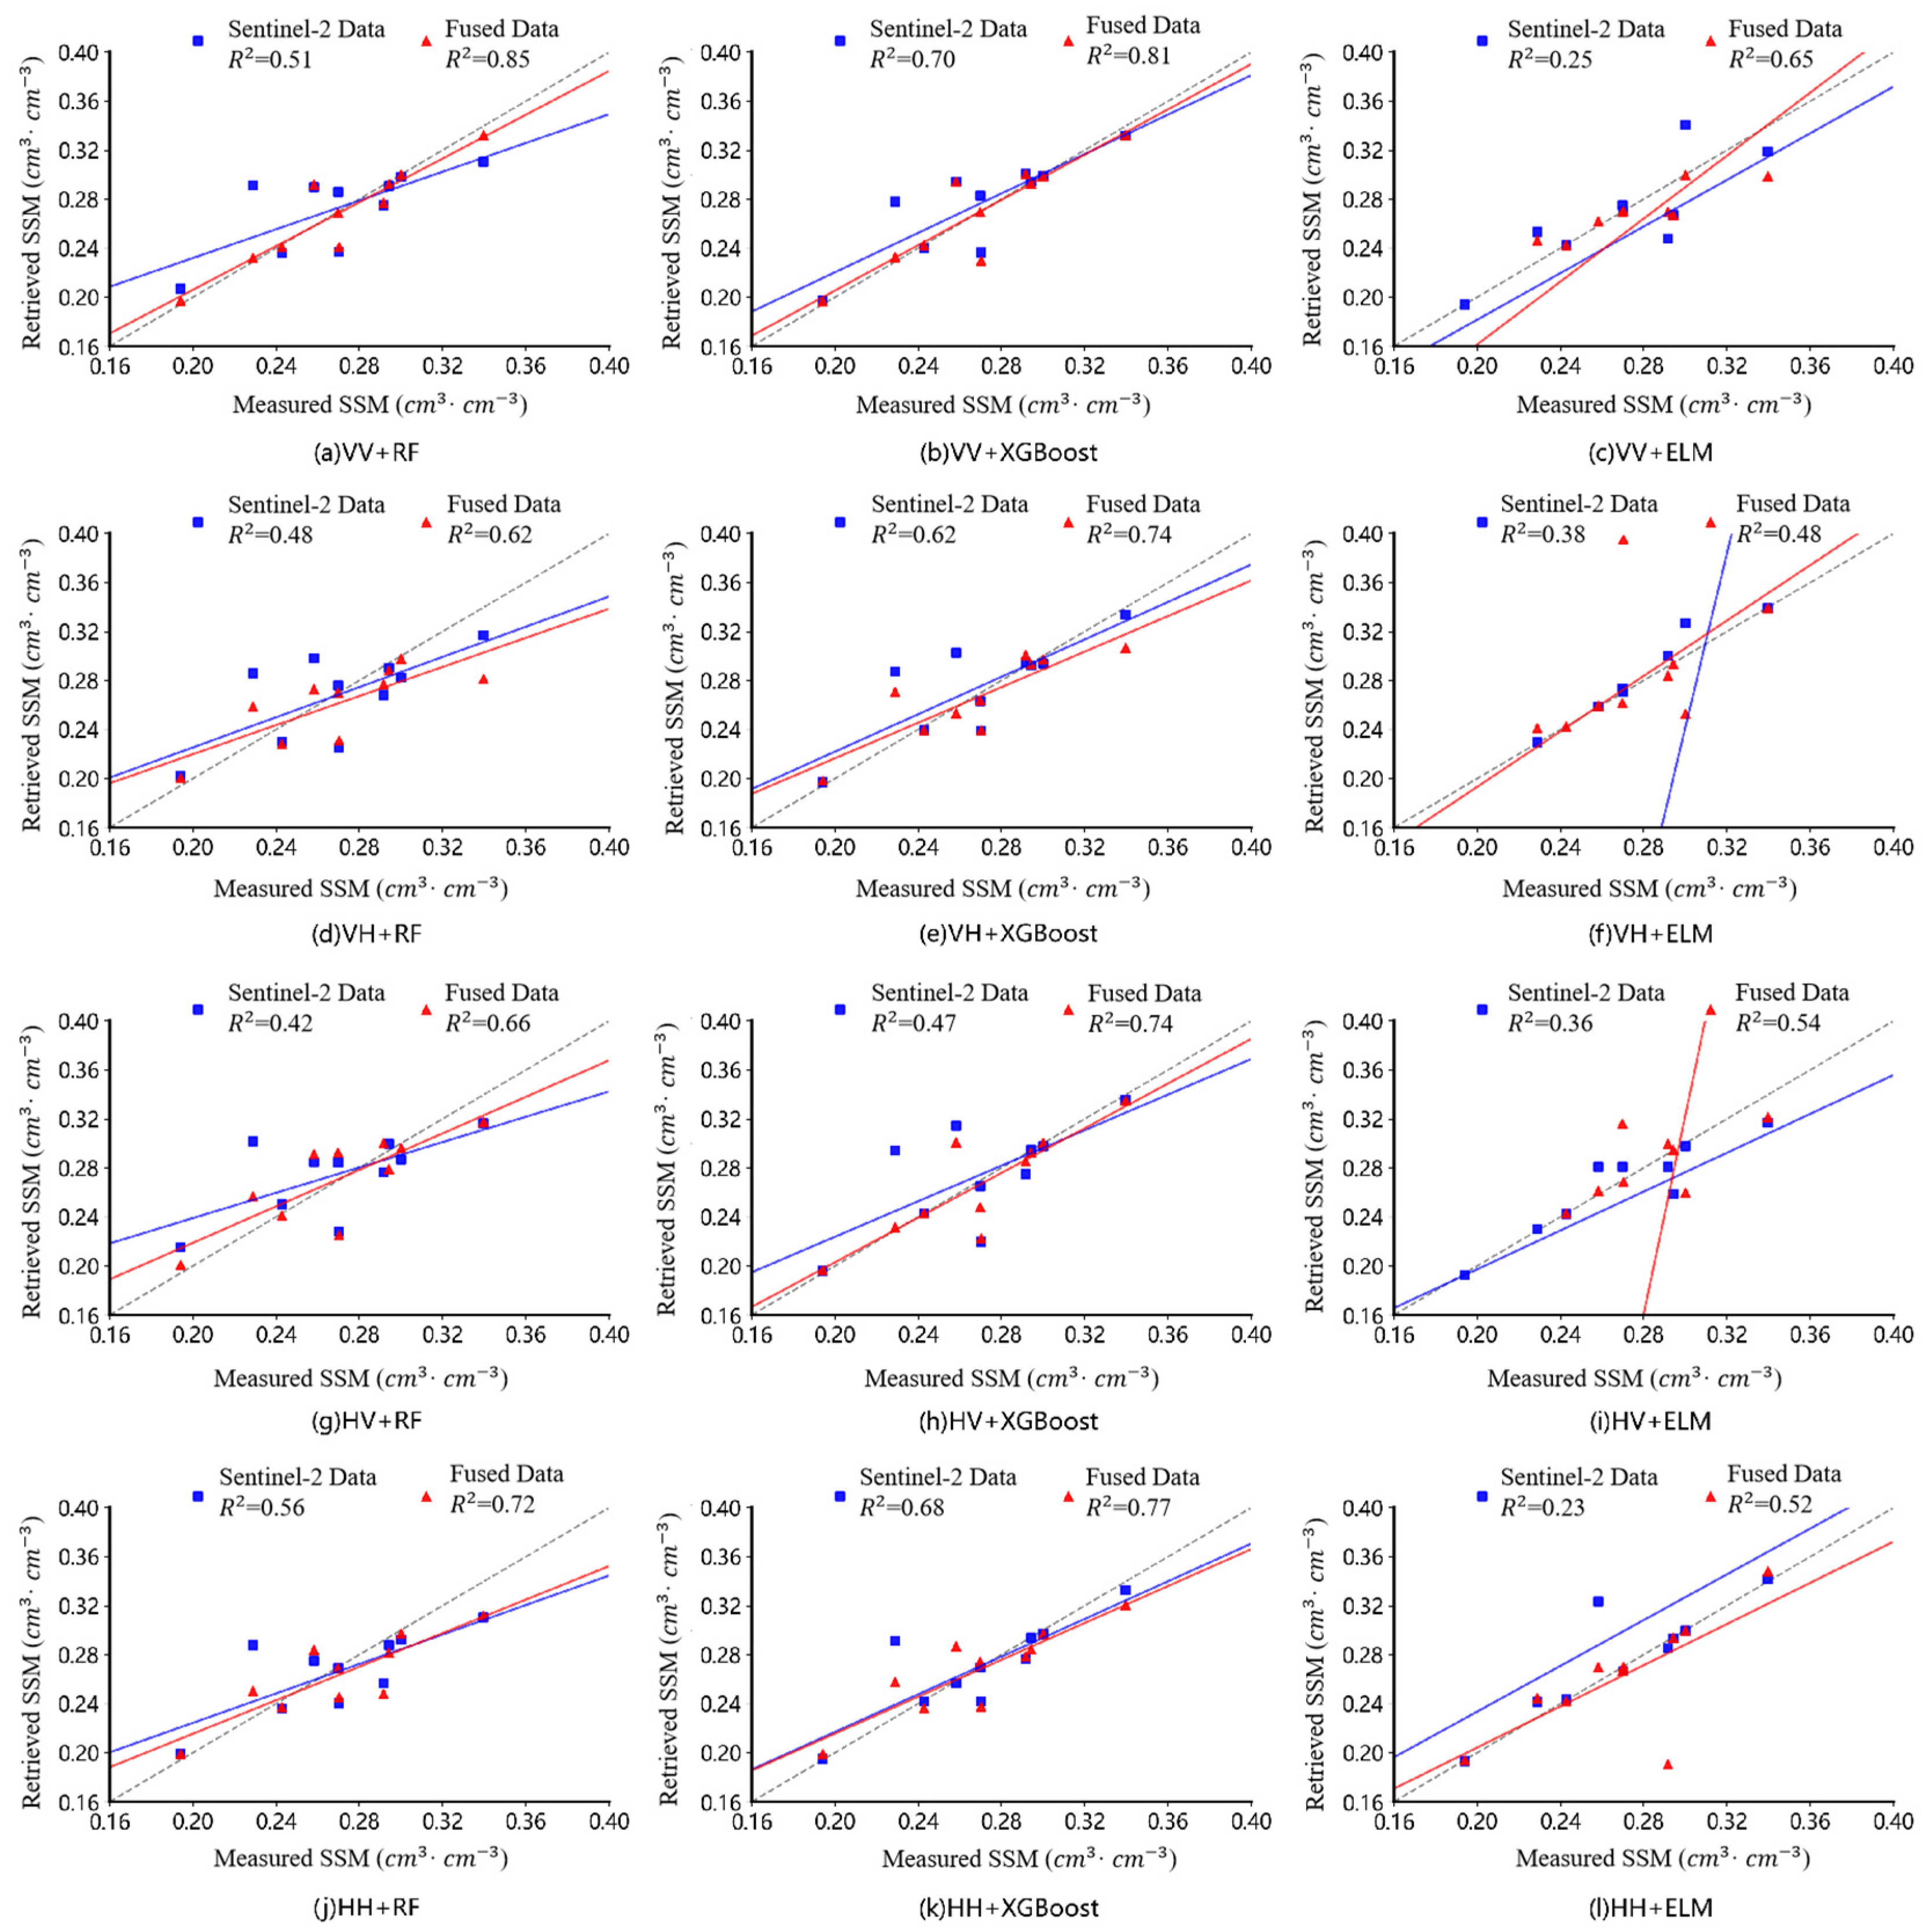
At 0–10 cm, the XGBoost model yielded the best performance under VH, HV, and HH, with R2 of 0.74, 0.74, and 0.77, RMSEs of 2.00%, 2.15%, and 1.86%, and MAEs of 1.37%, 1.30%, and 1.51%, respectively. The RF model ranked second in these three modes but achieved the highest R2 under VV (0.85), with an RMSE of 1.51% and MAE of 0.95%. The ELM model remained the weakest, with R2 exceeding 0.65 only under VV; for other polarizations, R2 ranged from 0.48 to 0.52.
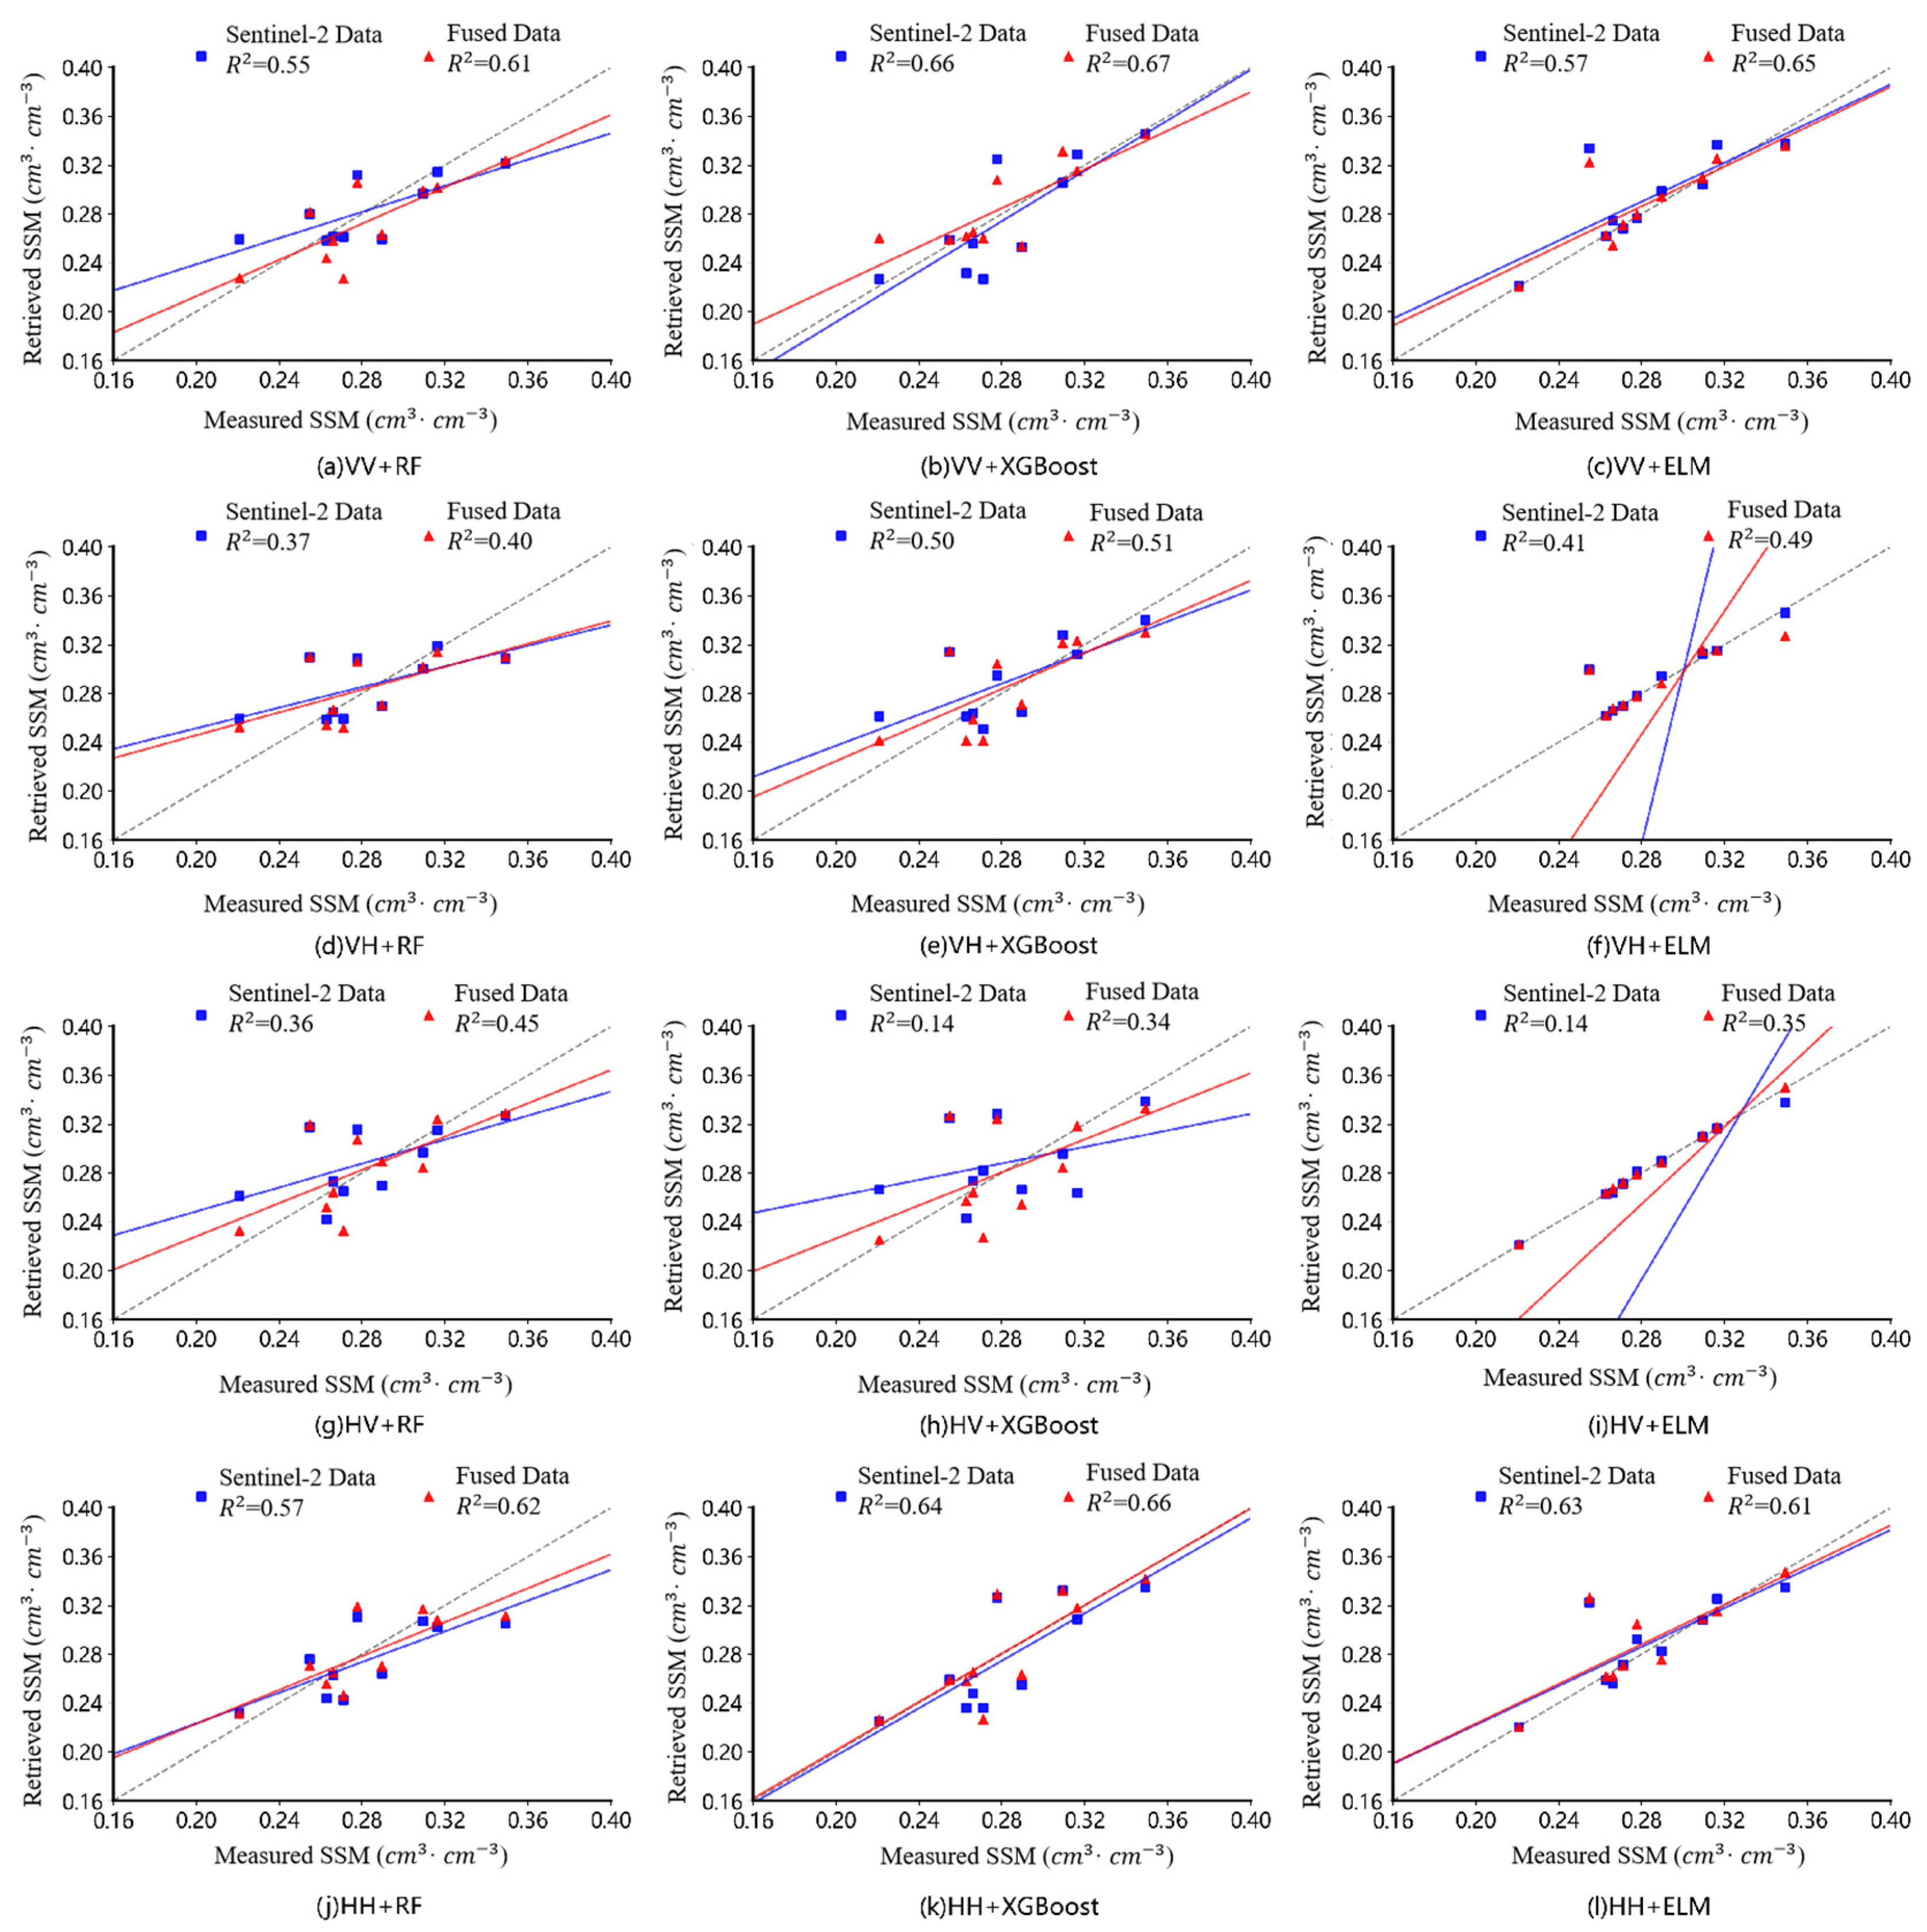
At 0–20 cm, XGBoost again showed the best performance under VV, VH, and HH, with R2 of 0.67, 0.51, and 0.66, RMSEs of 2.61%, 2.65%, and 2.44%, and MAEs of 1.98%, 2.22%, and 1.70%, respectively. The ELM model delivered comparable results under these three modes, with R2 of 0.65, 0.49, and 0.63, RMSEs of 2.24%, 3.73%, and 2.47%, and MAEs of 1.10%, 1.24%, and 1.20%, respectively. The RF model performed worst under these three polarizations but yielded its best result under HV (R2 = 0.45, RMSE = 2.82%, MAE = 2.11%). Under the same HV condition, XGBoost and ELM both performed worse than LR model, with R2 of only 0.34 and 0.35, RMSEs of 3.39% and 8.06%, and MAEs of 2.53% and 2.66%, respectively.

3.5. Overall Evaluation

To quantify the effect of data fusion, the R2 obtained using fused data were subtracted from those obtained using only Sentinel-2 data under the same soil depth, machine learning model, and polarization mode. The resulting differences are presented in Table 5.
From the perspective of soil depth, the increase in R2 was generally more pronounced at 0–10 cm than at 0–20 cm. For example, under VV, the R2 of the RF, XGBoost, and ELM models increased by 0.34, 0.10, and 0.40, respectively, at the 0–10 cm depth. In contrast, the corresponding increases at the 0–20 cm depth were only 0.06, 0.01, and 0.07. From the perspective of polarization mode, VV and HV yielded more substantial improvements in R2 compared to VH and HH when fused data were used. From the perspective of machine learning model type, the RF and ELM models experienced greater improvements in R2 after introducing fused data, while the XGBoost model showed relatively smaller gains.
Figure 3 and Figure 4 compare the predicted SSM with the measured values under two soil depths, using different data sources combined with four polarization modes and three machine learning models.
The results indicate that, across all machine learning models, the retrieval accuracy using fused data is consistently higher than that using Sentinel-2 data alone. This suggests that integrating UAV multispectral data with satellite-based multispectral imagery improves the accuracy of SSM.
In terms of trends, the predicted values from all models show a positive correlation with the measured values. For both soil depths, the RF and XGBoost models demonstrate good fitting performance and do not produce unreasonable negative values. However, the ELM model occasionally yields negative predictions, indicating potential instability in some cases.

4. Discussion

Remote sensing data acquired from different platforms vary in spatial and temporal resolution, which leads to differences in SSM retrieval accuracy. The results of this study indicate that, compared with the combination of single-satellite data and MiniSAR data, the integration of fused data with MiniSAR data generally improved the accuracy of winter wheat SSM retrieval.
For LR models using single-polarization data, the retrieval accuracy was generally improved when applying the three machine learning algorithms—RF, XGBoost, and ELM. This improvement can be attributed to the complex nonlinear relationship between backscattering coefficients and SSM, which machine learning algorithms are capable of handling more effectively [35,36,37], thereby enhancing retrieval performance.
When fused data were introduced into the three machine learning algorithms, the accuracy improvement of XGBoost was smaller than that of RF, and both were considerably lower than that of ELM. This suggests that XGBoost may have already fully exploited the information content of the original data, whereas RF and ELM are more sensitive to the increased dimensional richness of the input data and thus benefited more from data fusion. In addition, when using Sentinel-2 satellite data combined with different polarization modes, the R2 for different soil depths were generally in the range of 0.40–0.50. After applying fused data, the R2 values increased to 0.50–0.70 across soil depths, while RMSE and MAE exhibit a clear decreasing trend. These findings demonstrate that fused data achieve higher retrieval accuracy compared with single-satellite data, as fusion methods leverage the complementary strengths of different remote sensing platforms, offering both relatively broad spatial coverage and higher spatial resolution.
In addition, the fitting performance of each model was generally better for co-polarizations (VV and HH) than for cross-polarizations (VH and HV). Among the co-polarizations, VV consistently outperformed HH, while VH and HV showed comparable results within the cross-polarizations. These findings are broadly consistent with previous studies [38,39]. Differences were also observed across polarization modes (VV, VH, HV, HH). The mean increases in R2 under VV, VH, HV, and HH were 0.16, 0.08, 0.20, and 0.11, respectively. This indicates that VV and HV are more sensitive and thus more suitable for SSM retrieval from fused data compared with VH and HH.
By comparing retrieval performance at different depths, this study found that 0–10 cm generally outperformed 0–20 cm. At the 0–10 cm depth, the mean increases in R2 across the three models were 0.22, 0.15, and 0.25 when fused data were used, whereas at the 0–20 cm depth, the corresponding improvements were only 0.06, 0.06, and 0.10, respectively. These results suggest that shallow SSM was more strongly influenced by the combined effects of fused data and backscattering signals. A possible explanation is that data fusion enhances vegetation spectral information, thereby improving the performance of the modified WCM.
This study still has certain limitations that warrant further investigation. First, only single-polarization modes were used for retrieval analysis, without exploring the effects of combined polarization inputs (e.g., polarization combinations such as the HH/VV ratio, which has been shown to be particularly sensitive to soil moisture variations) [40]. Second, although the simplified modified WCM adopted in this study proved effective for the current application, it does not explicitly account for polarization-dependent vegetation scattering. Future studies could therefore explore polarization-specific vegetation scattering models to further improve the accuracy of vegetation correction and soil backscatter extraction, particularly for crops with strong structural anisotropy. Finally, environmental factors such as soil type, terrain variation, solar radiation intensity, land surface temperature, and absolute humidity were not systematically considered, although they may collectively influence the spatiotemporal dynamics of SSM [41,42,43].

5. Conclusions

Taking Hebi City, a representative winter wheat cultivation area in Henan Province, as the study area, this research investigated the potential of SSM retrieval in wheat fields using (i) single-satellite spectral data and (ii) fused spectral data from satellite and UAV, each combined with L-band MiniSAR data. Soil backscattering coefficients were extracted, and vegetation effects were reduced using the modified WCM. Three machine learning algorithms—RF, XGBoost, and ELM—were then applied to retrieve field-scale SSM under different polarization modes (VV, VH, HV, HH). The main conclusions of this study can be summarized as follows:
(1)
By comparing the SSM retrieval results from two data sources across three machine learning models, it was found that models built with fused data consistently outperformed those based on Sentinel-2 satellite data. For both fused and Sentinel-2 data, the XGBoost model performed best, followed by RF, while ELM showed the lowest accuracy.
(2)
At 0–10 cm, the optimal retrieval configuration was the fused data with VV combined with the RF model, achieving an R2 of 0.85, an RMSE of 1.51%, and an MAE of 0.95%. At 0–20 cm, the best combination was fused data with VV and the XGBoost model, with an R2 of 0.67, an RMSE of 2.61%, and an MAE of 1.98%.
(3)
The ELM model exhibited the largest accuracy improvement from fused data at both depths. At 0–10 cm under VV, R2 increased by 0.40, RMSE decreased by 2.45%, and MAE decreased by 1.28%. At 0–20 cm under HV, R2 increased by 0.21, RMSE decreased by 18.24%, and MAE decreased by 5.90%.

Author Contributions

Methodology, Z.L., C.Z., M.J. and X.Z. (Xianyu Zhang); Validation, Z.L.; Formal analysis, Y.W. and C.Z.; Investigation, Z.L., M.J. and X.Z. (Xingxing Zhu); Data curation, Z.L., Y.W., M.J. and X.Z. (Xingxing Zhu); Writing—original draft, Z.L.; Writing—review & editing, C.Z.; Supervision, Y.W., C.Z. and X.Z. (Xianyu Zhang); Project administration, Y.W., C.Z., M.J. and X.Z. (Xianyu Zhang); Funding acquisition, C.Z. and M.J. All authors have read and agreed to the published version of the manuscript.

Funding

This research was funded by National Natural Science Foundation of China (52579025), Natural Science Foundation of Henan (222300420539) and CMA-Henan Key Laboratory of Agrometeorological Support and Applied Technique (AMF202409).

Data Availability Statement

The raw data supporting the conclusions of this article will be made available by the authors on request.

Conflicts of Interest

The authors declare no conflicts of interest.

Abbreviations

The following abbreviations are used in this manuscript:
UAVUnmanned Aerial Vehicle
SSMSurface Soil Moisture
VWCVegetation Water Content
WCMWater Cloud Model
RFRandom Forest
XGBoostExtreme Gradient Boosting
ELMExtreme Learning Machine

References

  1. Vereecken, H.; Huisman, J.A.; Hendricks Franssen, H.J.; Brüggemann, N.; Bogena, H.R.; Kollet, S. Soil hydrology: Recent methodological advances, challenges, and perspectives. Water Resour. Res. 2015, 51, 2616–2633. [Google Scholar] [CrossRef]
  2. Miralles, D.G.; Teuling, A.J.; Heerwaarden, C.; De Arellano, J.V. Mega-heatwave temperatures due to combined soil desiccation and atmospheric heat accumulation. Nat. Geosci. 2014, 7, 345–349. [Google Scholar] [CrossRef]
  3. Seneviratne, S.I.; Corti, T.; Davin, E.L.; Hirschi, M.; Jaeger, E.B.; Lehner, I.; Orlowsky, B.; Teuling, A.J. Investigating soil moisture–climate interactions in a changing climate: A review. Earth-Sci. Rev. 2010, 99, 125–161. [Google Scholar] [CrossRef]
  4. Jiang, J.; Hu, D.; Li, Y.; Tang, X.; Li, J. Research of soil moisture retrieval model of wheat covered surface based on MIMICS model. J. Triticeae Crop. 2015, 35, 707–713. [Google Scholar]
  5. Brocca, L.; Tullo, T.; Melone, F.; Moramarco, T.; Morbidelli, R. Catchment scale soil moisture spatial–temporal variability. J. Hydrol. 2012, 422–423, 63–75. [Google Scholar] [CrossRef]
  6. Zribi, M.; Chahbi, A.; Shabou, M.; Lili-Chabaane, Z.; Duchemin, B.; Baghdadi, N.; Amri, R.; Chehbouni, A. Soil surface moisture estimation over a semi-arid region using ENVISAT ASAR radar data for soil evaporation evaluation. Hydrol. Earth Syst. Sci. 2011, 15, 345–358. [Google Scholar] [CrossRef]
  7. Dong, J.; Crow, W.T.; Tobin, K.J.; Cosh, M.H.; Bosch, D.D.; Starks, P.J.; Seyfried, M.; Collins, C.H. Comparison of microwave remote sensing and land surface modeling for surface soil moisture climatology estimation. Remote Sens. Environ. 2020, 242, 111756. [Google Scholar] [CrossRef]
  8. Wang, L.L.; Qu, J.J. Satellite remote sensing applications for surface soil moisture monitoring: A review. Front. Earth Sci. China 2009, 3, 237–247. [Google Scholar] [CrossRef]
  9. Adab, H.; Morbidelli, R.; Saltalippi, C.; Moradian, M.; Ghalhari, G.A.F. Machine Learning to Estimate Surface Soil Moisture from Remote Sensing Data. Water 2020, 12, 3223. [Google Scholar] [CrossRef]
  10. Sekertekin, A.; Marangoz, A.M.; Abdikan, S. ALOS-2 and Sentinel-1 SAR data sensitivity analysis to surface soil moisture over bare and vegetated agricultural fields. Comput. Electron. Agric. 2020, 171, 105303. [Google Scholar] [CrossRef]
  11. Bai, X.; Zhang, L.; He, C.; Zhu, Y. Estimating Regional Soil Moisture Distribution Based on NDVI and Land Surface Temperature Time Series Data in the Upstream of the Heihe River Watershed, Northwest China. Remote Sens. 2020, 12, 2414. [Google Scholar] [CrossRef]
  12. Soliman, A.; Heck, R.J.; Brenning, A.; Brown, R.; Miller, S. Remote Sensing of Soil Moisture in Vineyards Using Airborne and Ground-Based Thermal Inertia Data. Remote Sens. 2013, 5, 3729–3748. [Google Scholar] [CrossRef]
  13. Wang, J.; Ding, J.L.; Chen, W.Q.; Yang, A.X. Microwave modeling of soil moisture in oasis regional scale based on sentinel-1 radar images. J. Infrared Millim. Waves 2017, 36, 120–126. [Google Scholar]
  14. He, B.; Xing, M.; Bai, X. A Synergistic Methodology for Soil Moisture Estimation in an Alpine Prairie Using Radar and Optical Satellite Data. Remote Sens. 2014, 6, 10966–10985. [Google Scholar] [CrossRef]
  15. Temimi, M.; Leconte, R.; Chaouch, N.; Sukumal, P.; Khanbilvardi, R.; Brissette, F. A combination of remote sensing data and topographic attributes for the spatial and temporal monitoring of soil wetness. J. Hydrol. 2010, 388, 28–40. [Google Scholar] [CrossRef]
  16. Attarzadeh, R.; Amini, J.; Notarnicola, C.; Greifeneder, F. Synergetic Use of Sentinel-1 and Sentinel-2 Data for Soil Moisture Mapping at Plot Scale. Remote Sens. 2018, 10, 1285. [Google Scholar] [CrossRef]
  17. Bousbih, S.; Zribi, M.; El Hajj, M.; Baghdadi, N.; Lili-Chabaane, Z.; Gao, Q.; Fanise, P. Soil Moisture and Irrigation Mapping in A Semi-Arid Region, Based on the Synergetic Use of Sentinel-1 and Sentinel-2 Data. Remote Sens. 2018, 10, 1953. [Google Scholar] [CrossRef]
  18. Esmaeili Sarteshnizi, R.; Sahebi Vayghan, S.; Jazirian, I. Estimation of soil moisture using sentinel-1 and sentinel-2 images. ISPRS Ann. Photogramm. Remote Sens. Spatial Inf. Sci. 2023, X-4/W1-2022, 137. [Google Scholar] [CrossRef]
  19. Benninga, H.-J.F.; van der Velde, R.; Su, Z. Soil moisture content retrieval over meadows from Sentinel-1 and Sentinel-2 data using physically based scattering models. Remote Sens. Environ. 2022, 280, 113191. [Google Scholar] [CrossRef]
  20. Lu, F.; Sun, Y.; Hou, F. Using UAV Visible Images to Estimate the Soil Moisture of Steppe. Water 2020, 12, 2334. [Google Scholar] [CrossRef]
  21. Zhang, C.; Hou, J.; Wang, R.; Jiang, M.; Zhu, X. Soil Moisture Inversion for Winter Wheat Field Based on UAV Multispectral and Thermal Infrared Data. J. Zhengzhou Univ. Eng. Sci. (China) 2024, 45, 111–118. [Google Scholar] [CrossRef]
  22. Shokati, H.; Mashal, M.; Noroozi, A.; Abkar, A.A.; Mirzaei, S.; Mohammadi-Doqozloo, Z.; Taghizadeh-Mehrjardi, R.; Khosravani, P.; Nabiollahi, K.; Scholten, T. Random Forest-Based Soil Moisture Estimation Using Sentinel-2, Landsat-8/9, and UAV-Based Hyperspectral Data. Remote Sens. 2024, 16, 1962. [Google Scholar] [CrossRef]
  23. Walker, J.P.; Houser, P.R. Requirements of a global near-surface soil moisture satellite mission: Accuracy, repeat time, and spatial resolution. Adv. Water Resour. 2004, 27, 785–801. [Google Scholar] [CrossRef]
  24. Attema, E.P.W.; Ulaby, F.T. Vegetation modeled as a water cloud. Radio Sci. 1978, 13, 357–364. [Google Scholar] [CrossRef]
  25. Bindlish, R.; Barros, A.P. Parameterization of vegetation backscatter in radar-based, soil moisture estimation. Remote Sens. Environ. 2001, 76, 130–137. [Google Scholar] [CrossRef]
  26. Wang, S.G.; Ma, C.F.; Zhao, Z.; Wei, L. Estimation of Soil Moisture of Agriculture Field in the Middle Reaches of the Heihe River Basin based on Sentinel-1 and Landsat 8 Imagery. Remote Sens. Technol. Appl. 2020, 35, 13–22. [Google Scholar]
  27. Li, Y.; Zhang, C.C.; Luo, W.R. Study on inverting soil moisture of summer corn jointing stage with improved water-cloud model. Water Resour. Hydropower Eng. 2019, 50, 212–218. [Google Scholar]
  28. Breiman, L. Random Forests. Mach. Learn. 2001, 45, 5–32. [Google Scholar] [CrossRef]
  29. Tramblay, Y.; Quintana Seguí, P. Estimating soil moisture conditions for drought monitoring with random forests and a simple soil moisture accounting scheme. Nat. Hazards Earth Syst. Sci. 2022, 22, 1325–1334. [Google Scholar] [CrossRef]
  30. Biau, G.; Scornet, E. A random forest guided tour. TEST 2016, 25, 197–227. [Google Scholar] [CrossRef]
  31. Chen, T.; Guestrin, C. XGBoost: A Scalable Tree Boosting System. In Proceedings of the 22nd ACM SIGKDD International Conference on Knowledge Discovery and Data Mining, San Francisco, CA, USA, 13–17 August 2016; pp. 785–794. [Google Scholar] [CrossRef]
  32. Song, T.; Yan, Q.; Fan, C.; Meng, J.; Wu, Y.; Zhang, J. Significant Wave Height Retrieval Using XGBoost from Polarimetric Gaofen-3 SAR and Feature Importance Analysis. Remote Sens. 2023, 15, 149. [Google Scholar] [CrossRef]
  33. Xiao, D.; Vu, Q.H.; Le, B.T. Salt content in saline-alkali soil detection using visible-near infrared spectroscopy and a 2D deep learning. Microchem. J. 2021, 165, 106182. [Google Scholar] [CrossRef]
  34. Barzegar, R.; Moghaddam, A.A.; Deo, R.; Fijani, E.; Tziritis, E. Mapping groundwater contamination risk of multiple aquifers using multi-model ensemble of machine learning algorithms. Sci. Total Environ. 2018, 621, 697–712. [Google Scholar] [CrossRef]
  35. Yin, C.S.; Liu, Q.M.; Wang, C.J.; Wang, F.Q. Inversion of soil moisture by surface spectral measurement combined with active microwave remote sensing. Southwest China J. Agric. Sci. 2022, 35, 2595–2602. [Google Scholar]
  36. Li, H.; Zhong, Y.; Feng, Y.; Lin, Z.; Zhu, S. Multi-vegetation index soil moisture inversion model based on UAV remote sensing. J. Sel. Topics Appl. Earth Observ. Remote Sens 2024, 44, 207–214. [Google Scholar]
  37. Zhang, L.; Meng, Q.; Yao, S.; Wang, Q.; Zeng, J.; Zhao, S.; Ma, J. Soil Moisture Retrieval from the Chinese GF-3 Satellite and Optical Data over Agricultural Fields. Sensors 2018, 18, 2675. [Google Scholar] [CrossRef]
  38. Ouaadi, N.; Ezzahar, J.; Jarlan, L.; Khabba, S.; Frison, P.L. Synergy of Sentinel-1 and Sentinel-2 Satellites for Surface Soil Moisture Retrieval Over Wheat Crops in Semi-arid Areas. In Proceedings of the 3rd International Conference on Electronic Engineering and Renewable Energy Systems: ICEERE 2022, Saidia, Morocco, 20–22 May 2022; Lecture Notes in Electrical Engineering. Springer: Singapore, 2023; Volume 954, pp. 613–620. [Google Scholar] [CrossRef]
  39. Kim, S.b.; Arii, M.; Jackson, T. Modeling L-Band Synthetic Aperture Radar Data Through Dielectric Changes in Soil Moisture and Vegetation Over Shrublands. IEEE J. Sel. Top. Appl. Earth Obs. Remote Sens. 2017, 10, 4753–4762. [Google Scholar] [CrossRef]
  40. Zeng, X.; Xing, Y.; Shan, W.; Zhang, Y.; Wang, C. Soil water content retrieval based on Sentinel-1A and Landsat 8 image for Bei’an-Heihe Expressway. Chin. J. Eco-Agric. 2017, 25, 118–126. [Google Scholar]
  41. Acharya, U.; Daigh, A.L.M.; Oduor, P.G. Factors affecting the use of weather station data in predicting surface soil moisture for agricultural applications. Can. J. Soil Sci. 2022, 102, 419–431. [Google Scholar] [CrossRef]
  42. Jiang, K.; Pan, Z.; Pan, F.; Teuling, A.J.; Han, G.; An, P.; Chen, X.; Wang, J.; Song, Y.; Cheng, L.; et al. Combined influence of soil moisture and atmospheric humidity on land surface temperature under different climatic background. iScience 2023, 2, 106837. [Google Scholar] [CrossRef] [PubMed]
  43. Cai, J.F.; Zhao, W.; Ding, T.; Yin, G.F. Generation of High-Resolution Surface Soil Moisture over Mountain Areas by Spatially Downscaling Remote Sensing Products Based on Land Surface Temperature–Vegetation Index Feature Space. J. Remote Sens. 2025, 5, 0437. [Google Scholar] [CrossRef]
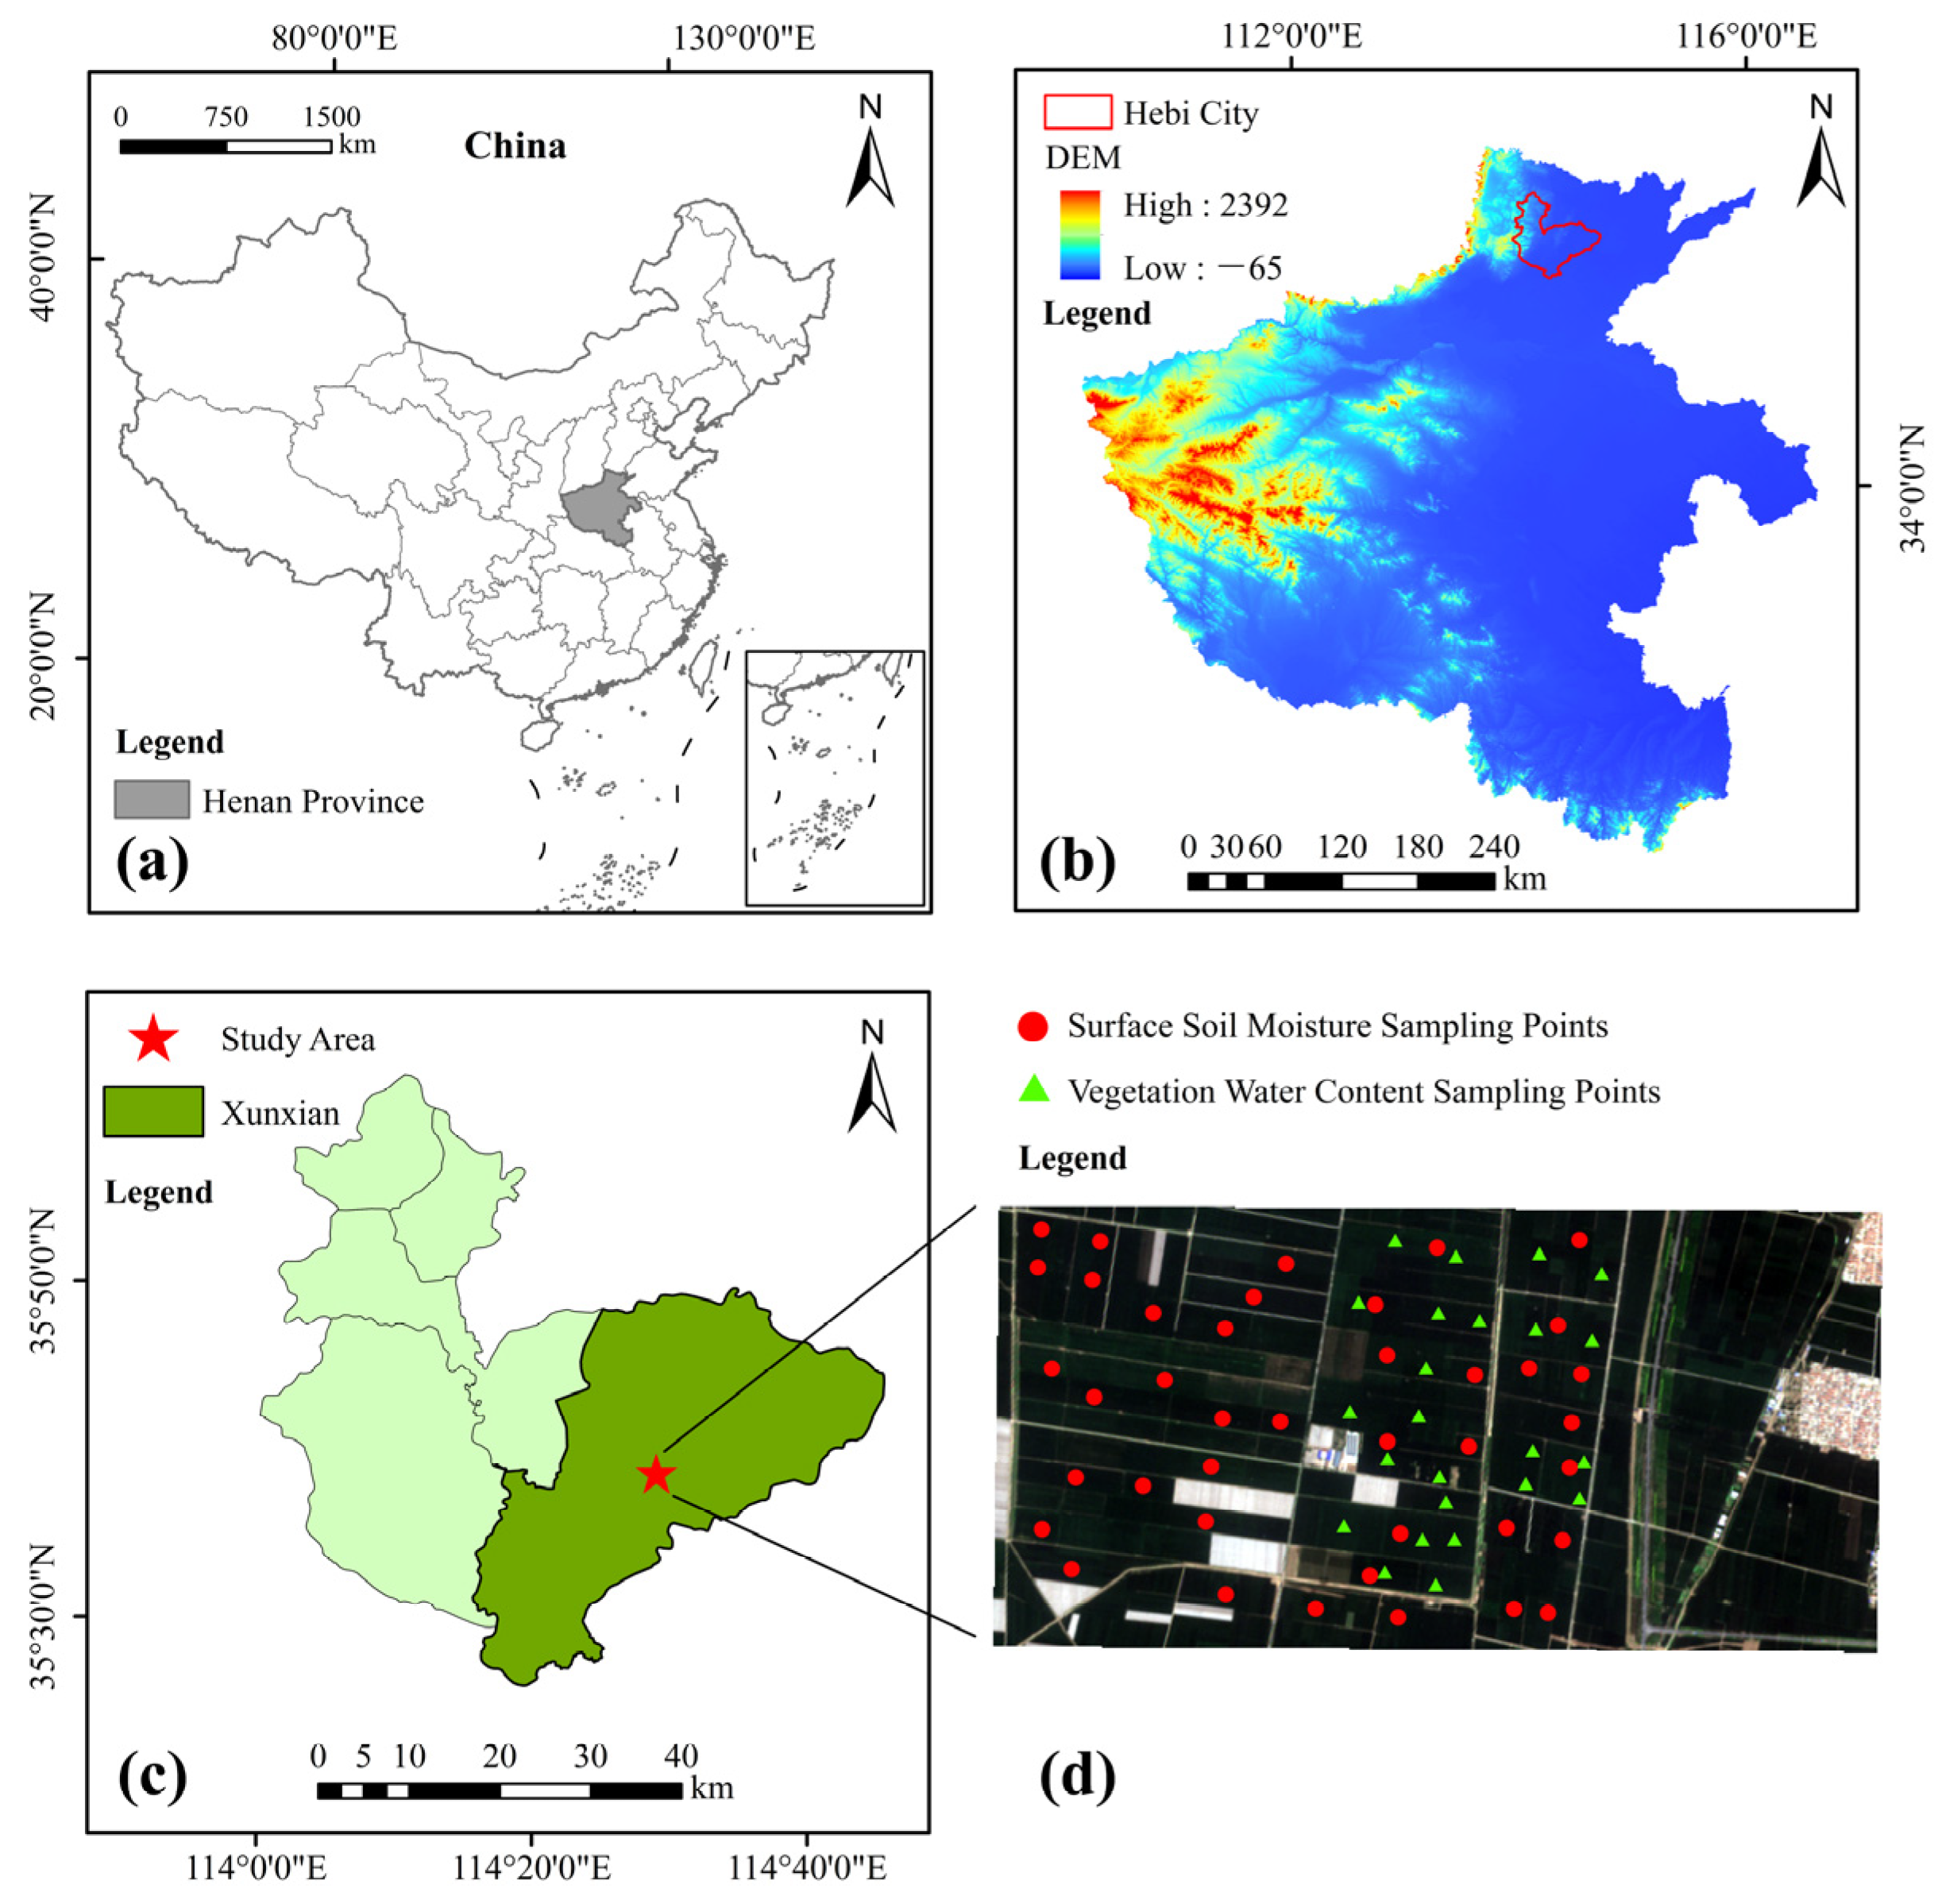
Figure 1. Study area and distribution of sampling points. Red circles and green triangles indicate the locations of SSM sampling points and vegetation water content (VWC) sampling points. (a) Location of Henan Province, China; (b) Digital Elevation Model (DEM) of Henan Province and location of the study area; (c) Location of the study area within Xunxian, Hebi City; (d) Satellite image of the study area showing the spatial distribution of sampling points.
Water 17 03345 g001
Figure 2. Flowchart of SSM retrieval process based on fused multispectral data and MiniSAR data.
Water 17 03345 g002
Figure 3. Scatter plots of measured and retrieved SSM at 0–10 cm, using two types of multispectral data combined with four polarization modes under three machine learning methods. The blue lines represent the fitted soil moisture retrieval curves at this depth using only Sentinel-2 optical data, whereas the red lines represent the fitted curves using fused Sentinel-2 and UAV optical data; the dashed line denotes the 1:1 goodness-of-fit line.
Water 17 03345 g003
Figure 4. Scatter plots of measured and retrieved SSM at 0–20 cm, using two types of multispectral data combined with four polarization modes under three machine learning methods. The blue lines represent the fitted soil moisture retrieval curves at this depth using only Sentinel-2 optical data, whereas the red lines represent the fitted curves using fused Sentinel-2 and UAV optical data; the dashed line denotes the 1:1 goodness-of-fit line.
Water 17 03345 g004
Table 1. Statistics of SSM content at sampling points.
DepthSample SizeMinMaxMeanSD95% CI
0–10 cm4019.4033.9526.573.6625.40~27.75
0–20 cm4022.0835.0527.963.4026.87~29.04
Note: The minimum, maximum, mean, standard deviation, and 95% confidence interval values are expressed as percentages (%).
Table 2. Results of SSM retrieval based on LR model.
Depth
/cm
WCM σ s V V ( θ ) σ s V H ( θ ) σ s H V ( θ ) σ s H H ( θ )
R 1 2 R M S E 1 M A E 1 R 2 2 R M S E 2 M A E 2 R 3 2 R M S E 3 M A E 3 R 4 2 R M S E 4 M A E 4
10Original 0.293.642.900.123.672.890.133.753.000.233.612.84
Modified 0.473.732.930.294.243.670.253.873.020.403.512.66
20Original 0.173.292.580.233.192.460.243.212.590.233.232.56
Modified 0.483.232.600.353.102.420.393.312.750.413.052.42
Note: RMSE and MAE in the table are expressed as percentages (%).
Table 3. Results of SSM retrieval based on Sentinel-2 satellite data.
Depth
/cm
Model N D V I + σ s V V ( θ ) N D V I + σ s V H ( θ ) N D V I + σ s H V ( θ ) N D V I + σ s H H ( θ )
R 1 2 R M S E 1 M A E 1 R 2 2 R M S E 2 M A E 2 R 3 2 R M S E 3 M A E 3 R 4 2 R M S E 4 M A E 4
10RF0.512.772.140.482.922.350.423.092.430.562.621.94
XGBoost0.702.291.570.622.571.640.473.222.030.682.241.18
ELM0.256.703.620.384.952.580.364.562.420.237.243.12
20RF0.552.291.880.372.702.110.362.932.290.572.362.01
XGBoost0.662.101.490.502.631.970.143.713.050.642.582.17
ELM0.572.641.390.4110.84.150.1426.38.560.612.291.28
Note: RMSE and MAE in the table are expressed as percentages (%).
Table 4. Results of SSM retrieval based on fused data.
Depth
/cm
Model N D V I + σ s V V ( θ ) N D V I + σ s V H ( θ ) N D V I + σ s H V ( θ ) N D V I + σ s H H ( θ )
R 1 2 R M S E 1
(%)
M A E 1
(%)
R 2 2 R M S E 2
(%)
M A E 2
(%)
R 3 2 R M S E 3
(%)
M A E 3
(%)
R 4 2 R M S E 4
(%)
M A E 4
(%)
10RF0.851.510.950.622.551.850.662.301.870.722.151.69
XGBoost0.811.761.010.742.001.370.742.151.300.771.861.51
ELM0.654.252.340.484.582.550.544.502.110.523.261.41
20RF0.612.362.080.402.782.130.452.822.110.622.161.73
XGBoost0.672.611.980.512.652.220.343.392.530.662.441.70
ELM0.652.241.100.493.731.240.358.062.660.632.471.20
Note: RMSE and MAE in the table are expressed as percentages (%).
Table 5. Results of R2 improvement based on fused data.
Depth/cmModel R V V 2 R V H 2 R H V 2 R H H 2
0–10RF0.340.140.240.17
XGBoost0.100.120.270.09
ELM0.400.110.180.29
0–20RF0.060.030.090.05
XGBoost0.010.020.200.02
ELM0.070.080.210.02
Disclaimer/Publisher’s Note: The statements, opinions and data contained in all publications are solely those of the individual author(s) and contributor(s) and not of MDPI and/or the editor(s). MDPI and/or the editor(s) disclaim responsibility for any injury to people or property resulting from any ideas, methods, instructions or products referred to in the content.