Article

Investigation of the Impact of Improving the Hydrological Quality of Permeable Asphalt Pavement Based on the SWMM

by
Dingbing Wei
1,2,
Jinwei Xu
2,
Qiang Liu
2,3,
Sheng Gu
4,
Yanwen Lv
2 and
Jianguang Xie
2,*
1
College of Civil Engineering, Jiangsu Open University, Nanjing 210036, China
2
Department of Civil and Airport Engineering, Nanjing University of Aeronautics and Astronautics, Nanjing 211106, China
3
Jiangsu Sinoroad Engineering Technology Research Institute Co., Ltd., Nanjing 211806, China
4
Kunshan Construction Engineering Quality Testing Center Co., Ltd., Suzhou 215337, China
*
Author to whom correspondence should be addressed.
Water 2025, 17(23), 3347; https://doi.org/10.3390/w17233347 (registering DOI)
Submission received: 24 September 2025 / Revised: 30 October 2025 / Accepted: 19 November 2025 / Published: 22 November 2025
(This article belongs to the Section Urban Water Management)

Abstract

To address the severe urban flooding and the inability of urban road drainage systems to effectively resolve hydrological cycle issues, four types of permeable pavement were designed, combining the advantages of the good infiltration performance and anti-slip performance of permeable asphalt pavement. Based on the SWMM (Storm Water Management Model), road modeling and hydrological quality simulations were conducted, analyzing the surface runoff reduction rate, maximum inlet flow at the convergence node, pollutant reduction rate, and water quality purification of the four different structural permeable asphalt pavements. The results showed that the surface runoff reduction rate of the four pavements ranged from 44% to 100%, the maximum inlet flow reduction rate at the confluence node ranged from 37% to 78%, the reduction rate of the main pipe flow load ranged from 36% to 100%, the reduction rate of the hydraulic load in the pipeline ranged from 25% to 64%, the maximum water storage depth ranged from 90 mm to 177 mm, and the pollutant reduction rate ranged from 28% to 81%. This study provides the optimal combination of permeable asphalt pavements for the selection of urban pavement structures.

1. Introduction

A sponge city [1,2] refers to an urban system that has good ‘infiltration, detention, storage, purification, utilization and drainage’ functions when dealing with rainfall, much like a sponge. A sponge city can absorb, store, infiltrate and purify rainwater during rainfall, releasing and utilizing it when needed [3,4]. This represents a new model of urban stormwater management [5,6,7] and is an important component of ecological civilization construction. Traditional rigid pavements and semi-rigid pavements are unable to meet urban drainage and flood control requirements when extreme weather occurs frequently. Permeable asphalt pavements [8,9,10,11] can serve as a sponge within sponge cities, regulating stormwater runoff and removing certain pollutants while fulfilling road surface functional requirements.
The main advantages of permeable asphalt pavements are runoff regulation and hydrologic conditioning properties. Zhou et al. [12] concluded that permeable pavements enhance ecological–hydrological effects by improving permeability, facilitating resource recycling, and preventing pollution. Not only could they increase rainwater infiltration and purify surface runoff, but they also absorbed noise and promoted evaporative cooling, serving as an effective measure to mitigate urban flooding and the heat island effect. Yang et al. [13] observed that water-retaining asphalt exhibited excellent runoff retention and infiltration rates across three distinct pavement gradients: 0°, 3°, and 5°. While the water-retaining asphalt specimens demonstrated favorable permeation rates on horizontal surfaces, their permeation rates diminished at steeper pavement gradients. Nina et al. [14] investigated whether porous asphalt pavements, typically employed for enhanced noise reduction and drainage capabilities, could also improve air quality. The findings revealed significantly lower PM10 concentrations across all meteorological conditions on porous asphalt surfaces. Particulate emissions measured behind vehicle wheels were likewise reduced. Jiang et al. [15] concluded that fully permeable pavements could control the pollution of rainwater runoff and had certain ecological effects. Chen et al. [16] employed the Particle-Flushing Method (PFC) to simulate the pore characteristics and siltation process of permeable asphalt mixtures. The study identified a critical silt particle size range of 0.3–0.6 mm. Road noise measurements revealed a direct proportional relationship between road noise levels and the degree of clogging in permeable pavements.
As the recurrence period of rainfall is difficult to artificially control in terms of probability, simulation methods are employed to predict the effectiveness of permeable pavements in terms of seepage and pollutant interception. The Storm Water Management Model (SWMM), which provides a variety of infiltration models, is one of the most widely used and well-studied pieces of hydrologic, hydraulic, and water quality simulation software. Qin et al. [17] and Luan et al. [18] utilized the SWMM to evaluate Low Impact Development (LID) strategies in drainage sewer modeling. Zhang et al. [19] considered the groundwater in the states of Washington and Maryland, USA, based on the SWMM and analyzed the runoff reduction effect by applying LID. Qin et al. [20] employed the SWMM to assess surface runoff and pollutant accumulation (suspended solids, chemical oxygen demand, total nitrogen, and total phosphorus) under varying storm conditions. The study found that Low Impact Development (LID) measures significantly reduced peak flow and pollutant loads, effectively promoting the sustainable utilization of urban stormwater resources. Jia et al. [21] investigated the accuracy of SWMM-LID in simulating rainwater harvesting systems that draw water solely during dry periods. The study found that SWMM’s rain barrel LID module requires refinement to accurately model scenarios where water is used exclusively during drought conditions. Alternatively, modelling rain barrels as sub-catchment areas could be employed to evaluate their stormwater control performance. Helene et al. [22] investigated LID efficiency for past and future climates in central Germany. Their research indicates that implementing LID across at least 50% of available impermeable surfaces yields increasing benefits with higher implementation rates whilst exhibiting an inverse relationship with building density.
Previous SWMM-based studies rarely compared the hydrologic and water quality impacts of different pavement structures. In this study, the SWMM was employed to model both conventional pavements and four types of permeable asphalt pavements. First, the reduction rates of surface runoff, maximum inlet flow at sink nodes, and pipe hydraulic loading were comparatively analyzed for conventional and permeable pavements under various rainfall recurrence periods. Subsequently, water quality simulations were conducted using SWMM to evaluate the pollutant reduction performance of the four permeable asphalt pavements within a single subcatchment and relative to the conventional pavement across different recurrence periods. Finally, the relatively optimal permeable pavement structure was identified as suitable for application on urban pavements.

2. Model Construction

2.1. Permeable Pavement Structure

Semi-permeable asphalt pavements typically require the incorporation of a waterproof sealer either at the bottom of the base layer or between the upper and lower base layers [23]. The inclusion of this sealer prevents water within the pavement structure from infiltrating into the underlying layers, thereby improving the stability of the structure beneath the sealer. As shown in Figure 1a,b, two semi-permeable asphalt pavement structures were designated as SPAP1 and SPAP2, respectively. SPAP1, from top to bottom, consists of a Polymer Asphalt Concrete-Grade 13 (PAC-13) upper layer, a Polymer Asphalt Concrete-Grade 20 (PAC-20) lower layer, an asphalt-stabilized crushed stone upper layer, a water-insulating sealer, a dense cement-stabilized crushed stone sub-base, and a soil base, which takes into account the structural load-bearing capacity of the roadway and the drainage performance. SPAP2, from top to bottom, consists of a PAC-13 upper layer, a PAC-20 lower layer, an asphalt-stabilized crushed stone upper layer, a porous cement-stabilized crushed stone sub-base, a water barrier sealer, a sand bedding, and a soil base to maximize its permeability properties.
Compared with semi-permeable asphalt pavements, fully-permeable asphalt pavements [24,25,26] exhibit higher capacities for infiltration, storage, and drainage of precipitation. However, their load-bearing capacity and deformation resistance often do not meet the requirements for urban pavements. In the design of fully permeable asphalt pavement, the bearing capacity, stability, and deformation resistance should be emphasized. As shown in Figure 1c, PAP1 is composed of a PAC-13 upper layer, a PAC-20 lower layer, a cement-stabilized gravel upper layer, a graded gravel sub-base layer, a permeable geotextile isolation layer, and a soil base. This configuration is designed to maximize the permeability of the pavement structure while also considering its load-bearing capacity. In Figure 1d, PAP2 consists of a PAC-13 upper layer, a PAC-20 lower layer, a porous cement concrete upper layer, a porous cement-stabilized gravel sub-base, a permeable geotextile barrier layer, and a soil base.

2.2. SWMM

The SWMM5.1 (Storm Water Management Model) is employed to establish a dynamic rainfall–runoff model [27,28,29], primarily used to simulate precipitation, runoff, and pollutant loads from a single rainfall event in urban areas, corresponding respectively to the hydrologic, hydraulic, and water quality modules. In the analysis of surface runoff, both the runoff generation and concentration processes are considered. The entire area is divided into several subcatchments, each treated as an independent hydrologic unit with a single outlet collecting surface runoff generated within it. Runoff processes are calculated separately for each subcatchment based on their characteristics, and the overall runoff hydrograph of the entire area is obtained by superimposing these individual results along the flow paths. After delineating the subcatchments, road surface runoff is assigned to the corresponding drainage nodes of the stormwater network.
According to the permeability of the underlying surface, each subcatchment was divided into pervious and impervious areas. Surface water in the pervious areas infiltrated downward, with the infiltration volume determined by the soil infiltration model within the SWMM. The software incorporated three main infiltration models [30,31,32,33]: the Horton model, the Green–Ampt model, and the SCCS-CN model. Based on their applicability, the Horton infiltration model was adopted in this study.
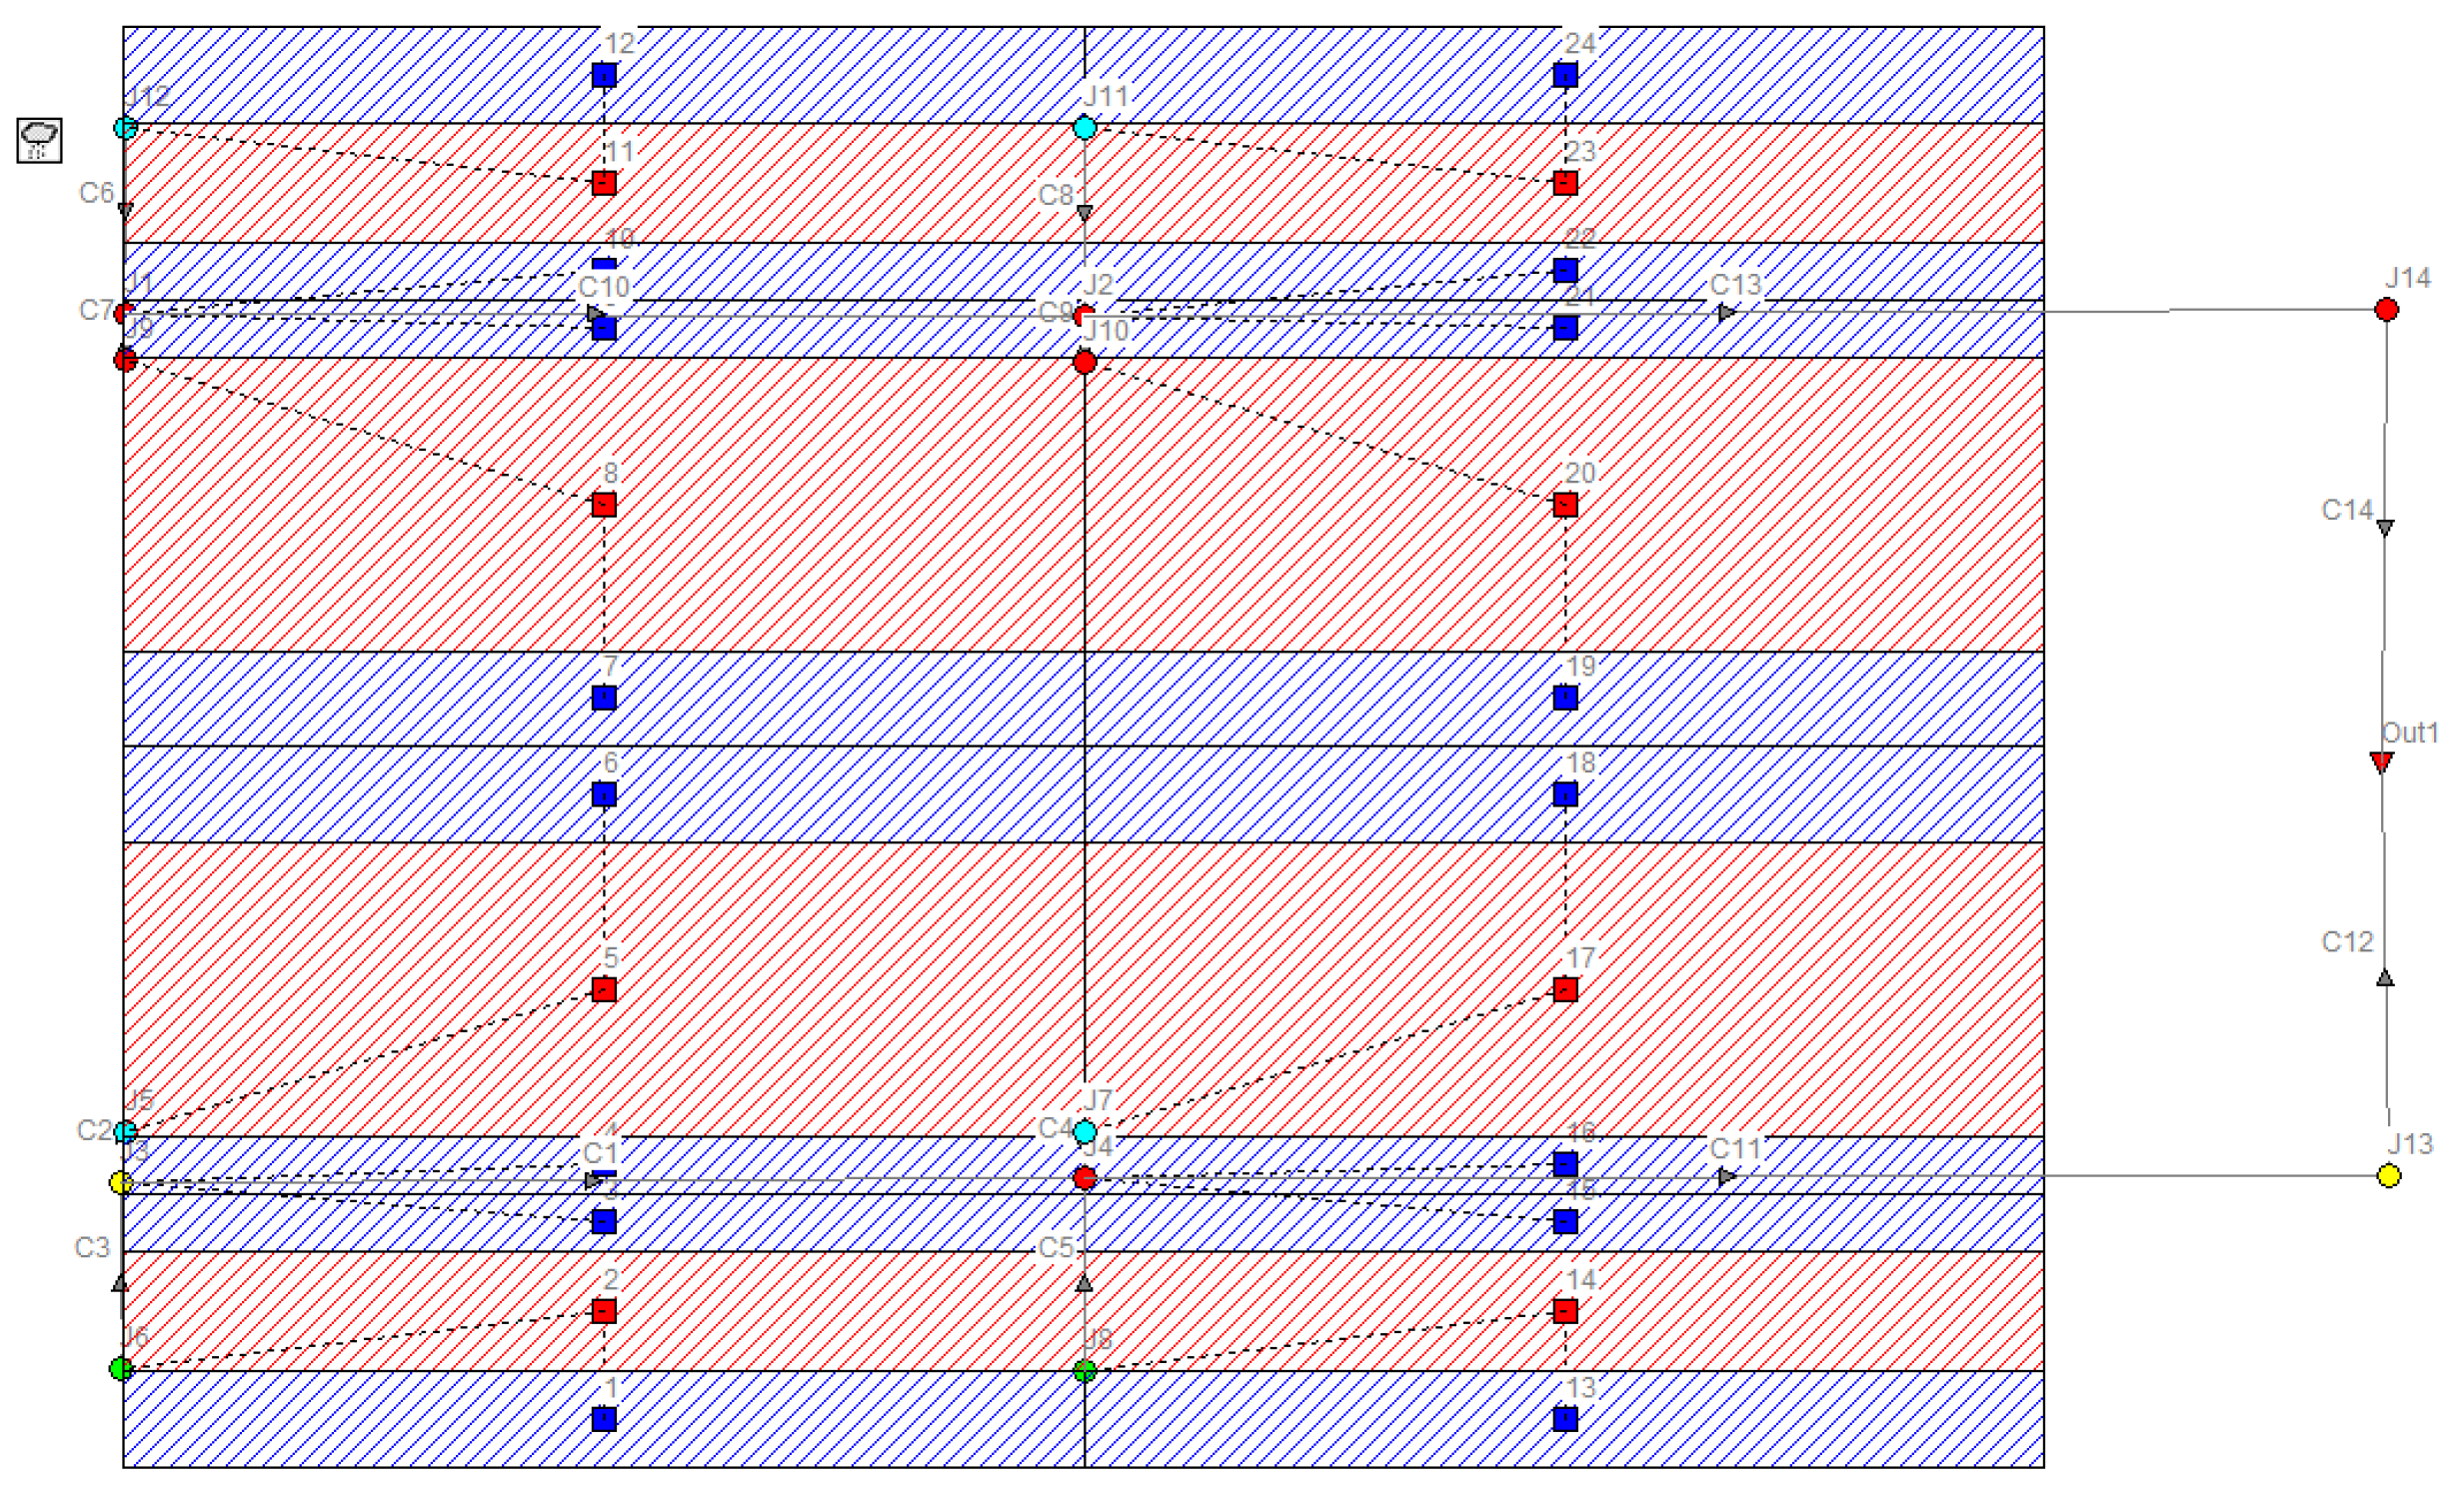
The sub-catchments of the roadway stormwater model were delineated according to the cross-sectional composition of the road, each consisting of a single type of underlying surface. The spacing between inlets and manholes was generally set to 40 m; therefore, a 40 m road segment was considered a single stormwater runoff unit. To ensure representativeness, the total road length in the study area was set to 80 m, i.e., twice the typical runoff unit length. As shown in Figure 2, zones 1 to 24 represented distinct drainage catchment areas for different carriageways; J1 to J14 denoted road surface inlet points; C1 to C14, connecting different inlet points, constituted the road surface pipeline network, with C1, C10, C11, and C13 being municipal stormwater pipes; and Out1 was the outlet.

2.3. Parameter Setting

The catchment area parameters [34] required for the SWMM include hydrologic and hydraulic parameters. In contrast, the acquisition of hydrologic parameters was more challenging. These parameters included the puddle storage, Manning’s roughness, the maximum infiltration rate during the flow-producing stage, the minimum infiltration rate, and the attenuation index.

2.3.1. Catchment Area Parameters

(1)
The node depth was specified as 2 m, with the internal bottom elevation ranging between 15 m and 20 m. The overloading depth was set to 1 m, and the water storage area was defined as 100 m2. The discharge node was not configured without an anti-tide gate, and the outlet type was selected as free discharge. The pipe cross-sectional area was modeled as circular, with a maximum depth of 1 m. The roughness coefficient was 0.015.
(2)
Puddle storage refers to the depth of water accumulated in the surface depressions [35], which can be classified into puddle storage for permeable areas and impermeable areas. For permeable pavements, such as permeable asphalt, the puddle storage is primarily influenced by the mean tectonic depth (MTD) of the pavement surface. Accordingly, the initial puddle storage was set to 1.9 mm for impermeable surfaces and 4.50 mm for permeable surfaces.
(3)
Manning’s roughness coefficient, also known as the Manning coefficient, represents the hydraulic resistance of the road surface or pipe wall to water flow [36]. It includes coefficients for permeable zones, impermeable zones, and the pipe network. The recommended values from the SWMM and the model-adopted values are summarized in Table 1.

2.3.2. Infiltration Model Parameters

(1)
The maximum infiltration rate was defined as the infiltration value at the onset of rainfall [37], which depended on the initial water content of the soil and was therefore difficult to estimate. For clay soils with dense vegetation, the maximum infiltration rate was represented by a value of 2 in/h, which was about 51 mm/h.
(2)
Minimum infiltration rate [38]: The minimum infiltration rate used the hydraulic conductivity of the saturated soil, which was the hydraulic conductivity of the soil at saturated conditions. The value is usually set as the saturated hydraulic conductivity of the soil, and the saturated hydraulic conductivity of the pulverized clay soil was 0.02 in/h, which was about 0.5 mm/h.
(3)
Decay coefficient: This parameter refers to the rate of decline of the infiltration rate from the maximum initial value to the minimum value. Typical values range from 2 to 7, and the attenuation coefficient was set at 5.
(4)
Drainage time (days): This parameter indicates the time required for fully saturated soil to drain completely. Typical values range from 2 to 14 days. In this paper, the drainage time was taken as 10.

2.3.3. LID Parameter Settings

After formulating the study area and establishing the corresponding SWMM, the LID control editor [39,40,41] within the software was used to configure the LID parameters for the motorway area. In this paper, permeable asphalt pavement was studied, so the LID type of the motorway area was set as permeable pavement. The specific parameter settings are presented in Table 2.

3. Results and Discussion

3.1. Hydrological Simulation Results

3.1.1. Surface Runoff Reduction Effect

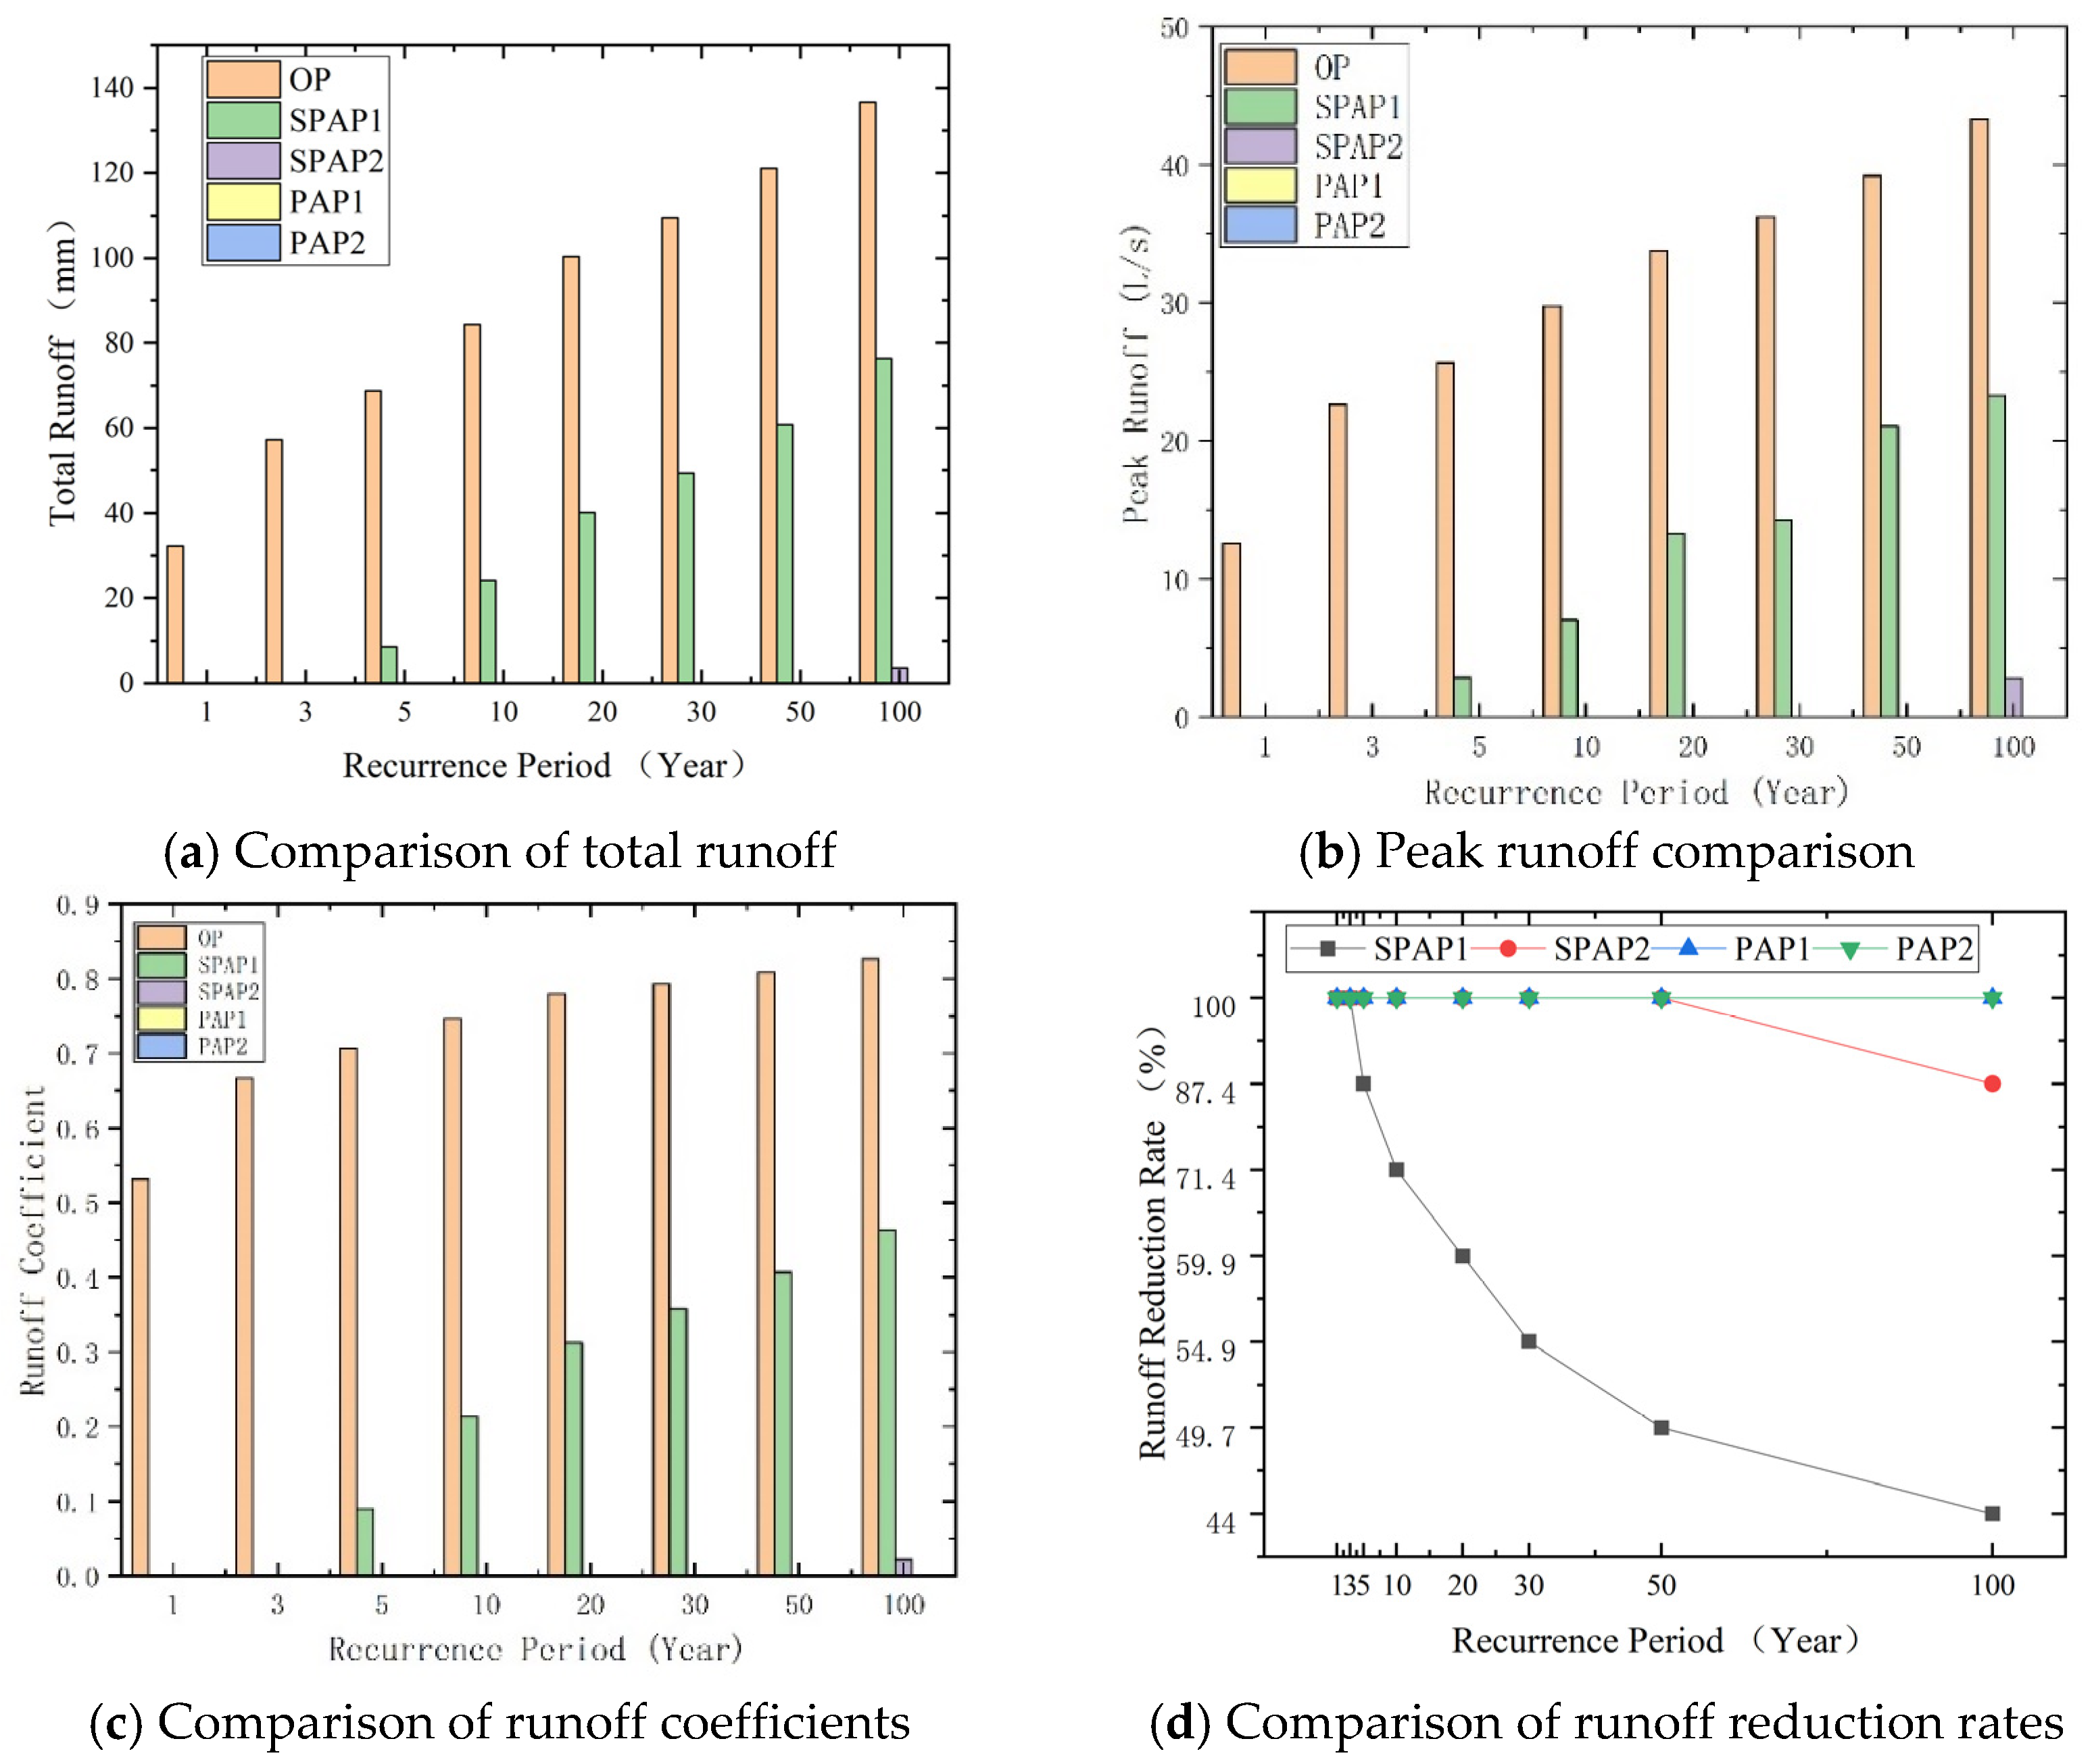
According to the infiltration results, the precipitation within the study area achieved 100% infiltration under the eight preset rainfall recurrence periods. Since SPAP1 and SPAP2 were designed with an impermeable sealing layer, rainwater could not infiltrate through their surfaces, resulting in an infiltration depth of 0 mm. Water entering these structures could only be discharged through the internal subdrain systems or laterally. As shown in Figure 3, the four permeable asphalt pavements investigated in this study exhibited a significant reduction effect on the total surface runoff and peak runoff under the eight rainfall recurrence periods. Among them, the fully permeable asphalt pavements PAP1 and PAP2 produced neither surface runoff nor peak discharge under rainfall events with recurrence periods ranging from 1 to 100 years, with a corresponding runoff coefficient of zero.

3.1.2. Comparison of Seepage and Storage Capacity

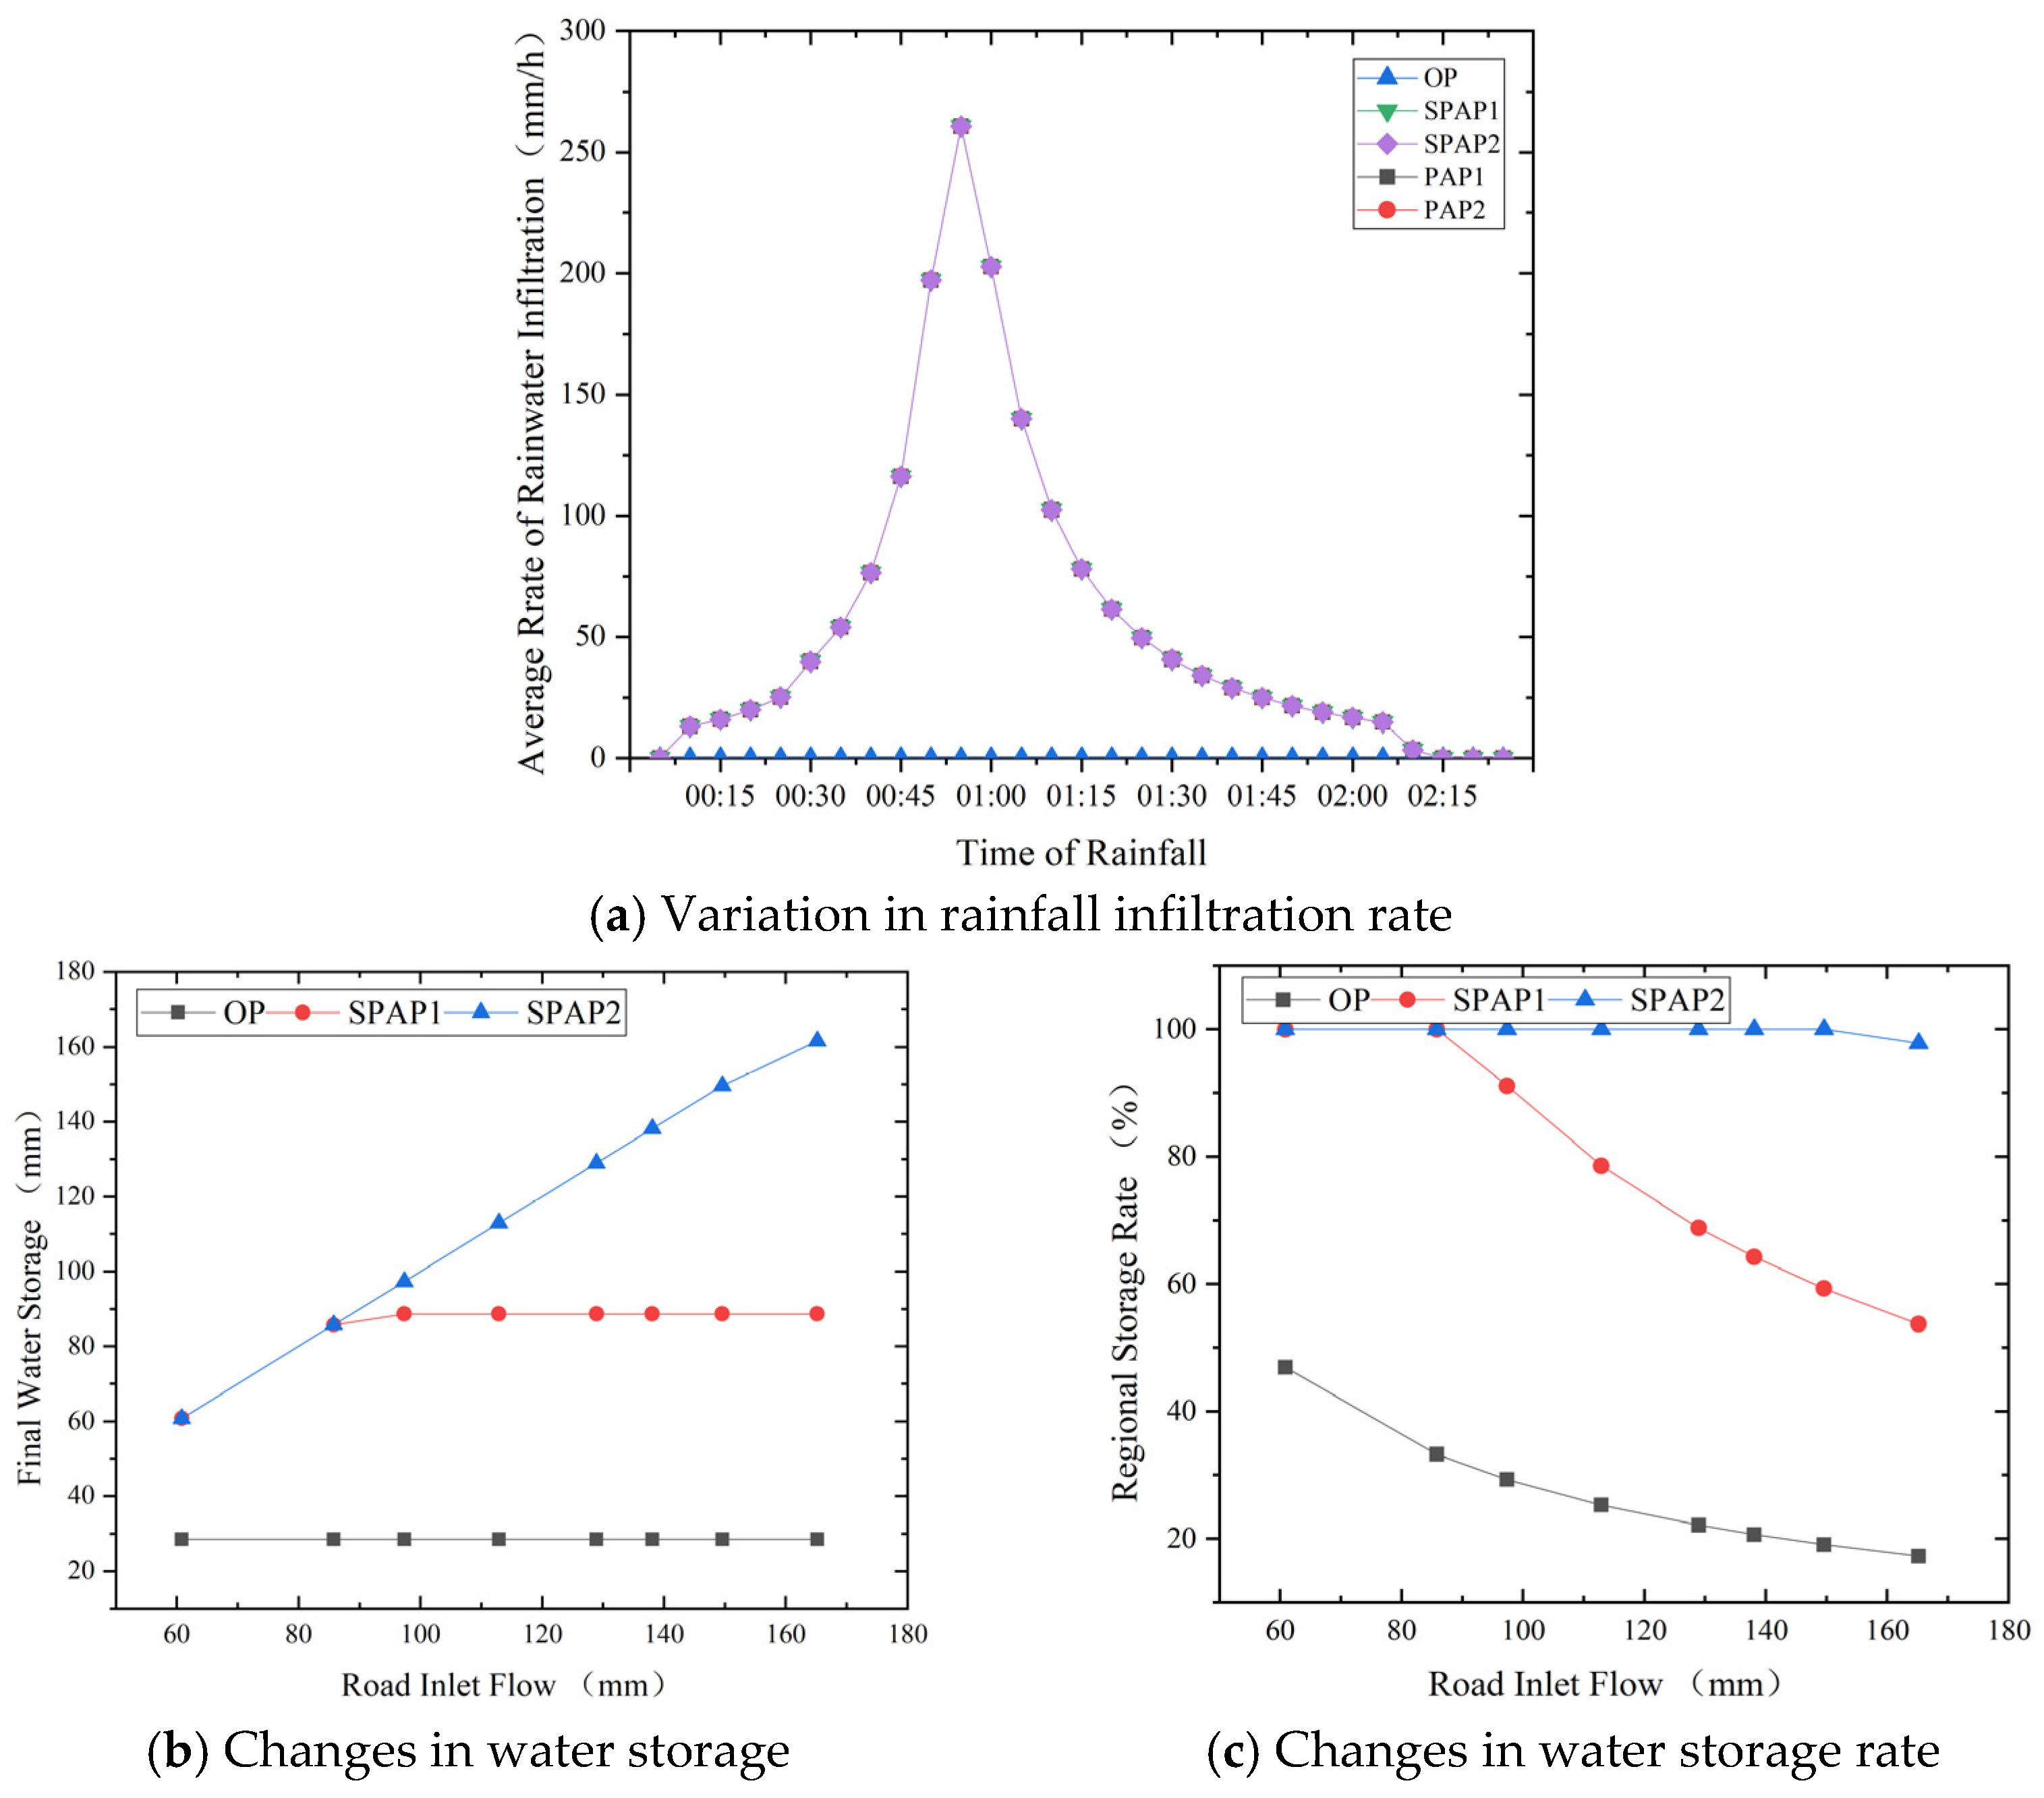
The variation in infiltration rate with rainfall duration during the infiltration of water stored within the pavement for the 30-year recurrence period is shown in Figure 4a. It was observed that the infiltration rates of PAP1 and PAP2 pavements were of the same order of magnitude, which indicated that both pavements exhibited excellent infiltration performance under this rainfall intensity. The infiltration rate increased initially with rising rainfall intensity and then decreased as the intensity diminished. Approximately 2 h and 15 min after the onset of rainfall, the infiltration rate decreased to 0 mm/h, which suggested that the stored rainwater had completely infiltrated into the subgrade. At this stage, the total rainfall infiltration reached 138.1 mm. For fully permeable asphalt pavements PAP1 and PAP2, the total rainfall infiltration ranged from 60.81 mm to 165.19 mm as the rainfall recurrence period varied from 1 to 100 years. The final water storage volume and roadway storage rate of SPAP1, SPAP2, and conventional asphalt pavement changed with the pavement inflow, as shown in Figure 4b,c. For SPAP1, the roadway storage rate remained at 100% until the pavement inflow reached 85 mm. As the inflow continued to increase, the storage rate of SPAP1 gradually decreased, eventually stabilizing around 90 mm, which represented its maximum water storage capacity. In contrast, SPAP2 maintained a 100% roadway storage rate until the pavement inflow reached 150 mm. Its total water storage continued to rise with the increasing inflow, and within the examined range, the limit of total storage was not reached. However, its storage rate began to decrease when the inflow exceeded 150 mm. Overall, SPAP2, with its thicker permeable base, exhibited superior water storage capacity compared to SPAP1. However, the water storage capacity of SPAP1 was considered adequate for rainfall events with recurrence periods of less than 10 years.

3.1.3. Drainage System Loading Effects

(1)
Drainage node flow load
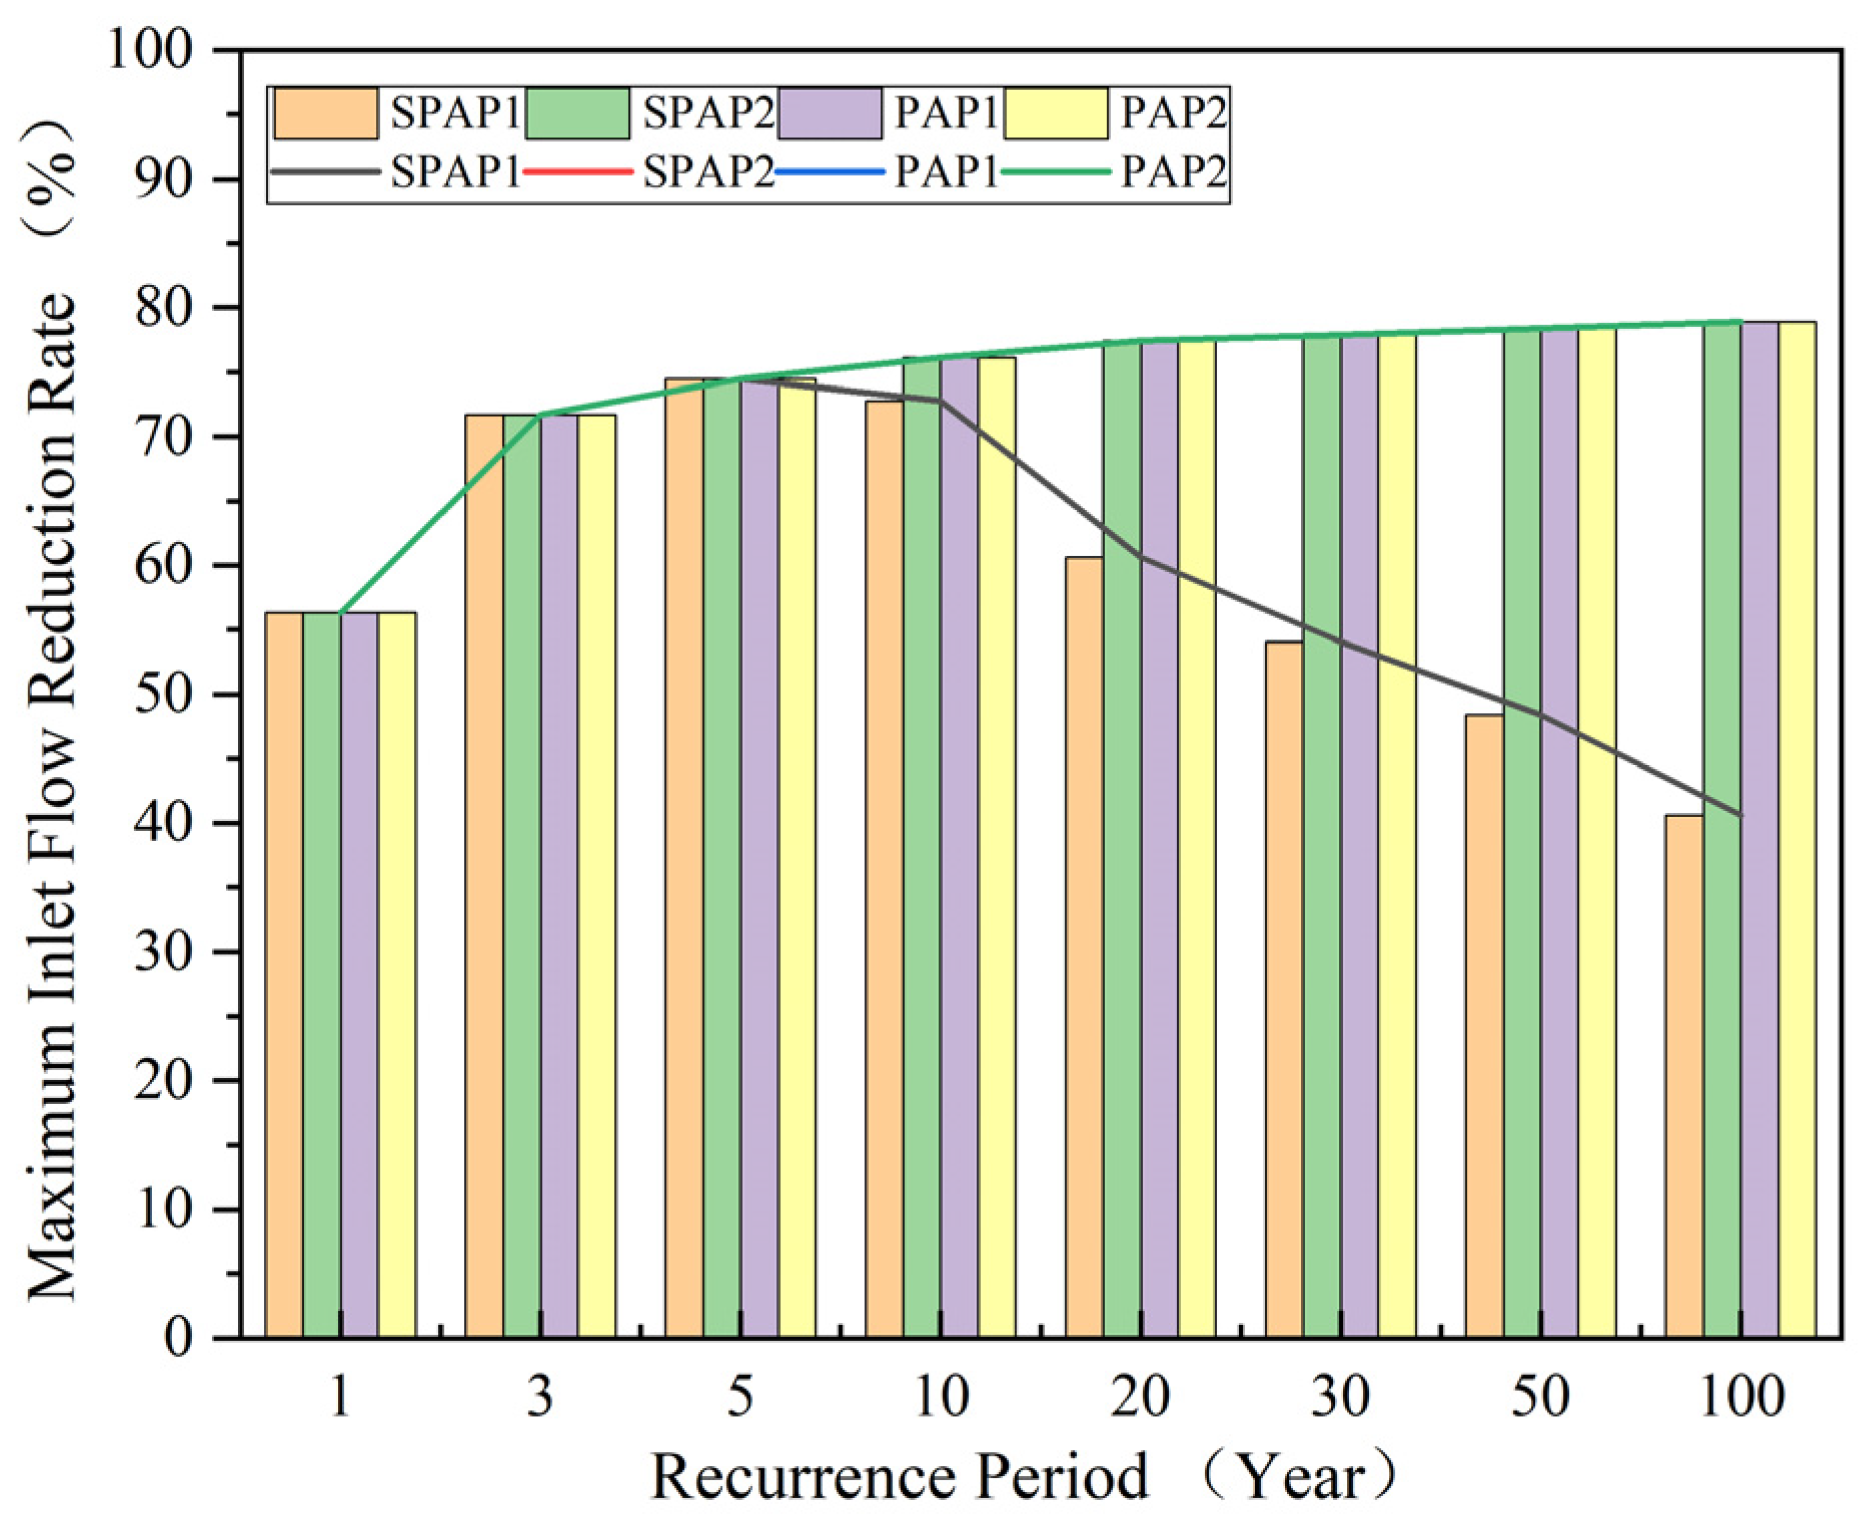
Figure 5 shows the variation in the maximum inlet flow reduction rate at the outflow nodes of the four pavement types relative to conventional asphalt pavement across different rainfall recurrence periods. It was observed that, prior to a 5-year rainfall recurrence period, the reduction rate of the maximum inlet flow to the node gradually increased for all four pavement types, ranging from 55% to 73%. Beyond the 5-year recurrence period, the reduction rate for SPAP1 began to decline progressively with increasing recurrence period, decreasing to 37% at the 100-year recurrence period. In contrast, the reduction rates for SPAP2, PAP1, and PAP2 continued to increase, albeit at a decreasing rate, and ultimately stabilized between 75% and 78% for recurrence periods ranging from 20 to 100 years. This trend was consistent with the results obtained from the earlier runoff simulations.
(2)
Pipe section loading
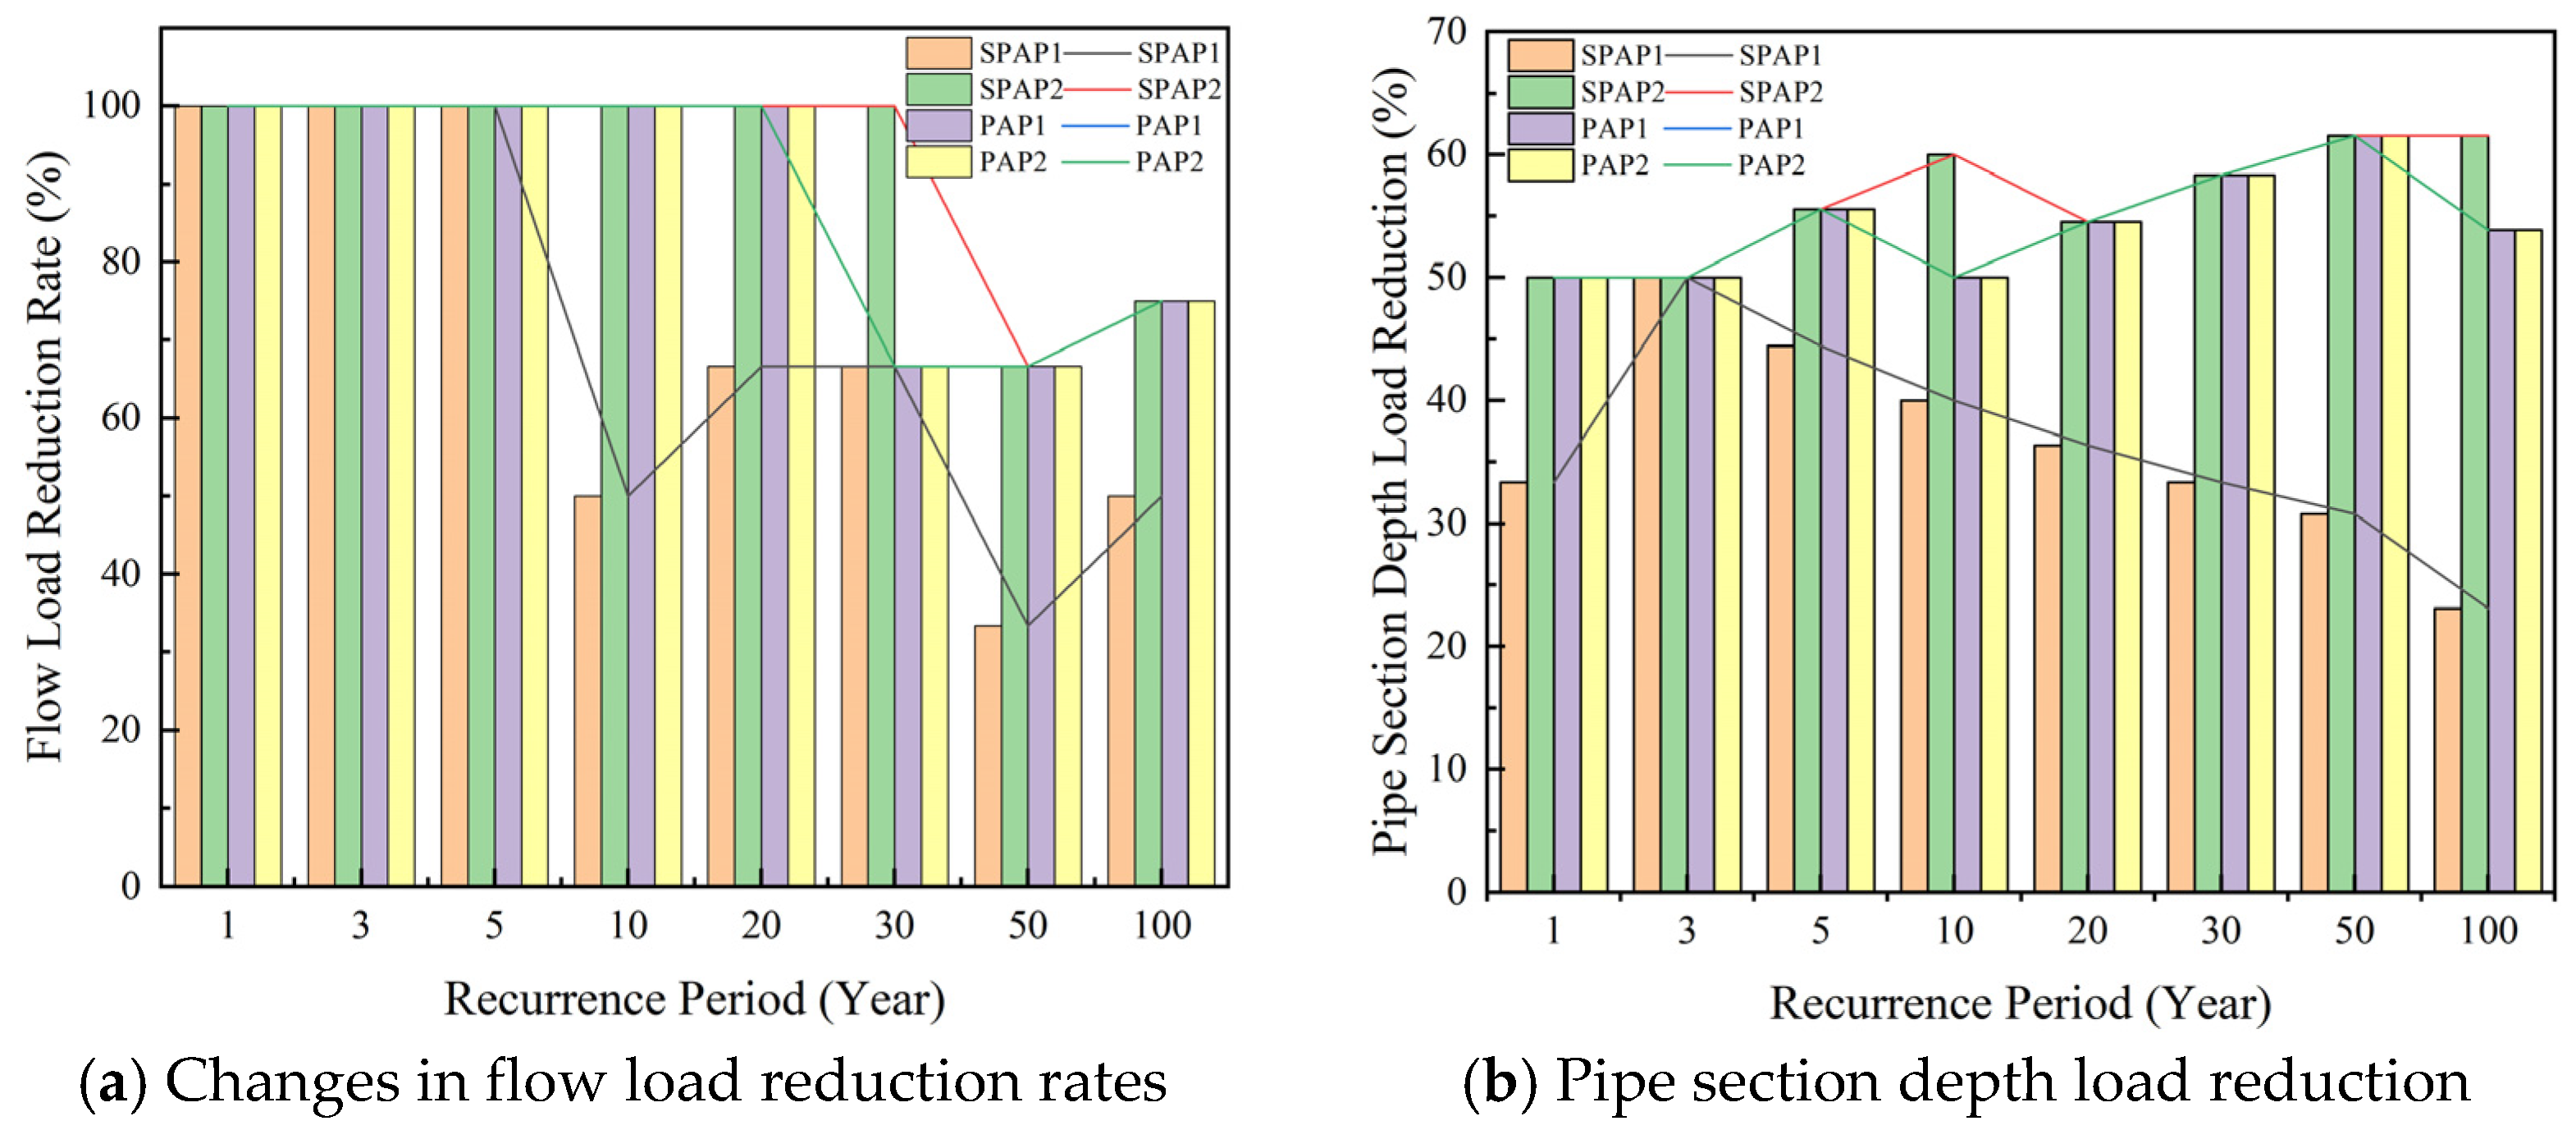
To compare the main pipe flow loading rate of conventional asphalt pavement with the four permeable asphalt pavements examined in this study, the main pipe flow loading reduction rates for SPAP1, SPAP2, PAP1, and PAP2 pavements were first obtained relative to conventional asphalt pavement across different rainfall recurrence periods, as shown in Figure 6a.
Prior to the 5-year recurrence period, all four pavements achieved a 100% reduction in main pipe flow load. Beyond the 5-year recurrence period, SPAP1’s reduction rate began to decline, reaching 54% at the 10-year recurrence period, then increased to 67% at the 20- and 30-year recurrence periods, before decreasing and subsequently increasing again. The reduction rates of PAP1 and PAP2 pavements exhibited a similar trend with increasing rainfall recurrence periods, decreasing from 100% after the 20-year recurrence period, then stabilizing between the 30- and 50-year recurrence periods, and finally increasing again. For SPAP2, the main roadway flow load only began to decrease from the 30-year recurrence period, reaching a 67% reduction rate at the 50-year recurrence period, and then increased again thereafter.
The main pipe depth load reduction rates for SPAP1, SPAP2, PAP1, and PAP2 pavements under different rainfall recurrence periods, relative to conventional asphalt pavement, are shown in Figure 6b.

3.2. Water Quality Simulation Results

3.2.1. Analysis of Pipeline Pollutant Accumulation Processes

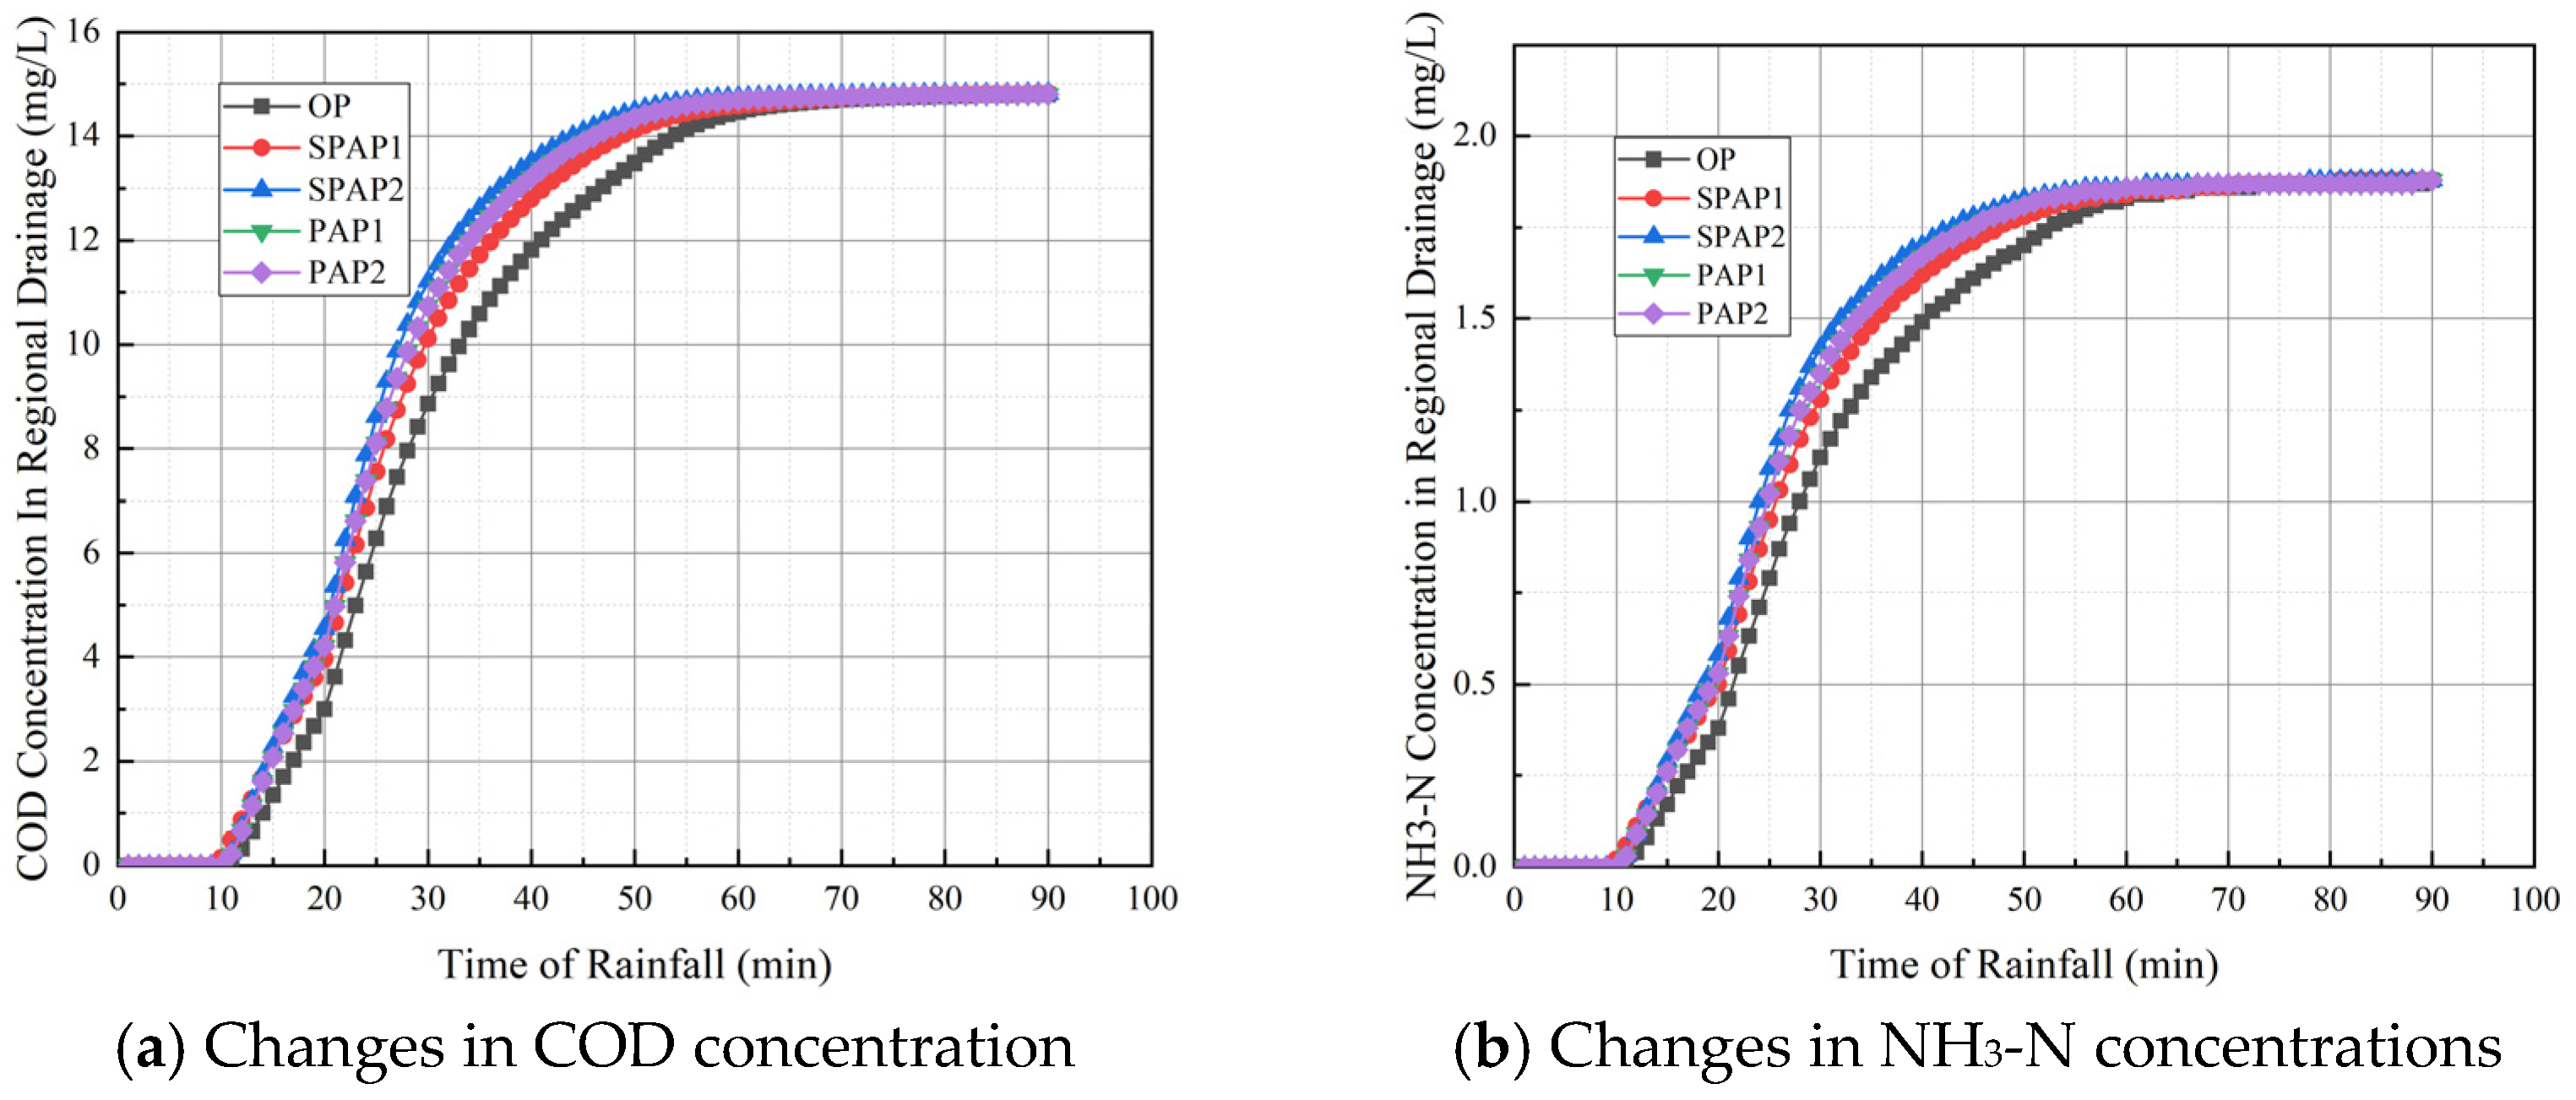
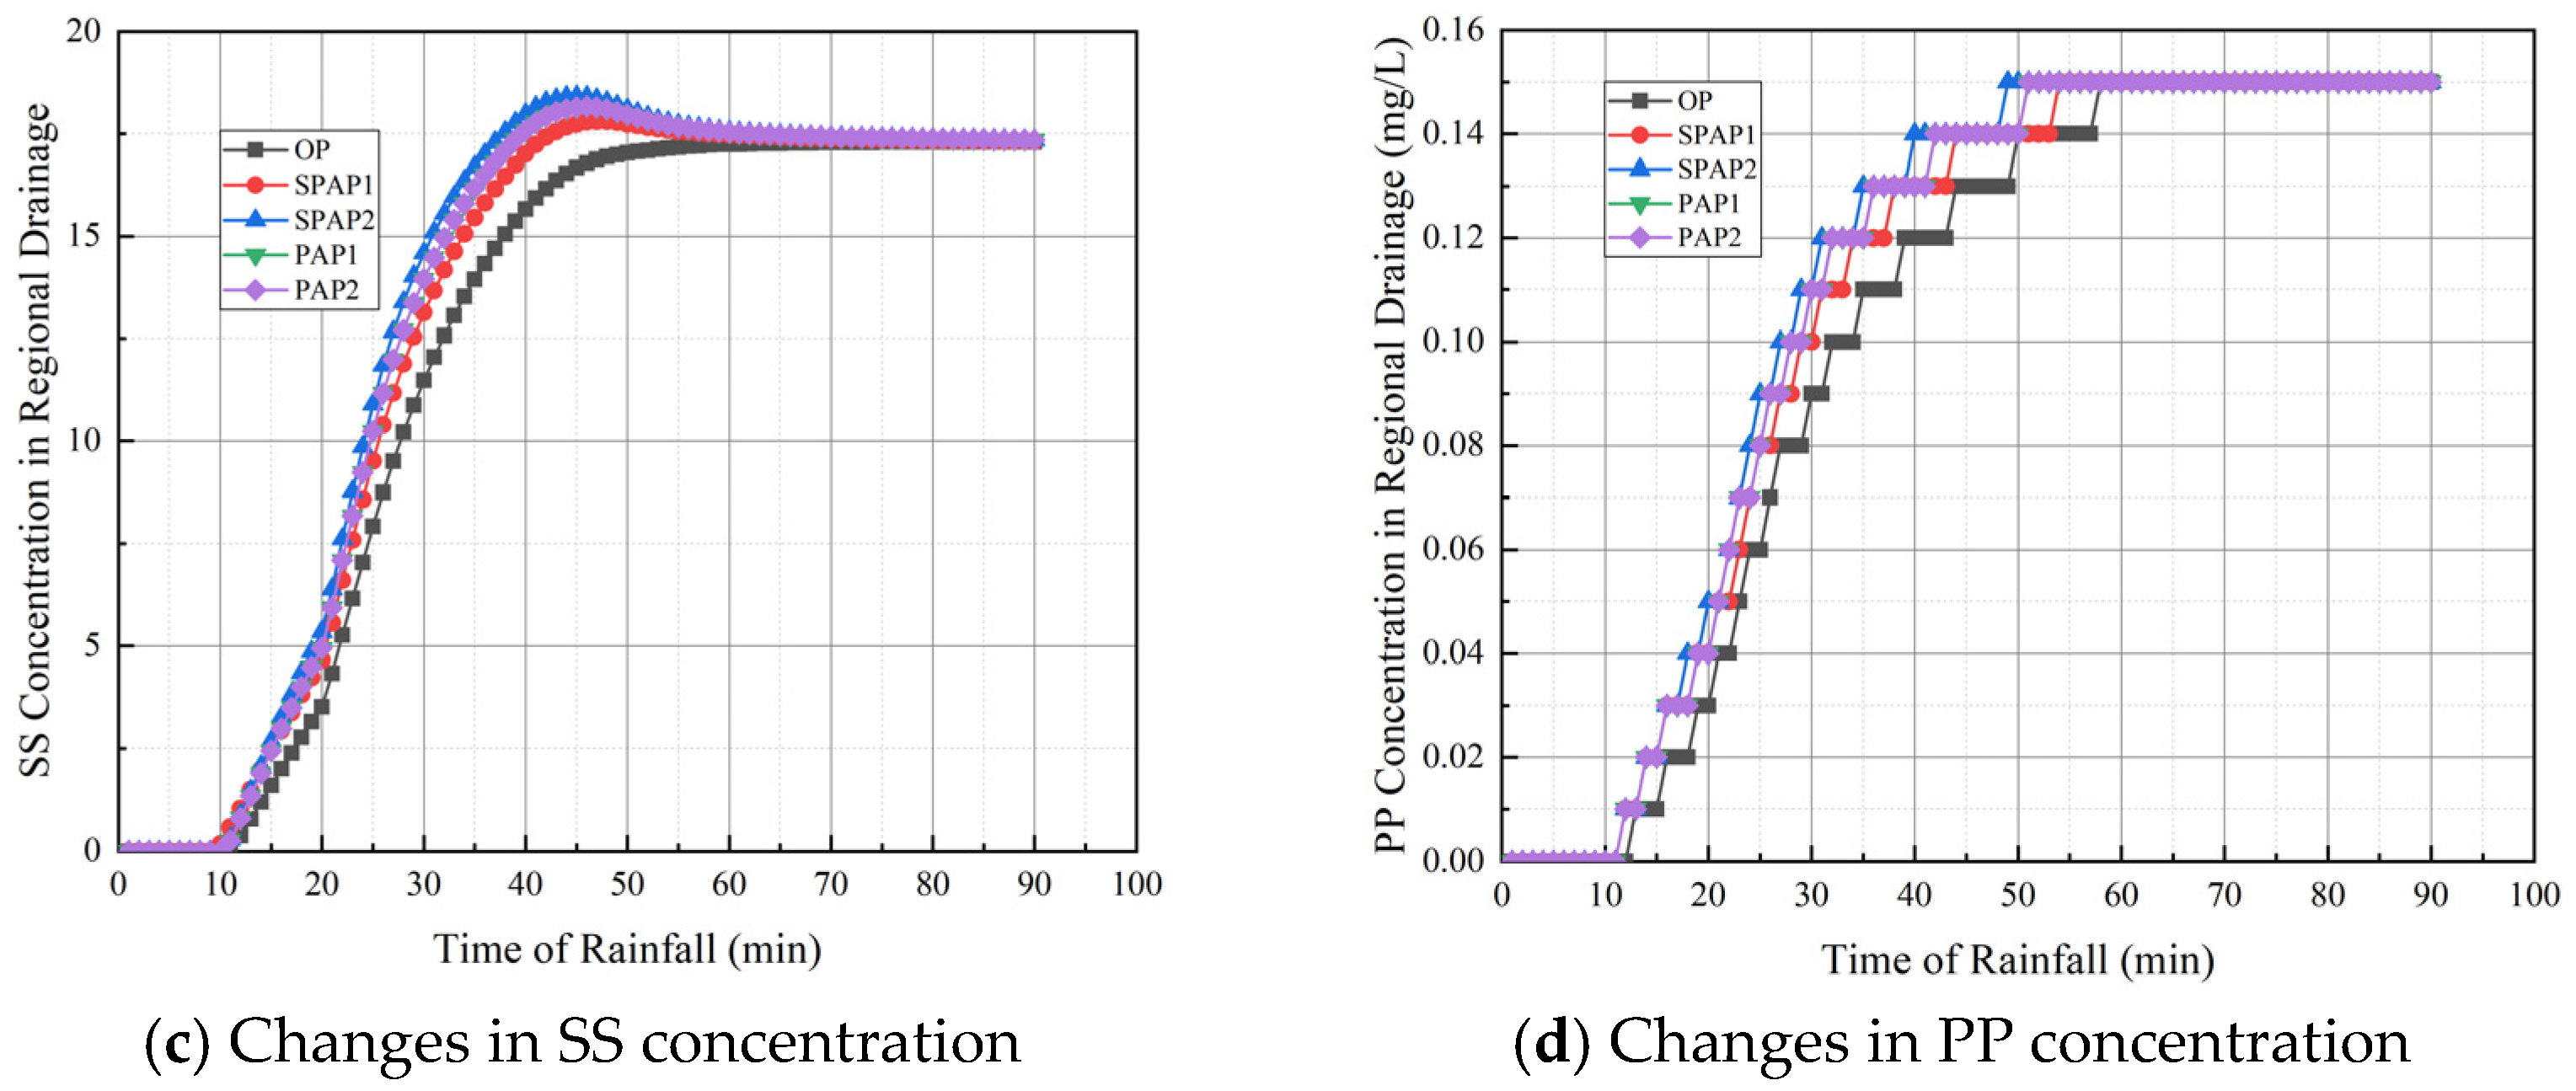
The concentration values for the pollutants under study during simulation were as follows: COD at 14.83 mg/L; NH3-N at 1.88 mg/L; PP at 0.15 mg/L; and SS at 17.3 mg/L. The concentrations of several pollutants in the drainage nodes were 0 mg/L for the first 15 min of rainfall; they reached a steady state, with stabilized concentrations at their respective stormwater concentrations, about 1 h 30 min after rainfall began. The concentration of SS in the nodes exceeded its concentration in the stormwater for about 10 min before stabilization was reached. The rate of increase of pollutant concentrations in the nodes of several pavement surfaces, in descending order, was SPAP2 > PAP2 = PAP1 > SPAP1 > OP. This trend was related to the flow rates at different pavement drainage segments. The flow rate and the variation in different pollutant concentrations with time at the conventional road surface and the main drainage pipes of SPAP1, SPAP2, PAP1, and PAP2 under the 30-year rainfall recurrence period were analyzed, and the results are shown in Figure 7.
The moments when nodal flow peaked were 1 h 13 min, 1 h 27 min, 1 h 1 h 2 min, and 1 h 2 min after rainfall began for conventional pavement, SPAP1, SPAP2, PAP1, and PAP2, respectively. However, the nodal flow for SPAP1 also reached a higher value about 1 h after rainfall began before peaking, then decreased, and subsequently rose again. Considering the time when SPAP1’s flow sub-peak occurred, the sequence of peak flow moments for the five pavements exactly matched the order from fastest to slowest rise of pollutant concentrations in their pipe segments. This indicated that the pollutant concentrations in the drainage network eventually reached equilibrium with the source concentrations (in this case, stormwater) and that the concentration rise rate was related to the relative magnitude of the flow rate in the pipe section, not to the absolute flow rate magnitude. Therefore, in conventional pavements with the worst drainage performance and highest peak flow rates in pipe sections, the pollutant concentrations at their nodes increased at the slowest rate.

3.2.2. Effectiveness in Purifying Surface Runoff Water Quality

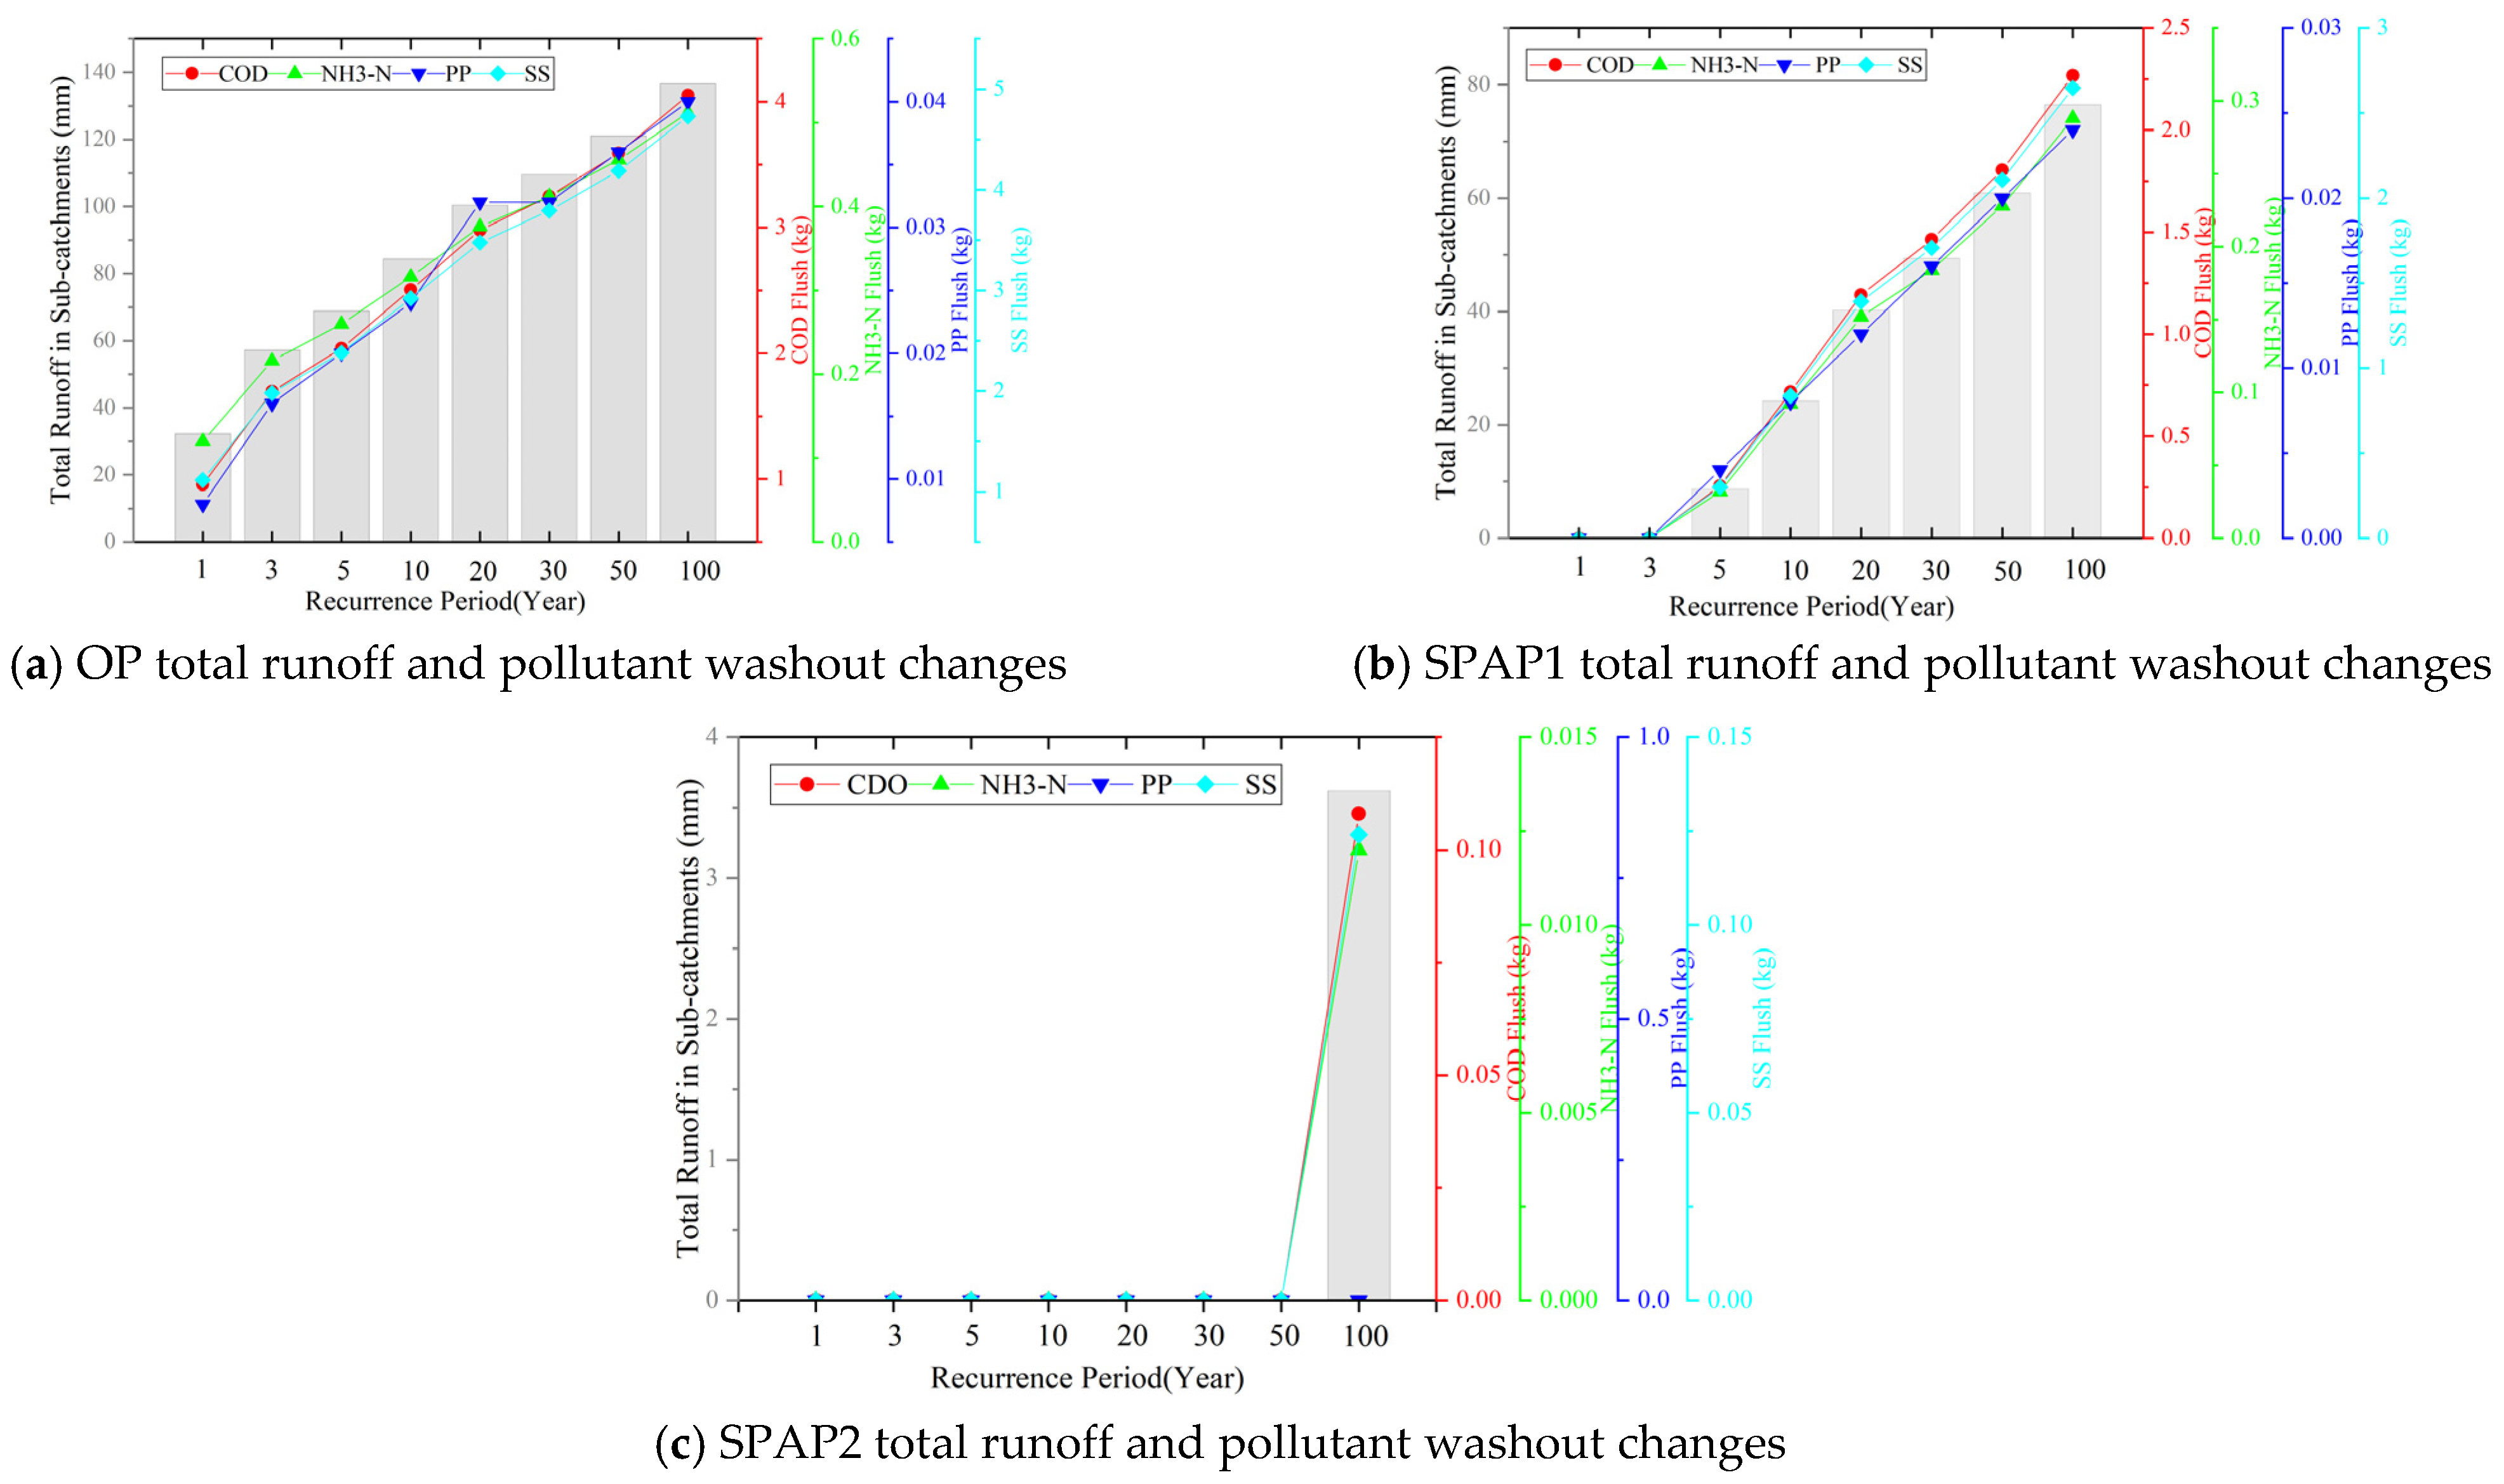
Pollutants on urban surfaces were transferred from the surface to runoff through rainfall washout. Therefore, the amount of pollutants washed out from the roadway area by rainfall equaled the amount of pollutants increased in surface runoff during rainfall. The results of regional pollutant washout for conventional impermeable pavement and the four permeable asphalt pavements examined in the previous section under different rainfall recurrence periods are shown in Table 3.
From the washout results, it could be seen that under each rainfall recurrence period, the washout of all four pollutants for PAP1 and PAP2 was 0 kg, which was a 100% reduction in pollutant washout compared to ordinary impermeable pavement.
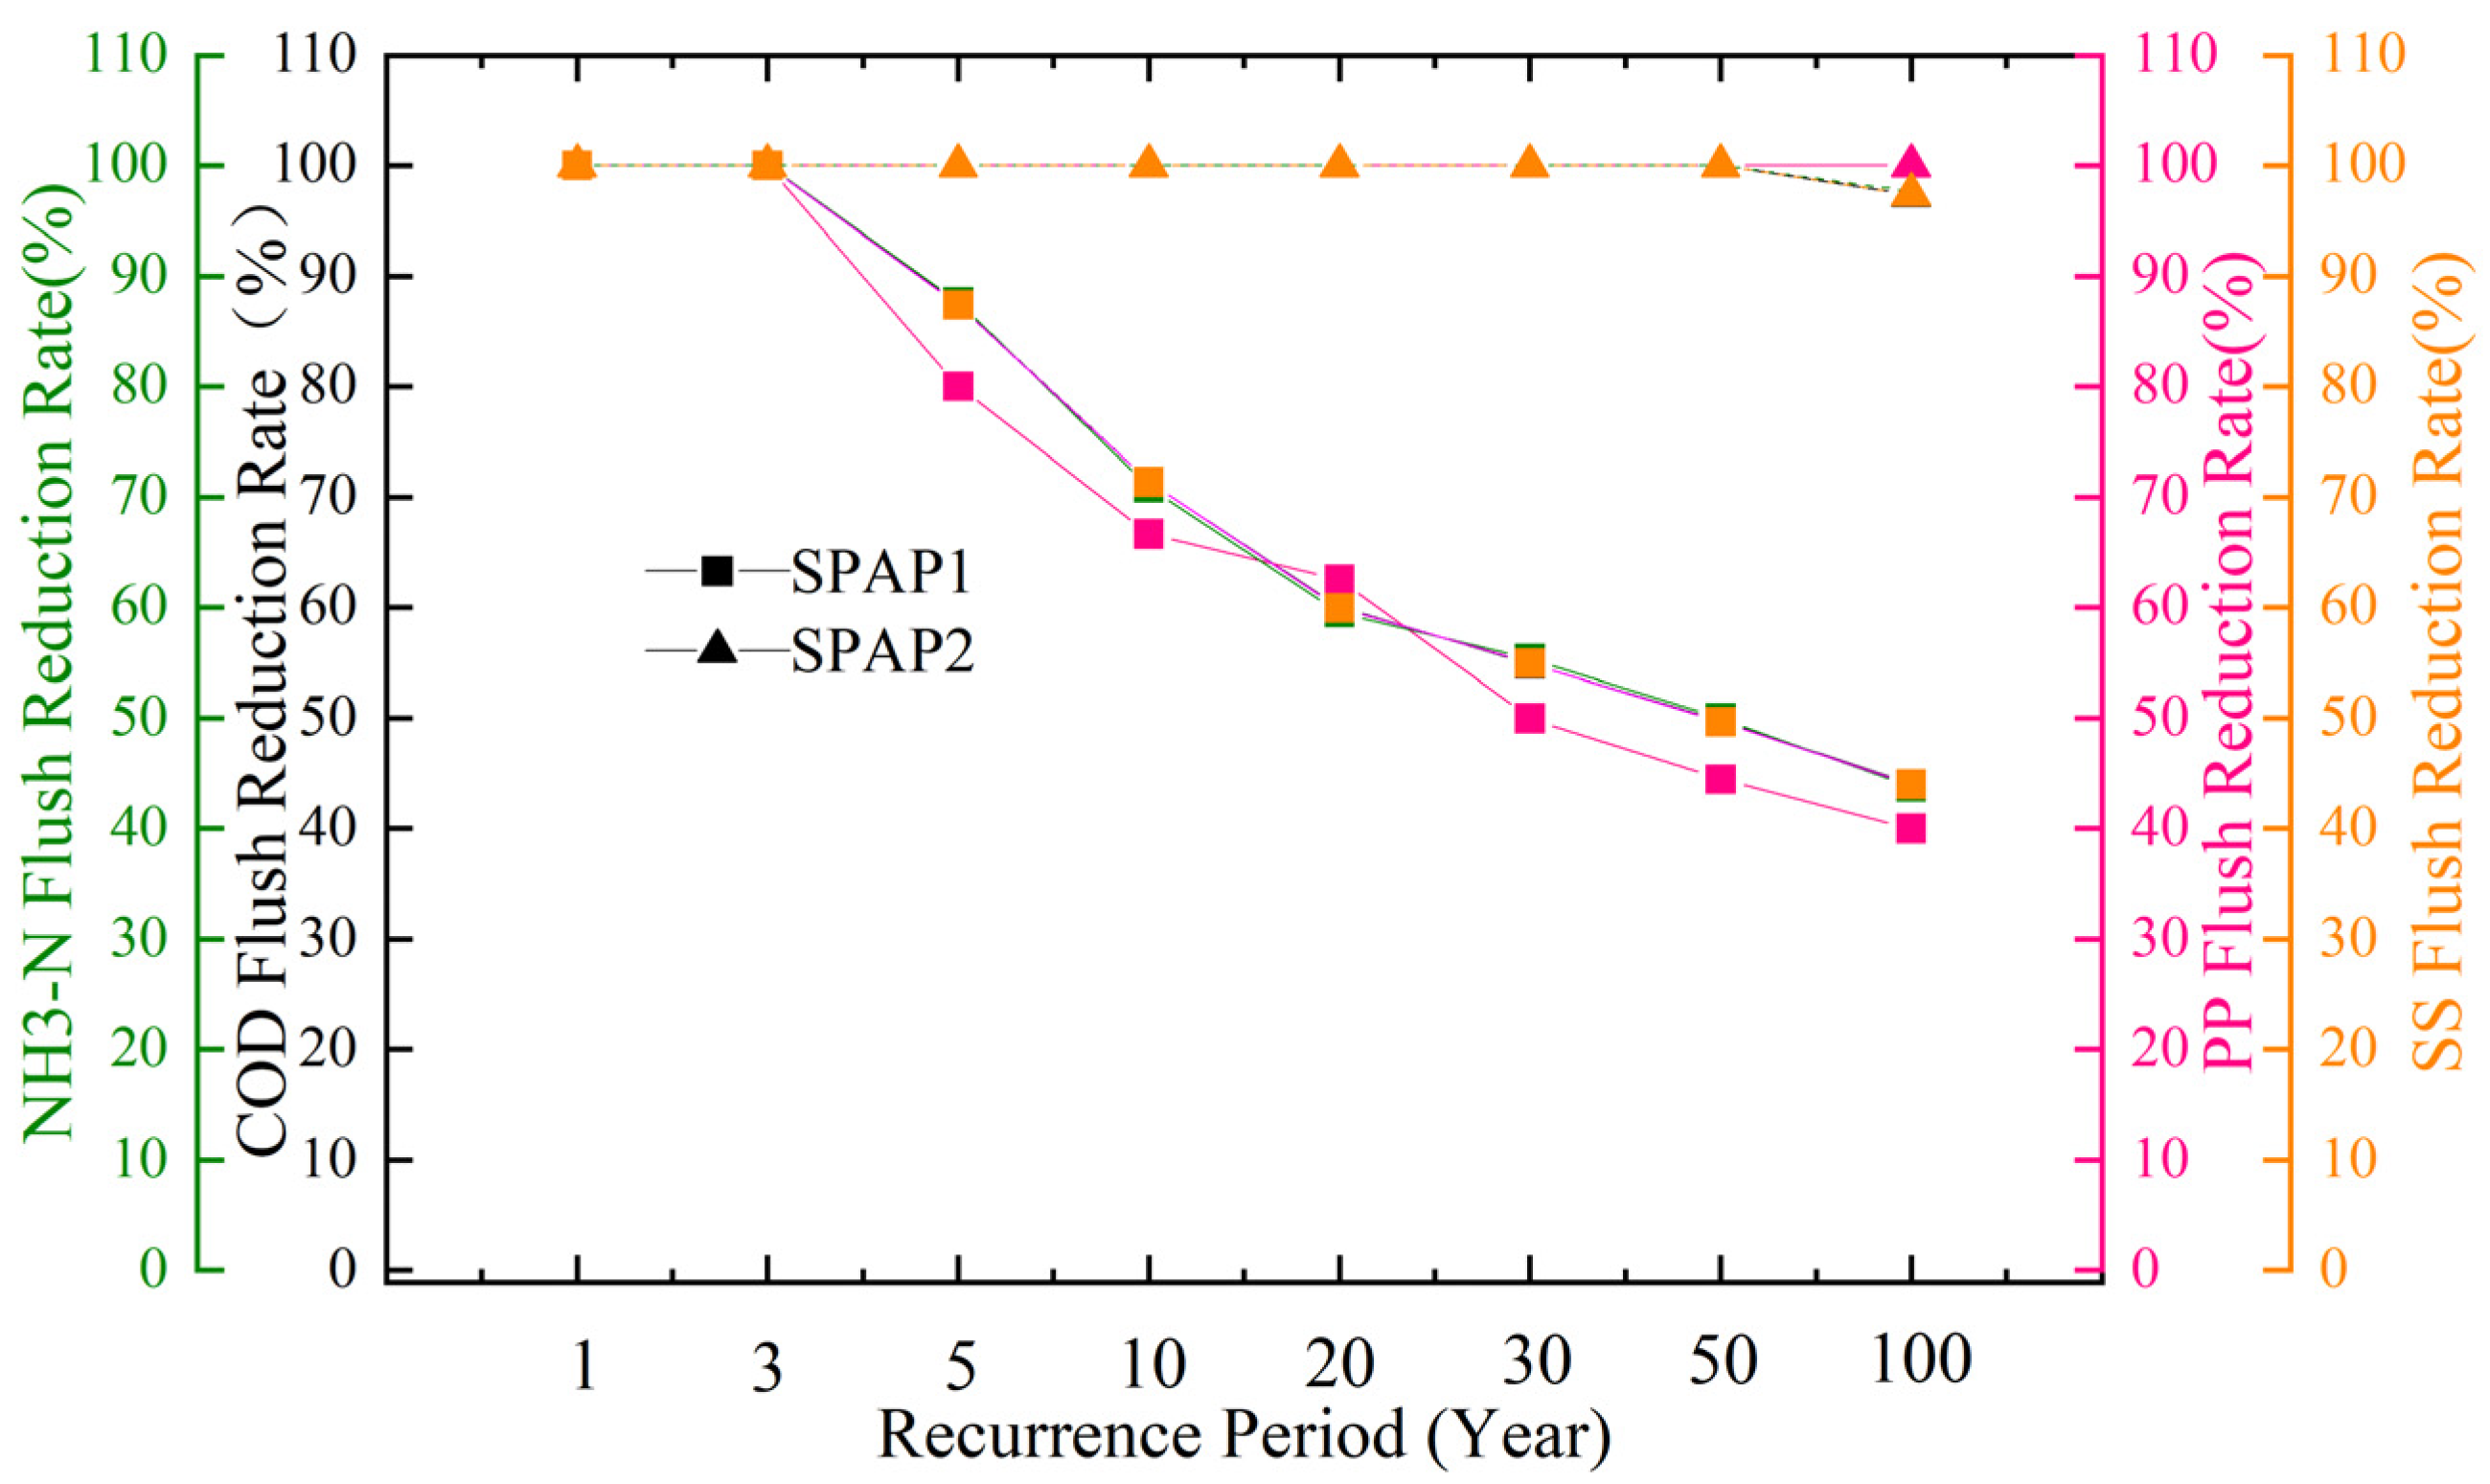
The variation in pollutant washout reduction rates of SPAP1 and SPAP2 relative to ordinary impermeable pavement with rainfall recurrence period is shown in Figure 8. It was observed that, compared to ordinary impermeable pavement, SPAP2 maintained a 100% pollutant washout reduction rate for rainfall recurrence periods up to 50 years. At the 100-year recurrence period, its pollutant washout reduction rate decreased by 3%, indicating that SPAP2 had reached its upper limit for pollutant washout reduction. Meanwhile, SPAP1’s pollutant washout reduction rate ranged from 40% to 100%, and this rate decreased with an increasing rainfall recurrence period.
As shown in Figure 9, the trend of the regional pollutant flushing volume and the regional total runoff volume with increasing rainfall recurrence period was found to be consistent. When the regional total runoff volume was 0 mm, the pollutant flushing volume was also 0 kg, which further demonstrated the positive correlation between the regional pollutant flushing volume and the regional total runoff volume. Therefore, for road surfaces, a more effective reduction in runoff corresponded to a more effective reduction in pollutant washout.

3.2.3. Effectiveness of Water Quality in the Drainage Network

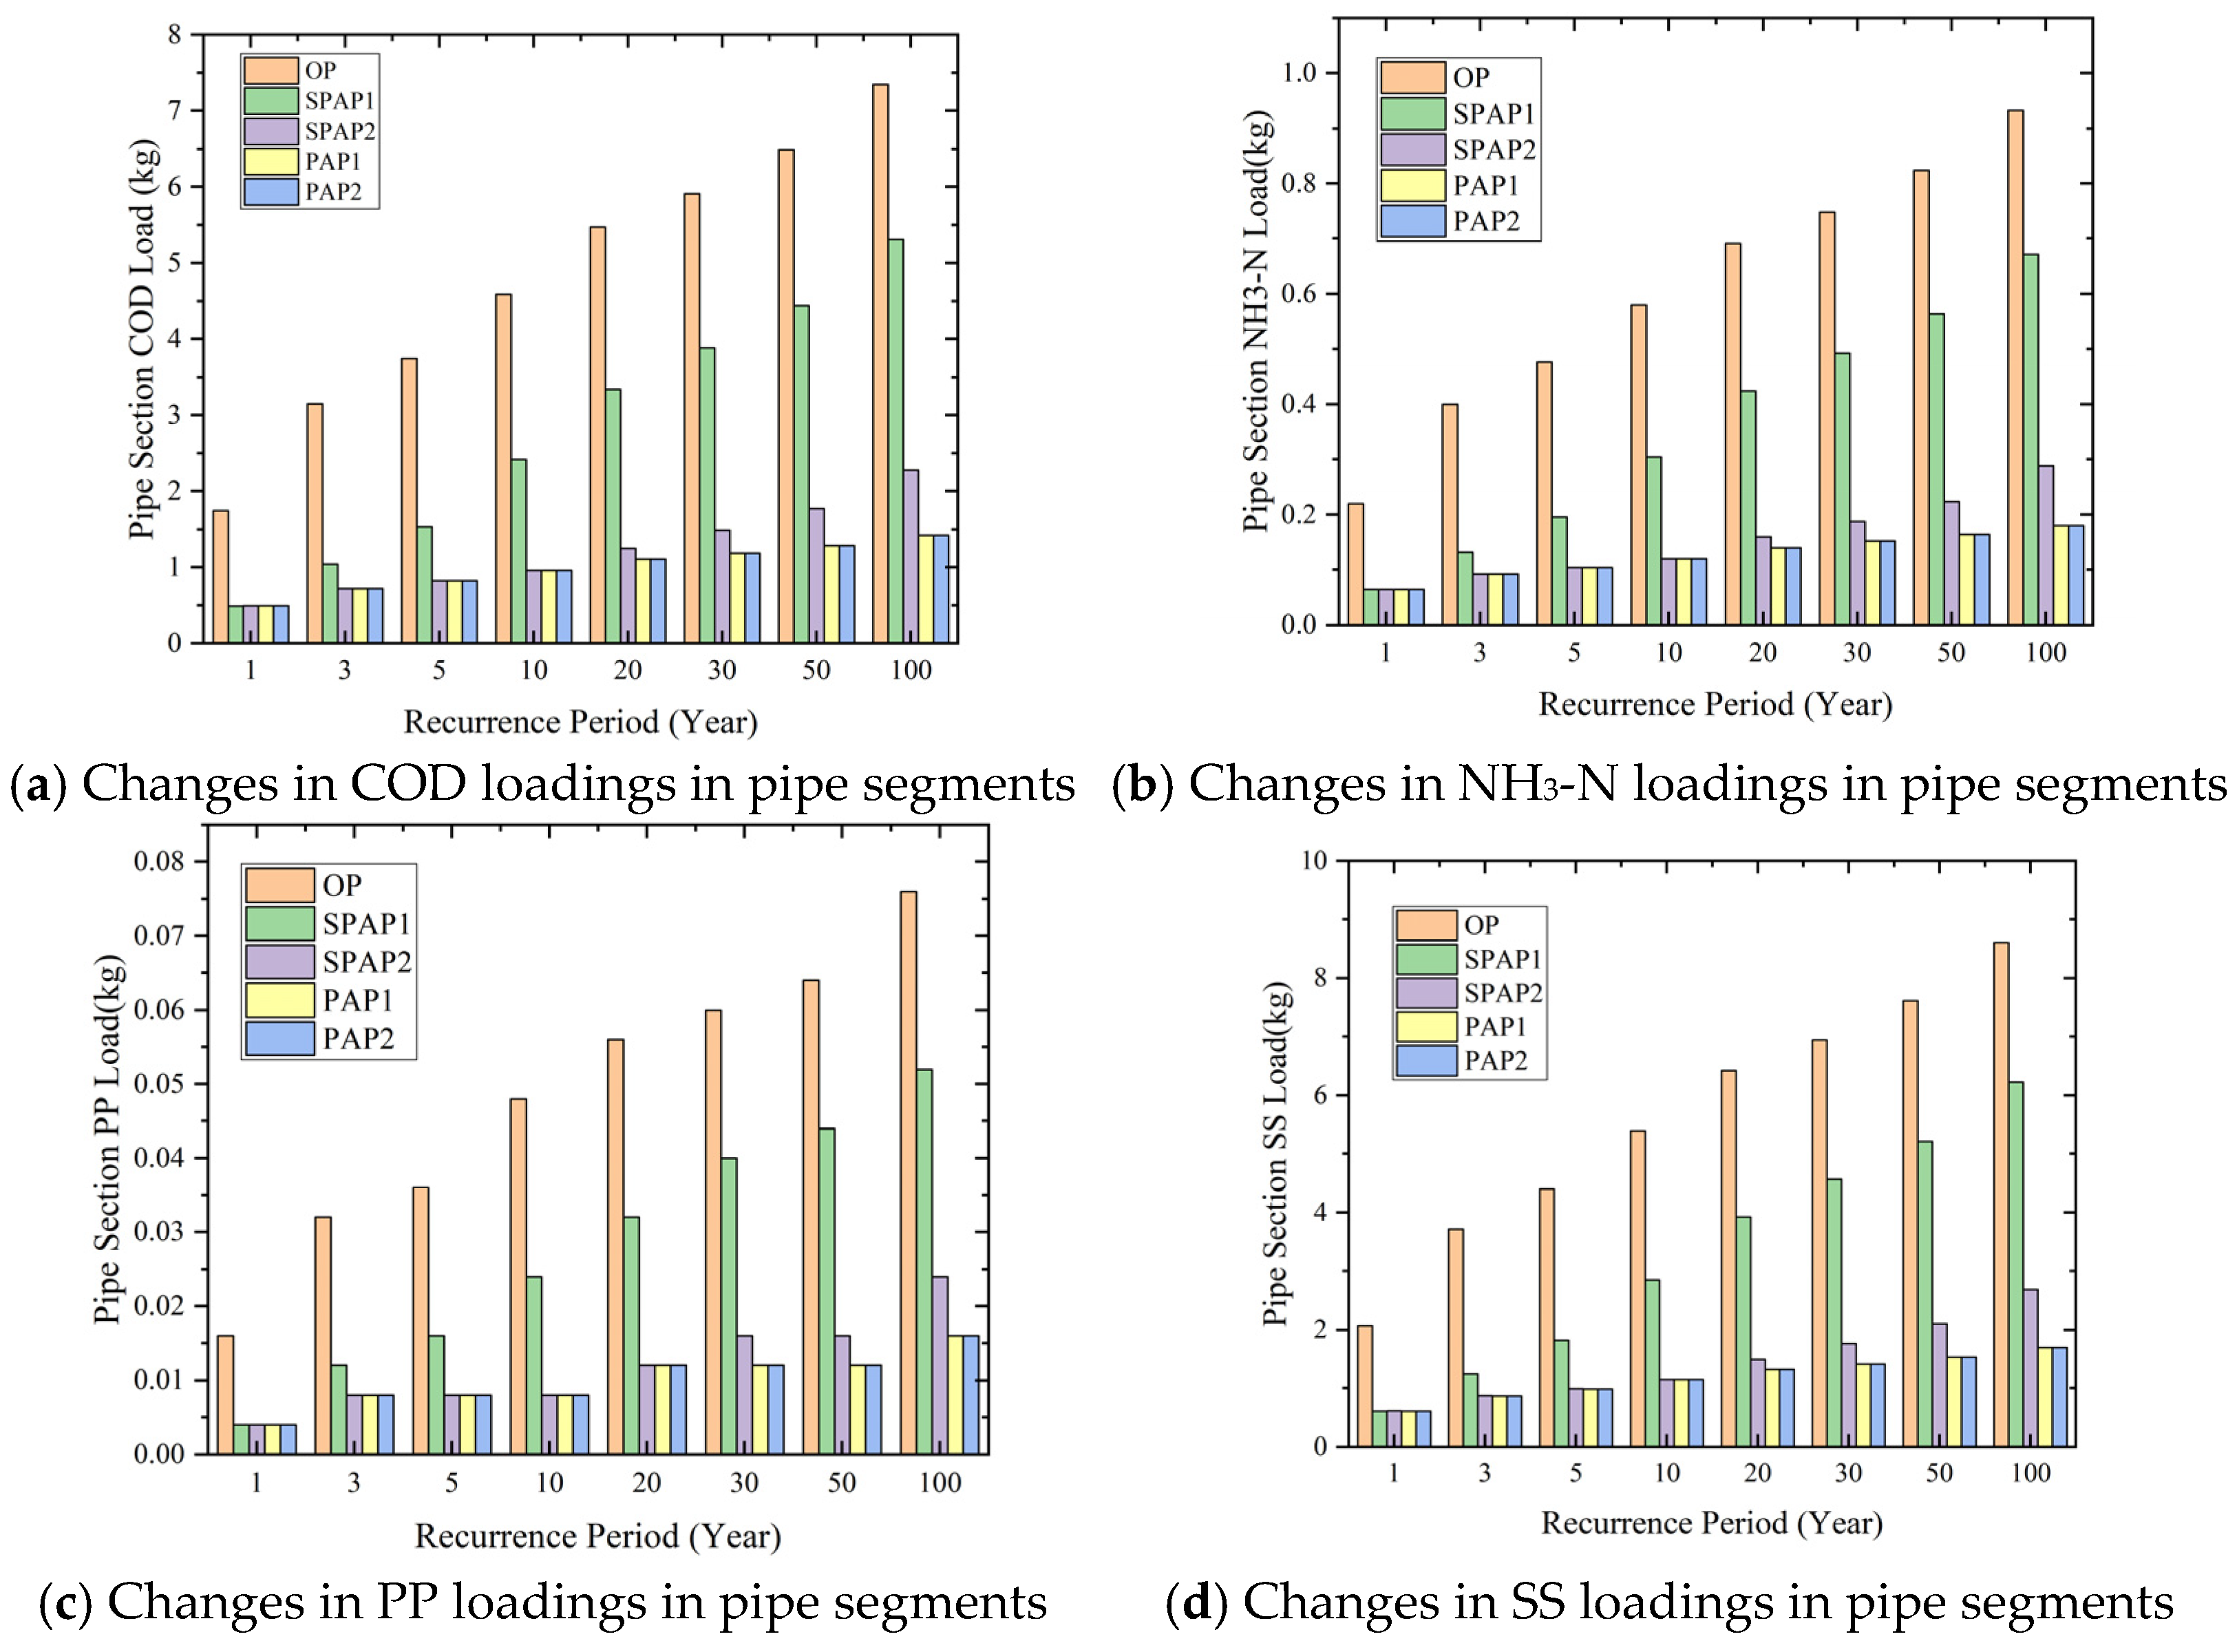
The simulation results were categorized and analyzed by pollutant type, and the changes in the levels of COD, NH3-N, SS, and PP in the sub-catchment areas of the five roads with respect to the rainfall recurrence period are shown in Figure 10. It can be seen that among the five types of pavements, the two fully permeable asphalt pavements, PAP1 and PAP2, had the best purification effect on the four pollutants under all rainfall recurrence periods, and the pollutant purification effect of PAP1 and PAP2 was the same. With the increase in rainfall recurrence period, the more pronounced their pollutant purification effect was in relation to that of the ordinary pavements. Under the 10-year recurrence period, the purification quantities of COD, NH3-N, PP, and SS in the individual sub-catchments of PAP1 and PAP2 were higher than those of the ordinary pavement by 3.628 kg, 0.46 kg, 0.04 kg, and 4.244 kg, respectively, and the reduction rate of the total pollutants was up to 79%. Under the 100-year recurrence period, the purification quantities of COD, NH3-N, PP, and SS were 5.92 kg, 0.752 kg, 0.06 kg, and 6.912 kg higher than those of the ordinary pavement, respectively, and the reduction rate of total pollutants reached 80.7%.
Both semi-permeable asphalt pavements, SPAP1 and SPAP2, were able to reach their upper limits of pollutant reduction relative to ordinary pavements under several pre-determined rainfall recurrence periods. Within the same small sub-catchment under a 120-min rainfall period, the upper limit of total pollutant reductions for SPAP1 relative to regular pavement was 2.05 kg for COD, 0.26 kg for NH3-N, 0.022 kg for PP, and 2.4 kg for SS; the total pollutant reduction rate ranged from 28% to 78% and decreased progressively with the increase in the rainfall recurrence period. The upper limit of total pollutant reduction for SPAP2 relative to normal pavement was 5.3 kg for COD, 0.72 kg for NH3-N, 0.05 kg for PP, and 6.3 kg for SS; the total pollutant reduction rate ranged from 68% to 79% and increased and then decreased with the rainfall recurrence period. Compared with SPAP1 and SPAP2, when the rainfall period was greater than 3 years, the pollutant purification effect of SPAP2 was better than that of SPAP1, and the larger the rainfall recurrence period, the higher the amount of pollutant purification of SPAP2 relative to SPAP1. This was also due to the fact that the thickness of the aquifer in SPAP2 was greater than that of SPAP1, which also showed the positive correlation between the amount of pollutant purification and the thickness of the aquifer.

4. Conclusions

This study investigated the hydrological and water quality effects of four different pavement structures based on the SWMM. Firstly, the reduction rates of surface runoff, maximum inlet flow rate at sink nodes, and hydraulic loading of pipes were comparatively analyzed for ordinary pavements and the four types of permeable asphalt pavements under each rainfall recurrence period. Then, water quality simulations were performed using the SWMM, and the pollutant reduction effects of the four permeable asphalt pavements were derived for each rainfall recurrence period within a single sub-catchment area and relative to the regular pavement. Finally, the relatively optimal permeable pavement structure was selected for use in urban pavements.
(1)
A comprehensive analysis was conducted on the properties of various materials used in the structural layers of permeable asphalt pavements, considering the functional requirements of urban pavements. Based on this analysis, two semi-permeable asphalt pavements were designed: SPAP1, comprising PAC13, PAC20, asphalt-stabilized crushed stone, a waterproof sealing layer, and dense cement-stabilized crushed stone, and SPAP2, consisting of PAC13, PAC20, asphalt-stabilized crushed stone, porous cement-stabilized crushed stone, and a waterproof sealing layer. Additionally, two fully permeable asphalt pavements were designed: PAP1, comprising PAC13, PAC20, cement-stabilized crushed stone, graded crushed stone, and permeable geotextile; and PAP2, consisting of PAC13, PAC20, porous cement concrete, cement-stabilized crushed stone, and permeable geotextile. The void ratios and permeability coefficients of specimens made from these different materials were also measured.
(2)
SPAP1 delayed the peak runoff by an average of 10 min, achieving a surface runoff reduction ranging from 44% to 100%. SPAP2 delayed the peak runoff by an average of 1 h 10 min, with a surface runoff reduction ranging from 97% to 100%. No surface runoff was observed for PAP1 and PAP2, indicating a complete (100%) reduction in surface runoff.
(3)
SPAP1 achieved a maximum reduction in inflow to the sink node ranging from 37% to 73%, whereas SPAP2 achieved a reduction ranging from 55% to 78%. Similarly, PAP1 and PAP2 achieved a maximum reduction in inflow to the sink node within the range of 55% to 78%.
(4)
SPAP1 reduced flow loading to the main pipe by 36–100% and water pressure loading by 25% to 50% and attained a maximum storage depth of 90 mm. SPAP2 reduced flow loading by 67–100% and water pressure loading by 50% to 64% and reached a maximum storage depth of 160 mm. PAP1 and PAP2 reduced flow loading to the main pipeline by 67–100% and water pressure loading by 50% to 64% and achieved groundwater recharge ranging from 61 mm to 177 mm.
(5)
SPAP1 reduced pollutants by up to 2.05 kg of COD, 0.26 kg of NH3-N, 0.022 kg of PP, and 2.4 kg of SS, with a total pollutant removal rate ranging from 28% to 78%. SPAP2 reduced pollutants by up to 5.3 kg of COD, 0.72 kg of NH3-N, 0.05 kg of PP, and 6.3 kg of SS, with a total pollutant removal rate ranging from 68% to 79%. PAP1 and PAP2 reduced pollutants by up to 5.92 kg of COD, 0.752 kg of NH3-N, 0.06 kg of PP, and 6.912 kg of SS, with a total pollutant removal rate ranging from 77% to 81%.

Author Contributions

Conceptualization, J.X. (Jianguang Xie); methodology, D.W. and J.X. (Jianguang Xie); software, D.W., J.X. (Jinwei Xu), Y.L., S.G. and Q.L.; formal analysis, D.W., J.X. (Jinwei Xu) and Y.L.; investigation, D.W.; resources, S.G. and Q.L.; data curation, S.G.; writing—original draft, J.X. (Jinwei Xu); writing—review and editing, Y.L.; supervision, J.X. (Jianguang Xie). All authors have read and agreed to the published version of the manuscript.

Funding

This research was funded by Scientific Research Startup Funding for Introduced Talents at Jiangsu Open University (grant number KYQDF-202213), and the APC was funded by Jiangsu Open University.

Data Availability Statement

The original contributions presented in this study are included in the article. Further inquiries can be directed to the corresponding author.

Conflicts of Interest

Author Qiang Liu is employed by Jiangsu Sinoroad Engineering Technology Research Institute Co., Ltd. Author Sheng Gu is employed by Kunshan Construction Engineering Quality Testing Center Co., Ltd. The remaining authors declare that the research was conducted in the absence of any commercial or financial relationships that could be construed as a potential conflict of interest.

References

  1. Chu, Y.; Shi, Y. Optimization Simulation of Sponge City Landscape Pattern based on SWMM Model. Acad. J. Manag. Soc. Sci. 2025, 11, 1–7. [Google Scholar] [CrossRef]
  2. Guan, X.; Wang, J.; Xiao, F. Sponge city strategy and application of pavement materials in sponge city. Clean. Prod. 2021, 303, 127022. [Google Scholar] [CrossRef]
  3. Wang, J.; Zhou, X.; Wang, S.; Chen, L.; Shen, Z. Simulation and Comprehensive Evaluation of the Multidimensional Environmental Benefits of Sponge Cities. Water 2023, 15, 2590. [Google Scholar] [CrossRef]
  4. Ahmed, G.H.; Aziz, Q.S.; Wu, B.; Ahmed, M.S.; Jha, K.; Wang, Z.; Nie, Y.; Huang, T. Application of Sponge City for Controlling Surface Runoff Pollution. Asian J. Environ. Ecol. 2024, 23, 1–23. [Google Scholar] [CrossRef]
  5. Alhassan, I.; Katharine, B.; Ehsan, S. Waterways transformation and green stormwater infrastructure: Enabling governance for Adelaide’s River Torrens Catchment, Australia. Int. J. Water Resour. Dev. 2024, 40, 33–56. [Google Scholar] [CrossRef]
  6. Li, S.; Leitao, J.P.; Wang, Z.; Bach, P.M. A drainage network-based impact matrix to support targeted blue-green-grey stormwater management solutions. Sci. Total Environ. 2023, 912, 168623. [Google Scholar] [CrossRef]
  7. Saumya, A.; Arun, K. Green Infrastructure for Sustainable Stormwater Management in an Urban Setting Using SWMM-Based Multicriteria Decision-Making Approach. J. Hydrol. Eng. 2024, 29, 04023044. [Google Scholar] [CrossRef]
  8. Sousa, M.; Almeida, D.M.; Fael, C.; Bentes, I. Permeable Asphalt Pavements (PAP): Benefits, Clogging Factors and Methods for Evaluation and Maintenance—A Review. Materials 2024, 17, 6063. [Google Scholar] [CrossRef]
  9. Wei, Y.; Cao, X.; Li, J.; Chang, Y. Greenhouse gas, water, and economic implications of permeable pavements: Quantification for pilot sponge cities in China. J. Clean. Prod. 2024, 471, 143424. [Google Scholar] [CrossRef]
  10. Xu, G.; Fan, J.; Ma, T.; Zhao, W.; Ding, X.; Wang, Z. Research on application feasibility of limestone in sublayer of Double-Layer permeable asphalt pavement. Constr. Build. Mater. 2021, 287, 04023044. [Google Scholar] [CrossRef]
  11. Sun, Y.; Guo, R.; Wang, X.; Ning, X. Dynamic response characteristics of permeable asphalt pavement based on unsaturated seepage. Int. J. Transp. Sci. Technol. 2019, 8, 403–417. [Google Scholar] [CrossRef]
  12. Zhou, J.; Pang, Y.; Du, W.; Huang, T.; Wang, H.; Zhou, M.; Liu, J. Review of the development and research of permeable pavements. Hydrol. Process. 2024, 38, e15179. [Google Scholar] [CrossRef]
  13. Yang, Q.; Hu, J.; Beecham, S. Effect of Slope on Stormwater Infiltration into Porous Asphalt Pavements. Sustainability 2024, 16, 589. [Google Scholar] [CrossRef]
  14. Nina, S.; Joacim, L.; Sara, J.; Sami, K.; Mats, G. Effects of a porous asphalt pavement on dust suspension and PM10 concentration. Transp. Res. Part D 2023, 123, 103921. [Google Scholar] [CrossRef]
  15. Jiang, W.; Sha, A.; Xiao, J.; Li, Y.; Huang, Y. Experimental study on filtration effect and mechanism of pavement runoff in permeable asphalt pavement. Constr. Build. Mater. 2015, 100, 102–110. [Google Scholar] [CrossRef]
  16. Chen, S.; Lin, X.; Zheng, C.; Guo, X.; Chen, W. Evaluation of Siltation Degree of Permeable Asphalt Pavement and Detection of Noise Reduction Degree. Appl. Sci. 2020, 11, 349. [Google Scholar] [CrossRef]
  17. Qin, H.; Li, Z.; Fu, G. The effects of low impact development on urban flooding under different rainfall characteristics. J. Environ. Manag. 2013, 129, 577–585. [Google Scholar] [CrossRef] [PubMed]
  18. Luan, Q.; Fu, X.; Song, C.; Wang, H.; Liu, J.; Wang, Y. Runoff Effect Evaluation of LID through SWMM in Typical Mountainous, Low-Lying Urban Areas: A Case Study in China. Water 2017, 9, 439. [Google Scholar] [CrossRef]
  19. Zhang, K.; Chui, T.F.M.; Yang, Y. Simulating the hydrological performance of low impact development in shallow groundwater via a modified SWMM. J. Hydrol. 2018, 566, 313–331. [Google Scholar] [CrossRef]
  20. Qin, F.; Huang, L.; Qi, X.; Sun, L.; Cui, J.; Wei, Y. Optimal LID Designs Based on SWMM Simulations Regarding the Sustainable Efficacy of Stormwater Management in Port Areas. Sustainability 2025, 17, 2544. [Google Scholar] [CrossRef]
  21. Jia, J.; Wang, J.; Cao, S.; Wang, J.; Zhang, S.; Guo, Y. SWMM Simulation of the Stormwater Volume Control Performance of Rainwater Harvesting Systems. J. Hydrol. Eng. 2025, 30, 04024052. [Google Scholar] [CrossRef]
  22. Helene, S.; Britta, S. Simulating Effectiveness of Low Impact Development (LID) for Different Building Densities in the Face of Climate Change Using a Hydrologic-Hydraulic Model (SWMM5). Hydrology 2025, 12, 200. [Google Scholar] [CrossRef]
  23. Li, Z.; Cao, Y.; Zhang, J.; Liu, W. Urban rainfall characteristics and permeable pavement structure optimization for sponge road in North China. Water Sci. Technol. A J. Int. Assoc. Water Pollut. Res. 2021, 83, 1932–1945. [Google Scholar] [CrossRef]
  24. Zhang, X.; Xu, Z.; Lv, Q.; Xu, T. Hydrodynamic self-cleaning behaviors of double-layer drainage asphalt pavement. J. Clean. Prod. 2025, 486, 144582. [Google Scholar] [CrossRef]
  25. Xiao, J.; Wang, T.; Hong, J.; Ruan, C.; Zhang, Y.; Yuan, D.; Wu, W. Experimental Study of Permeable Asphalt Mixture Containing Reclaimed Asphalt Pavement. Sustainability 2023, 15, 10676. [Google Scholar] [CrossRef]
  26. Abdalla, E.M.H.; Muthanna, T.M.; Alfredsen, K.; Sivertsen, E. Towards improving the hydrologic design of permeable pavements. Blue Green Syst. 2022, 4, 197. [Google Scholar] [CrossRef]
  27. Sabbaghian, J.R.; Fereshtehpour, M.; Hosseinabad, G.R.M. Integrated hydrologic-economic modeling for urban flood risk mitigation using SWMM, HEC-RAS, and HAZUS: A case study of the Bronx river watershed, NYC. Sustain. Water Resour. Manag. 2025, 11, 97. [Google Scholar] [CrossRef]
  28. Bragg, A.M.; Poudel, A.; Vasconcelos, G.J. Comparing SWMM and HEC-RAS Hydrological Modeling Performance in Semi-Urbanized Watershed. Water 2025, 17, 1331. [Google Scholar] [CrossRef]
  29. Yang, L. Research on the Simulation and Evaluation of Urban Waterlogging Prevention and Control Based on SWMM Model. Eng. Technol. Res. 2023, 8, 195–197. [Google Scholar]
  30. Zhao, Y.; Zhang, J.; Li, T.; Xia, W. Parameter Sensitivity Analysis and Method Comparison of Rainfall Runoff Model. China Water Wastew. Water 2021, 37, 114–120. [Google Scholar]
  31. Morgenroth, J.; Buchan, G.; Scharenbroch, C.B. Belowground effects of porous pavements—Soil moisture and chemical properties. Ecol. Eng. 2013, 51, 221–228. [Google Scholar] [CrossRef]
  32. Serizawa, H.; Amemiya, T.; Itoh, K. River channel networks created by Poisson Equation and Inhomogeneous Permeability Models (II: Horton’s law and fractality. J. Adv. Simul. Sci. Eng. 2019, 6, 386–415. [Google Scholar] [CrossRef]
  33. Steffen, D.; Roland, L.; Nanna, R.; Lina, J.; Karsten, A.N. Initial conditions of urban permeable surfaces in rainfall-runoff models using Horton’s infiltration. Water Sci. Technol. A J. Int. Assoc. Water Pollut. Res. 2018, 77, 662–669. [Google Scholar] [CrossRef]
  34. Assaf, M.N.; Salis, N.; Manenti, S.; Tamellini, L.; Creaco, E.; Todeschini, S. Optimizing hydrological modelling on real urban catchment: Impact of calibration data selection and objective function. J. Hydrol. 2025, 662 (Part A), 133821. [Google Scholar] [CrossRef]
  35. Xu, J.; Du, X.; Zhao, X.; Li, L. Analytical Stability Analysis of Rainfall-Infiltrated Slopes Based on the Green–Ampt Model. Int. J. Geomech. 2023, 23, 04022277. [Google Scholar] [CrossRef]
  36. Sun, Y.; Huang, Y. Study on the value of runoff coefficient of greenland in Jiaxing region under the condition of sponge city. Water Waste Water Eng. 2020, 56, 107–110. [Google Scholar]
  37. Zhou, Z.; Liu, S.; Sun, L.; Liu, Y. Unraveling nonlinear urban waterlogging responses to rainfall structure: A data-driven analysis in a highly urbanized megacity. J. Hydrol. 2025, 664 Pt A, 134349. [Google Scholar] [CrossRef]
  38. Galli, A.; Peruzzi, C.; Beltrame, L.; Cislaghi, A.; Masseroni, D. Evaluating the infiltration capacity of degraded vs. rehabilitated urban greenspaces: Lessons learnt from a real-world Italian case study. Sci. Total Environ 2021, 787, 147612. [Google Scholar] [CrossRef]
  39. Yun, D.; Chen, Y.; Jia, H.; Wang, Q.; Chen, Z.; Xu, C.; Li, Q.; Wang, W.; Yang, Y.; Fu, G.; et al. Sponge city practice in China: A review of construction, assessment, operational and maintenance. J. Clean. Prod. 2021, 280, 124963. [Google Scholar] [CrossRef]
  40. Hua, P.; Yang, W.; Qi, X.; Jiang, S.; Xie, J.; Gu, X.; Li, H.; Zhang, J.; Krebs, P. Evaluating the effect of urban flooding reduction strategies in response to design rainfall and low impact development. J. Clean. Prod. 2020, 242, 118515. [Google Scholar] [CrossRef]
  41. Liu, C.; Xie, T.; Yu, Q.; Niu, C.; Sun, Y.; Xu, Y.; Luo, Q.; Hu, C. Study on the response analysis of LID hydrological process to rainfall pattern based on framework for dynamic simulation of urban floods. J. Environ. Manag. 2024, 351, 119953. [Google Scholar] [CrossRef] [PubMed]
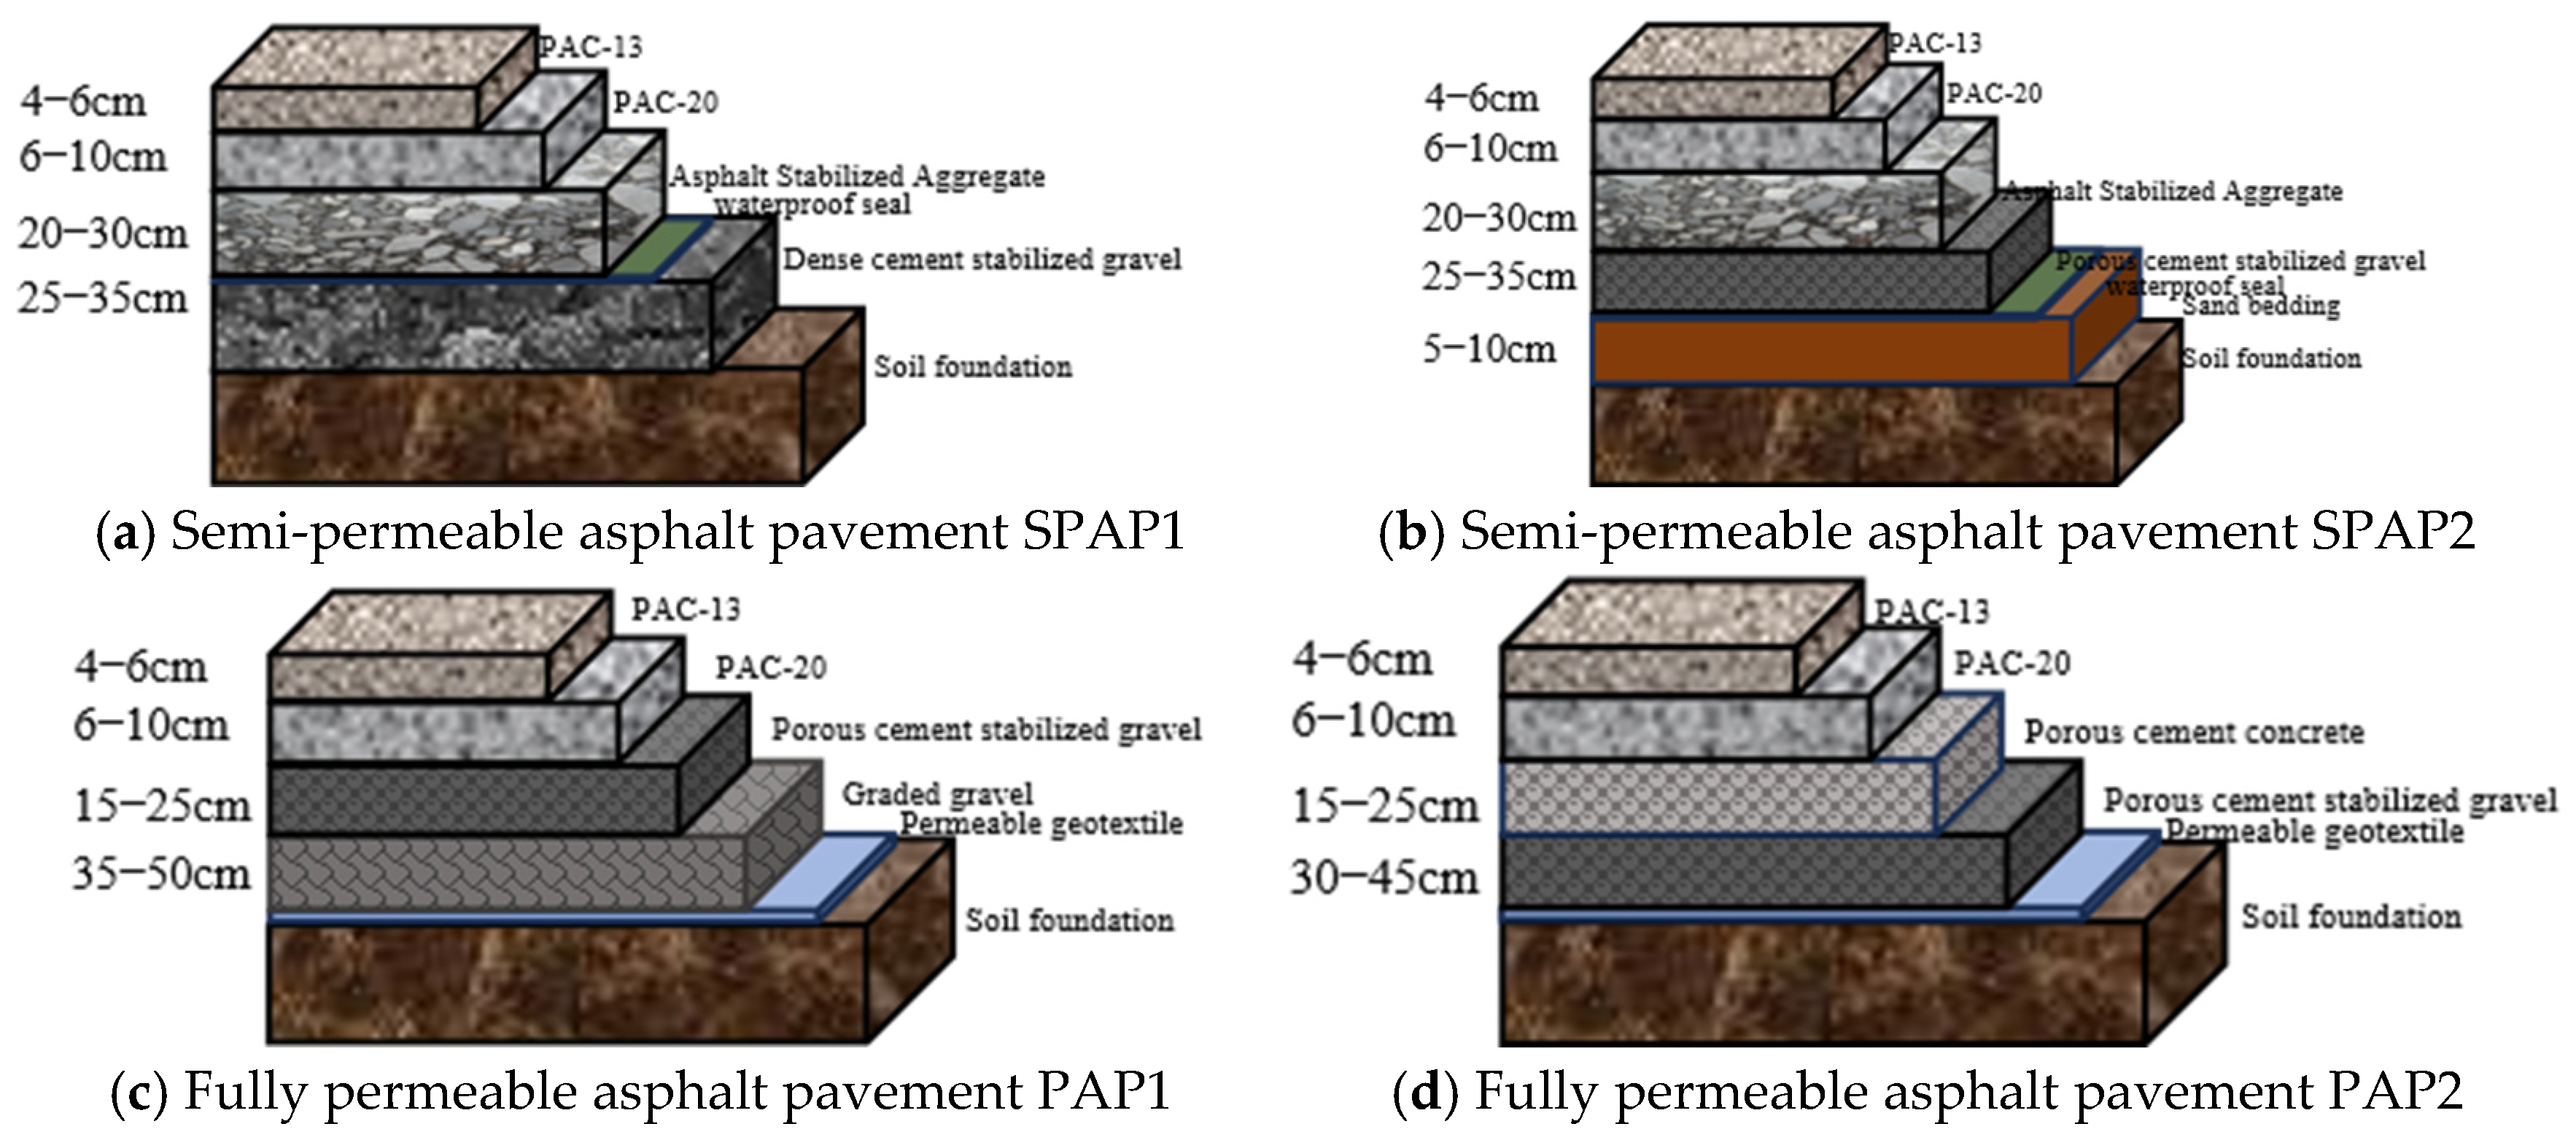
Figure 1. Structure of permeable asphalt pavement.
Water 17 03347 g001
Figure 2. Road model subcatchment area generalization map.
Water 17 03347 g002
Figure 3. Comparison of runoff from different pavement structures.
Water 17 03347 g003
Figure 4. Changes in road infiltration parameters.
Water 17 03347 g004
Figure 5. Changes in maximum runoff reduction rates.
Water 17 03347 g005
Figure 6. Change in load shedding rate.
Water 17 03347 g006
Figure 7. Changes in pollutant concentrations in regional drainage.
Water 17 03347 g007aWater 17 03347 g007b
Figure 8. Changes in pollutant flushing reduction rates.
Water 17 03347 g008
Figure 9. Variation in total regional runoff residual pollutant washout.
Water 17 03347 g009
Figure 10. Changes in Pollutant Loadings for Pipe Sections.
Water 17 03347 g010
Table 1. Table of values of hydrological parameters of the SWMM.
Land Use TypeManning’s Coefficient
SWMM Recommended ValuesModel Values
Permeable zone0.15~0.410.15
Impermeable zone0.013~0.0240.012
Rainwater network0.012~0.0220.017
Table 2. SWMM’s LID parameter setting table.
StratumProperty ParameterSPAP1SPAP2PAP1PAP2OP
Surface LayerStorage Depth (mm)5
Surface Manning’s Coefficient0.012
Surface Slope (%)2
Pavement LayerPavement Thickness (mm)140140140340140
Composite Pore Ratio0.2650.2650.2650.2650.280
Impermeable Surface Fractions00000
Permeation Rate (mm/h)479.6479.6479.6453.5271.6
AquiferStorage thickness (mm)2505507006000
Porosity Ratio0.2780.3010.3250.3220.24
Seepage Rate (mm/h)00359.7359.70
Drain CulvertFlow Coefficient3.23.2///
Drainage Index0.50.5///
Offset Height (mm)00///
Table 3. Calculation of regional pollutant washout.
Recurrence PeriodRoad Surface TypeCOD/kgNH3-N/kgPP/kgSS/kg
1SPAP10000
SPAP20000
PAP10000
PAP20000
OP0.9560.120.0081.116
3SPAP10000
SPAP20000
PAP10000
PAP20000
OP1.6960.2160.0161.98
5SPAP10.2560.0320.0040.3
SPAP20000
PAP10000
PAP20000
OP2.040.260.022.38
10SPAP10.7160.0920.0080.836
SPAP20000
PAP10000
PAP20000
OP2.5040.3160.0242.92
20SPAP11.1920.1520.0121.392
SPAP20000
PAP10000
PAP20000
OP2.980.3760.0323.476
30SPAP11.4640.1840.0161.708
SPAP20000
PAP10000
PAP20000
OP3.2480.4120.0323.792
50SPAP11.8040.2280.022.108
SPAP20000
PAP10000
PAP20000
OP3.5920.4560.0364.188
100SPAP12.2680.2880.0242.648
SPAP20.1080.01200.124
PAP10000
PAP20000
OP4.0520.5120.044.728
Disclaimer/Publisher’s Note: The statements, opinions and data contained in all publications are solely those of the individual author(s) and contributor(s) and not of MDPI and/or the editor(s). MDPI and/or the editor(s) disclaim responsibility for any injury to people or property resulting from any ideas, methods, instructions or products referred to in the content.