Article

Rooftop-Scale Runoff Reduction Performance of Smart Blue-Green Roofs and Their Potential Role in Urban Flood Mitigation

1
Green Land & Water Management Research Institute, Pusan National University, Busan 46241, Republic of Korea
2
Earth Green Korea Co., Ltd., Gimpo-si 10030, Republic of Korea
3
Land & Housing Research Institute, Daejeon 34047, Republic of Korea
4
Education & Research Center for Infrastructure of Smart Ocean City, Pusan National University, Busan 46241, Republic of Korea
*
Author to whom correspondence should be addressed.
Water 2025, 17(22), 3328; https://doi.org/10.3390/w17223328
Submission received: 26 September 2025 / Revised: 17 November 2025 / Accepted: 19 November 2025 / Published: 20 November 2025
(This article belongs to the Special Issue Application of Hydrological Modelling to Water Resources Management)

Abstract

Urban areas face increasing flood risks due to climate change, intensified rainfall events, and high impervious surface coverage. Blue-Green Roofs (BGR) have emerged as a nature-based solution to retain stormwater, while Smart BGR systems integrate active control functions to enhance performance under varying rainfall conditions. This study evaluated the rooftop-scale runoff reduction efficiency of conventional roofs, BGR, and Smart BGR using 31 monitored rainfall events in 2024, while eight years of historical rainfall data (2017–2024) were used only to characterize long-term rainfall patterns in the study area. A multiple-linear regression analysis was performed for exploratory trend identification between rainfall characteristics and runoff reduction; variables unrelated to short-term storm responses such as evapotranspiration or initial storage were beyond the study scope. Results showed that the annual runoff per unit area was 1.115 m3/m2 for conventional roofs, 0.547 m3/m2 for BGR, and 0.128 m3/m2 for Smart BGR, corresponding to reduction rates of 50.98% and 88.53% for BGR and Smart BGR, respectively. In higher rainfall classes, Smart BGR maintained significantly higher performance: for Class 3 (average 53.00 mm), BGR reduced runoff by 54.89% while Smart BGR achieved 86.71%; for Class 4 (average 121.21 mm), the rates were 54.68% and 90.00%, respectively. These findings indicate that Smart BGR’s storage optimization and controlled discharge enable superior effectiveness during intense and prolonged events. The study highlights Smart BGR’s potential as an advanced stormwater management technology, offering clear advantages over both conventional roofs and passive BGR designs. Limitations include the need for testing under more extreme rainfall scenarios, optimization of operational strategies, and economic feasibility assessments. Nevertheless, Smart BGR represents a promising approach for enhancing urban flood resilience in the context of climate change.

1. Introduction

Flooding and waterlogging events are natural disasters that cause significant harm to human life and infrastructure across the globe, including South Korea [1,2,3,4]. The frequency and severity of extreme weather events have been intensifying worldwide as a result of climate change. In particular, urban areas are increasingly vulnerable to flood damage due to the expansion of impervious surfaces [5,6,7,8]. During periods of intense rainfall, the natural processes of infiltration and evapotranspiration are significantly hindered, resulting in rapid increases in surface runoff. This in turn amplifies the risk of urban flooding [9,10].
For example, during the period from 25 June to 26 July 2023, parts of South Korea such as Cheongyang and Gongju recorded over 1000 mm of rainfall, while Mungyeong and Cheongju experienced 940 mm and 908 mm, respectively. These extreme precipitation events resulted in 75 human casualties (48 deaths, 3 missing, and 24 injuries) and property damages estimated at over KRW 751.3 billion [11]. Similarly, the European Union and the United Kingdom report annual flood damages amounting to approximately €7.6 billion, affecting around 160,000 people directly or indirectly [12,13]. In China, from 29 July to 2 August 2023, typhoon-induced flooding affected approximately 1.29 million people and resulted in 33 fatalities [14]. Such recurring losses—both human and economic—have been exacerbated by accelerating climate change, urbanization, and economic growth [15].
Faced with these increasing water-related disasters, there is a growing need for new urban water management strategies that enhance sustainability and climate adaptation. Traditional flood management approaches based on gray infrastructure are increasingly showing their limitations. In contrast, nature-based solutions (NbS), which emulate and harness the functions of natural ecosystems, are gaining attention as effective and sustainable alternatives [14,16,17,18,19,20]. Rooftop runoff generation is determined by rainfall depth and temporal distribution, roof imperviousness, drainage pathways, and the amount of available storage prior to rainfall. Accordingly, runoff control in this study refers to the ability of a rooftop system to temporarily store, delay, or eliminate surface discharge during storm events. Smart BGR systems aim to increase this control capacity by actively managing the storage state before and during rainfall.
Among various NbS technologies, green roofs have been widely adopted as multifunctional systems that expand green space in densely built urban environments, temporarily retain rainwater to reduce peak runoff, and mitigate the urban heat island effect through evapotranspiration [21,22]. However, conventional green roofs typically consist of vegetation and drainage layers, which offer limited water retention capacity. During extended or intense rainfall events such as monsoon seasons or increasingly frequent downpours driven by climate change, these systems can exceed their retention limits, leading to overflow and diminishing their effectiveness in mitigating stormwater runoff [23,24]. Overcoming this limitation has been identified as a critical challenge for enhancing the flood mitigation function of green roofs in urban settings.
To address these shortcomings, this study investigates the implementation of a Blue-Green Roof (BGR) system, which integrates a water-retaining blue layer beneath the green roof structure. This layer allows for temporary rainwater storage and is connected to an underground storage tank, thereby forming an extended water cycle system that enhances overall retention capacity. The blue layer retains a portion of stormwater, delays initial runoff, and facilitates gradual evapotranspiration or delayed discharge, contributing to healthier urban water cycles. BGR systems have been increasingly recognized as effective NbS technologies that provide not only runoff control but also broader benefits for human well-being and urban resilience [25,26].
Previous research by Lee et al. (2023) demonstrated that passive BGR systems in Korea achieved nearly complete runoff elimination for ≤10 mm rainfall events and 84.7% reduction for 11–100 mm events, but performance sharply declined to 39.8% under >100 mm events [27]. These results indicate that passive BGR systems become storage-limited and lose effectiveness as rainfall magnitude increases. Therefore, the present study evaluates whether a Smart BGR system equipped with active water-level control can maintain high runoff reduction performance even under large rainfall events, by comparing it against a passive BGR and a conventional roof under real rainfall conditions.
The BGR and smart BGR system applied in this study incorporates a smart integrated underground reservoir, which activates once the blue layer approaches its storage capacity. Installed on the rooftop of a school building, this system is interconnected with an underground tank located between the building and the schoolyard. Once the water level in the blue layer reaches a designated threshold, sensors and automated valves redirect the excess rainwater to the underground storage tank. This ensures that the blue layer remains available for additional retention during subsequent storms, thereby continuously enhancing flood mitigation capacity. Moreover, the stored water can be reused for non-potable purposes such as irrigation and cleaning, improving the efficiency of rainwater use [28,29].
This paper presents the design concept, system components, and installation process of the proposed BGR system, along with a quantitative analysis of its performance in rainwater retention and runoff control under real-world conditions (see Figure 1). The system’s effectiveness is evaluated using one year of rainfall monitoring data, with a focus on how the integration between the blue layer and the underground tank influences flood reduction. Comparative analyses with conventional green roofs further demonstrate the superior hydrological function of the proposed system. Additionally, the study examines the economic and environmental benefits of BGR implementation, aiming to provide practical insights for urban water management policies and the future expansion of green infrastructure in cities.
Ultimately, this research proposes an innovative and effective stormwater management solution that contributes to sustainable urban development. By reducing flood risks and promoting efficient rainwater utilization, the integrated Blue-Green Roof and underground storage system represents a valuable NbS approach. The findings of this study are expected to offer critical scientific evidence to inform future urban water management strategies and green infrastructure policy decisions.

2. Materials and Methods

2.1. Description of Study Area

The demonstration site for the BGR system is located at Gochon Middle School in Gimpo-si, Gyeonggi-do, South Korea, approximately 3 km north of Gimpo Airport and near the Han River. The geographical location and spatial configuration of the experimental roofs and underground storage tank are illustrated in Figure 1. As shown in the figure, three rooftop sections were designated for experimental comparison: the conventional roof (A), the BGR (B), and the smart BGR (C). An 80-ton corrugated-resin underground storage tank (D) was installed beneath the school playground and hydraulically connected to each rooftop section. The BGR and smart BGR systems were installed on the rooftop of one of the classroom buildings to evaluate their hydrological performance under real-world rainfall conditions. The underground tank temporarily stores excess rooftop runoff and supplies irrigation water during dry periods, forming a closed-loop configuration that supports efficient water-quality management and represents a practical retrofit design for existing buildings.
Each roof section was hydraulically connected to the underground tank through independent drainage pipes (Figure 2A). Flowmeters were installed only at the overflow discharge outlets to measure the passive surface runoff, excluding any actively drained flows through the Smart BGR valve. Accordingly, the monitored discharge represents the actual surface runoff that leaves the roof system and could contribute to urban flooding, allowing a direct comparison of the flood-mitigation capacity between the Smart BGR and conventional BGR under identical rainfall conditions.

2.2. Installation of Facilities for Smart BGR System Evaluation

In this study, the BGR and Smart BGR were used as experimental groups, while the conventional roof served as the control group. The monitored surface areas for each system were as follows: 120 m2 for the conventional roof, 80 m2 for the BGR, and 100 m2 for the Smart BGR. These areas were not identical due to the presence of existing rooftop structures and drainage pathways at Gochon Middle School, which constrained the available installation space. Therefore, runoff performance was evaluated based on unit area (m2) rather than by comparing total runoff volumes.
Both the BGR and Smart BGR systems were constructed using modular units. As shown in Figure 2A, a total of 1125 modules were installed across 180 m2 of rooftop area (500 modules for the BGR and 625 modules for the Smart BGR). Each module measures 400 mm (W) × 400 mm (L) × 150 mm (H) and weighs approximately 3.4 kg, resulting in a total module weight of about 3825 kg. The blue layer depth of 150 mm was determined primarily based on the structural safety limits of the existing building and the operational requirements of the green layer. Increasing the layer thickness would have significantly increased the static and saturated load on the roof, which could compromise the building’s structural integrity. The 150 mm depth was empirically verified to provide sufficient water storage for vegetation health and evapotranspiration while maintaining an acceptable load margin. Each module provides a storage capacity of approximately 6 L, allowing the Smart BGR section to retain about 3750 L of rainwater in total.
The Smart BGR is equipped with a water level sensor and a valve-based active control mechanism that automatically regulates the storage depth in the blue layer. When the stored water height reaches 120 mm (Drain Start Point), the valve opens automatically, allowing the stored water to drain to the underground storage tank by gravity without any pumping assistance. When the water level drops below 50 mm (Re-fill Start Point), water is actively pumped back from the underground tank to the blue layer to maintain soil moisture and vegetation health. This configuration enables real-time feedback control of rooftop storage capacity and provides an additional buffering effect that reduces the overall volume of overflow compared with the passive-overflow-only BGR.
The underground tank, with a total volume of 80 m3, temporarily retains excess runoff from multiple rooftop sections for reuse in irrigation, rather than being optimized against a specific rainfall return period. When the underground tank reaches full capacity during extreme rainfall, excess water is discharged through an overflow pipe connected to the municipal storm drain network, ensuring safe release to the ground level drainage system. This defines the final stage of the drainage hierarchy: (i) storage within the blue layer, (ii) gravity drain transfer to the tank, and (iii) overflow discharge to the external drainage network once design capacity is exceeded.
In this study, the flowmeters were installed only at the overflow outlets, and the monitored runoff therefore represents the actual surface discharge leaving the system and potentially contributing to urban flooding. The internal flow transfer between the blue layer and the underground tank was not monitored, as it does not contribute to surface flood risk. Accordingly, the reported runoff data reflect only the overflow to the external drainage system, allowing a direct comparison of flood mitigation effectiveness among the conventional roof, BGR, and Smart BGR under identical rainfall conditions.
Even under these passive overflow conditions, the Smart BGR exhibited significantly reduced and delayed runoff, demonstrating its superior flood mitigation performance compared with the BGR. We acknowledge that when both the blue layer and the tank become fully saturated, further storage is physically impossible, and the system behaves hydraulically as a conventional roof. This design limitation defines the upper threshold of the Smart BGR’s flood reduction capacity. Future research will integrate underground tank level sensors with real time rainfall forecast data from the Korea Meteorological Administration (KMA) to enable predictive pre-drainage operations prior to heavy rainfall events, thereby enhancing the system’s proactive flood-management capability.
The installation layout and operational principles of the Smart BGR are illustrated in Figure 2A,C, which show the 120 mm drain and 50 mm refill thresholds, the gravity drain and pump refill flow paths, and the locations of flow measuring and sensor points. The actual installation sites of the BGR and Smart BGR on the rooftop of Gochon Middle School, along with the underground storage tank beneath the playground, are shown in Figure 3. Figure 3A shows the fabrication of the blue layer using recycled waste vinyl, manufactured in modular form for easy assembly and installation, as shown in Figure 3B. Figure 3C shows the installation of natural grass forming the green layer, while Figure 3D presents the water-level gauge of the Smart BGR. The Smart BGR and BGR zones are hydraulically connected through stormwater pipes (Figure 3E) to the underground storage tank (Figure 3H). Flow measurement devices were installed to monitor overflow discharge (Figure 3F), and a pumping system was used to operate the circulation loop (Figure 3G). All sensor data were automatically recorded by the data logging system, as illustrated in Figure 3I.

2.3. Field Experiment and Data Acquisition

To evaluate the runoff-mitigation performance of different rooftop types under actual weather conditions, a year-long field monitoring campaign was conducted from 1 January to 31 December 2024 at Gochon Middle School in Gimpo, South Korea. The experiment targeted three rooftop types: a conventional roof, a Blue-Green Roof (BGR), and a Smart BGR, which incorporates active water-level control mechanisms. Each rooftop was equipped with flow meters at the drainage outlets to continuously measure the runoff volume generated during rainfall events. In this study, the KTM-800 ultrasonic flowmeter was utilized to measure runoff from the three roof types during rainfall. The KTM-800 is a non-intrusive, clamp-on ultrasonic flowmeter that employs the transit time measurement principle, enabling accurate flow rate detection without disturbing the flow path. It is suitable for a wide range of pipe diameters and liquid types, including rainwater commonly encountered in environmental experiments. To ensure measurement reliability, the flowmeters were calibrated at a KOLAS accredited (Korea Laboratory Accreditation Scheme) testing agency before deployment. The KTM-800 ultrasonic flowmeter used in this study has a stated measurement accuracy of ±0.5% of reading for flow velocities between 0.3 and 10 m/s and ±1.0% of reading for velocities between 0.01 and 0.3 m/s, with repeatability within 0.2%. Accordingly, the measurement uncertainty of runoff volume estimates in this study is primarily associated with event-to-event variability rather than instrument precision.
Precipitation data were simultaneously collected from an automated weather station located within 1 km of the study site. For consistency and accuracy in hydrological analysis, individual rainfall events were identified and classified based on temporal separation criteria. Specifically, when more than 24 h elapsed without rainfall between events, a new event was defined. In cases of consecutive rainy days, these were treated as a single rainfall event to account for cumulative hydrological responses. Runoff volumes were computed for each distinct rainfall event, and data anomalies caused by sensor malfunction or missing rainfall records were excluded through a quality control process.
A total of 43 rainfall events occurred during the 2024 monitoring period, as summarized in Table 2. Among these, 31 events were successfully recorded and analyzed, while 12 events were excluded: 9 events with no measurable runoff (below sensor detection limits) and 3 events with temporary communication interruptions. These omissions were random and unrelated to rainfall intensity, duration, or antecedent conditions; therefore, they are not expected to introduce selection bias. The monitored events were evenly distributed across the four rainfall classes (Class 1–4), confirming that the analyzed dataset is representative of the full range of rainfall conditions observed in the Gimpo area during 2024. The resulting dataset provides the empirical foundation for evaluating and comparing the runoff-reduction performance of the BGR and Smart BGR systems under real-world urban rainfall conditions. Rainfall was originally recorded at 1 min intervals from the nearby AWS station, and overflow runoff was logged at 10 s intervals via the flowmeter; however, both datasets were aggregated to 1 h intervals for this study to evaluate event-scale cumulative hydrological responses. Sub-hourly hydrograph analysis will be considered in future research to characterize peak attenuation and lag-time dynamics.

2.4. Linear Regression Analysis

A linear regression analysis was conducted to quantify the influence of rainfall characteristics on runoff generation for each roof type. The independent variables considered in the model were rainfall depth (mm), antecedent dry days (ADD, days), and consecutive rainfall days (CRDs, days), while the dependent variable was the total runoff volume (m3) measured from the conventional roof, BGR, and smart BGR during each monitored rainfall event. Separate regression models were developed for each roof type to capture their distinct hydrological responses and to avoid bias caused by structural and functional differences. The general form of the regression model was expressed as:
Q = β 0 + β 1 · P + β 2 · A D D + β 3 · C R D + ϵ  
where Q is the runoff volume (m3), P is rainfall depth (mm), ADD is antecedent dry days (days), and CRDs is consecutive rainfall days (days). The selected predictors represent rainfall-driven factors that directly govern event-scale runoff generation. Variables such as evapotranspiration, initial storage level, or intra-event temperature were excluded because they remain nearly constant or physically negligible during rainfall periods and thus do not act as independent explanatory factors within this study’s scope. The regression analysis was conducted as an exploratory trend assessment rather than a predictive model.
For the conventional roof, rainfall depth typically exhibited the strongest positive correlation with runoff volume. In contrast, the BGR model showed a reduced sensitivity to rainfall depth, reflecting the influence of storage and infiltration provided by the green layer. The smart BGR model demonstrated the lowest dependence on rainfall depth, particularly for small- to medium-intensity events, due to its active water-level control and additional storage capacity in the underground tank. These differences in regression coefficients quantitatively highlight the enhanced runoff mitigation performance of BGR and smart BGR systems compared with the conventional roof.

3. Results

3.1. Analysis Results of Rainfall Characteristics in Gimpo Area

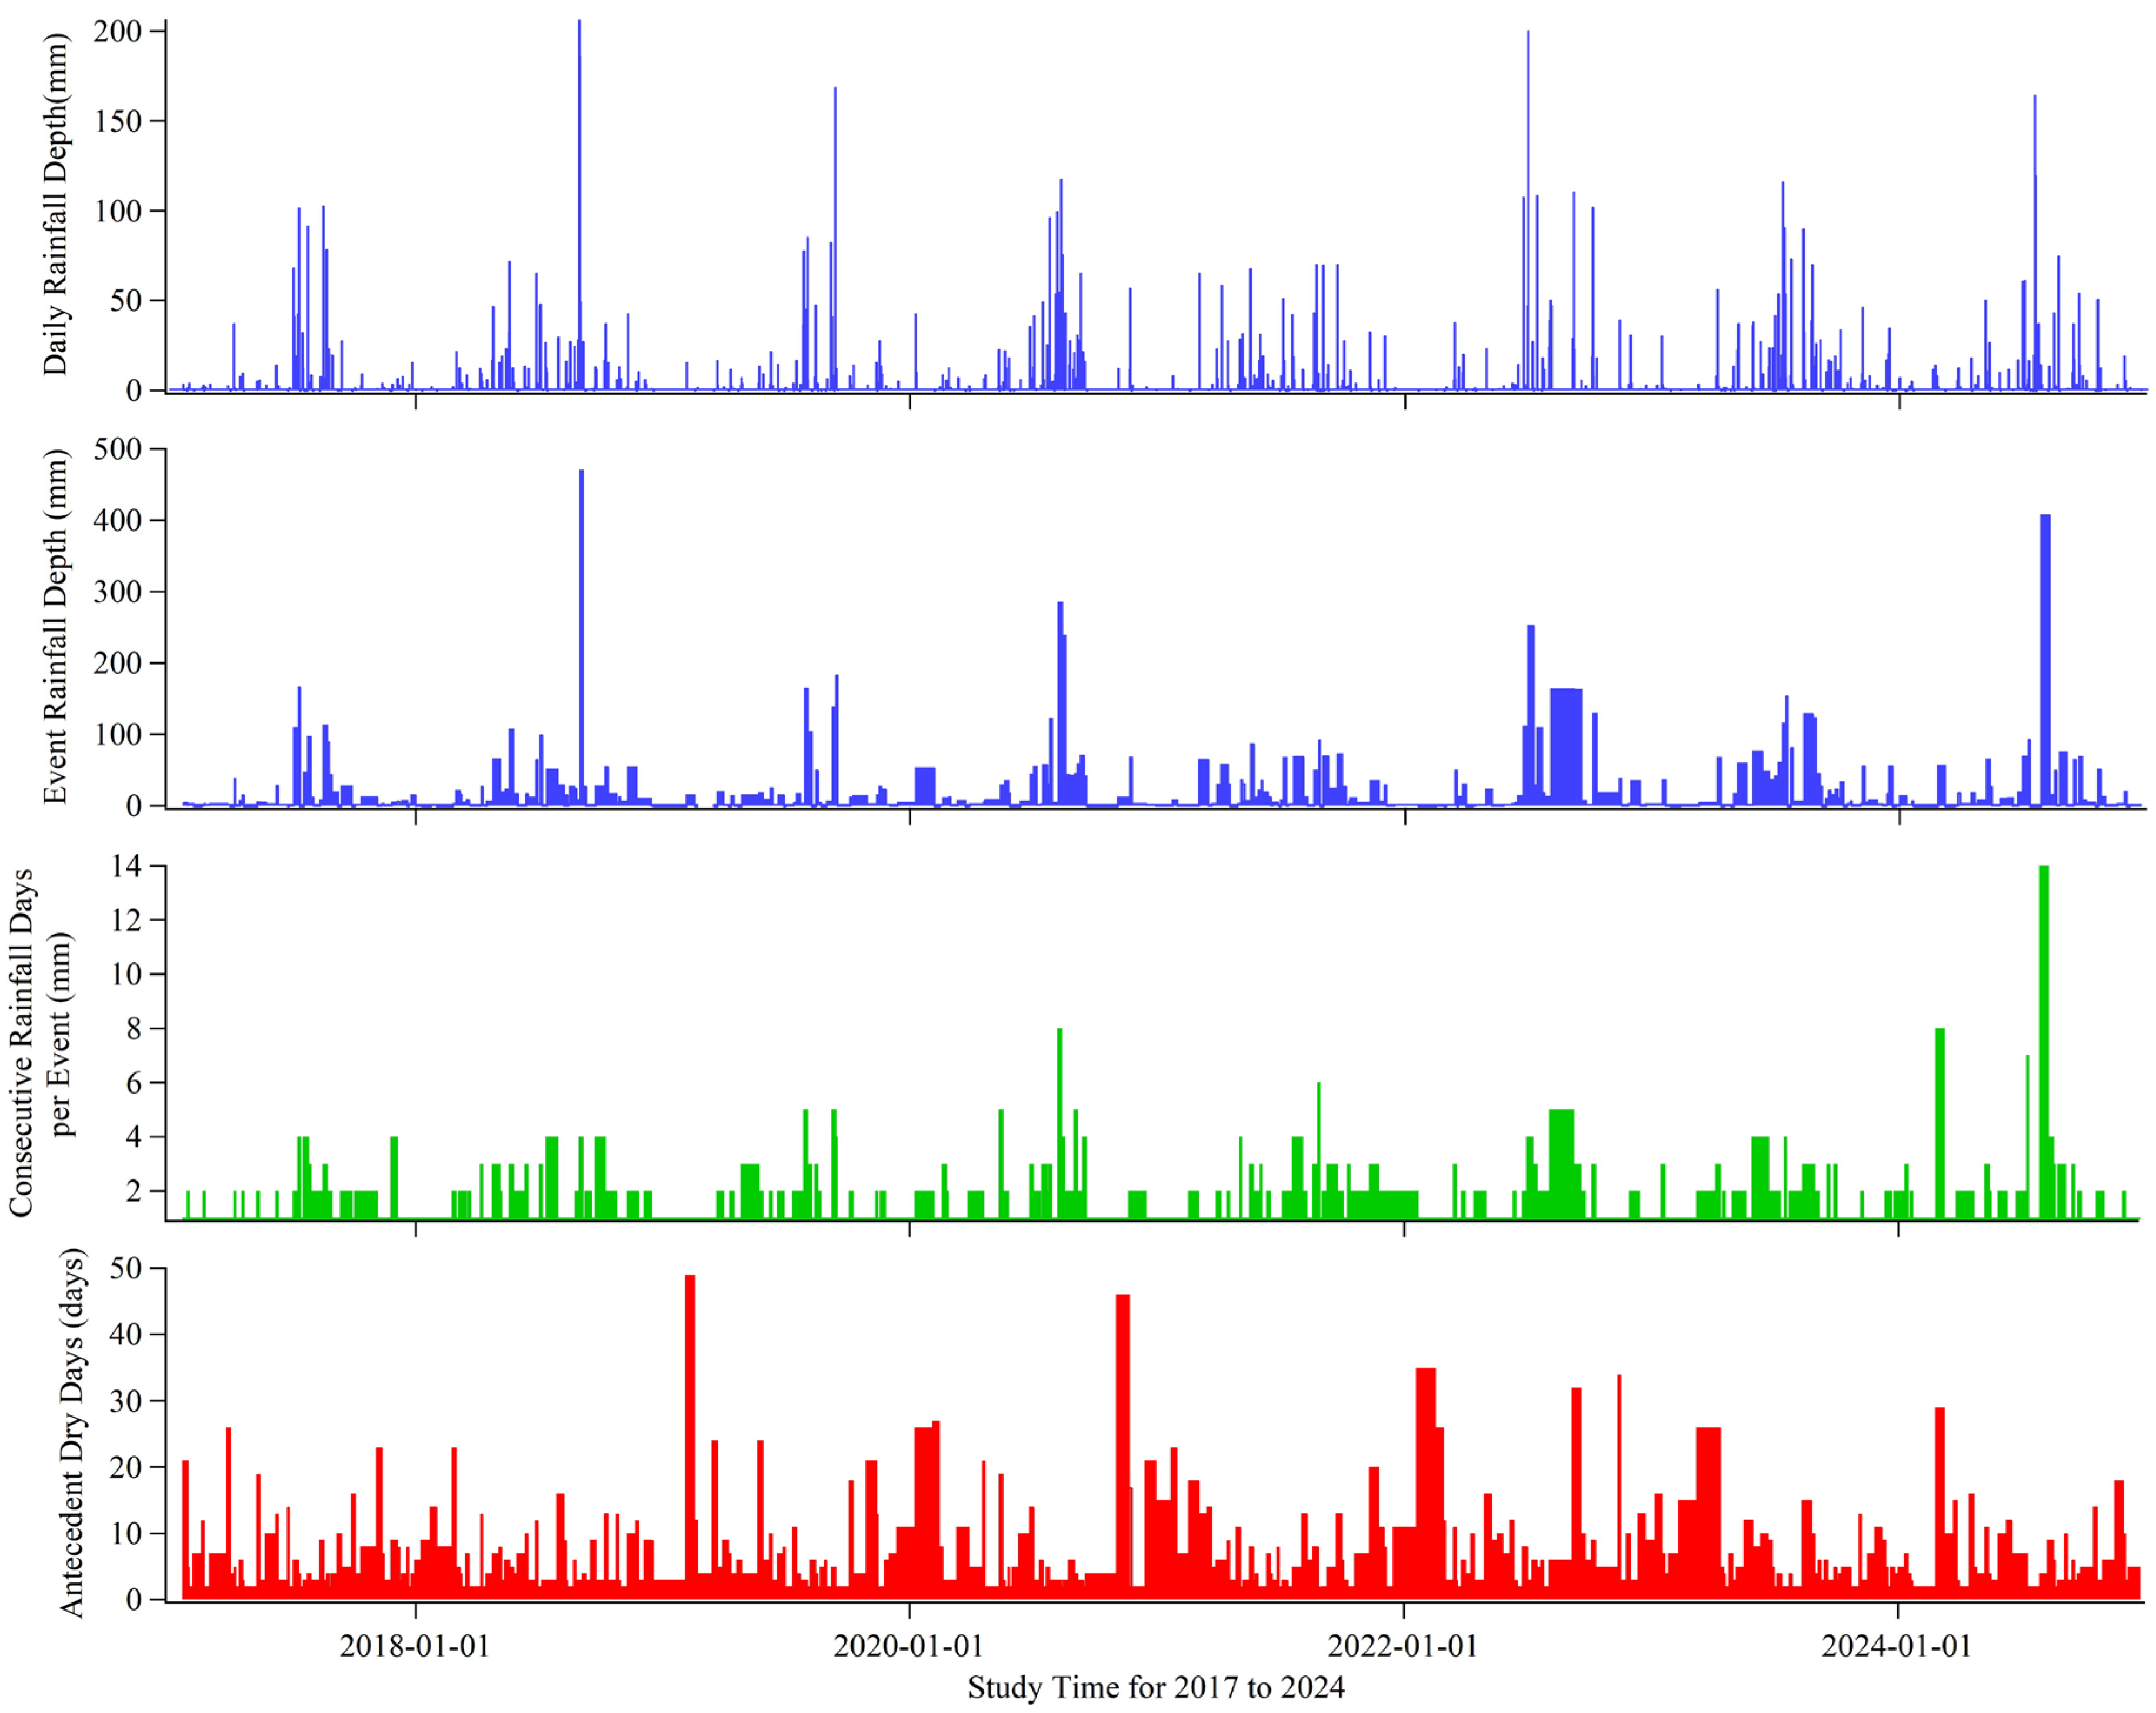
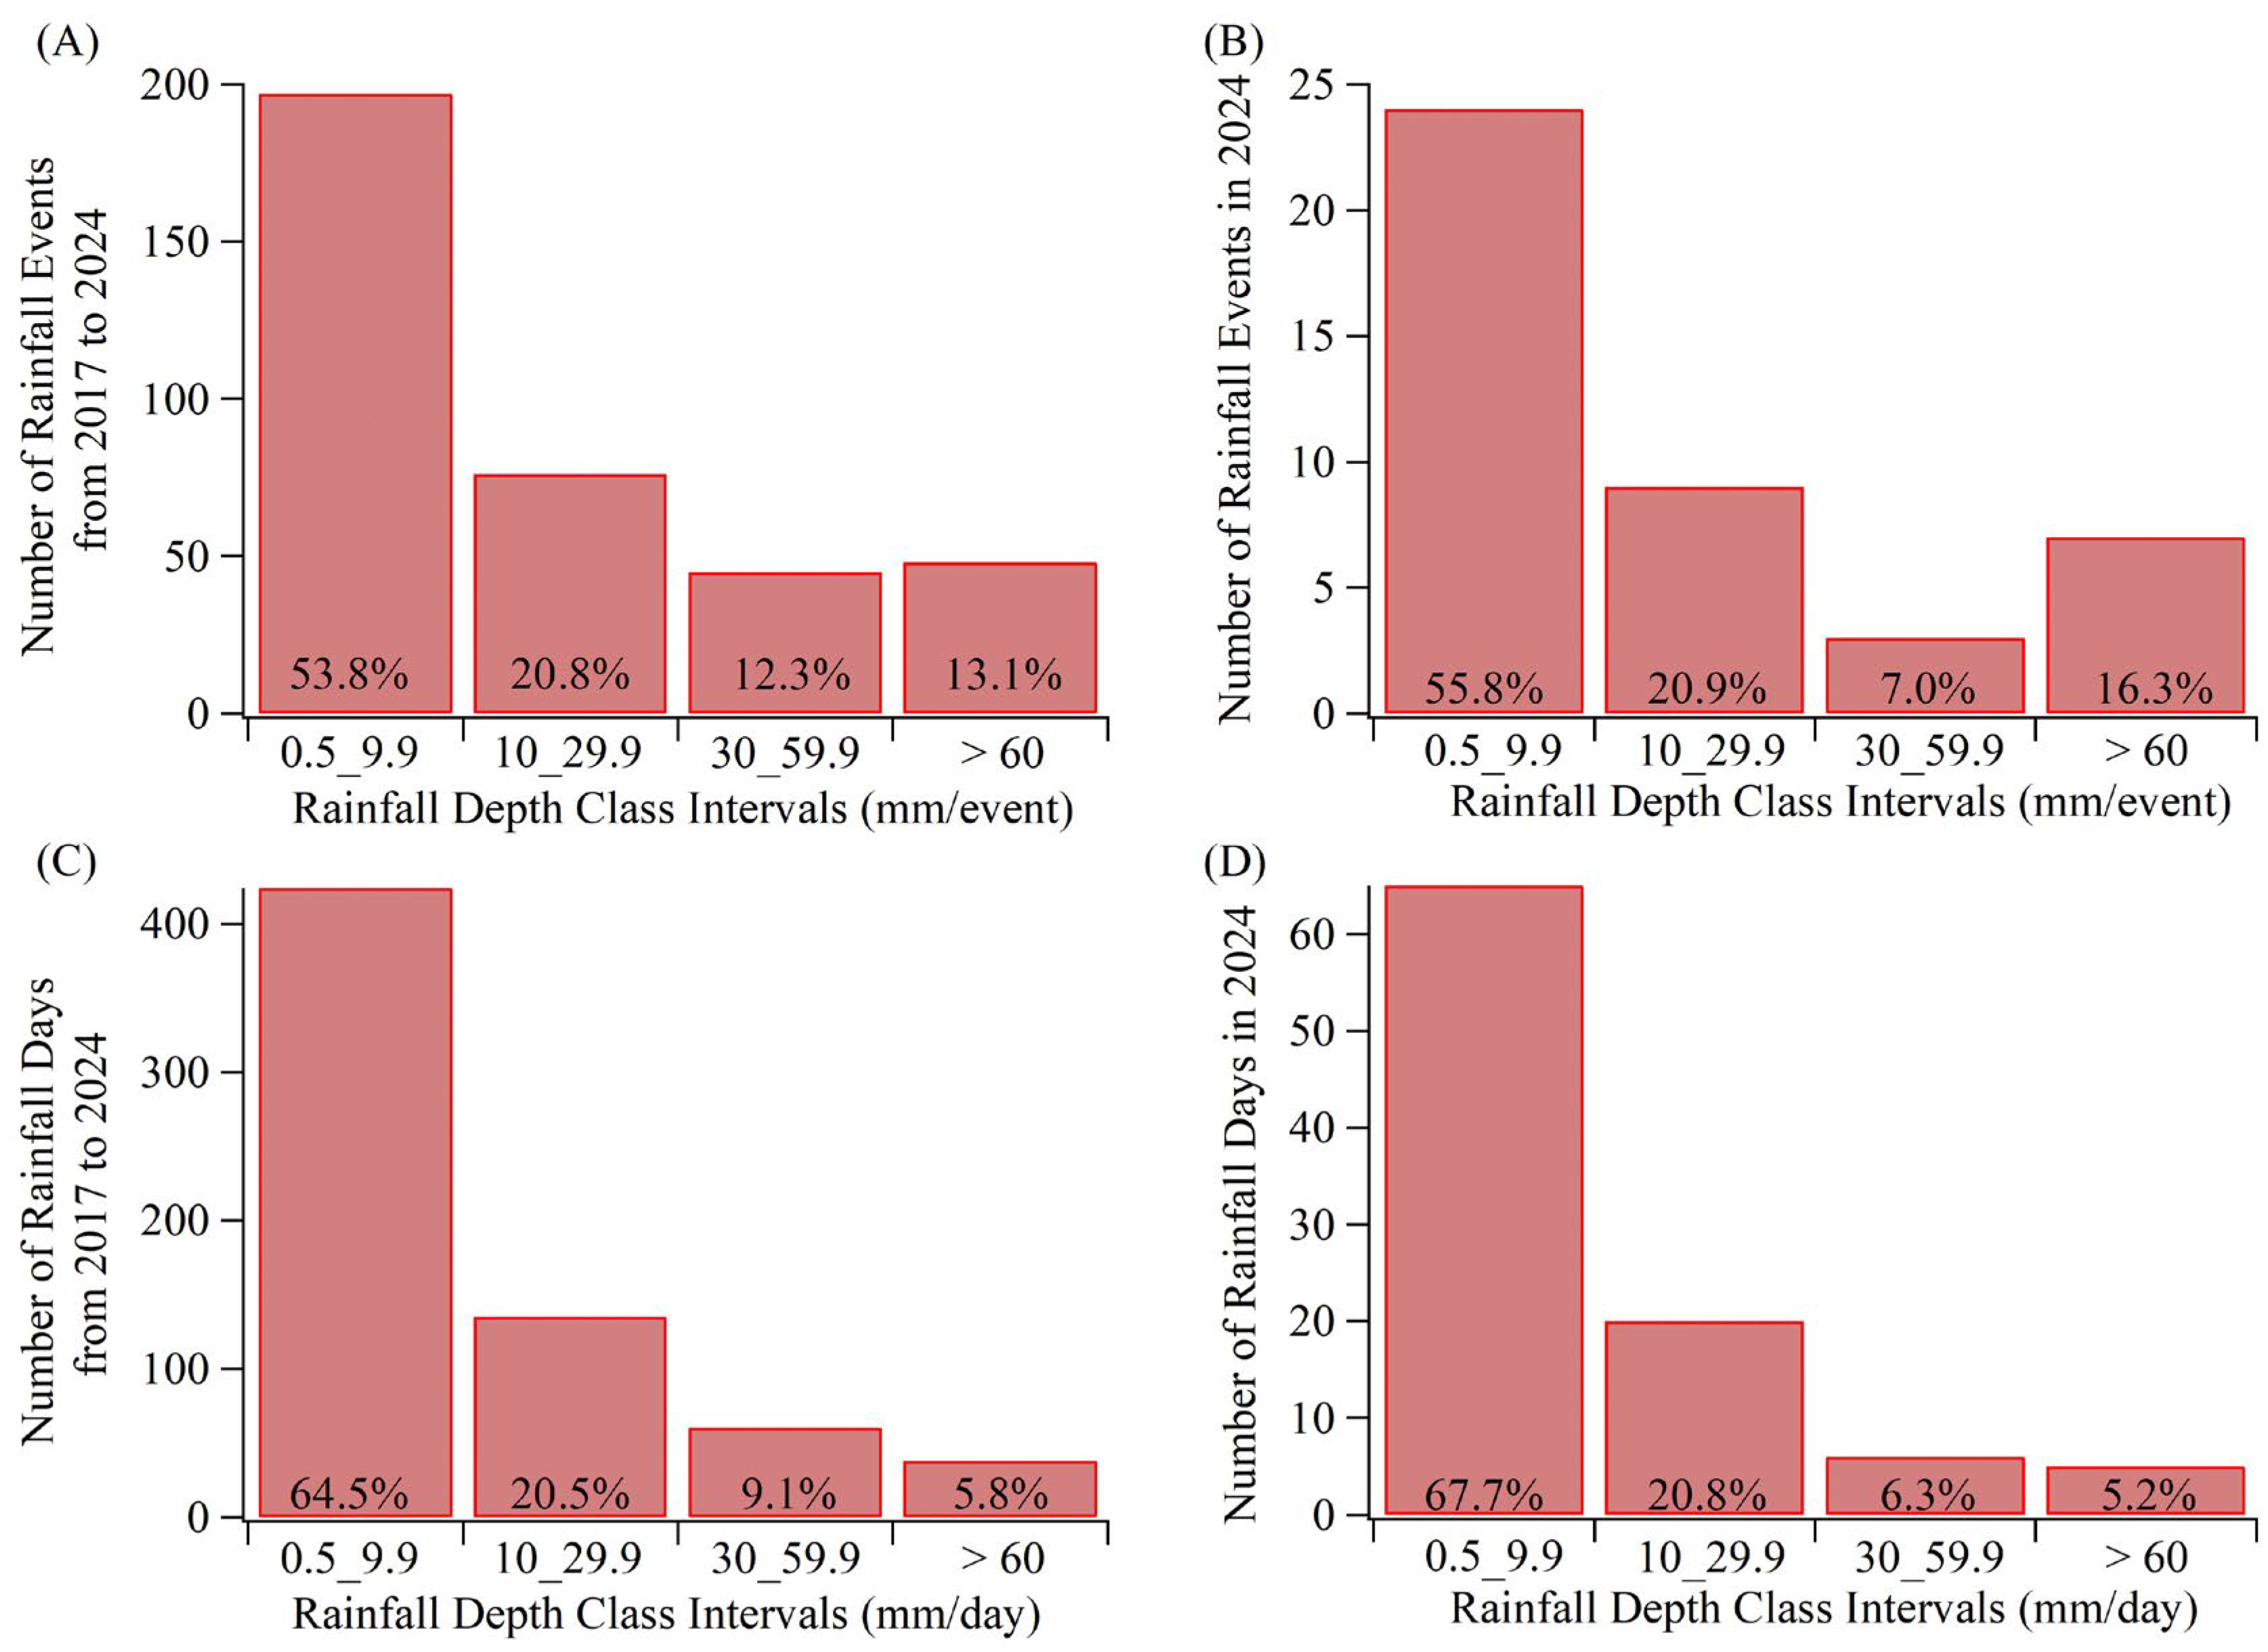
To analyze recent rainfall patterns in the Gimpo area, rainfall data for the recent eight years (2017–2024) were obtained from publicly available datasets provided by the Korea Meteorological Administration. As shown in Table 1 and Figure 4, the average annual rainfall depth in Gimpo during this period was 1242.1 mm. The maximum annual total rainfall occurred in 2023 with 1510.0 mm, while the minimum was 957.5 mm in 2017, showing a difference in more than 500 mm. When rainfall events were categorized into four classes (Class 1: 0.5–9.9 mm/event, Class 2: 10–29.9 mm/event, Class 3: 30–59.9 mm/event, and Class 4: ≥60 mm/event), the proportions were 53.8%, 20.8%, 12.3%, and 13.1% of all rainfall events, respectively (See Figure 5). The mean annual number of rainfall events was 45.9, with a maximum of 52 events and a minimum of 37 events per year.
In Korea, rainfall is typically concentrated during the summer months (July–August), with many cases of CRDs during this period [30]. For the development of flood mitigation and runoff reduction technologies in urban areas, it is essential to analyze the characteristics of rainfall events occurring over one or more consecutive days. In this study, a rainfall event was defined as precipitation occurring within a 24 h period. Based on this criterion, the maximum rainfall per event in the past eight years was 470.5 mm (2018), which occurred over four CRDs, with a maximum daily rainfall of 206.5 mm. The second-highest value was 408.0 mm in 2024, during which rainfall persisted for 14 CRDs. These characteristics indicate the necessity of considering extreme rainfall exceeding 200 mm/day and 400 mm/event when designing urban runoff management strategies and implementing runoff reduction technologies.
The rainfall characteristics in 2024 generally followed the trends observed over the previous eight years, except for the record of 14 CRDs. In 2024, the maximum rainfall per event was 408.0 mm, and the maximum daily rainfall was 164.5 mm. The class distribution of rainfall amount and rainfall events also showed similar trends to the eight-year average. Therefore, using the 2024 rainfall data as the basis for evaluating the runoff reduction efficiency of BGR and smart BGR is considered a reasonable approach for assessing urban runoff mitigation technologies under the rainfall conditions of the Gimpo area (Table 2).

3.2. Evaluation of Runoff Reduction Performance of BGR and Smart BGR

In 2024, rainfall runoff was monitored from three roof types: a conventional roof (control), a BGR, and a smart BGR. Over the year, 43 rainfall events occurred, with 31 successfully monitored. The total runoff volumes for the monitored events were 133.79 m3 for the conventional roof, 43.722 m3 for BGR, and 12.792 m3 for smart BGR. When normalized by roof area, the annual runoff volumes were 1.115 m3/m2 (conventional), 0.547 m3/m2 (BGR), and 0.128 m3/m2 (smart BGR), corresponding to annual runoff reduction rates of 50.98% and 88.53% for BGR and smart BGR, respectively. These annual percentages are cumulative outcomes derived from total annual volumes; therefore, confidence intervals are not statistically applicable to these values. Both BGR and smart BGR incorporate a Blue Layer designed to temporarily store rainfall, meaning runoff performance is influenced by the initial storage level and rainfall characteristics. Under high-intensity rainfall, storage capacity may be exceeded, causing overflow. While this occurs in both systems, smart BGR employs an active control mechanism that optimizes pre-event storage and regulates discharge timing, effectively mitigating overflow impacts during extreme events.
This study focused exclusively on rainfall-period runoff dynamics rather than the full annual hydrological balance. Evapotranspiration (ET) was not included in the short-term event analyses because solar radiation and aerodynamic conditions are minimal during rainfall, and vegetation ET during storm periods is physically negligible. Consequently, rainfall-runoff relationships were evaluated within the timescale of individual events to quantify each system’s immediate retention and reduction capacity. The implications of long-term ET and post-event storage changes are addressed in the Discussion section as potential directions for extended monitoring.
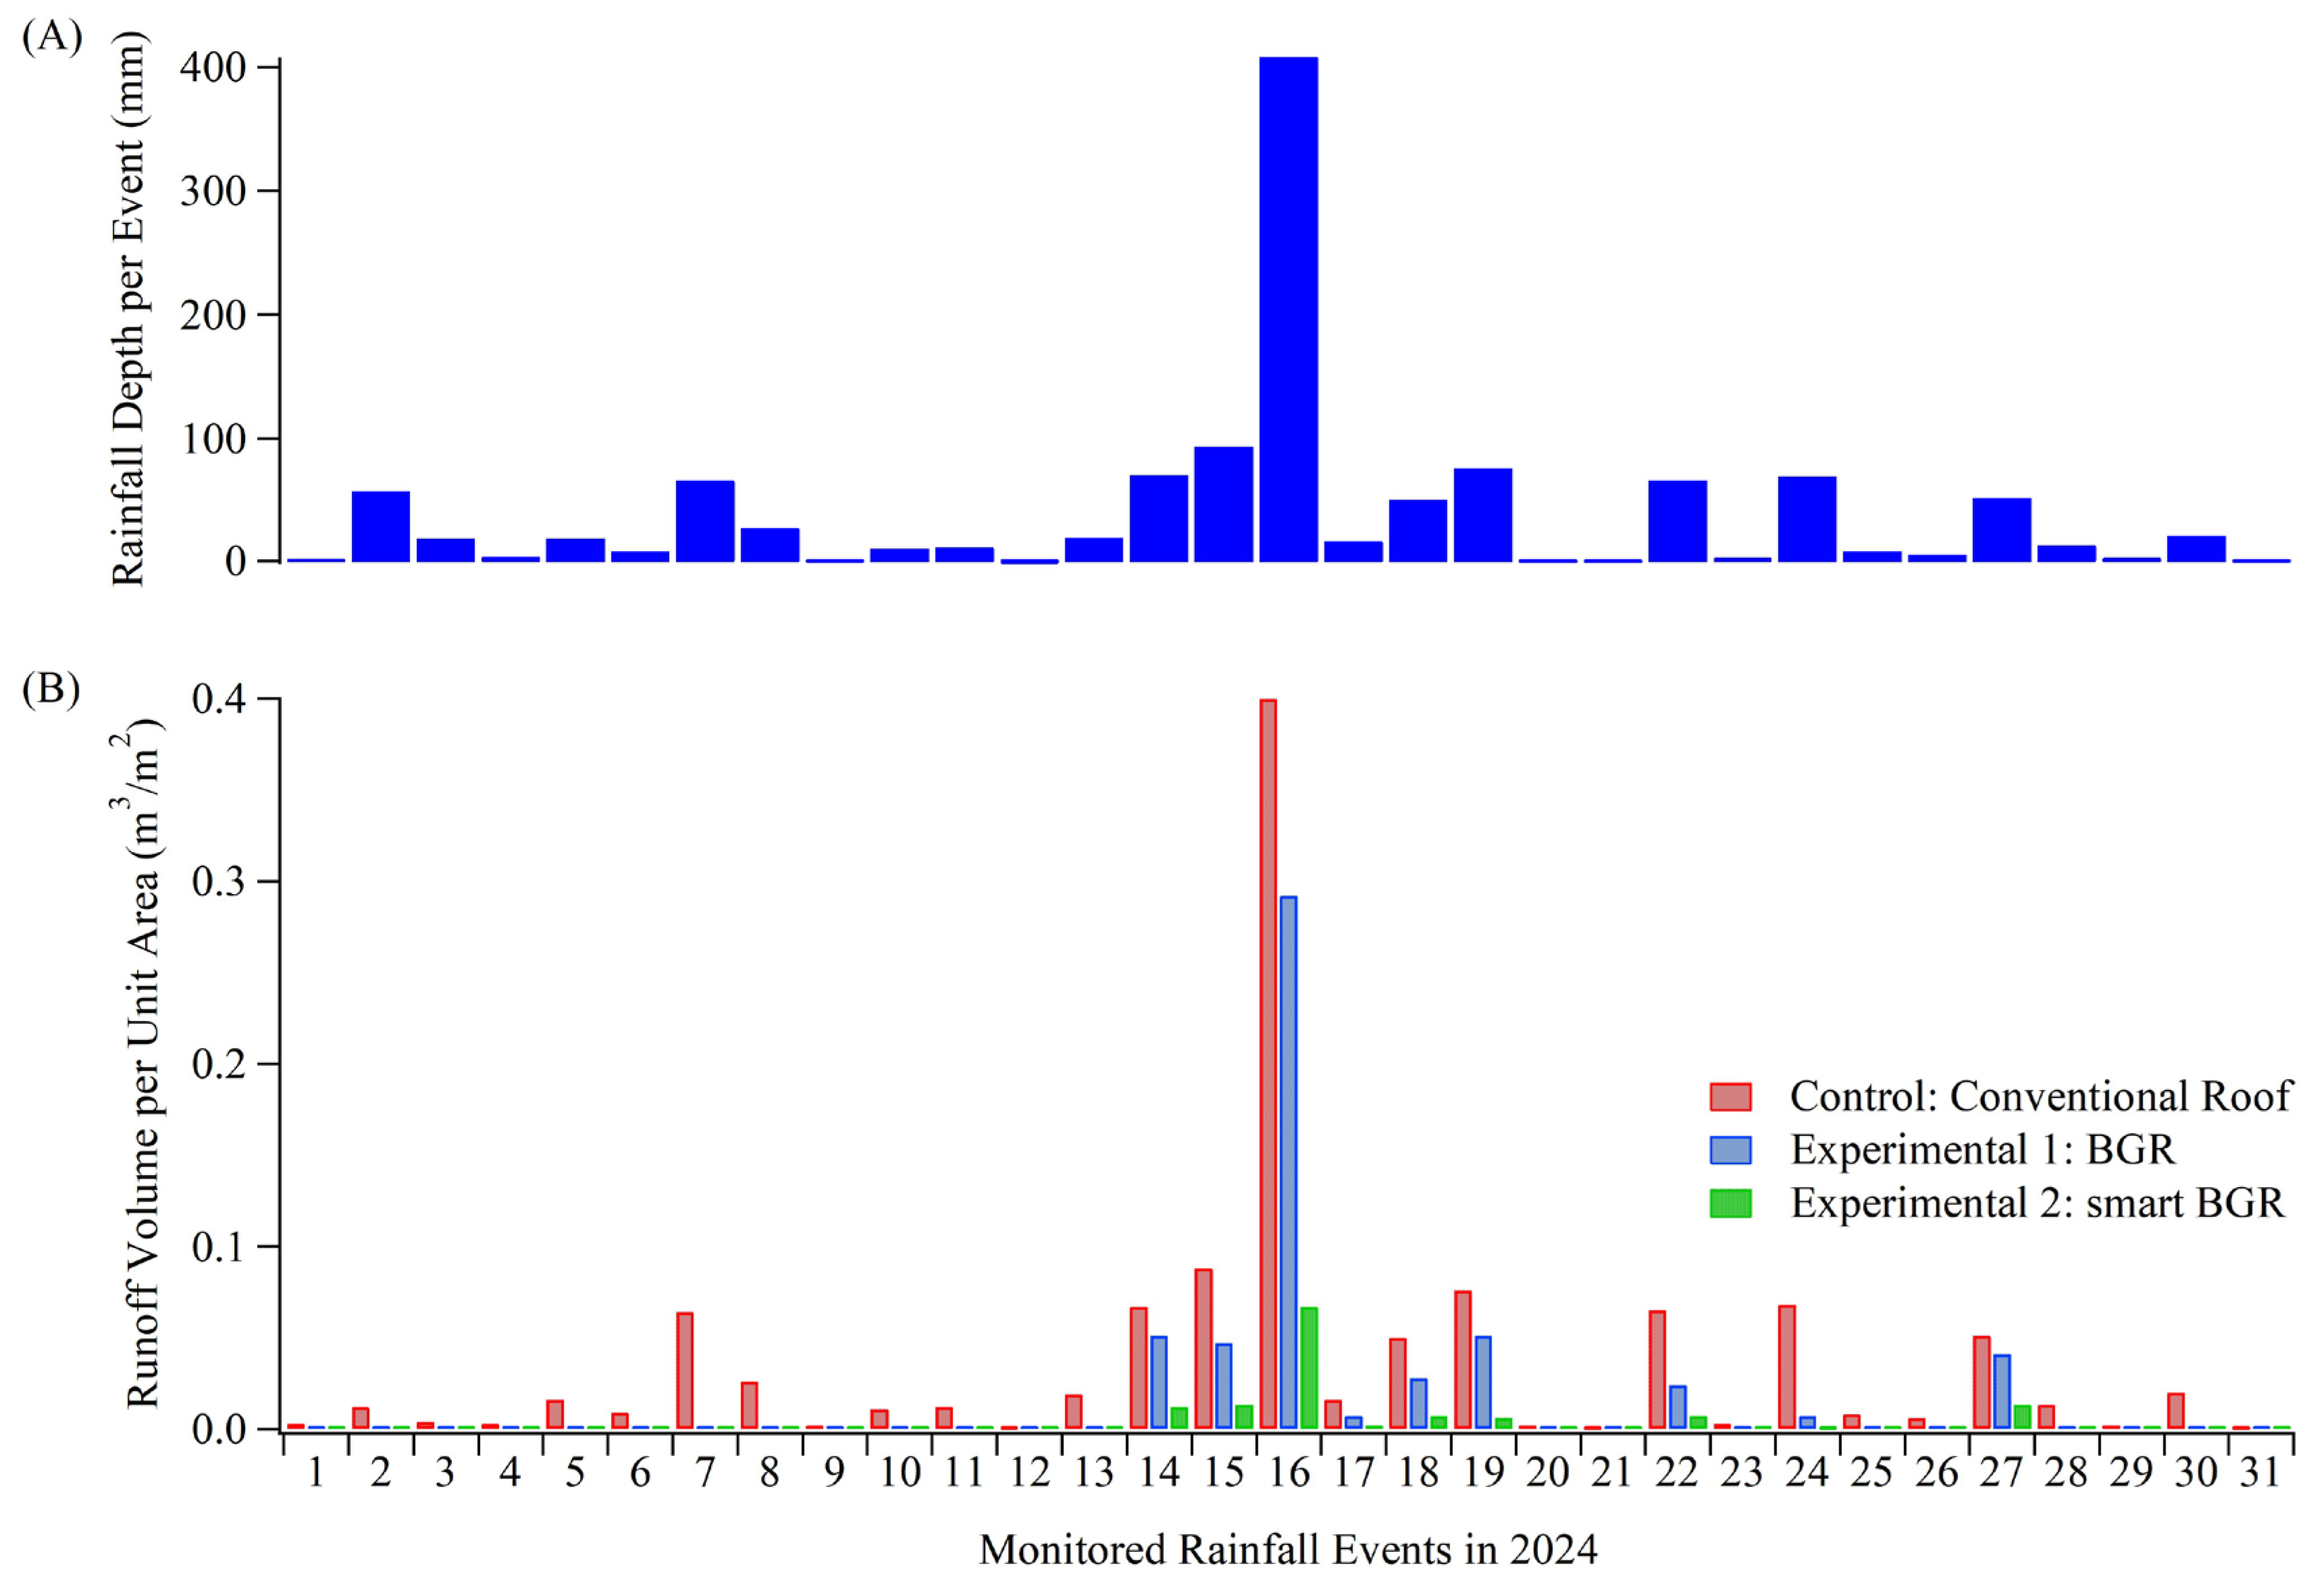
Figure 6 presents rainfall depths (upper panel) and runoff volumes per unit area (lower panel) for the three roof types. The highest rainfall (Monitoring No. 16, ~400 mm) produced a pronounced runoff peak in the conventional roof (0.4 m3/m2) and substantial runoff in BGR, whereas smart BGR maintained markedly lower runoff, demonstrating superior performance even under extreme rainfall. All systems showed negligible runoff during light rainfall events. Table 3 summarizes unit-area runoff and reduction rates by rainfall depth class (Classes 1–4). Event-based reduction rates in Table 3 are now presented as mean ± standard deviation to explicitly represent uncertainty associated with inter-event variability. In Class 1 (mean 3.88 mm), both BGR and smart BGR achieved complete runoff elimination (100%). In Class 2 (mean 17.72 mm), smart BGR achieved 98.94% reduction, slightly higher than BGR’s 95.11%. The performance gap widened in Class 3 (mean 53.00 mm), with BGR achieving 54.89% reduction compared to 86.71% for smart BGR. A similar trend was observed in Class 4 (mean 121.21 mm), with BGR at 54.68% and smart BGR at 90.00%. It should also be noted that the relatively large standard deviation observed in Class 4 does not originate from instrument uncertainty or error propagation, but is primarily due to the open-ended definition of ≥60 mm events, in which the upper bound of rainfall depth is unbounded, combined with the limited number of extreme events observed in 2024.
These findings highlight the efficacy of smart BGR’s active control system in maintaining high runoff reduction performance, particularly during medium-to-heavy rainfall events. While both systems perform equivalently under low-intensity rainfall, smart BGR significantly outperforms BGR under higher-intensity conditions, offering a practical strategy for mitigating urban flood risks and managing extreme rainfall under a changing climate.

3.3. Multiple Linear Regression Analysis for BGR and Smart BGR Systems Across Rainfall Classes

Although additional variables (e.g., ET demand, initial storage, or instantaneous intensity) may influence long-term hydrological behavior, these were excluded because the experiment targeted short-term rainfall-runoff responses when ET is minimal and the Smart BGR’s internal storage level is mechanically regulated. Consequently, the regression results are interpreted as descriptive trends reflecting rainfall characteristics only. Rainfall classes were categorized based on runoff occurrence. As shown in Table 4 and the regression models, Group A comprised Class 1 and Class 2 events, during which BGR and Smart BGR exhibited negligible runoff, while Group B consisted of Class 3 and Class 4 events, where runoff occurred in both systems. Since Group A exhibited almost no runoff, regression modeling was deemed unnecessary and was excluded from the analysis. The Conventional Roof showed low explanatory power (R2 = 0.455) and lacked statistical significance even in Group B, and was therefore omitted from model development.
For Group B, Multiple Linear Regression (MLR) was performed separately for the BGR and Smart BGR systems using the following predictors: rainfall depth (mm), average rainfall intensity (mm/hr), and consecutive rainfall days (CRDs). A stepwise selection method was applied. Given the limited sample size (n = 10), these results must be interpreted as exploratory associations rather than predictive statistical models. For the BGR system, two predictors—rainfall depth and average rainfall intensity—were retained as significant variables (R2 = 0.879, p < 0.05). For the Smart BGR system, the model retained rainfall depth and consecutive rainfall days (CRDs) as significant predictors (R2 = 0.880, p < 0.05). These results indicate that while both systems are primarily driven by rainfall depth, Smart BGR performance is additionally influenced by multi-day rainfall accumulation due to its active water-level regulation.
The relatively high R2 values likely reflect the limited variability inherent in the small dataset, and caution should be exercised in interpreting the quantitative magnitude of the coefficients. In addition, adjusted R2 is not considered a reliable indicator under these conditions because with such small n, adjustment cannot meaningfully correct for potential overfitting. For clarity, the F-statistic and degrees of freedom presented in Table 4 indicate whether the overall regression explains a significant portion of the variance in runoff.
Because only 10 rainfall events were available in Group B, formal diagnostic procedures such as residual normality testing, VIF analysis, or observed–predicted plotting would not yield statistically meaningful or reliable results, and were therefore not pursued. Given these constraints, residual diagnostics (e.g., normality testing, VIF analysis, or observed vs. predicted plotting) are not statistically meaningful with the present sample size and therefore were not included. The regression outcomes should be regarded as exploratory relationships rather than predictive equations, and future studies with larger datasets will enable variable expansion and information-criterion-based model selection. MLR was selected because the limited sample size precluded the use of more complex modeling approaches or information-criterion-based model selection; the present regression results are therefore intended only as transparent exploratory associations. In Equations (2) and (3), the unit “L” denotes runoff volume expressed in liters.
BGR (L) = 4.974 − 0.302 × Rainfall depth (mm) − 1.178 × ADD + 8.836 × CRD
smart BGR (L) = 1.459 − 0.093 × Rainfall depth (mm) − 0.386 × ADD + 2.740 × CRD

4. Conclusions and Discussion

This study evaluated the rooftop-scale rainfall runoff reduction performance of conventional roofs, Blue-Green Roofs (BGR), and Smart BGR systems using eight years of rainfall data from the Gimpo region and 31 monitored rainfall events in 2024. Rainfall classes were divided into two groups: Group A (Class 1 and 2), where BGR and Smart BGR exhibited negligible runoff, and Group B (Class 3 and 4), where measurable runoff occurred. Regression modeling was performed only for Group B because predictive analysis for Group A was unnecessary. Multiple Linear Regression analysis identified distinct rainfall predictors for each system. For the BGR, rainfall depth and average rainfall intensity were retained as significant predictors (R2 = 0.879, p < 0.01). For the Smart BGR, rainfall depth and consecutive rainfall days (CRDs) emerged as significant predictors (R2 = 0.880, p < 0.01). These results indicate that while both systems respond primarily to total rainfall depth, the Smart BGR additionally responds to multi-day rainfall accumulation because of its active water-level regulation mechanism. The consistent significance of rainfall depth across both models further confirms that event scale remains the dominant driver of rooftop runoff generation. Performance differences between BGR and Smart BGR were most evident in high-intensity events. In Class 3 (average 53 mm), BGR achieved 54.9% reduction, whereas Smart BGR reached 86.7%, an improvement of approximately 32 percentage points. In Class 4 (average 121 mm), BGR and Smart BGR achieved 54.7% and 90.0% reductions, respectively. These results confirm that Smart BGR is particularly effective under large rainfall events where conventional BGR performance declines due to overflow beyond its storage capacity.
This study intentionally focused on short-term rainfall runoff behavior, during which evapotranspiration (ET) is negligible because solar radiation and aerodynamic exchange are minimal. Nevertheless, a comprehensive annual water balance of Blue-Green Roof systems must include ET and post-event storage dynamics. Future research should therefore incorporate continuous monitoring of meteorological variables such as air temperature, humidity, wind speed, and solar radiation, and estimate ET using established methods (e.g., Penman–Monteith or surface energy balance approaches). Such efforts will enable statistical models to integrate ET and storage terms once long-term datasets become available, allowing differentiation between retained water lost through ET and water released through controlled drainage. This will close the water balance equation (Rainfall = Runoff + ET + ΔStorage + Losses) and provide a fuller understanding of system dynamics. Integrating ET-based modeling into smart control algorithms could further enhance the system’s efficiency by enabling predictive operation based on real time atmospheric demand. For example, controlled pre-drainage before high radiation days could secure additional water for subsequent ET, improving rooftop thermal moderation. Through such integration, Smart BGR systems could evolve from purely hydrological devices into multifunctional urban climate adaptation infrastructure.
This study also has limitations. Extreme rainfall beyond the design capacity may saturate both the rooftop storage and underground tank, at which point the system behaves as a conventional roof. Future research should test the system under such extreme scenarios, refine the control logic using rainfall-forecast data, and evaluate scalability and cost benefit performance for large scale applications. However, practical deployment of Smart BGR systems at scale will require structural load assessments, maintenance strategies for underground storage tanks, and integration with existing municipal drainage infrastructure, which should be addressed in future work. Overall, the findings confirm that Smart BGR significantly enhances rooftop-scale runoff reduction performance and provides a realistic pathway toward adaptive and resilient urban water management under climate change-driven extreme rainfall.

Author Contributions

Conceptualization, S.M.C. and K.S.H.; methodology, J.D.K.; data curation, J.P.; formal analysis, J.P.; investigation, J.D.K., J.M.L. and S.K.; resources, K.S.H.; writing—original draft preparation, S.M.C.; writing—review and editing, S.M.C. and J.K.; visualization, S.M.C.; supervision, J.K. All authors have read and agreed to the published version of the manuscript.

Funding

This research was supported by the National Research Foundation of Korea (NRF) grant funded by the Korea government (MSIT), grant number RS-2023-00259994.

Data Availability Statement

The data presented in this study are available on request from the corresponding author. The data are not publicly available due to institutional data-sharing agreements and confidentiality restrictions.

Conflicts of Interest

Authors Kyung Soo Han and Jong Dae Kim was employed by the company Earth Green Korea Co., Ltd. The remaining authors declare that the research was conducted in the absence of any commercial or financial relationships that could be construed as a potential conflict of interest.

References

  1. Dysarz, T.; Marcinkowski, P.; Wicher Dysarz, J.; Piniewski, M.; Miroslaw Swiatek, D.; Kundzewiczi, Z.W. Assessment of climate change impact on flood hazard zones. Water Resour. Manag. 2025, 39, 963–977. [Google Scholar] [CrossRef]
  2. Nuwahereza, N.; Tumwebaze, S.B. Assessment of the adoption of nature based solutions for flood risk mitigation: Socio economic determinants in the River Nyamwamba catchment, Uganda. Nat. Based Solut. 2025, 7, 100225. [Google Scholar] [CrossRef]
  3. Rogers, J.S.; Maneta, M.P.; Sain, S.R.; Madaus, L.E.; Hacker, J.P. The role of climate and population change in global flood exposure and vulnerability. Nat. Commun. 2025, 16, 1287. [Google Scholar] [CrossRef]
  4. Deopa, R.; Thakur, D.A.; Kumar, S.; Mohanty, M.P.; Asha, P. Discerning the dynamics of urbanization–climate change–flood risk nexus in densely populated urban mega cities: An appraisal of efficient flood management through spatiotemporal and geostatistical rainfall analysis and hydrodynamic modeling. Sci. Total Environ. 2024, 952, 175882. [Google Scholar] [CrossRef] [PubMed]
  5. Islam, M.T.; Meng, Q. Spatial analysis of socio economic and demographic factors influencing urban flood vulnerability. J. Urban Manag. 2024, 13, 437–455. [Google Scholar] [CrossRef]
  6. Kwak, C.; Jo, J.; Han, J.; Kim, J.; Lee, S. Analysis of Flood Risk in Ulsan Metropolitan City, South Korea, Considering Urban Development and Changes in Weather Factors. Water 2025, 17, 2800. [Google Scholar] [CrossRef]
  7. Mu, Y.; Li, Y.; Yan, R.; Luo, P.; Liu, Z.; Sun, Y.; Wang, S.; Zhu, W.; Zha, X. Analysis of the ongoing effects of disasters in urbanization process and climate change: China’s floods and droughts. Sustainability 2024, 16, 14. [Google Scholar] [CrossRef]
  8. Seemuangngam, A.; Lin, H. The impact of urbanization on urban flood risk on Nakhon Ratchasima, Thailand. Appl. Geogr. 2024, 162, 103152. [Google Scholar] [CrossRef]
  9. Tang, J.; Liu, D.; Shang, C.; Niu, J. Impacts of land use change on surface infiltration capacity and urban flood risk in a representative karst mountain city over the last two decades. J. Clean. Prod. 2024, 454, 142196. [Google Scholar] [CrossRef]
  10. Kumar, S.; Guntu, R.K.; Agarwal, A.; Villuri, V.G.K.; Pasupuleti, S.; Kaushal, D.R.; Gosian, A.K.; Bronstert, A. Multi objective optimization for stormwater management by green roofs and infiltration trenches to reduce urban flooding in central Delhi. J. Hydrol. 2022, 606, 127455. [Google Scholar] [CrossRef]
  11. MOIS (Ministry of the Interior and Safety). Disaster Annual Report 2023. Available online: www.safekorea.go.kr (accessed on 21 July 2025).
  12. European Commission. Facing Increasing River Flood Risk in Europe: Adaptation Measures Can Save Lives and Billions of Euro. 2023. Available online: https://joint-research-centre.ec.europa.eu/jrc-news-and-updates/facing-increasing-river-flood-risk-europe-adaptation-measures-can-save-lives-and-billions-euro-2023-02-06_en (accessed on 30 July 2025).
  13. Prieto, C.; Patel, D.; Han, D.; Dewals, B.; Bray, M.; Molinari, D. Preface: Advances in pluvial and fluvial flood forecasting and assessment and flood risk management. Nat. Hazards Earth Syst. Sci. 2024, 24, 3381–3386. [Google Scholar] [CrossRef]
  14. Wang, Z.; Li, Z.; Wang, Y.; Zheng, X.; Deng, X. Building green infrastructure for mitigating urban flood risk in Beijing, China. Urban For. Urban Green. 2024, 93, 128218. [Google Scholar] [CrossRef]
  15. Ruan, X.; Sun, H.; Shou, W.; Wang, J. The impact of climate change and urbanization on compound flood risks in coastal areas: A comprehensive review of methods. Appl. Sci. 2024, 14, 10019. [Google Scholar] [CrossRef]
  16. Lo, W.; Wu, M.; Wu, J.; Huang, Y. Integrating Urban Planning and Hydraulic Engineering: Nature-Based Solutions for Flood Mitigation in Tainan City. Water 2025, 17, 2018. [Google Scholar] [CrossRef]
  17. Sciuto, L.; Licciardello, F.; Giuffrida, E.R.; Barresi, S.; Scavera, V.; Verde, D.; Barbagallo, S.; Cirelli, G.L. Hydrological-hydraulic modelling to assess nature based solutions for flood risk mitigation in an urban area of Catania (Sicily, Italy). Nat. Based Solut. 2025, 7, 100210. [Google Scholar] [CrossRef]
  18. Ghalehteimouri, K.J.; Ros, F.C.; Rambat, S. Flood risk assessment through rapid urbanization LULC change with destruction of urban green infrastructures based on NASA Landsat time series data: A case of study Kuala Lumpur between 1990–2021. Ecol. Front. 2024, 44, 289–306. [Google Scholar] [CrossRef]
  19. Rahman, M.D.R.; Kang, S.; Lee, S.; Lee, J. A green infrastructure planning approach for enhanced flood control and resilience in urban areas. Land Use Policy 2024, 153, 107535. [Google Scholar] [CrossRef]
  20. Öztürk, Ş.; Yılmaz, K.; Dinçer, A.E.; Kalpakcı, V. Effect of urbanization on surface runoff and performance of green roofs and permeable pavement for mitigating urban floods. Nat. Hazards 2024, 120, 12375–12399. [Google Scholar] [CrossRef]
  21. Bocanegra, J.A.; Scarpa, F.; Bianco, V.; Tagliafico, L.A. Feasibility of green roofs in the Mediterranean region: A stochastic study using a Monte Carlo financial model. Energy 2024, 309, 132995. [Google Scholar] [CrossRef]
  22. Kim, E.S.; Yeon, J.S.; Shin, H.S.; Lee, J.S.; Choi, H.I. Study on stormwater runoff reduction effects by LID application areas. J. Korean Soc. Hazard Mitig. 2014, 14, 309–316. [Google Scholar] [CrossRef]
  23. Osawa, T.M.; Nogueira, F.F.; Gonzaga, S.C.M.; Silva, F.G.; Miranda, S.D.; Leite, B.C.C.; Martins, J.R.S. Hydrological benefits of green roof retrofitting policies: A case study of an urban watershed in Brazil. Water 2025, 17, 1936. [Google Scholar] [CrossRef]
  24. Liu, L.; Sun, L.; Niu, J.; Riley, W.J. Modeling Green Roof Potential to Mitigate Urban Flooding in a Chinese City. Water 2020, 12, 2082. [Google Scholar] [CrossRef]
  25. Moghanlo, S.J.; Raimondi, A. Impacts of blue-green infrastructures on combined sewer overflows. Nat.-Based Solut. 2025, 7, 100208. [Google Scholar] [CrossRef]
  26. Neumann, J.; Scheid, C.; Dittmer, U. Potential of Decentral Nature-Based Solutions for Mitigation of Pluvial Floods in Urban Areas—A Simulation Study Based on 1D/2D Coupled Modeling. Water 2024, 16, 811. [Google Scholar] [CrossRef]
  27. Lee, S.W.; Seo, J.; Cha, S.M. A study on evaluation of the ability to reduce stormwater runoff of blue-green roof for flood damage reduction. J. Korean Soc. Water Environ. 2023, 39, 30–37. [Google Scholar] [CrossRef]
  28. Lepcha, R.; Patra, S.K.; Ray, R.; Thapa Baral, D.; Saha, S. Rooftop rainwater harvesting a solution to water scarcity: A review. Groundw. Sustain. Dev. 2024, 26, 101305. [Google Scholar] [CrossRef]
  29. Mazurkiewicz, K.; Jeż-Walkowiak, J.; Michałkiewicz, M. Physicochemical and microbiological quality of rainwater harvested in underground retention tanks. Sci. Total Environ. 2022, 814, 152701. [Google Scholar] [CrossRef]
  30. Cha, S.M.; Ki, S.J.; Cho, K.H.; Choi, H.; Kim, J.H. Effect of environmental flow management on river water quality: A case study at Yeongsan River, Korea. Water Sci. Technol. 2009, 59, 2437–2446. [Google Scholar] [CrossRef]
Figure 1. (Top) Monitoring points by rooftop type (conventional, blue-green, smart blue-green) and location of the underground storage tank at Gochon Middle School; (Bottom) Location of Gochon Middle School Figures for testing procedures and manufacturing stormwater in an agitator.
Water 17 03328 g001
Figure 2. (A) Layout of the rooftop experimental sections comprising the Smart BGR (100 m2), conventional BGR (80 m2), and control roof (120 m2). The Smart BGR includes an automated drainage and refill system that actively manages the blue-layer water level. When the water depth reaches 120 mm (Drain Start Point), the valve opens and the stored water is discharged to the underground storage tank by gravity without pumping assistance. When the level decreases below 50 mm (Re-fill Start Point), water is pumped back from the underground tank to the blue layer to sustain vegetation moisture. The BGR section, by contrast, operates only through passive overflow, and all flow-measuring points (red dots) record overflow runoff only, representing water actually discharged to the ground surface. (B) Vertical configuration of the Green and Blue layers, consisting of a grass layer, soil layer, support plate, and water-storage module. (C) Control thresholds of the Smart BGR blue layer, showing the drain and refill levels within the 150 mm total storage depth.
Water 17 03328 g002
Figure 3. (A) View of the Blue Layer in BGR, (B) Installation of the Blue Layer in BGR, (C) View after installation of the Green Layer in BGR, (D) Installation of a water level sensor in Smart BGR, (E) Piping connecting runoff from each roof to the underground system, (F) Flow meter installation for measuring runoff from each roof, (G) Circulation pump for water cycle system operation, (H) Installation of an underground storage tank, (I) Data storage system.
Water 17 03328 g003
Figure 4. Graph of 2024 rainfall characteristics in the Gimpo area. The top graph represents daily rainfall depth, the second graph shows rainfall depth per event, the third graph indicates Consecutive Rainfall Days (CRDs), and the bottom graph displays Antecedent Dry Days (ADDs).
Water 17 03328 g004
Figure 5. Distribution of rainfall depth class intervals in the Gimpo area: (A) Number of rainfall events from 2017 to 2024, (B) Number of rainfall events in 2024, (C) Number of rainfall days from 2017 to 2024, and (D) Number of rainfall days in 2024.
Water 17 03328 g005
Figure 6. Rainfall depth and runoff response of three rooftop systems during the 31 monitored rainfall events in 2024. (A) Rainfall depth per event (mm) recorded at the local AWS (1 h aggregated). (B) Runoff volume per unit roof area (m3/m2) measured from the three rooftop systems: conventional roof (control), Blue-Green Roof (BGR), and Smart Blue-Green Roof (Smart BGR). Runoff shown here represents only passive overflow discharge measured by flowmeters, excluding actively drained volume in Smart BGR. Even during large events (e.g., Event No. 16), the Smart BGR exhibited markedly lower runoff due to active water-level control and larger effective storage relative to the passive BGR and conventional roof.
Water 17 03328 g006
Table 1. Analysis Results of Rainfall Events in Gimpo over the Past Eight Years.
Maximum Rainfall Depth per Event (mm)Maximum Antecedent Dry Days (ADDs)Maximum Consecutive Rainfall Days (CRDs) per EventMaximum Daily Rainfall Depth (mm)Number of Rainfall EventsAnnual Rainfall Depth (mm)
2017167.0264103.050957.5
2018470.5234206.5521439.1
2019183.5495169.042946.1
2020286.0468118.0411462.5
202193.023670.5501114.6
2022253.0355200.5371271.0
2023154.5264116.5521510.0
2024408.02914164.5431236.0
Mean251.932.16.3143.645.91242.1
Stdev130.910.33.448.85.8222.0
Max470.549.014.0206.552.01510.0
Min93.023.04.070.537.0946.1
Notes: Rainfall depth (mm) was defined as the cumulative rainfall between the start and end of an event separated by ≥24 h without precipitation. Antecedent Dry Days (ADD) indicates the number of consecutive days with zero rainfall prior to the start of the event. Consecutive Rainfall Days (CRD) indicates the number of successive days with non-zero rainfall during the event period.
Table 2. Rainfall Characteristics, Rainfall Events, Monitoring Cases in 2024, Gimpo Area.
DateRainfall Depth
(mm)
ADDs
(Days)
CRDs per Event (Days)Number of
Rainfall Events
Number of
Monitoring Events
01-10-2024344Event 1-
01-14-2024341Event 2Monitoring 1
01-18-20247.532Event 3-
01-20-20240.521Event 4-
02-25-202457298Event 5Monitoring 2
03-07-20240.5101Event 6-
03-22-20241.5151Event 7-
03-26-20241932Event 8Monitoring 3
03-29-20244.522Event 9Monitoring 4
04-15-202419162Event 10Monitoring 5
04-20-2024451Event 11-
04-24-20248.541Event 12Monitoring 6
05-07-202466113Event 13Monitoring 7
05-12-202427.542Event 14Monitoring 8
05-15-2024231Event 15Monitoring 9
05-27-202411102Event 16Monitoring 10
06-08-202412121Event 17Monitoring 11
06-15-2024171Event 18Monitoring 12
06-23-202419.572Event 19Monitoring 13
06-30-20247072Event 20Monitoring 14
07-08-202493.527Event 21Monitoring 15
07-10-20240.521Event 22-
07-27-2024408414Event 23Monitoring 16
08-08-202416.594Event 24Monitoring 17
08-16-202450.563Event 25Monitoring 18
08-18-2024221Event 26-
08-23-20247633Event 27Monitoring 19
09-02-20241.5101Event 28Monitoring 20
09-05-20241.531Event 29Monitoring 21
09-13-20246663Event 30Monitoring 22
09-16-2024431Event 31Monitoring 23
09-21-20246942Event 32Monitoring 24
09-26-20248.551Event 33Monitoring 25
10-01-2024651Event 34Monitoring 26
10-15-20240.5141Event 35-
10-19-202451.532Event 36Monitoring 27
10-23-202413.532Event 37Monitoring 28
10-29-2024161Event 38-
11-16-20244181Event 39Monitoring 29
11-27-202421.5102Event 40Monitoring 30
11-30-20240.531Event 41-
12-05-2024251Event 42Monitoring 31
12-21-20241161Event 43-
Table 3. Comparison of Runoff Volume per Unit Area and Runoff Reduction Rates between the Experimental Groups (BGR, Smart BGR) and the Control Group for 31 Monitored Events in 2024.
Rainfall Depth ClassMonitoring N. of Rainfall EventsRainfall Depth Average (mm)Runoff by Unit Area
(m3/m2)
Stormwater Runoff Reduction Rate (%)
ControlBGRSmart BGRControlBGRSmart BGR
1123.88
(±2.61)
0.0033
(±0.0027)
0.0000
(±0.0000)
0.0000
(±0.0000)
-100.00
(±0.00)
100.00
(±0.00)
2917.72
(±5.17)
0.0151
(±0.0062)
0.0008
(±0.0023)
0.0002
(±0.0005)
-95.11
(±14.68)
98.94
(±3.19)
3353.00
(±3.50)
0.0377
(±0.0222)
0.0228
(±0.0067)
0.0067
(±0.0064)
-54.89
(±41.13)
86.71
(±12.65)
47121.21
(±126.82)
0.1180
(±0.1245)
0.0673
(±0.1011)
0.0152
(±0.0234)
-54.68
(±30.60)
90.00
(±7.33)
Table 4. Model summary for each roof and runoff group.
ModelRR SquareAdjusted R SquareStd. Error of the EstimateChange Statistics
R Square ChangeF Changedf1df2Sig. F Change
1. Control: Conventional Roof
Group A0.3550.126−0.02987.667920.1260.8153170.503
Group B0.6750.4550.18324.262700.4551.671360.271
2. BGR
Group A0.3960.1570.00863.941970.1571.0543170.394
Group B0.9380.8790.8196.015920.87914.529360.004
3. smart BGR
Group A0.3500.123−0.03215.013110.1230.7923170.515
Group B0.9380.8800.8201.831680.88014.702360.004
Note: The statistical parameters reported in Table 4 include df1 and df2, which represent the numerator and denominator degrees of freedom used in the F–statistics of the regression significance tests.
Disclaimer/Publisher’s Note: The statements, opinions and data contained in all publications are solely those of the individual author(s) and contributor(s) and not of MDPI and/or the editor(s). MDPI and/or the editor(s) disclaim responsibility for any injury to people or property resulting from any ideas, methods, instructions or products referred to in the content.