Rooftop-Scale Runoff Reduction Performance of Smart Blue-Green Roofs and Their Potential Role in Urban Flood Mitigation
Abstract
1. Introduction
2. Materials and Methods
2.1. Description of Study Area
2.2. Installation of Facilities for Smart BGR System Evaluation
2.3. Field Experiment and Data Acquisition
2.4. Linear Regression Analysis
3. Results
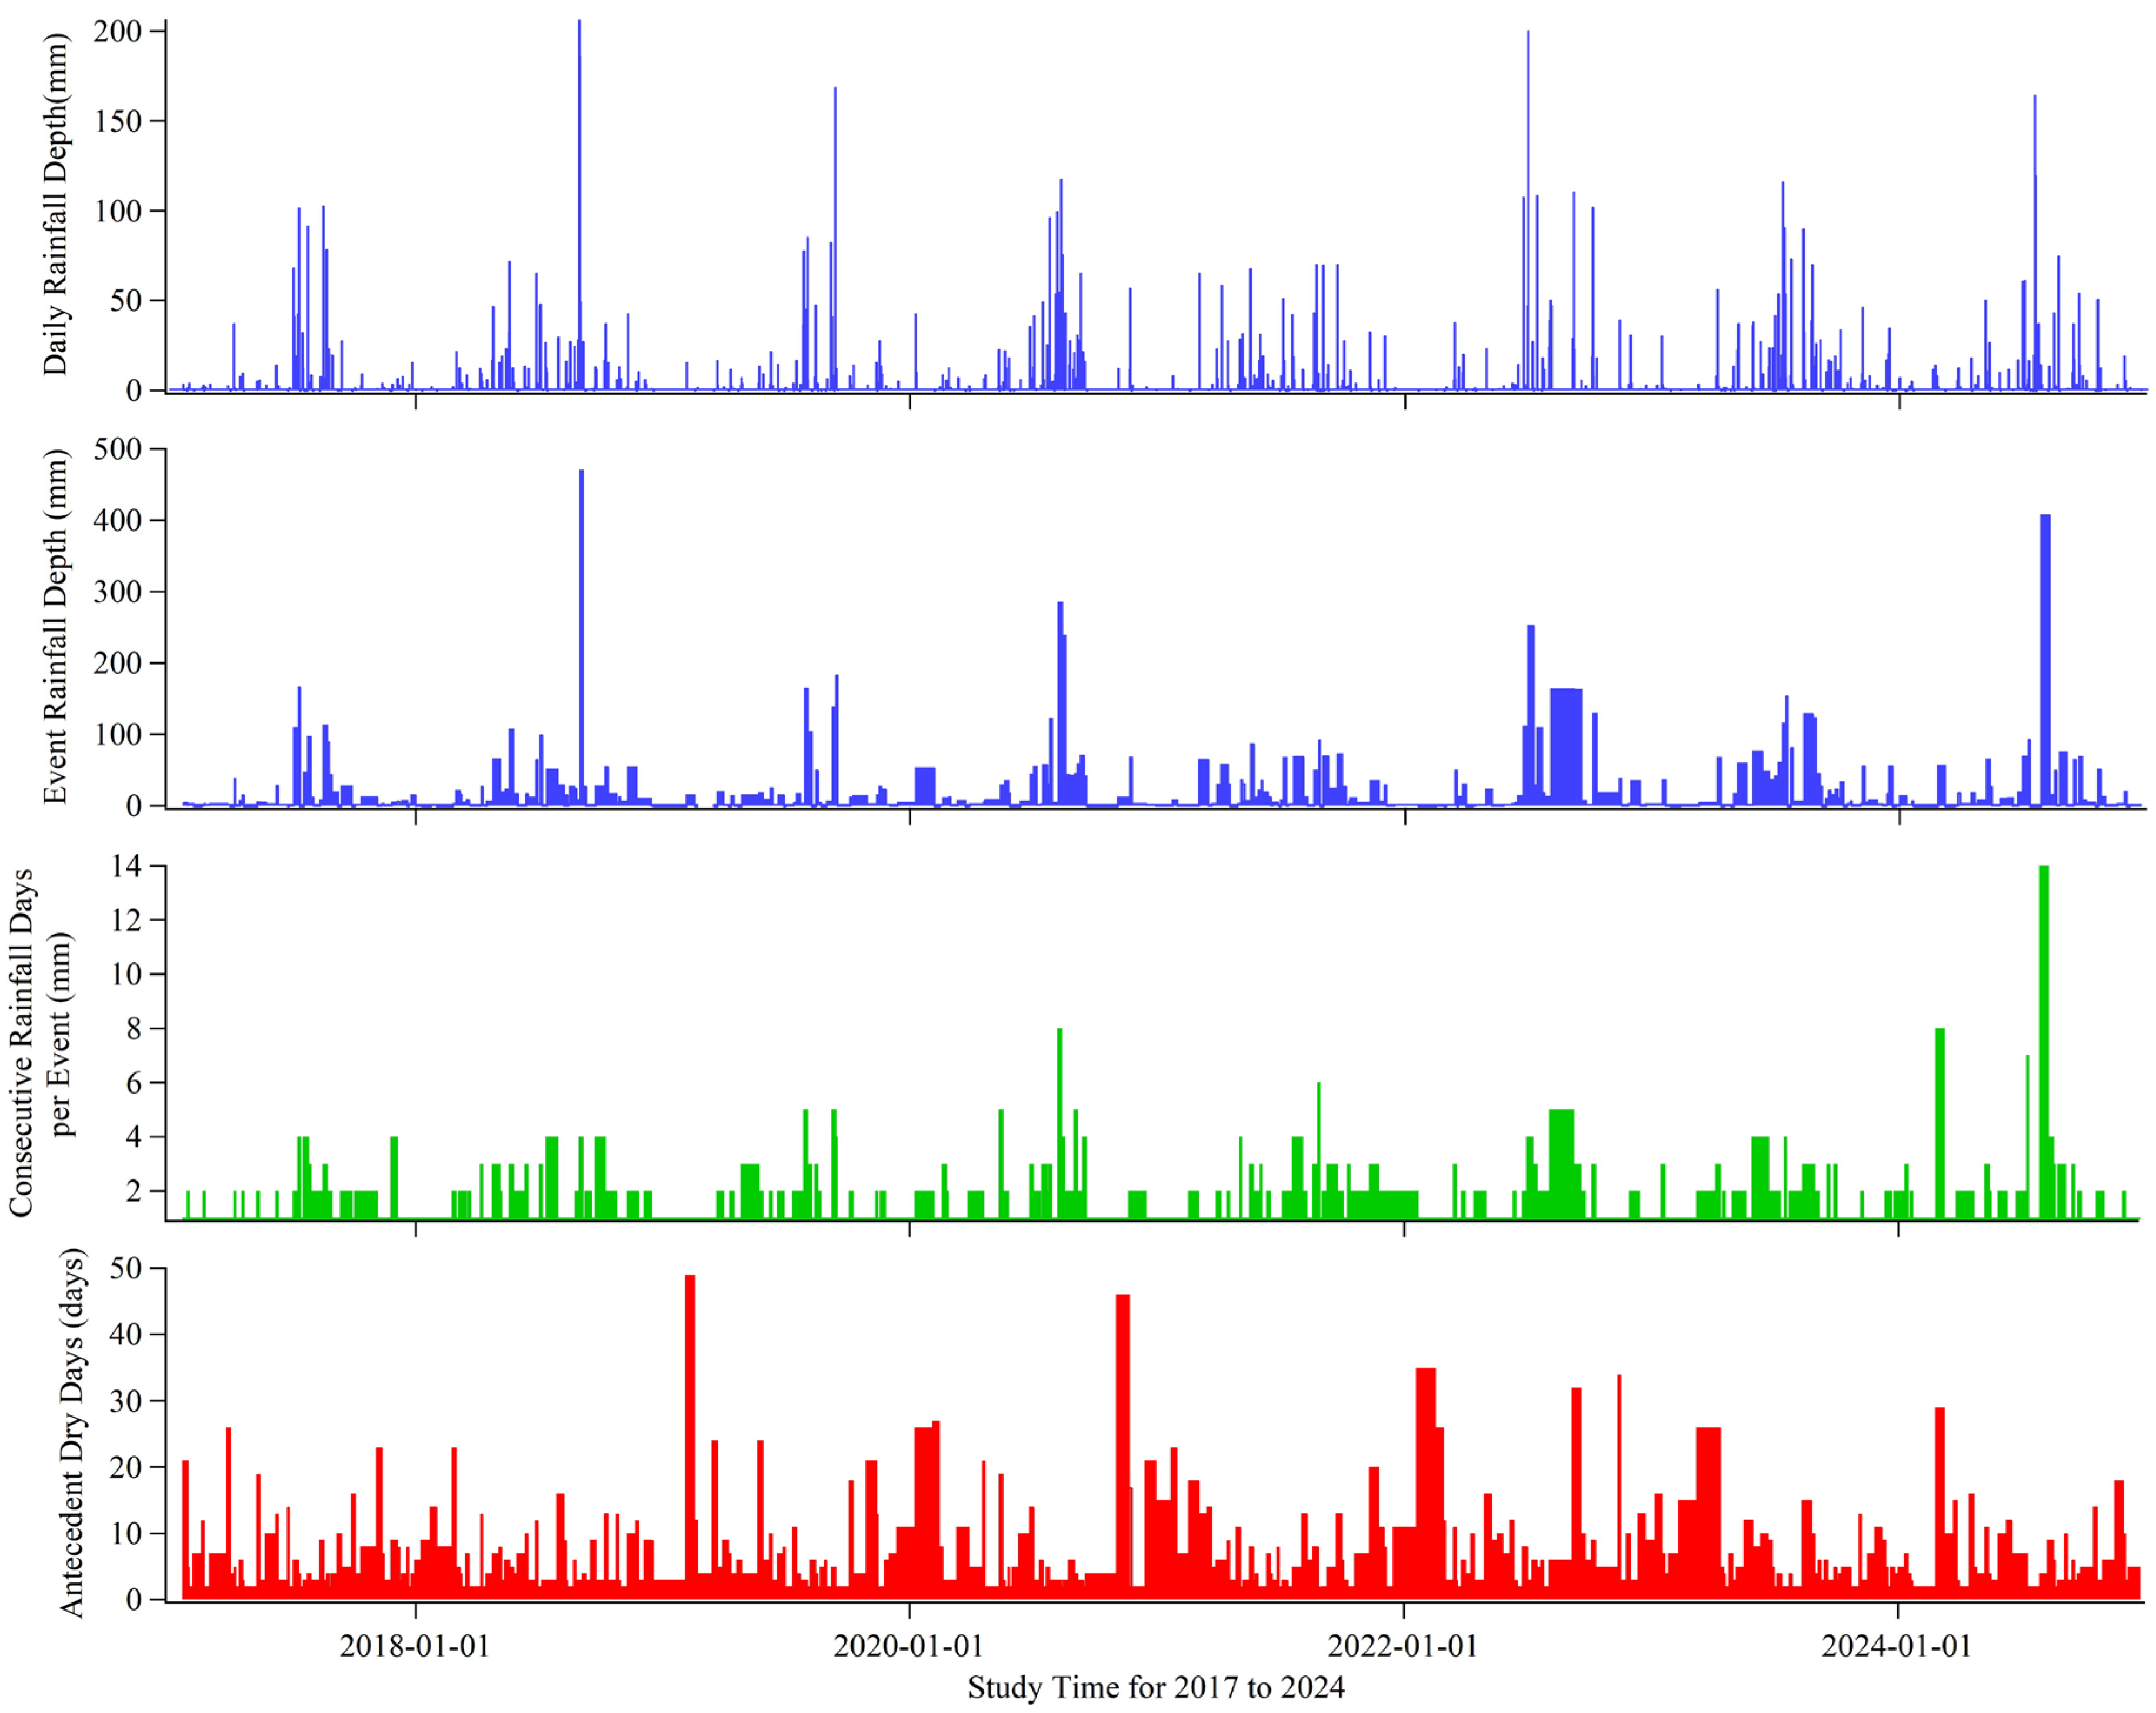
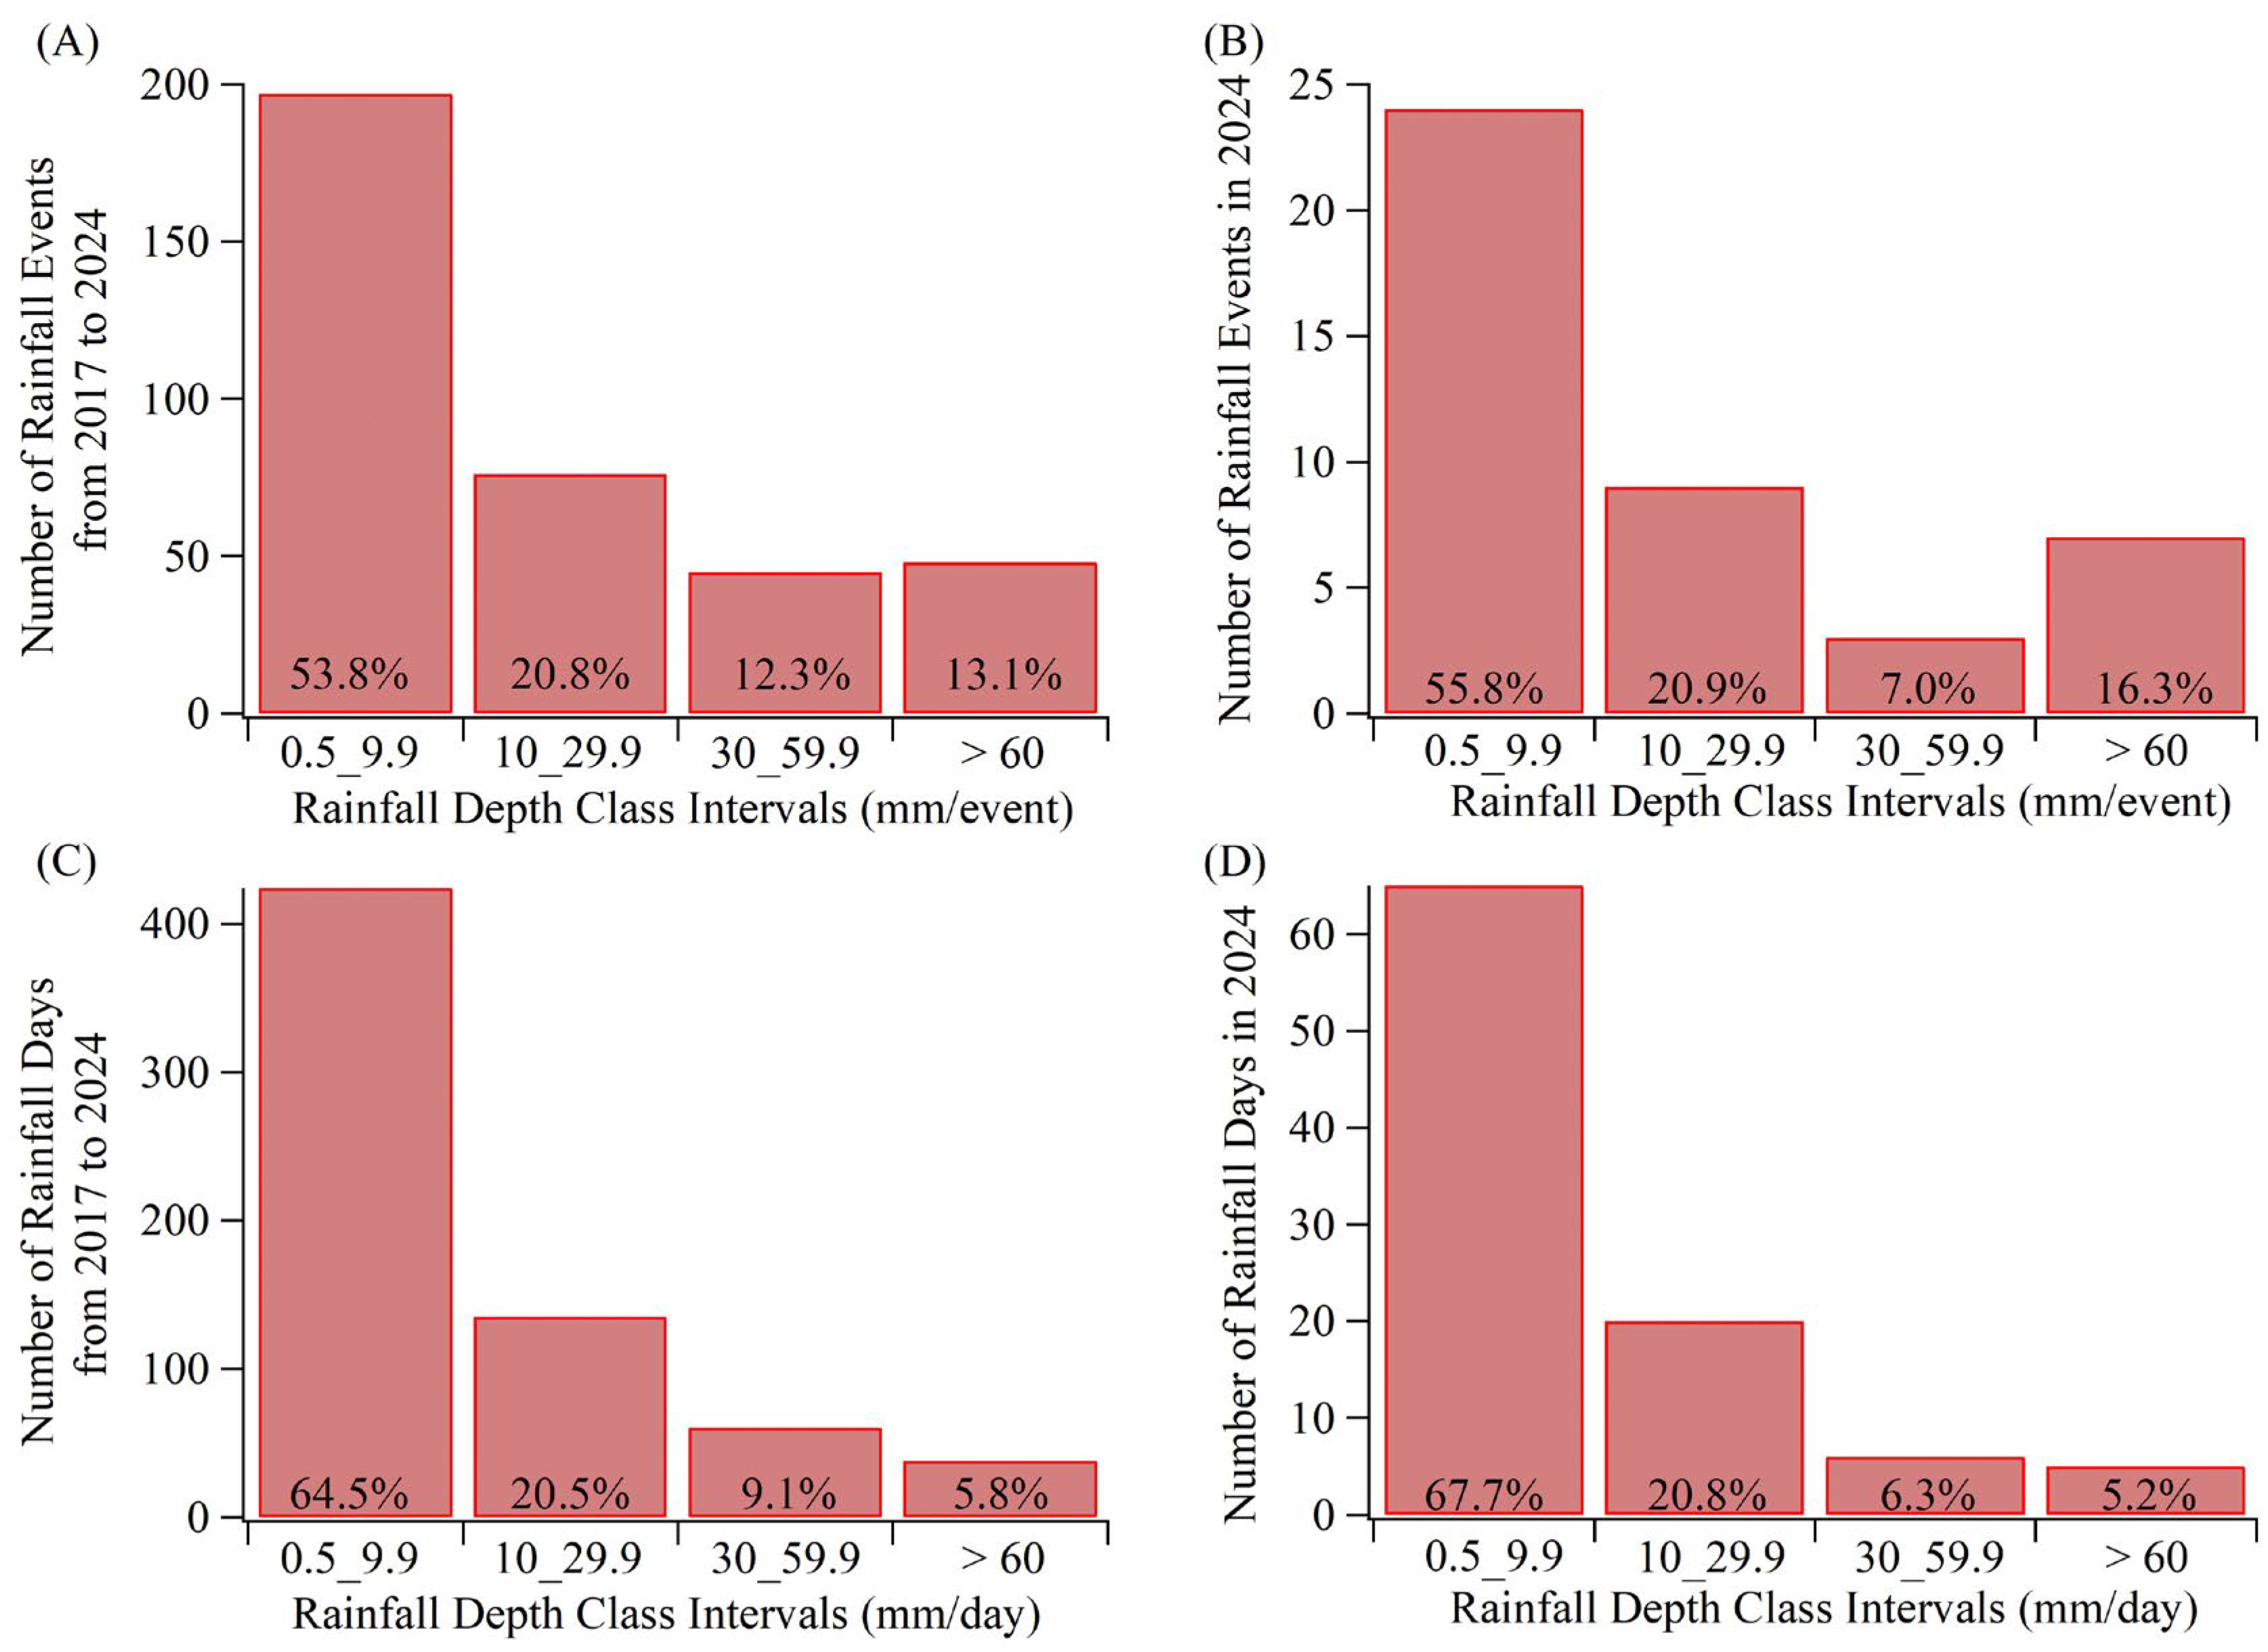
3.1. Analysis Results of Rainfall Characteristics in Gimpo Area
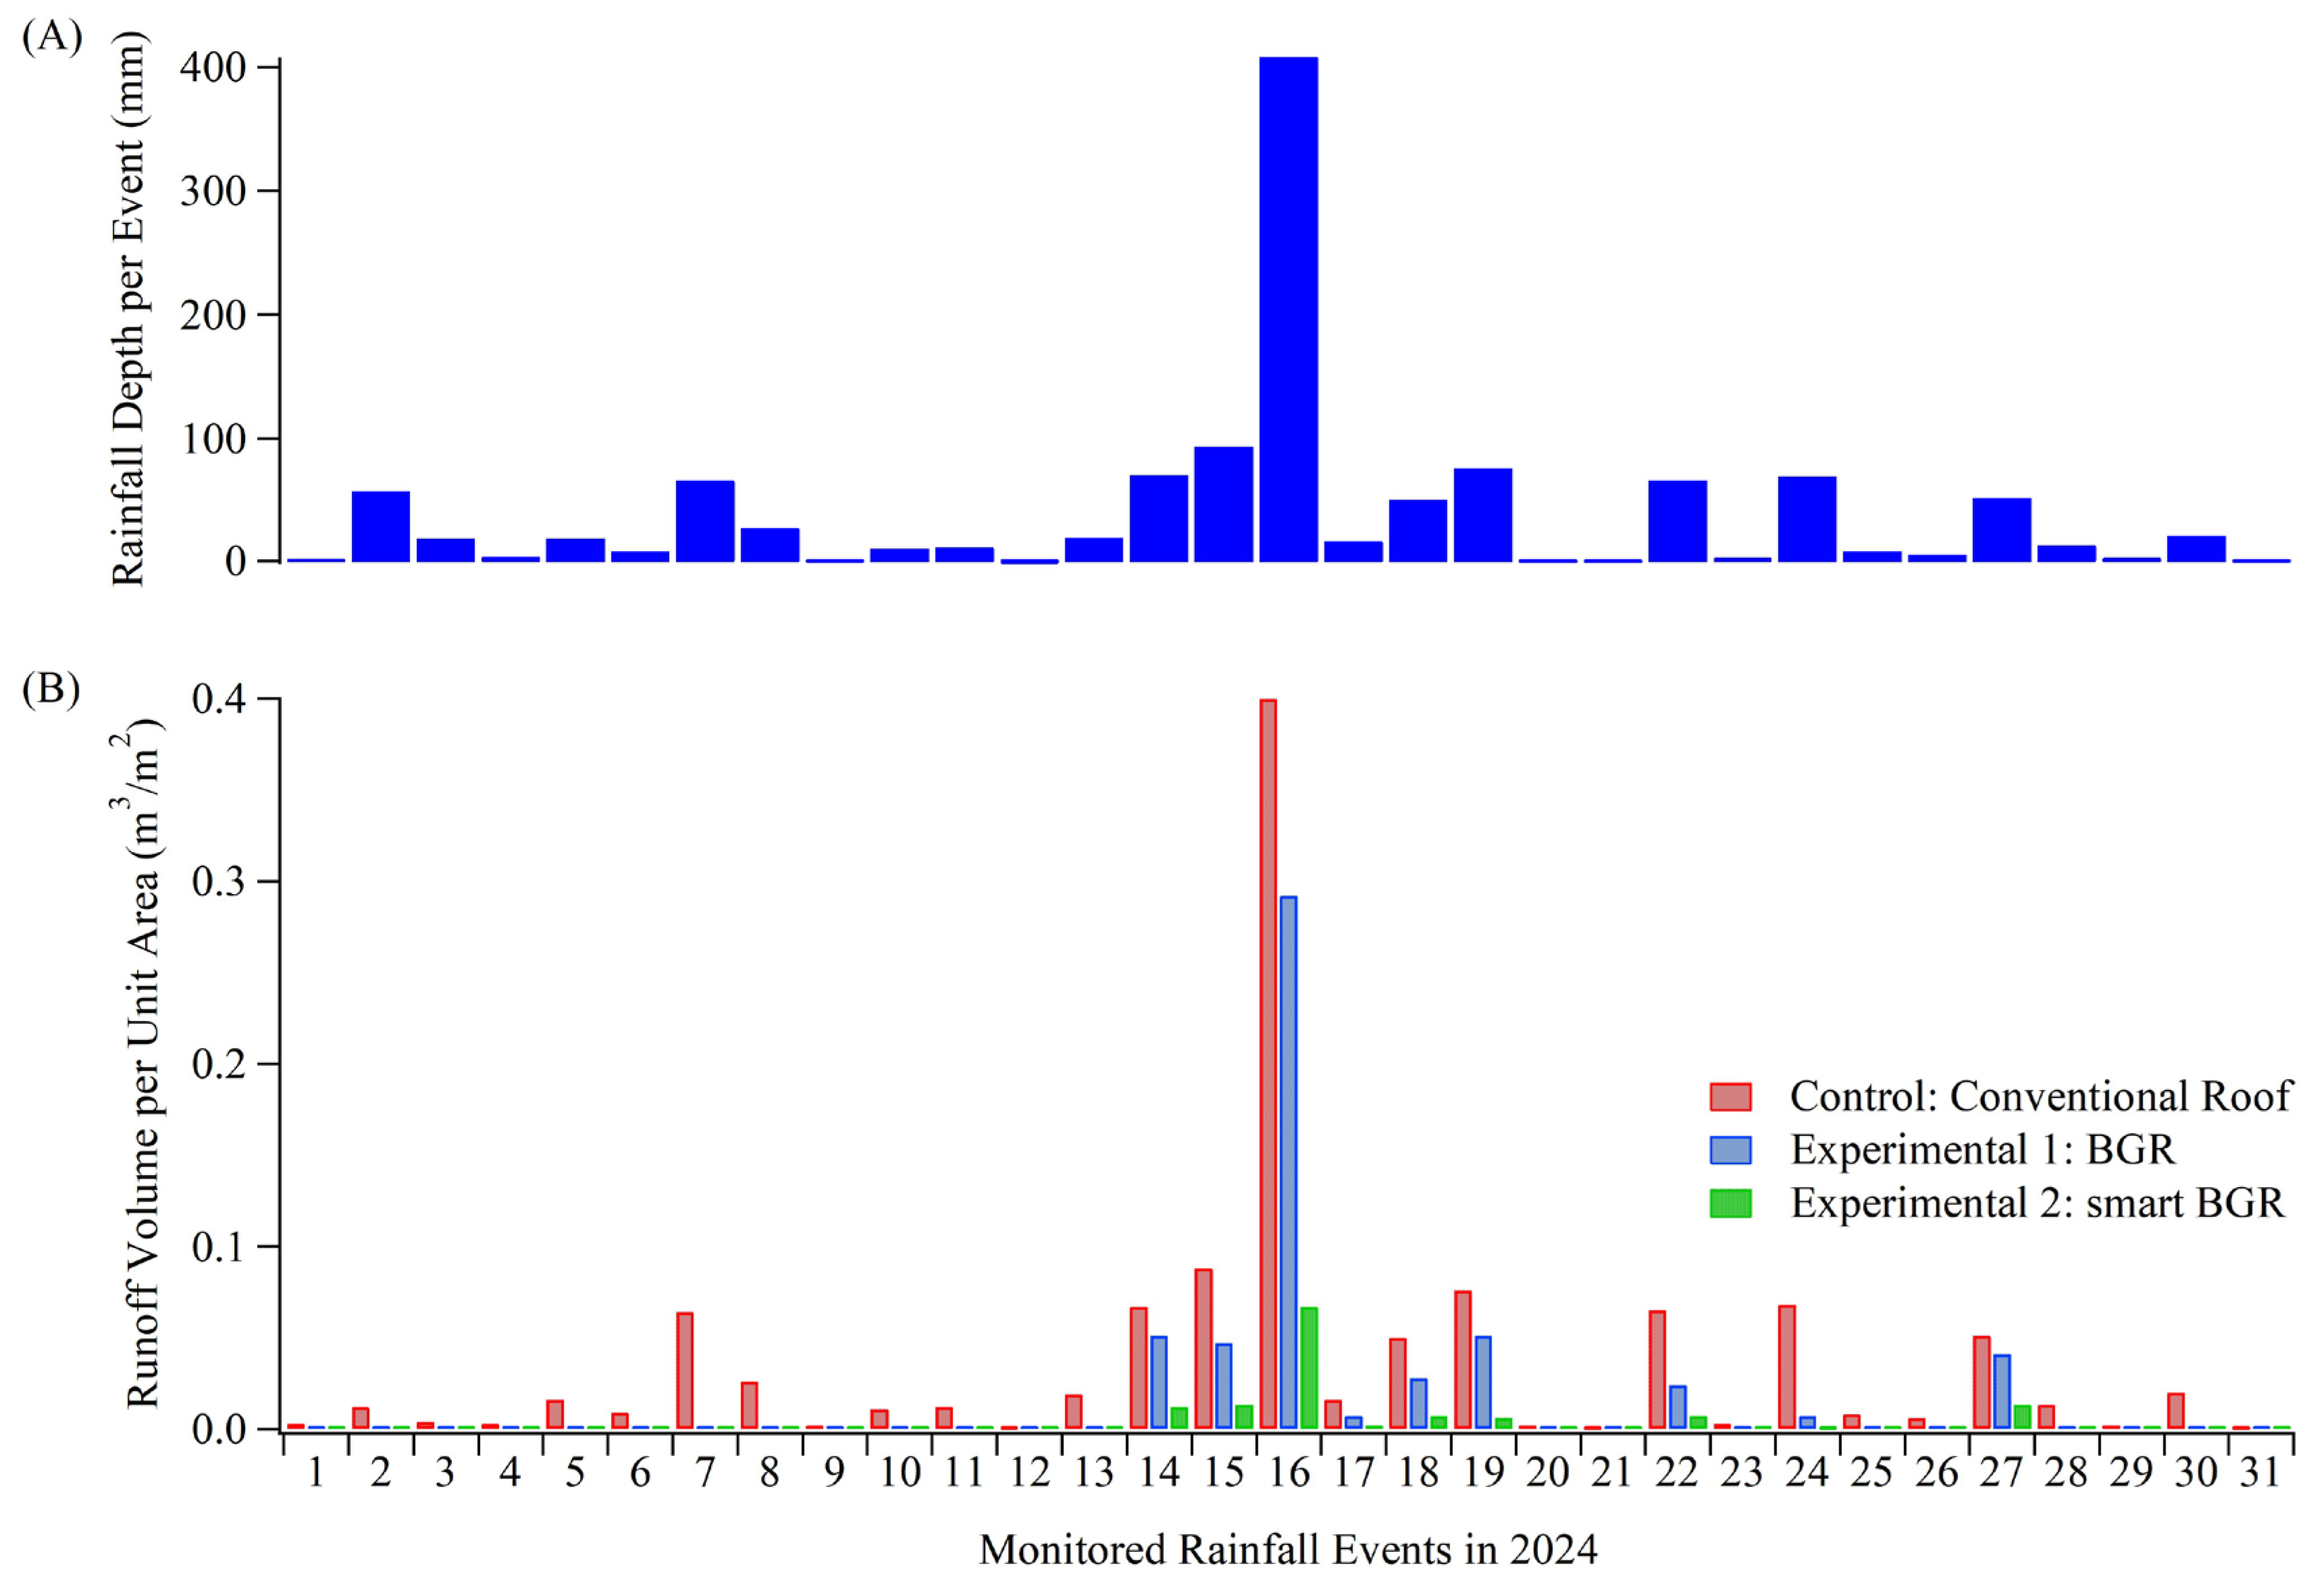
3.2. Evaluation of Runoff Reduction Performance of BGR and Smart BGR
3.3. Multiple Linear Regression Analysis for BGR and Smart BGR Systems Across Rainfall Classes
4. Conclusions and Discussion
Author Contributions
Funding
Data Availability Statement
Conflicts of Interest
References
- Dysarz, T.; Marcinkowski, P.; Wicher Dysarz, J.; Piniewski, M.; Miroslaw Swiatek, D.; Kundzewiczi, Z.W. Assessment of climate change impact on flood hazard zones. Water Resour. Manag. 2025, 39, 963–977. [Google Scholar] [CrossRef]
- Nuwahereza, N.; Tumwebaze, S.B. Assessment of the adoption of nature based solutions for flood risk mitigation: Socio economic determinants in the River Nyamwamba catchment, Uganda. Nat. Based Solut. 2025, 7, 100225. [Google Scholar] [CrossRef]
- Rogers, J.S.; Maneta, M.P.; Sain, S.R.; Madaus, L.E.; Hacker, J.P. The role of climate and population change in global flood exposure and vulnerability. Nat. Commun. 2025, 16, 1287. [Google Scholar] [CrossRef]
- Deopa, R.; Thakur, D.A.; Kumar, S.; Mohanty, M.P.; Asha, P. Discerning the dynamics of urbanization–climate change–flood risk nexus in densely populated urban mega cities: An appraisal of efficient flood management through spatiotemporal and geostatistical rainfall analysis and hydrodynamic modeling. Sci. Total Environ. 2024, 952, 175882. [Google Scholar] [CrossRef] [PubMed]
- Islam, M.T.; Meng, Q. Spatial analysis of socio economic and demographic factors influencing urban flood vulnerability. J. Urban Manag. 2024, 13, 437–455. [Google Scholar] [CrossRef]
- Kwak, C.; Jo, J.; Han, J.; Kim, J.; Lee, S. Analysis of Flood Risk in Ulsan Metropolitan City, South Korea, Considering Urban Development and Changes in Weather Factors. Water 2025, 17, 2800. [Google Scholar] [CrossRef]
- Mu, Y.; Li, Y.; Yan, R.; Luo, P.; Liu, Z.; Sun, Y.; Wang, S.; Zhu, W.; Zha, X. Analysis of the ongoing effects of disasters in urbanization process and climate change: China’s floods and droughts. Sustainability 2024, 16, 14. [Google Scholar] [CrossRef]
- Seemuangngam, A.; Lin, H. The impact of urbanization on urban flood risk on Nakhon Ratchasima, Thailand. Appl. Geogr. 2024, 162, 103152. [Google Scholar] [CrossRef]
- Tang, J.; Liu, D.; Shang, C.; Niu, J. Impacts of land use change on surface infiltration capacity and urban flood risk in a representative karst mountain city over the last two decades. J. Clean. Prod. 2024, 454, 142196. [Google Scholar] [CrossRef]
- Kumar, S.; Guntu, R.K.; Agarwal, A.; Villuri, V.G.K.; Pasupuleti, S.; Kaushal, D.R.; Gosian, A.K.; Bronstert, A. Multi objective optimization for stormwater management by green roofs and infiltration trenches to reduce urban flooding in central Delhi. J. Hydrol. 2022, 606, 127455. [Google Scholar] [CrossRef]
- MOIS (Ministry of the Interior and Safety). Disaster Annual Report 2023. Available online: www.safekorea.go.kr (accessed on 21 July 2025).
- European Commission. Facing Increasing River Flood Risk in Europe: Adaptation Measures Can Save Lives and Billions of Euro. 2023. Available online: https://joint-research-centre.ec.europa.eu/jrc-news-and-updates/facing-increasing-river-flood-risk-europe-adaptation-measures-can-save-lives-and-billions-euro-2023-02-06_en (accessed on 30 July 2025).
- Prieto, C.; Patel, D.; Han, D.; Dewals, B.; Bray, M.; Molinari, D. Preface: Advances in pluvial and fluvial flood forecasting and assessment and flood risk management. Nat. Hazards Earth Syst. Sci. 2024, 24, 3381–3386. [Google Scholar] [CrossRef]
- Wang, Z.; Li, Z.; Wang, Y.; Zheng, X.; Deng, X. Building green infrastructure for mitigating urban flood risk in Beijing, China. Urban For. Urban Green. 2024, 93, 128218. [Google Scholar] [CrossRef]
- Ruan, X.; Sun, H.; Shou, W.; Wang, J. The impact of climate change and urbanization on compound flood risks in coastal areas: A comprehensive review of methods. Appl. Sci. 2024, 14, 10019. [Google Scholar] [CrossRef]
- Lo, W.; Wu, M.; Wu, J.; Huang, Y. Integrating Urban Planning and Hydraulic Engineering: Nature-Based Solutions for Flood Mitigation in Tainan City. Water 2025, 17, 2018. [Google Scholar] [CrossRef]
- Sciuto, L.; Licciardello, F.; Giuffrida, E.R.; Barresi, S.; Scavera, V.; Verde, D.; Barbagallo, S.; Cirelli, G.L. Hydrological-hydraulic modelling to assess nature based solutions for flood risk mitigation in an urban area of Catania (Sicily, Italy). Nat. Based Solut. 2025, 7, 100210. [Google Scholar] [CrossRef]
- Ghalehteimouri, K.J.; Ros, F.C.; Rambat, S. Flood risk assessment through rapid urbanization LULC change with destruction of urban green infrastructures based on NASA Landsat time series data: A case of study Kuala Lumpur between 1990–2021. Ecol. Front. 2024, 44, 289–306. [Google Scholar] [CrossRef]
- Rahman, M.D.R.; Kang, S.; Lee, S.; Lee, J. A green infrastructure planning approach for enhanced flood control and resilience in urban areas. Land Use Policy 2024, 153, 107535. [Google Scholar] [CrossRef]
- Öztürk, Ş.; Yılmaz, K.; Dinçer, A.E.; Kalpakcı, V. Effect of urbanization on surface runoff and performance of green roofs and permeable pavement for mitigating urban floods. Nat. Hazards 2024, 120, 12375–12399. [Google Scholar] [CrossRef]
- Bocanegra, J.A.; Scarpa, F.; Bianco, V.; Tagliafico, L.A. Feasibility of green roofs in the Mediterranean region: A stochastic study using a Monte Carlo financial model. Energy 2024, 309, 132995. [Google Scholar] [CrossRef]
- Kim, E.S.; Yeon, J.S.; Shin, H.S.; Lee, J.S.; Choi, H.I. Study on stormwater runoff reduction effects by LID application areas. J. Korean Soc. Hazard Mitig. 2014, 14, 309–316. [Google Scholar] [CrossRef]
- Osawa, T.M.; Nogueira, F.F.; Gonzaga, S.C.M.; Silva, F.G.; Miranda, S.D.; Leite, B.C.C.; Martins, J.R.S. Hydrological benefits of green roof retrofitting policies: A case study of an urban watershed in Brazil. Water 2025, 17, 1936. [Google Scholar] [CrossRef]
- Liu, L.; Sun, L.; Niu, J.; Riley, W.J. Modeling Green Roof Potential to Mitigate Urban Flooding in a Chinese City. Water 2020, 12, 2082. [Google Scholar] [CrossRef]
- Moghanlo, S.J.; Raimondi, A. Impacts of blue-green infrastructures on combined sewer overflows. Nat.-Based Solut. 2025, 7, 100208. [Google Scholar] [CrossRef]
- Neumann, J.; Scheid, C.; Dittmer, U. Potential of Decentral Nature-Based Solutions for Mitigation of Pluvial Floods in Urban Areas—A Simulation Study Based on 1D/2D Coupled Modeling. Water 2024, 16, 811. [Google Scholar] [CrossRef]
- Lee, S.W.; Seo, J.; Cha, S.M. A study on evaluation of the ability to reduce stormwater runoff of blue-green roof for flood damage reduction. J. Korean Soc. Water Environ. 2023, 39, 30–37. [Google Scholar] [CrossRef]
- Lepcha, R.; Patra, S.K.; Ray, R.; Thapa Baral, D.; Saha, S. Rooftop rainwater harvesting a solution to water scarcity: A review. Groundw. Sustain. Dev. 2024, 26, 101305. [Google Scholar] [CrossRef]
- Mazurkiewicz, K.; Jeż-Walkowiak, J.; Michałkiewicz, M. Physicochemical and microbiological quality of rainwater harvested in underground retention tanks. Sci. Total Environ. 2022, 814, 152701. [Google Scholar] [CrossRef]
- Cha, S.M.; Ki, S.J.; Cho, K.H.; Choi, H.; Kim, J.H. Effect of environmental flow management on river water quality: A case study at Yeongsan River, Korea. Water Sci. Technol. 2009, 59, 2437–2446. [Google Scholar] [CrossRef]


| Maximum Rainfall Depth per Event (mm) | Maximum Antecedent Dry Days (ADDs) | Maximum Consecutive Rainfall Days (CRDs) per Event | Maximum Daily Rainfall Depth (mm) | Number of Rainfall Events | Annual Rainfall Depth (mm) | |
|---|---|---|---|---|---|---|
| 2017 | 167.0 | 26 | 4 | 103.0 | 50 | 957.5 |
| 2018 | 470.5 | 23 | 4 | 206.5 | 52 | 1439.1 |
| 2019 | 183.5 | 49 | 5 | 169.0 | 42 | 946.1 |
| 2020 | 286.0 | 46 | 8 | 118.0 | 41 | 1462.5 |
| 2021 | 93.0 | 23 | 6 | 70.5 | 50 | 1114.6 |
| 2022 | 253.0 | 35 | 5 | 200.5 | 37 | 1271.0 |
| 2023 | 154.5 | 26 | 4 | 116.5 | 52 | 1510.0 |
| 2024 | 408.0 | 29 | 14 | 164.5 | 43 | 1236.0 |
| Mean | 251.9 | 32.1 | 6.3 | 143.6 | 45.9 | 1242.1 |
| Stdev | 130.9 | 10.3 | 3.4 | 48.8 | 5.8 | 222.0 |
| Max | 470.5 | 49.0 | 14.0 | 206.5 | 52.0 | 1510.0 |
| Min | 93.0 | 23.0 | 4.0 | 70.5 | 37.0 | 946.1 |
| Date | Rainfall Depth (mm) | ADDs (Days) | CRDs per Event (Days) | Number of Rainfall Events | Number of Monitoring Events |
|---|---|---|---|---|---|
| 01-10-2024 | 3 | 4 | 4 | Event 1 | - |
| 01-14-2024 | 3 | 4 | 1 | Event 2 | Monitoring 1 |
| 01-18-2024 | 7.5 | 3 | 2 | Event 3 | - |
| 01-20-2024 | 0.5 | 2 | 1 | Event 4 | - |
| 02-25-2024 | 57 | 29 | 8 | Event 5 | Monitoring 2 |
| 03-07-2024 | 0.5 | 10 | 1 | Event 6 | - |
| 03-22-2024 | 1.5 | 15 | 1 | Event 7 | - |
| 03-26-2024 | 19 | 3 | 2 | Event 8 | Monitoring 3 |
| 03-29-2024 | 4.5 | 2 | 2 | Event 9 | Monitoring 4 |
| 04-15-2024 | 19 | 16 | 2 | Event 10 | Monitoring 5 |
| 04-20-2024 | 4 | 5 | 1 | Event 11 | - |
| 04-24-2024 | 8.5 | 4 | 1 | Event 12 | Monitoring 6 |
| 05-07-2024 | 66 | 11 | 3 | Event 13 | Monitoring 7 |
| 05-12-2024 | 27.5 | 4 | 2 | Event 14 | Monitoring 8 |
| 05-15-2024 | 2 | 3 | 1 | Event 15 | Monitoring 9 |
| 05-27-2024 | 11 | 10 | 2 | Event 16 | Monitoring 10 |
| 06-08-2024 | 12 | 12 | 1 | Event 17 | Monitoring 11 |
| 06-15-2024 | 1 | 7 | 1 | Event 18 | Monitoring 12 |
| 06-23-2024 | 19.5 | 7 | 2 | Event 19 | Monitoring 13 |
| 06-30-2024 | 70 | 7 | 2 | Event 20 | Monitoring 14 |
| 07-08-2024 | 93.5 | 2 | 7 | Event 21 | Monitoring 15 |
| 07-10-2024 | 0.5 | 2 | 1 | Event 22 | - |
| 07-27-2024 | 408 | 4 | 14 | Event 23 | Monitoring 16 |
| 08-08-2024 | 16.5 | 9 | 4 | Event 24 | Monitoring 17 |
| 08-16-2024 | 50.5 | 6 | 3 | Event 25 | Monitoring 18 |
| 08-18-2024 | 2 | 2 | 1 | Event 26 | - |
| 08-23-2024 | 76 | 3 | 3 | Event 27 | Monitoring 19 |
| 09-02-2024 | 1.5 | 10 | 1 | Event 28 | Monitoring 20 |
| 09-05-2024 | 1.5 | 3 | 1 | Event 29 | Monitoring 21 |
| 09-13-2024 | 66 | 6 | 3 | Event 30 | Monitoring 22 |
| 09-16-2024 | 4 | 3 | 1 | Event 31 | Monitoring 23 |
| 09-21-2024 | 69 | 4 | 2 | Event 32 | Monitoring 24 |
| 09-26-2024 | 8.5 | 5 | 1 | Event 33 | Monitoring 25 |
| 10-01-2024 | 6 | 5 | 1 | Event 34 | Monitoring 26 |
| 10-15-2024 | 0.5 | 14 | 1 | Event 35 | - |
| 10-19-2024 | 51.5 | 3 | 2 | Event 36 | Monitoring 27 |
| 10-23-2024 | 13.5 | 3 | 2 | Event 37 | Monitoring 28 |
| 10-29-2024 | 1 | 6 | 1 | Event 38 | - |
| 11-16-2024 | 4 | 18 | 1 | Event 39 | Monitoring 29 |
| 11-27-2024 | 21.5 | 10 | 2 | Event 40 | Monitoring 30 |
| 11-30-2024 | 0.5 | 3 | 1 | Event 41 | - |
| 12-05-2024 | 2 | 5 | 1 | Event 42 | Monitoring 31 |
| 12-21-2024 | 1 | 16 | 1 | Event 43 | - |
| Rainfall Depth Class | Monitoring N. of Rainfall Events | Rainfall Depth Average (mm) | Runoff by Unit Area (m3/m2) | Stormwater Runoff Reduction Rate (%) | ||||
|---|---|---|---|---|---|---|---|---|
| Control | BGR | Smart BGR | Control | BGR | Smart BGR | |||
| 1 | 12 | 3.88 (±2.61) | 0.0033 (±0.0027) | 0.0000 (±0.0000) | 0.0000 (±0.0000) | - | 100.00 (±0.00) | 100.00 (±0.00) |
| 2 | 9 | 17.72 (±5.17) | 0.0151 (±0.0062) | 0.0008 (±0.0023) | 0.0002 (±0.0005) | - | 95.11 (±14.68) | 98.94 (±3.19) |
| 3 | 3 | 53.00 (±3.50) | 0.0377 (±0.0222) | 0.0228 (±0.0067) | 0.0067 (±0.0064) | - | 54.89 (±41.13) | 86.71 (±12.65) |
| 4 | 7 | 121.21 (±126.82) | 0.1180 (±0.1245) | 0.0673 (±0.1011) | 0.0152 (±0.0234) | - | 54.68 (±30.60) | 90.00 (±7.33) |
| Model | R | R Square | Adjusted R Square | Std. Error of the Estimate | Change Statistics | ||||
|---|---|---|---|---|---|---|---|---|---|
| R Square Change | F Change | df1 | df2 | Sig. F Change | |||||
| 1. Control: Conventional Roof | |||||||||
| Group A | 0.355 | 0.126 | −0.029 | 87.66792 | 0.126 | 0.815 | 3 | 17 | 0.503 |
| Group B | 0.675 | 0.455 | 0.183 | 24.26270 | 0.455 | 1.671 | 3 | 6 | 0.271 |
| 2. BGR | |||||||||
| Group A | 0.396 | 0.157 | 0.008 | 63.94197 | 0.157 | 1.054 | 3 | 17 | 0.394 |
| Group B | 0.938 | 0.879 | 0.819 | 6.01592 | 0.879 | 14.529 | 3 | 6 | 0.004 |
| 3. smart BGR | |||||||||
| Group A | 0.350 | 0.123 | −0.032 | 15.01311 | 0.123 | 0.792 | 3 | 17 | 0.515 |
| Group B | 0.938 | 0.880 | 0.820 | 1.83168 | 0.880 | 14.702 | 3 | 6 | 0.004 |
Disclaimer/Publisher’s Note: The statements, opinions and data contained in all publications are solely those of the individual author(s) and contributor(s) and not of MDPI and/or the editor(s). MDPI and/or the editor(s) disclaim responsibility for any injury to people or property resulting from any ideas, methods, instructions or products referred to in the content. |
© 2025 by the authors. Licensee MDPI, Basel, Switzerland. This article is an open access article distributed under the terms and conditions of the Creative Commons Attribution (CC BY) license (https://creativecommons.org/licenses/by/4.0/).
Share and Cite
Cha, S.M.; Park, J.; Han, K.S.; Kim, J.D.; Lee, J.M.; Kwon, S.; Kim, J. Rooftop-Scale Runoff Reduction Performance of Smart Blue-Green Roofs and Their Potential Role in Urban Flood Mitigation. Water 2025, 17, 3328. https://doi.org/10.3390/w17223328
Cha SM, Park J, Han KS, Kim JD, Lee JM, Kwon S, Kim J. Rooftop-Scale Runoff Reduction Performance of Smart Blue-Green Roofs and Their Potential Role in Urban Flood Mitigation. Water. 2025; 17(22):3328. https://doi.org/10.3390/w17223328
Chicago/Turabian StyleCha, Sung Min, Jaerock Park, Kyung Soo Han, Jong Dae Kim, Jung Min Lee, Soonchul Kwon, and Jaemoon Kim. 2025. "Rooftop-Scale Runoff Reduction Performance of Smart Blue-Green Roofs and Their Potential Role in Urban Flood Mitigation" Water 17, no. 22: 3328. https://doi.org/10.3390/w17223328
APA StyleCha, S. M., Park, J., Han, K. S., Kim, J. D., Lee, J. M., Kwon, S., & Kim, J. (2025). Rooftop-Scale Runoff Reduction Performance of Smart Blue-Green Roofs and Their Potential Role in Urban Flood Mitigation. Water, 17(22), 3328. https://doi.org/10.3390/w17223328


