Article

The Construction of Check Dams on the Loess Plateau Has Prolonged Water Transmission Times and Altered Recharge Relationships

1
College of Forestry and Prataculture, Ningxia University, Yinchuan 750000, China
2
College of Geology and Environment, Xi’an University of Science and Technology, Xi’an 710054, China
3
College of Agriculture, Ningxia University, Yinchuan 750000, China
4
College of Ecological Environment, Ningxia University, Yinchuan 750000, China
*
Authors to whom correspondence should be addressed.
Water 2025, 17(22), 3320; https://doi.org/10.3390/w17223320
Submission received: 14 October 2025 / Revised: 6 November 2025 / Accepted: 18 November 2025 / Published: 20 November 2025
(This article belongs to the Special Issue Soil Erosion and Soil and Water Conservation, 2nd Edition)

Abstract

Background: As a key structure for gully control on the Loess Plateau, check dams are designed to intercept sediment and reduce flood peaks without intentional water storage. However, persistent ponding zones have often formed upstream of dams in the Niejia River Basin, exceeding their intended functionality. Methods: This study examines the basin using hydrogen and oxygen stable isotopes to trace hydrological processes. Based on 251 water samples, mixing models and exponential fitting were applied to quantify water sources and transmission times. Results: Results show that precipitation (47.07%) and groundwater (34.48%) are the main sources of channel water. Check dams extended water transmission time in dammed tributaries to 489 days—2.8 times longer than in undammed ones. Conclusions: This delay enhances watershed storage capacity, providing insight into the hydrological impacts of check dams on the Loess Plateau.

1. Introduction

The Loess Plateau, as a crucial area for ecological environment construction in China, is also a typical region with water resource shortage. The unique loess deposition landform and climatic conditions in this area make the hydrological cycle process complex and sensitive [1]. To effectively prevent soil erosion, over 56,000 check dams have been built in the Loess Plateau by 2023. Check dams have played a key role in controlling gully erosion and reducing sediment input into the Yellow River, while also creating considerable agricultural land resources for the local area, demonstrating significant ecological and economic benefits [2]. The construction of check dams not only effectively improves the ecological environment through sediment retention and land creation but also significantly alters the natural hydrological pathways and cycles within the basin [3]. Against this backdrop, in-depth research on the impact of check dams on the hydrological transmission process in the basin is of great theoretical and practical significance for scientifically assessing their comprehensive ecological effects, optimizing the layout of dam systems, and promoting ecological protection and high-quality development in small watersheds of the Loess Plateau.
Hydrogen and oxygen isotopes, as inherent components of water molecules, are known as “natural tracers” for studying hydrological processes due to their fractionation effects that can record the source and transport information of water bodies [4]. The fractionation effects among different water bodies enable isotopic compositions to retain the “fingerprint” information of water sources and transport paths; thus, this technique is widely applied in identifying water body sources, analyzing hydrological cycle paths, and quantifying water exchange processes between different water bodies [5]. Currently, most related studies focus on single water body types or large river basins [6], mainly concentrating on using hydrogen and oxygen isotope techniques to reveal the isotopic characteristics of precipitation and the sources of groundwater recharge. However, less attention has been paid to the transformation and transport mechanisms of water bodies at the small watershed scale, especially under the influence of check dams. As a relatively independent hydrological system, the spatiotemporal evolution patterns of hydrogen and oxygen isotopes in different water bodies within small watersheds, as well as their response mechanisms to local climate, topography, and engineering interventions such as check dams, remain unclear [7]. Under the influence of check dam systems, the recharge and transport relationships among surface water (including pre-dam runoff and water within the dam), precipitation, and groundwater in small watersheds become more complex [8,9], disrupting the traditional hydrological transmission processes of the watershed. Therefore, it is crucial to precisely quantify how the recharge ratios change dynamically with the seasons. Additionally, the retention effect of check dams significantly alters the hydraulic gradient and flow paths within small watersheds, thereby affecting the transmission time of water from precipitation to the watershed outlet. As a key hydrological parameter, the variation in transmission time can effectively reveal the impact of check dams and their systems on the hydrological cycle of the watershed [10]. Therefore, systematically analyzing the hydrogen and oxygen isotope characteristics of different water bodies within small watersheds, quantitatively resolving their recharge sources and proportions, and quantifying their transmission times within the watershed provides an effective approach. While hydrogen and oxygen isotope tracing is a well-established method in catchment hydrology, its integrated application to evaluate the impact of check dam systems on water transmission times and recharge relationships in the Loess Plateau represents a novel approach. This study combines isotopic analysis with spatial-temporal dynamics and end-member mixing models to provide a holistic understanding of hydrological alterations caused by human infrastructure, which has rarely been attempted in similar arid and semi-arid environments.
The Niejia River Basin is located in the western part of the Loess Plateau, where soil erosion is severe. To control the severe soil erosion, 22 check dams have been built in the basin [11]. Most of the check dams in the Niejia River Basin have accumulated water for many years in different areas. Due to the water being constantly stored under the dead storage capacity and unable to flow and renew, the water quality is poor and cannot be used for domestic and agricultural purposes. Therefore, this study quantitatively analyzed the changes in the hydrological characteristics of the basin caused by water and soil conservation measures in the Niejia River Basin through the study of the water transformation ratio and transmission time in the basin, providing a theoretical basis for the construction, evaluation and optimization of check dams and their systems in the local area. Through one-year meteorological monitoring and sample collection in the Niejia River Basin, the hydrogen and oxygen isotope tracer technique was used to quantitatively analyze the recharge sources and transmission time of the accumulated water in the check dams, revealing the impact of check dam construction on the hydrological process of the basin. The research results have important scientific value for the efficient utilization of water resources and water and soil conservation engineering in small basins in the hilly areas of the Loess Plateau.

2. Materials and Methods

2.1. Overview of the Study Area

The study area is located in the Niejia small watershed of Xiji County, Ningxia (105°38′43″ E–105°41′00″ E, 35°47′02″ N–35°49′38″ N), which belongs to the Lanni River Basin, a tributary of the Hulu River. The total area of the watershed is 46.6 km2. The topography of the watershed is characterized by the Loess Hilly Region, and the soil erosion area is classified as the third sub-region of the Loess Plateau Hilly and Gully Region. The multi-year average precipitation in the watershed is 428.2 mm, and the total annual evaporation is 1490 mm, approximately 3.5 times the precipitation, indicating a strong evaporation effect. The cumulative precipitation in the watershed in 2024 was 418.10 mm. In the main channel of the Niejia River, six sediment retention dams (numbered 1#–6#) are built from west to east. For comparative research, two tributaries with similar area, channel length and watershed morphology were selected throughout the watershed. Among them, two sediment retention dams were built in tributary G, while no sediment retention dams were built in tributary X, which served as the control (Figure 1).

2.2. Research Methods

2.2.1. Sample Collection

Precipitation (PRE) samples were collected in the middle of the basin using a J 16,022 type rain gauge. To reduce evaporation loss, a spiral plastic tube was connected to the end of the funnel and extended to the bottom of the cylinder to increase the water vapor condensation path. Before installation, an appropriate amount of liquid paraffin oil was added to the rainwater collector in the rain gauge to further inhibit water evaporation. At the same time, Vaseline was used to seal the connection gaps of each part of the rain gauge to ensure good airtightness. To prevent debris such as dead branches and leaves from blocking the funnel, gauze was placed over the funnel opening. When collecting PRE samples, a 250 mL disposable syringe was used to extract the water sample below the paraffin oil layer and transferred to a 100 mL brown glass reagent bottle. The sample bottle was tightly capped and sealed with Parafilm sealing film, and then stored in the refrigerator until it was sent back to the laboratory for analysis.
The collection period for CDW and UGW samples was from April 2024 to March 2025, with a sampling frequency of approximately once a month (average cycle of 30 days). Surface water (CDW) samples were collected from the impoundment areas of the 1#–6# sediment control dams in the main channel, the G1 and G2 sediment control dams in the tributary G, and the surface runoff in the tributary X. Groundwater (UGW) samples were sourced from the water wells along the 1#–6# sediment control dams, which were confirmed to draw from shallow groundwater after screening, to ensure the validity of the sampling. When collecting water samples, the sampling bottles were immersed 30 cm below the water surface to avoid the influence of surface evaporation fractionation. The collected samples were immediately placed in 100 mL brown reagent bottles, sealed with Parafilm sealing film, and stored in a portable refrigerator at low temperature. After all samples were brought back to the laboratory, they were refrigerated at 4 °C until isotope determination. All samples were taken in triplicate, and the average of the three measurements was taken as the final result.

2.2.2. Determination and Analysis of Water Hydrogen and Oxygen Isotopes

(1)
Hydrogen and oxygen stable isotope determination
The determination of hydrogen and oxygen isotopes in water samples was conducted using a liquid water isotope analyzer (DLT-100, LGR, Produced by LGR Inc., Los Gatos, CA, USA and provided by Beijing LICA United Technology Co., Ltd., Beijing, China). During the measurement, both standard samples and water samples underwent six needle puncture and injection procedures, repeated six times. Additionally, the standard sample was retested every three samples to ensure the stability and validity of the data. The isotopic ratios of D and 18O were calculated as the per mil deviation from the Vienna Standard Mean Ocean Water (VSMOW), with an accuracy of 0.5‰ and 0.15‰, respectively. The analytical precision for δ18O and δD was ±0.15‰ and ±0.5‰, respectively, based on repeated measurements of standard samples [12].
δ = R sample R VSMOW R VSMOW × 100
In the formula, Rsample represents the ratio of D/H or 18O/16O in water, while RVSMOW stands for the ratio of D/H or 18O/16O in the VSMOW standard water sample.
(2)
Calculation of deuterium excess
d - excess = δ D 8 δ 18 O
In the formula, d-excess represents the deuterium excess, while δD and δ18O are the measured D and 18O values of the water sample.
(3)
Least squares method for fitting the precipitation line, surface water line and groundwater line.
α = i = 1 n xy 1 n i = 1 n x i = 1 n y i = 1 n x 2 1 n i = 1 n x 2
β = 1 n i = 1 n y α n i = 1 n x
In the formula: n represents the number of samples; x represents the δ18O value; y represents the δD value.
(4)
The end-member mixing model is used to calculate the proportion of water body source recharge.
Based on the law of conservation of stable isotope mass, stable isotope tracing is used to study the sources, partitioning and mutual transformation between surface water and groundwater of basin runoff. By comparing the stable isotope values of different water bodies, the end-member model is used to calculate the complementary proportion of different water body source [13]. According to the concentration balance equation and the mass balance equation, the end-member mixing model can be obtained, and the specific formula is as follows:
Q t = Q u + Q v
Q t C t = Q u C u + Q v C v
Equation (7) is obtained through Equations (5) and (6).
Q P / Q R = ( δ R δ G ) / ( δ G δ P ) Q P / Q G = ( δ G δ R ) / ( δ R δ P )
In the formula, “Q” represents the replenishment ratio, δP is the hydrogen and oxygen isotope value of PRE, δR is the hydrogen and oxygen isotope value of CDW, and δG is the hydrogen and oxygen isotope value of UGW.
(5)
Sine fitting isotope amplitude
δ = X + A c o s ( c t θ )
In the formula, δ represents δD or δ18O; X is the interannual average of δD or δ18O; A is the amplitude; c is the fluctuation frequency of δD or δ18O (0.017214 rad/d); t is time; θ is the lag time.
(6)
The exponential model (EM) is used to calculate the water body transmission time.
Water transmission time refers to the period from when water enters a watershed system until it leaves the system. It is a comprehensive indicator that reflects the spatial variation in water flow paths and the generation of variability, and can reveal various aspects of information such as water storage, flow paths, and water sources. At the same time, it is closely related to some internal processes of the watershed. If the average water transmission time of a watershed can be quantitatively described, it will be possible to better understand the water chemical system and conduct research on the sensitivity of the watershed to human inputs and land use changes. Propagation of uncertainty in the mixing model and exponential fitting was estimated using Monte Carlo simulation, resulting in a relative error of ±10–15% for recharge ratios and ±12–18% for transmission times. The calculation formula of water transmission time in a watershed based on the EM (Exponential model) model is as follow [14]:
T = c 1 [ A Z 2 A Z 1 1 ] 0.5
In the formula, T represents the water transmission time, measured in days; Az1 is the amplitude of the sinusoidal simulation of the input water source; Az2 is the amplitude of the sinusoidal simulation of the output water source; and c is the fluctuation frequency of δD and δ18O (0.017214 rad/d).
(7)
Simulation of water vapor sources using the HYSPLIT backward trajectory model
The HYSPLIT (Hybrid Single-Particle Lagrangian Integrated Trajectory) model, jointly developed by the Atmospheric Research Laboratory of the National Oceanic and Atmospheric Administration of the United States and the Australian Bureau of Meteorology, is a hybrid single-particle Lagrangian integrated trajectory model. Its main application scenarios include dust simulation, environmental pollutant simulation, water vapor source path simulation, etc. Among them, many scholars have applied it to the research of tracking the water vapor sources of precipitation. By combining the meteorological data provided by the National Centers for Environmental Prediction of the United States, the water vapor trajectories in different stages of precipitation can be backtracked, and the water vapor sources and transport paths in the study area can be simulated and analyzed. By analyzing the hydrogen and oxygen isotope characteristics of atmospheric precipitation and their relationship with water vapor sources, it is helpful to study the water vapor transport characteristics in the monsoon region and analyze its impact on precipitation, thereby enhancing the understanding of the formation mechanism of precipitation and water vapor transport paths, and also providing certain references for the prediction of drought and flood disasters.
The trajectory calculation method of the model is [15]: Assuming that the particle moves with the wind field, the trajectory is the integral of the particle in time and space; through linear interpolation, the velocity of the particle position in time and space is obtained; the average value of the velocity of the previous time step and the velocity of the point where the initial guess value is located is multiplied by the time step to calculate the change in the particle position at the next time step. The specific calculation formula is [15]:
P t + Δ t = P t + V P , t Δ t
P ( t + Δ t ) = P ( t ) + 0.5 V ( P , t ) + V ( P , t + Δ t ) Δ t
In the formula: P represents the position of the particle; P′ represents the first guess position of the particle; t represents time; Δt represents the time step; V represents wind speed.
(8)
The Pearson correlation coefficient is used to calculate the correlation between isotopes and meteorological factors.
To explore the linear correlation between the stable isotopes of hydrogen and oxygen in precipitation (δD and δ18O) and key meteorological factors such as temperature, precipitation amount, and relative humidity, this study employed the Pearson correlation coefficient for analysis. This coefficient is a classic indicator for measuring the linear correlation between two continuous variables, with a range of [−1, 1]. The closer the absolute value is to 1, the stronger the linear correlation; the sign indicates the direction of the correlation (positive or negative). The formula for calculating the Pearson correlation coefficient r is as follows:
r = i = 1 n x i x ¯ y i y ¯ i = 1 n   ( x i x ¯ ) 2 i = 1 n   ( y i y ¯ ) 2
In the formula,  n  represents the sample size,  x i  and  y i  are the observed values of meteorological factors and isotope values in the i-th sample, respectively, and  x ¯  and  y ¯  are the arithmetic means of the corresponding variables. At the same time, the statistical significance (p-value) of the correlation coefficient is tested. Generally, it is considered that the correlation is statistically significant when p < 0.05. In the following text, the result of this coefficient is denoted as P [16].

2.3. Data Processing Methods

Data processing and analysis were conducted using Excel, Origin, MATLAB (version R2024b), R (version 4.5.1), Python (version 3.13), and HYSPLIT (version 5.4.2). When conducting data analysis, specific analyses should be carried out according to the seasons (spring: March to May, summer: June to August, autumn: September to November, winter: December to February of the following year) [17]. Meteorological data were mainly obtained from the meteorological stations (Davis Vantage Pro, Davis Instruments Corporation, San Francisco, CA, USA) set up within the basin. For missing or invalid data, interpolation was performed using the ERA5-Land reanalysis dataset on the Google Earth Engine platform (European Centre for Medium-Range Weather Forecasts, UK). The GDAS data required for running the HYSPLIT model were obtained from the National Centers for Environmental Prediction of the United States.

3. Results

3.1. Seasonal Characteristics of Hydrogen and Oxygen Isotopes in Different Water

3.1.1. The Characteristics of δD and δ18O

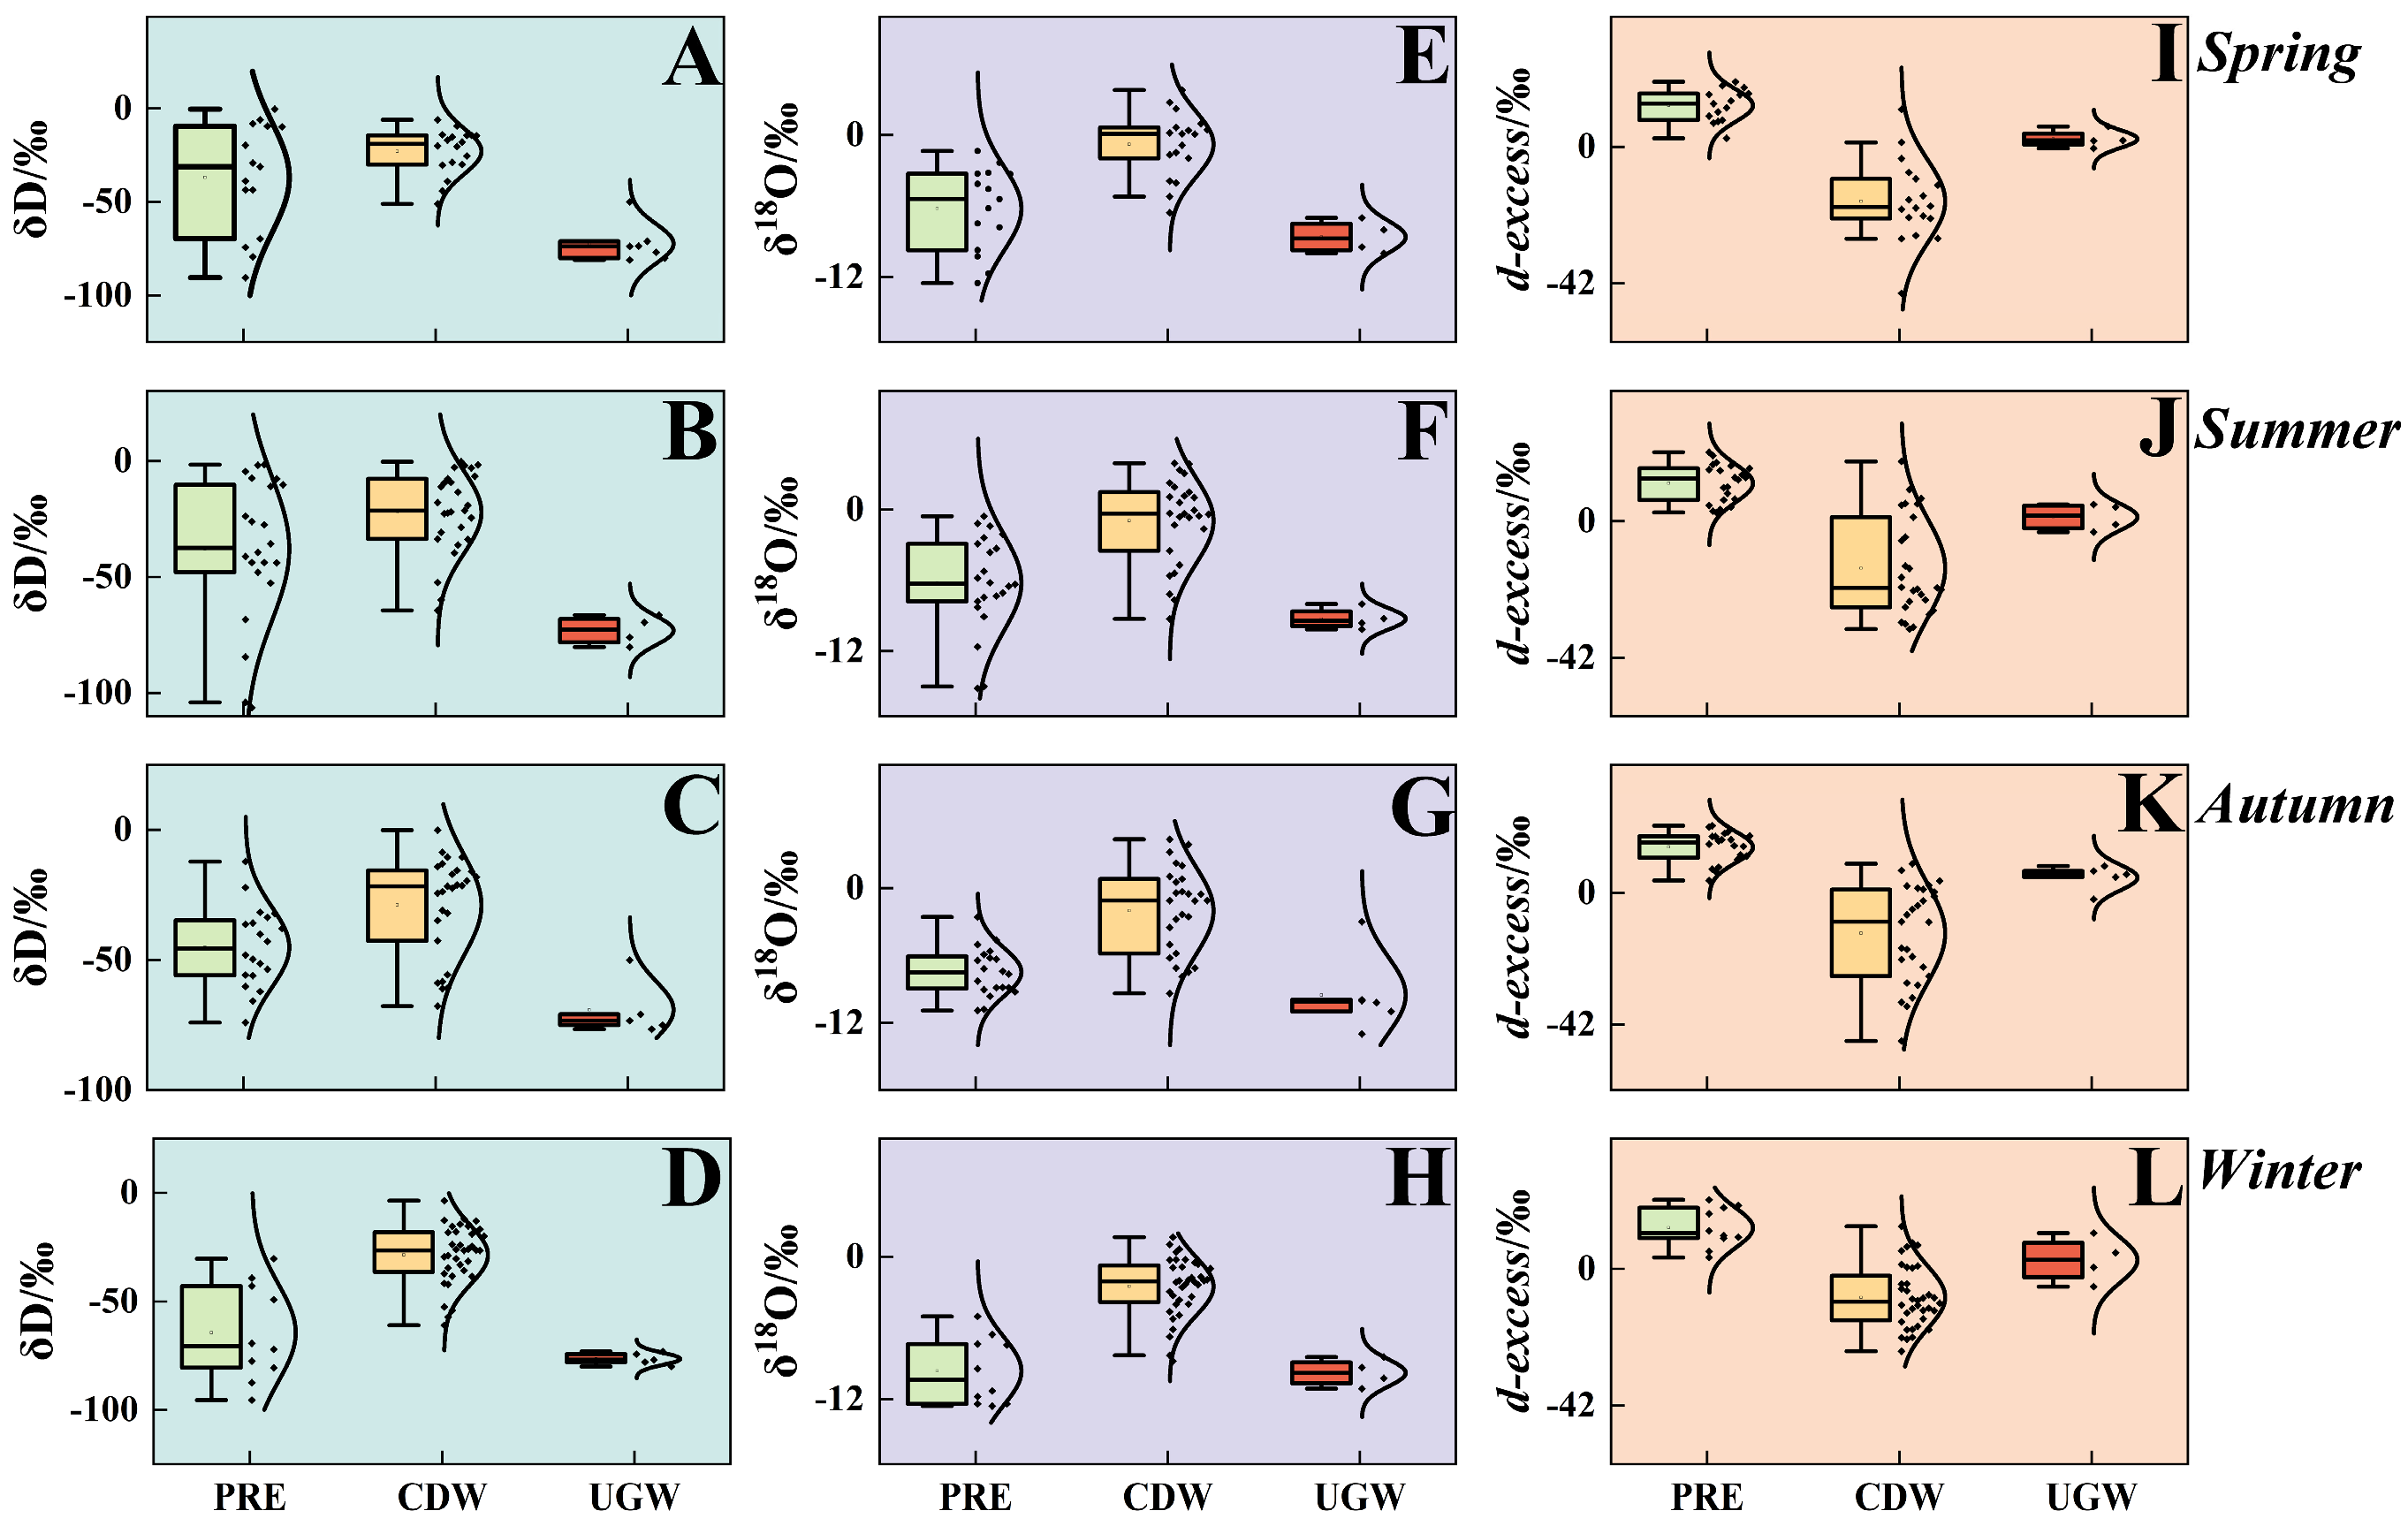
During the study period (April 2024 to March 2025), the hydrogen and oxygen isotope compositions of PRE, CDW, and UGW in the Niejia River Basin are shown in Figure 2A–L. The δD values of PRE fluctuated between −106.33‰ and 0.42‰ (Figure 2A–D), with a weighted average of −42.8‰ for precipitation, and the δ18O values ranged from −15.13‰ to −0.58‰ (Figure 2E–H), with a weighted average of −7.07‰ for precipitation. The isotopes of PRE exhibited a significant seasonal variation pattern: the summer was the most enriched, with average values of δD and δ18O being −37.86‰ and −6.20‰, respectively; while the winter was the most depleted, with average values of −70.60‰ and −10.49‰, respectively. The δD values of CDW ranged from −67.74‰ to −0.09‰, with an average of −28.46‰ (Figure 2A–D); the δ18O values were from −9.37‰ to −4.53‰, with an average of −2.00‰ (Figure 2E–H). Its isotopes also showed seasonal fluctuations, being most enriched in summer (δD = −22.10‰; δ18O = −0.95‰) and most depleted in winter (δD = −28.59‰; δ18O = −2.48‰). The δD and δ18O values of UGW had relatively narrow ranges, ranging from −80.25‰ to −69.56‰ (Figure 2A–D) and −11.11‰ to −8.46‰ (Figure 2E–H), respectively. Unlike PRE and CDW, UGW showed the most enriched isotopic characteristics in spring (δD = −70.20‰; δ18O = −9.59‰), and was most depleted in winter (δD = −77.94‰; δ18O = −10.30‰).

3.1.2. The Precipitation Line, Surface Water Line and Groundwater Line

The least squares method was used to construct the linear regression equations of δD and δ18O for PRE, CDW and UGW, which were, respectively, defined as the local meteoric water line (LMWL), the surface water evaporation line (CDWL) and the groundwater evaporation line (GWL, Figure 3). The equation of LMWL is δD = 7.64δ18O + 10.39 (R2 = 0.96, Figure 3A), with a slope of 7.64. The equation of the global meteoric water line (GMWL) is δD = 8δ18O + 10, with a slope of 8. LMWL is located above and to the left of GMWL, with a slope smaller than that of GMWL and an intercept higher than that of GMWL. The equation of CDWL is δD = 4.43δ18O–18.46 (R2 = 0.88, Figure 3B), with both the slope and intercept smaller than those of GMWL and LMWL. The equation of GWL is δD = −2.07δ18O–54.4 (R2 = 0.12, Figure 3C), with both the slope and intercept much lower than those of GMWL and LMWL, and a relatively low coefficient of determination, indicating that the data points are more scattered.

3.1.3. The Relationship Between PRE Isotopes and Meteorological Factors

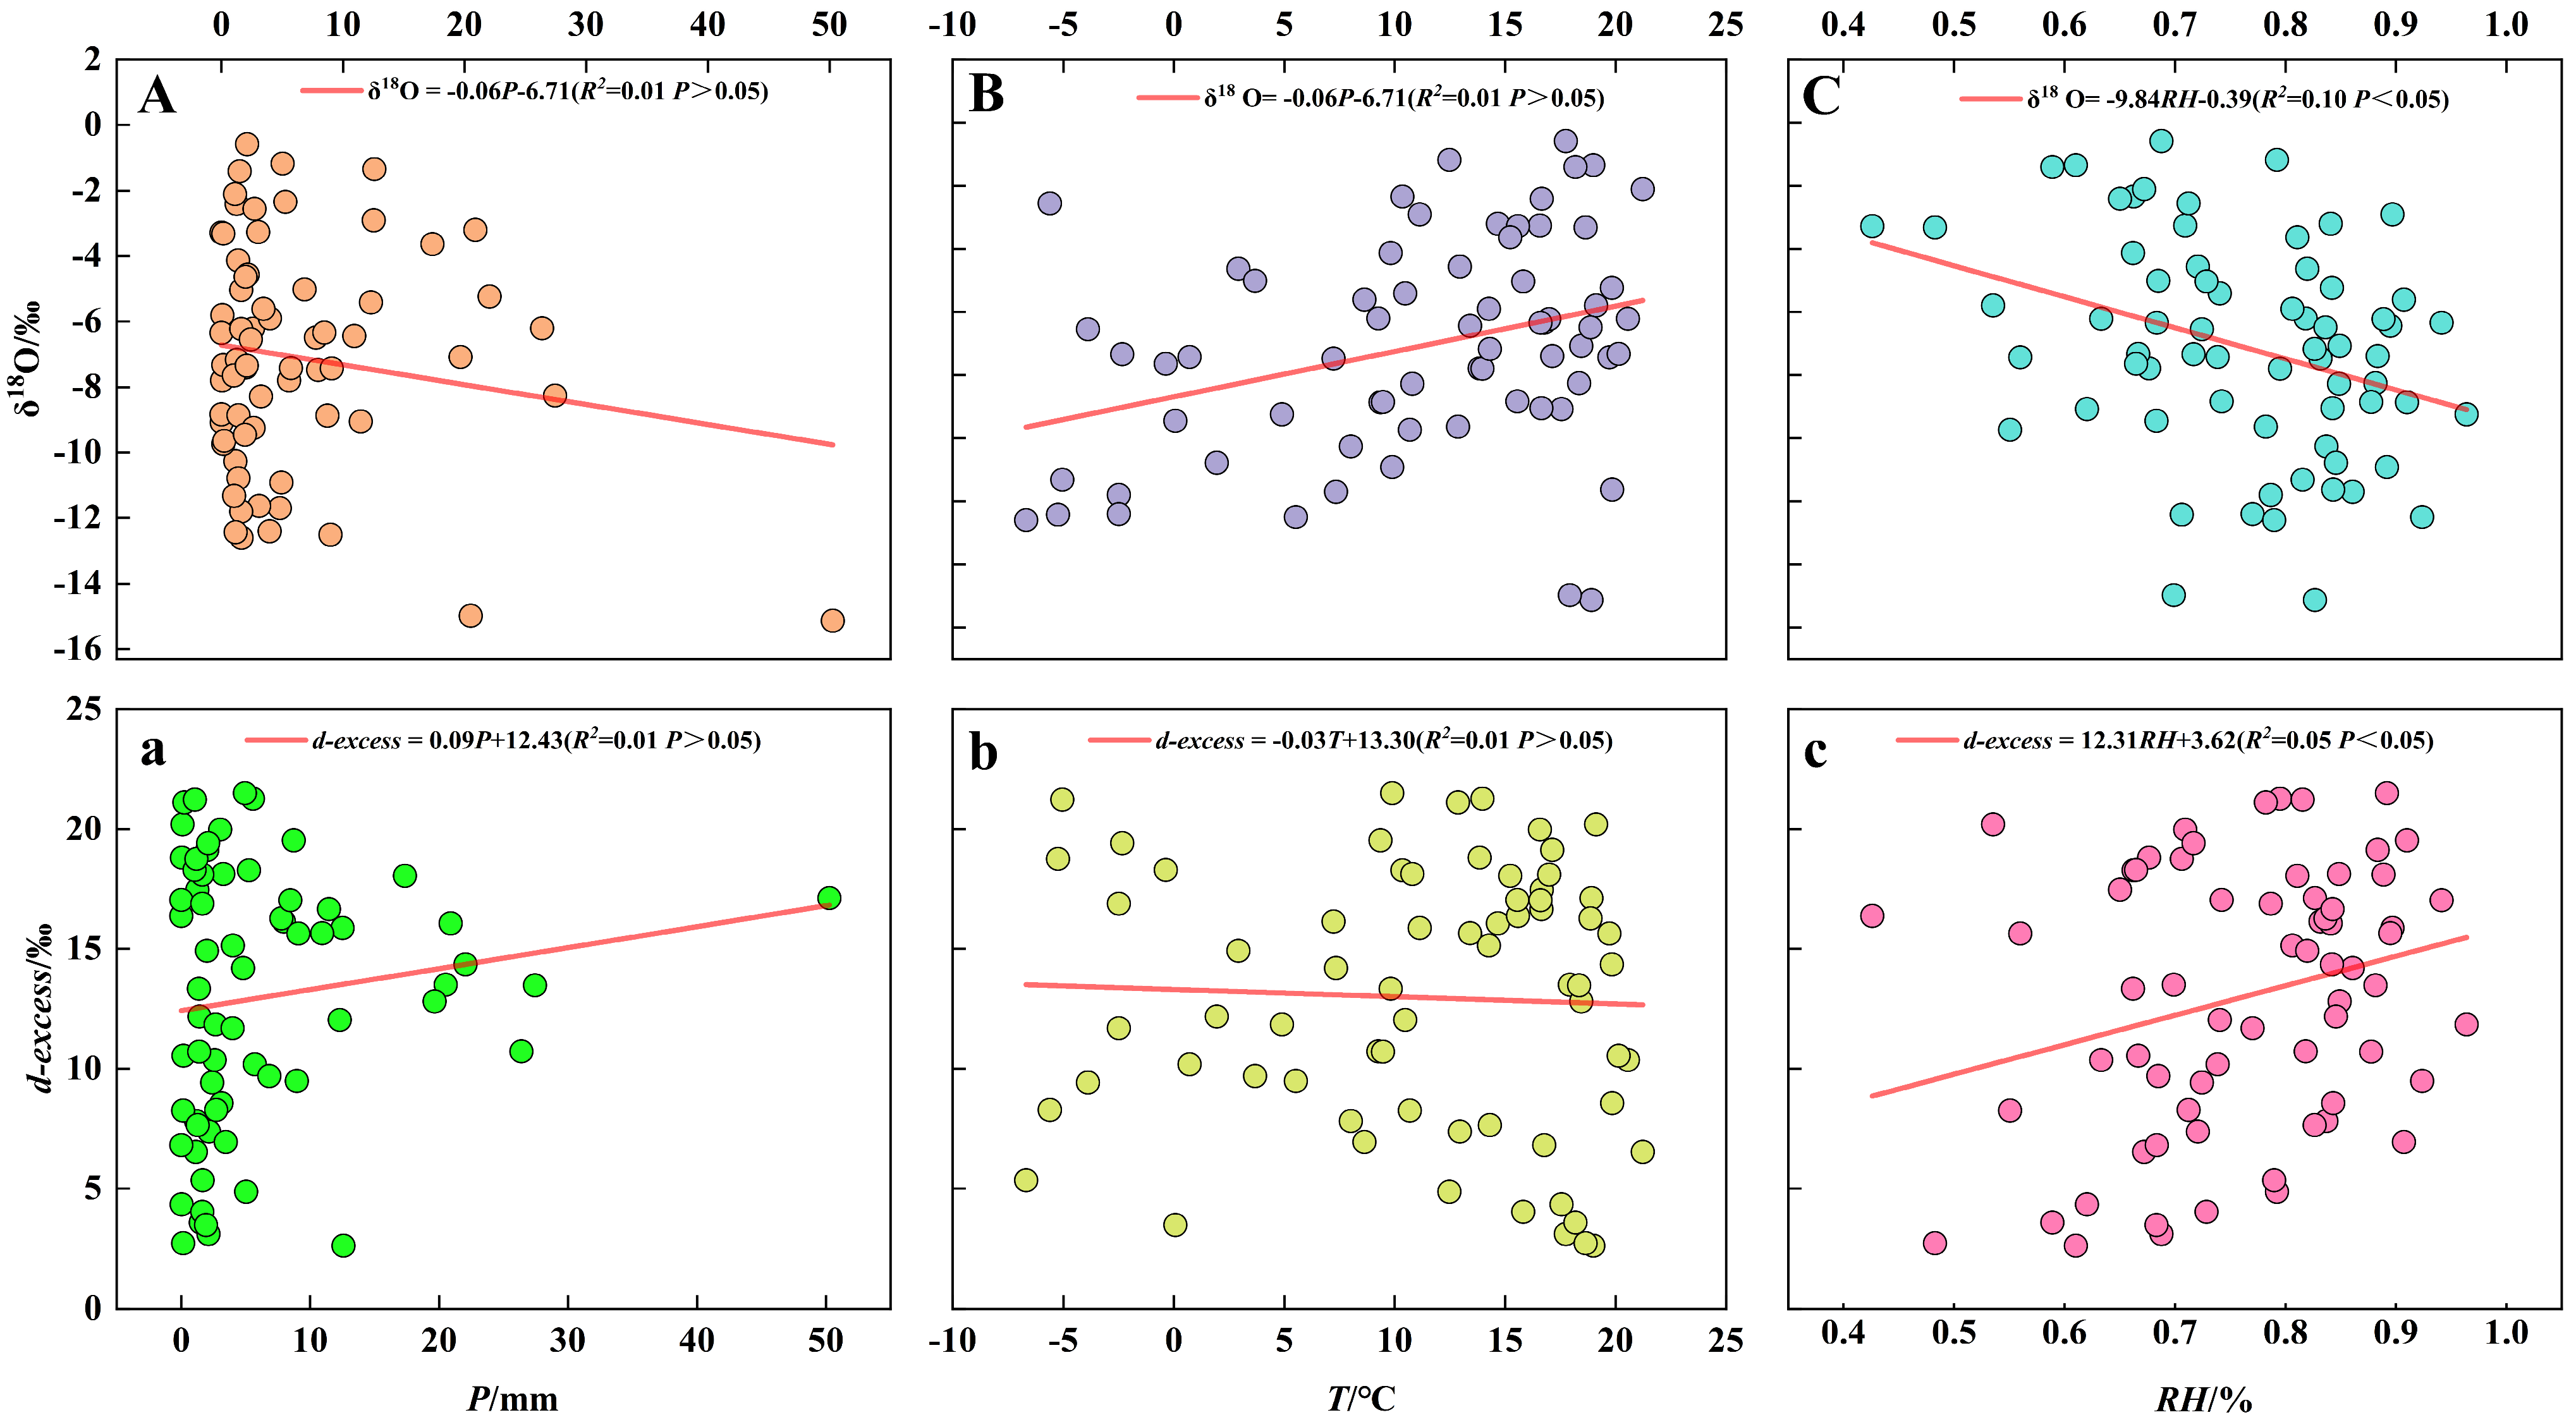
To explore the influence of local meteorological factors on the isotopic composition of precipitation, this study utilized linear regression to analyze the relationships between δ18O and d-excess values and precipitation (P), temperature (T), and relative humidity (RH) in the study area on an annual and seasonal scale (Figure 4). On an annual scale, δ18O showed no significant correlation with P and T (p > 0.05; Figure 4A,B), but was significantly negatively correlated with RH (p < 0.05; Figure 4C). The d-excess values had poor correlations with P and T (p > 0.05, Figure 4a,b), but were positively correlated with RH (p < 0.05, Figure 4c). In summary, on an annual scale, relative humidity (RH) is the main controlling factor for the isotopic composition of precipitation in the study area. On a seasonal scale, δ18O in spring was negatively correlated with T and RH (p < 0.05); in summer, δ18O was significantly negatively correlated with P (p < 0.01), and d-excess values were positively correlated with P (p < 0.05); in autumn, the slopes of the regression equations of δ18O with P, T, and RH were all negative, but the negative correlations were weak and not significant (p > 0.05); in winter, δ18O was correlated with P, T, and RH (p < 0.05, Table 1).

3.1.4. The Relationship Between δ18O and D-Excess Values of Surface Water and Groundwater and Distance

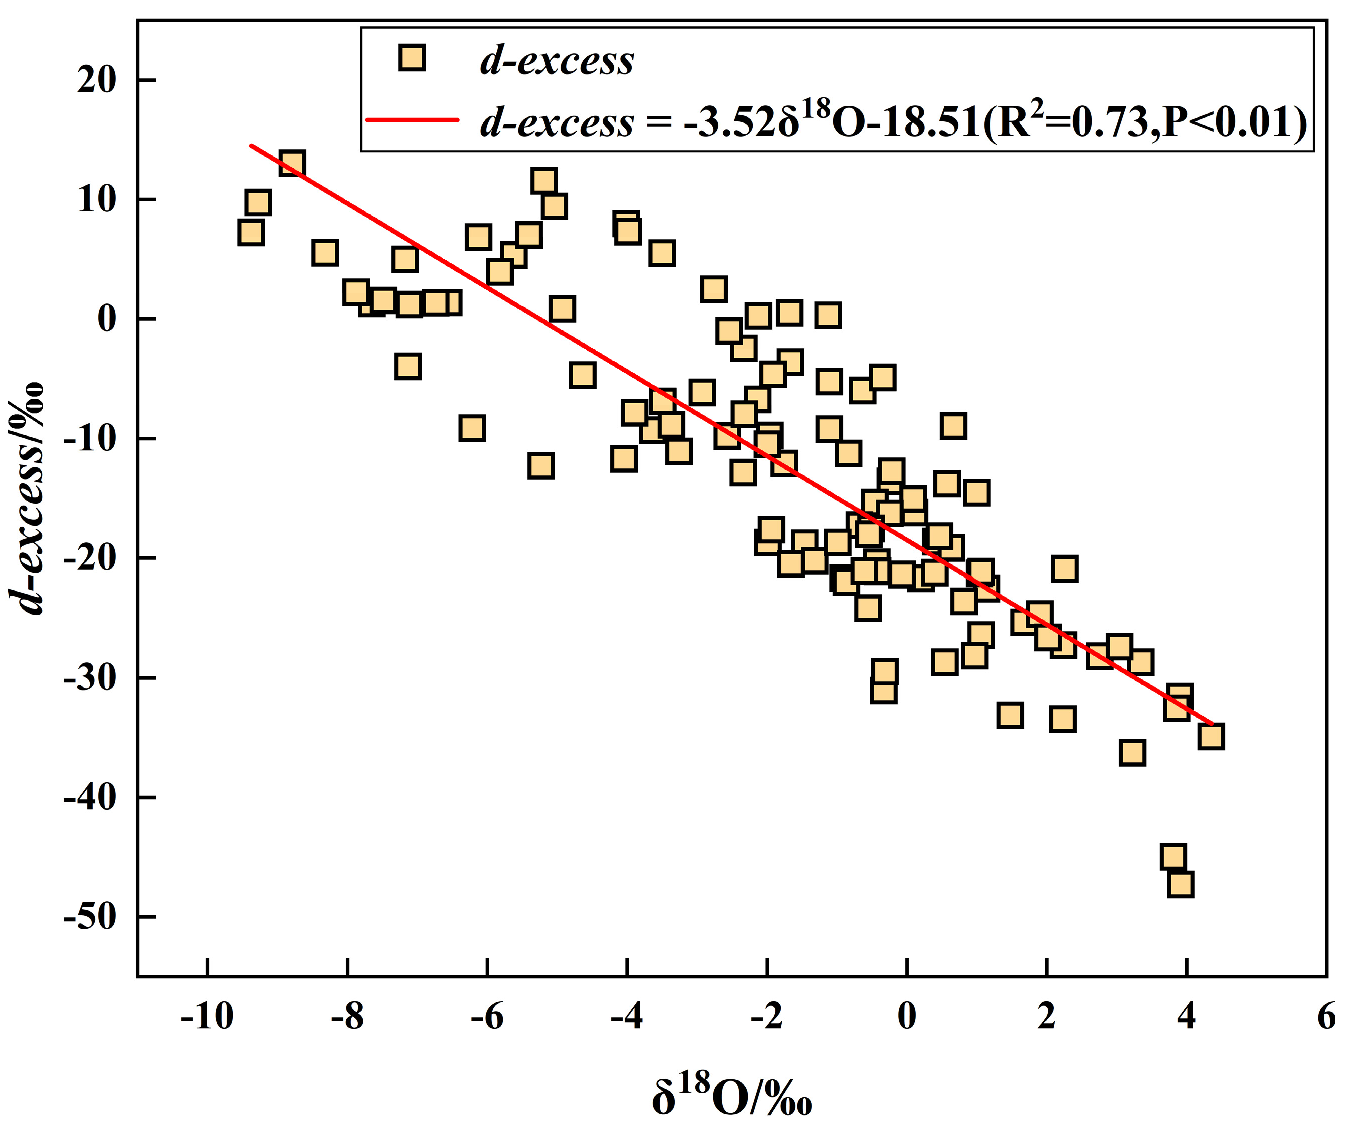
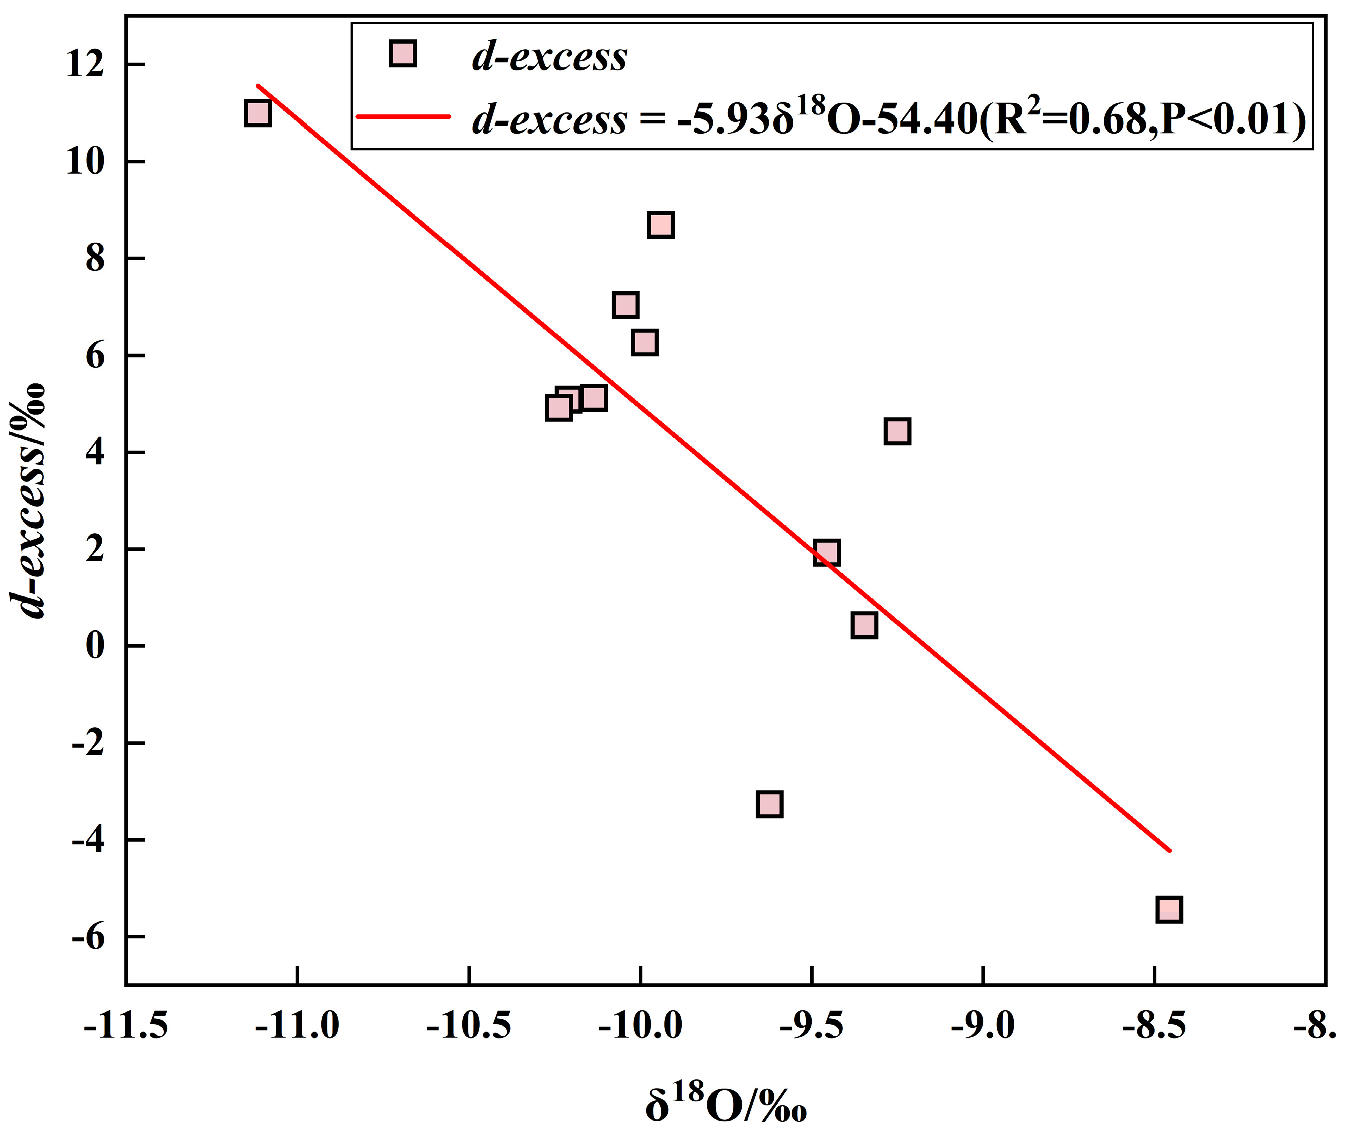
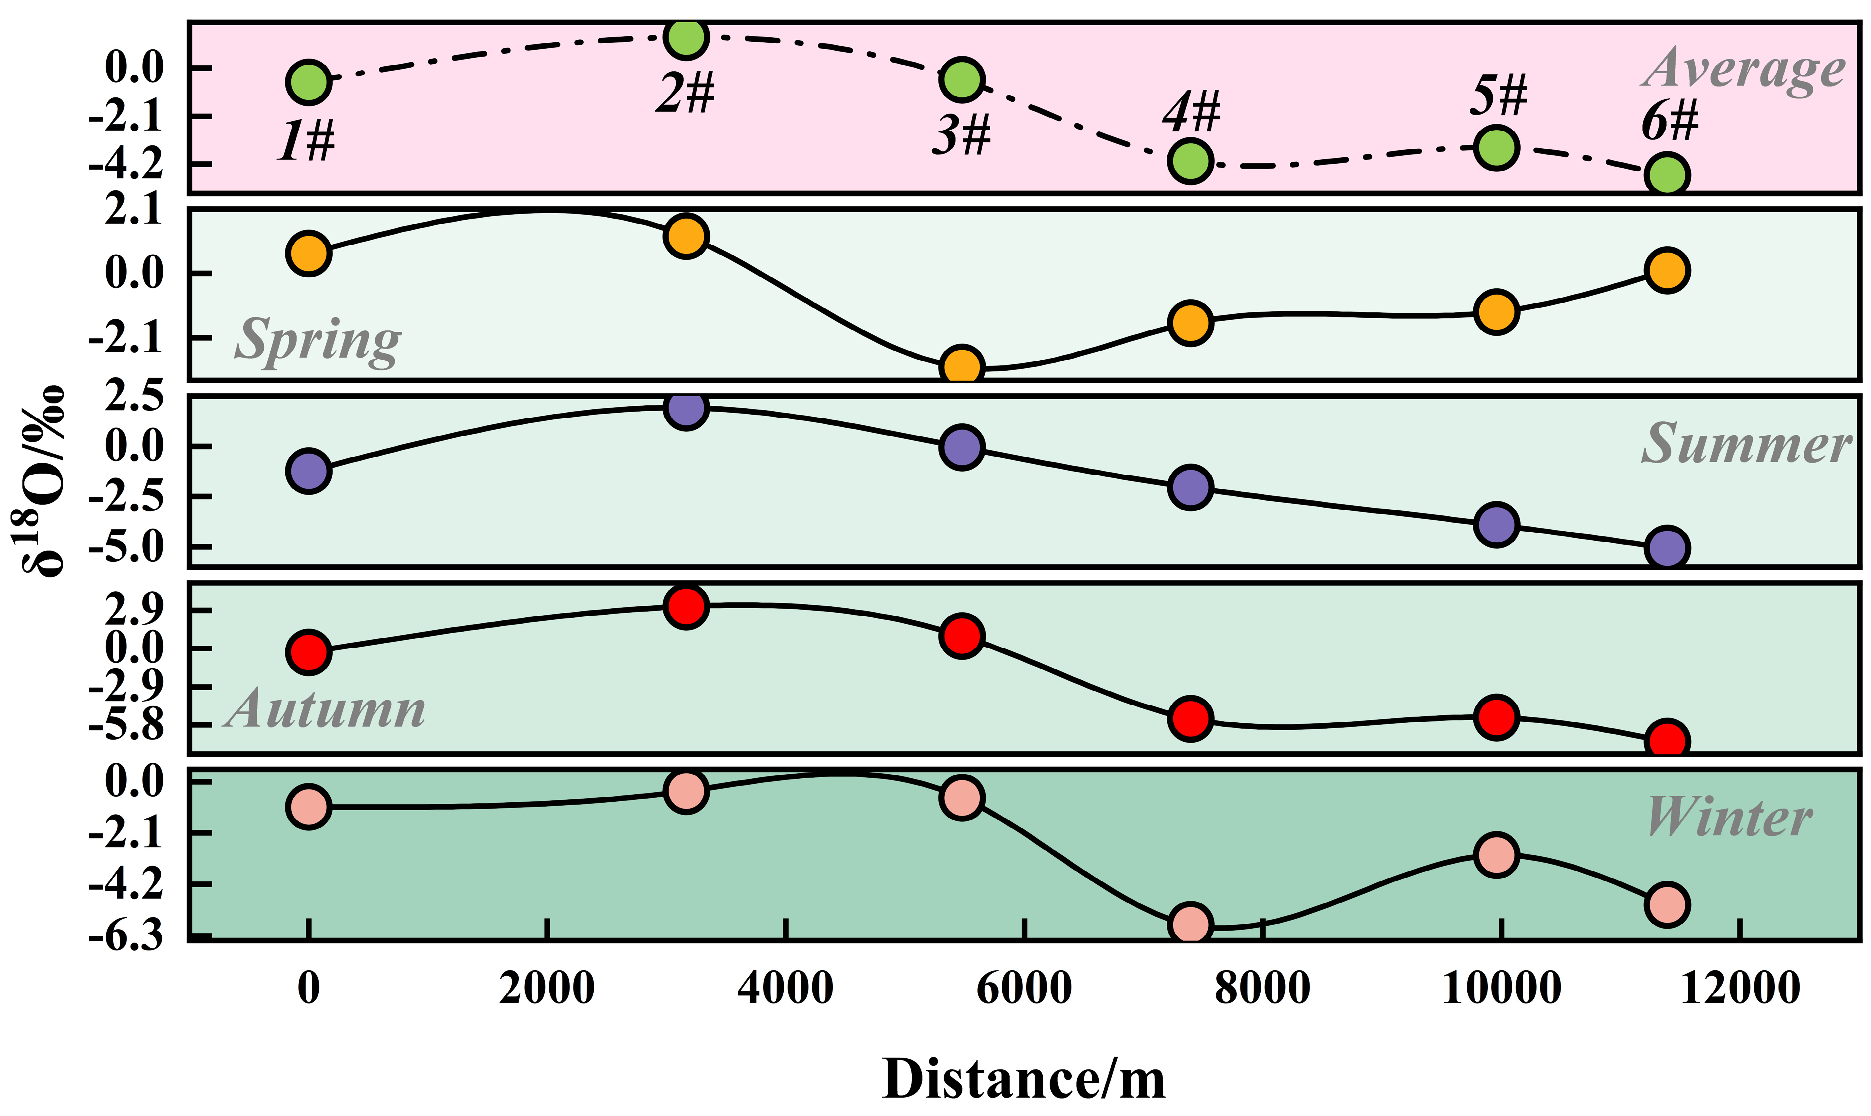
In CDW, the d-excess value shows a significant negative correlation with δ18O (d-excess = −3.52δ18O-18.51, R2 = 0.73, p < 0.01, Figure 5). In UGW, the d-excess value also shows a significant negative correlation with δ18O (d-excess = −5.93δ18O-54.40, R2 = 0.68, p < 0.01, Figure 6). The δ18O value of CDW along the main channel exhibits a fluctuation pattern of “increase, decrease, and then increase” throughout the year (Figure 7). This pattern exists in spring, autumn, and winter, while in summer it shows a pattern of “increase and then decrease”. Generally speaking, the heavy isotopes in the downstream CDW are more enriched than those in the upstream, and the two check dams at 2# and 4# are the key nodes for this trend change.

3.2. Different Water Replenishment Ratios

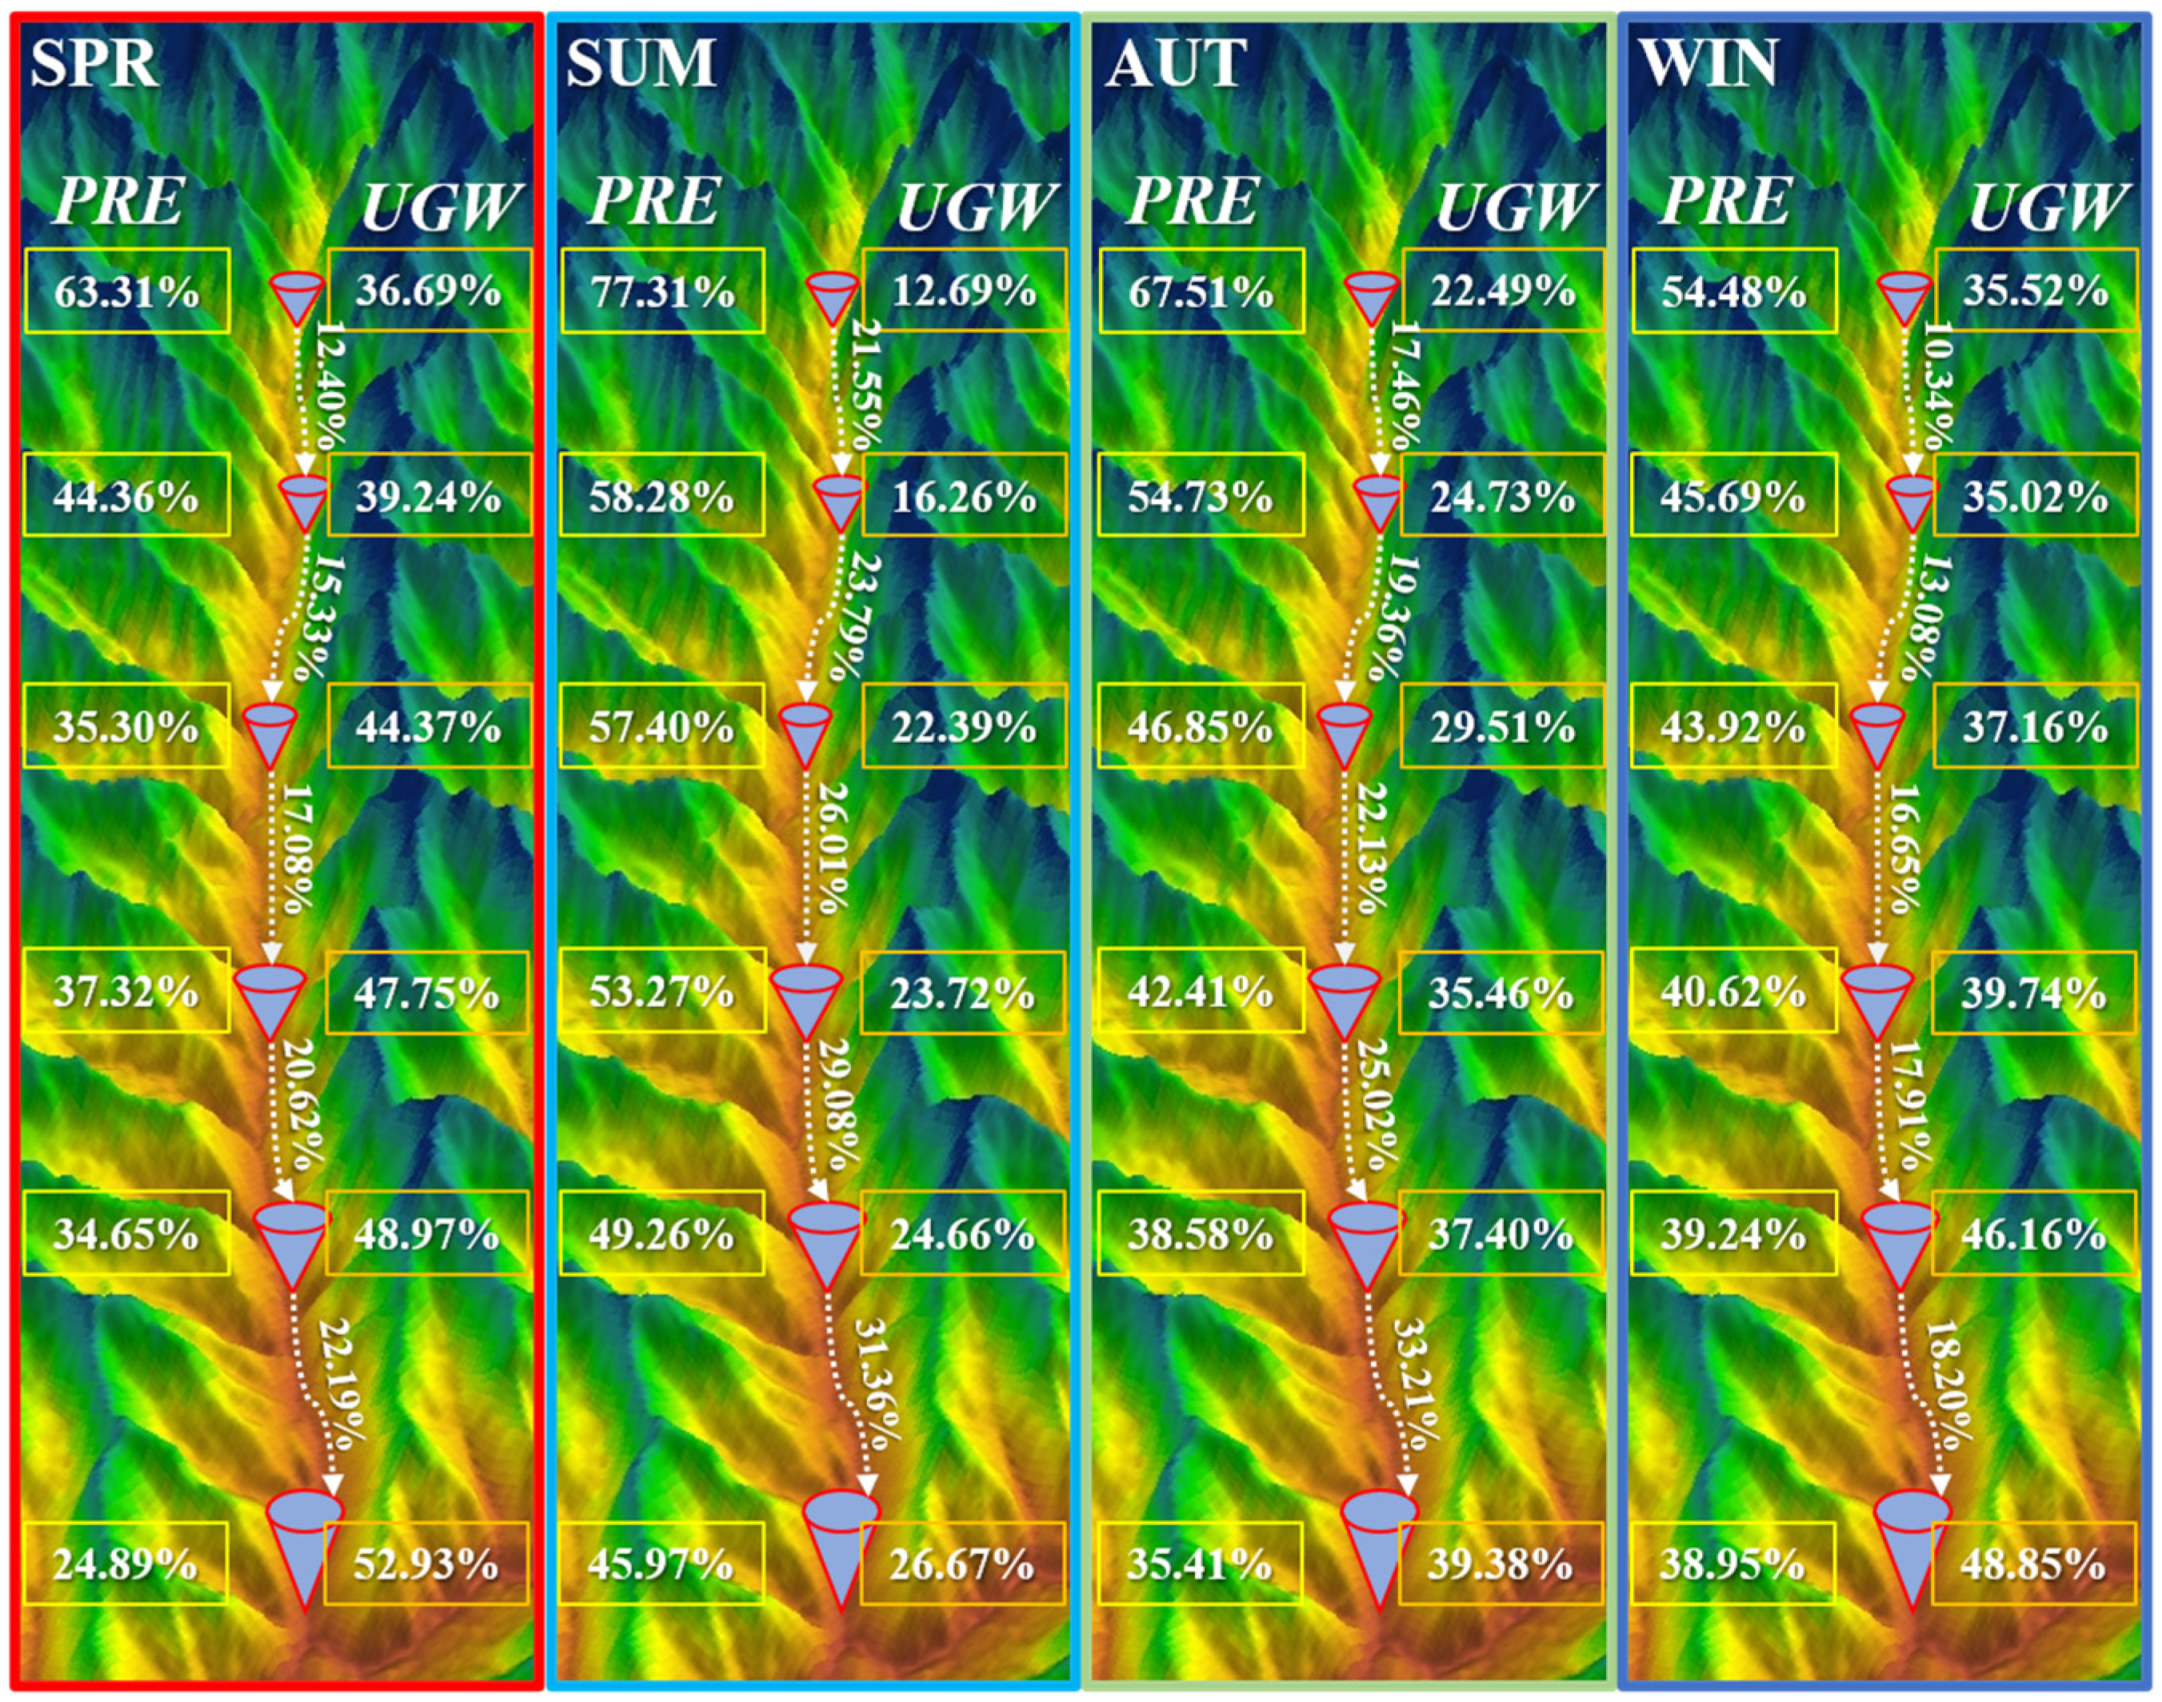
The recharge sources of the main channel check dam CDW exhibit distinct seasonal characteristics and elevation effects(Figure 8). The average proportions of recharge from PRE, UGW, and CDW along the course are 47.07%, 34.48%, and 20.64%, respectively. This indicates that the main channel check dam CDW mainly relies on the direct recharge from PRE, while the contribution of water exchange along the course from upstream (Dam 1#) to downstream (Dam 6#) is relatively limited. From the perspective of seasonal dynamics, the average recharge proportion of PRE reaches its peak in summer (56.92%) and drops to its lowest in winter (43.82%), with spring and autumn falling in between. The recharge proportion of UGW shows an opposite seasonal pattern, being highest in spring (44.94%) and lowest in summer (21.07%). The recharge proportion of CDW along the course is most significant in summer (26.36%) and lowest in winter (15.24%).
The spatial distribution of the proportion of recharge is controlled by the location and height difference of the dam. The 1# dam, located at the highest point of the watershed, has the highest proportion of CDW recharge from PRE in all seasons, and correspondingly, the proportion of recharge from UGW is the lowest. The 4# dam, located in the middle of the watershed, has a large height difference with the upstream dam and becomes a turning point in the hydrological process. The proportion of CDW recharge along the way increases after this point. The 6# dam, located at the lowest point of the watershed, has the lowest proportion of recharge from PRE, while the proportion of recharge from UGW and upstream CDW is the highest. The comparative analysis of the tributary gullies further reveals the regulating role of the check dams (Table 2). In the tributary gully G, the CDW of the G1 and G2 dams in G is mainly recharged by PRE and UGW, and the average transmission proportions to the downstream (G2 dam and the main channel 1# dam) are 10.01% and 12.77%, respectively. As a contrast, the tributary gully X without dams has an average transmission proportion to the main channel 2# dam as high as 19.53%. Although the proportions of recharge from PRE and UGW in the two tributary gullies are similar, the average transmission proportion from the tributary gully G with dams to the main channel is 6.76% lower than that from the tributary gully X without dams, and the difference is particularly significant in summer and autumn (10.61% and 8.17% lower, respectively).

3.3. Calculation of Different Water Transmission Times

The average overall turnover time of PRE and CDW in the Niejia River Basin is 137.9 d, and that of UGW and CDW is 703.9 d. The turnover time of CDW and PRE in the main channel of the basin at the 1# check dam is the longest, which is 206 d, while that in the tributary X is the shortest, being 106 d. The turnover time of CDW and UGW at the 1# check dam is the shortest in the basin, which is 603 d, while that at the 5# check dam is the longest in the entire basin, lasting 1001 d (Table 3).
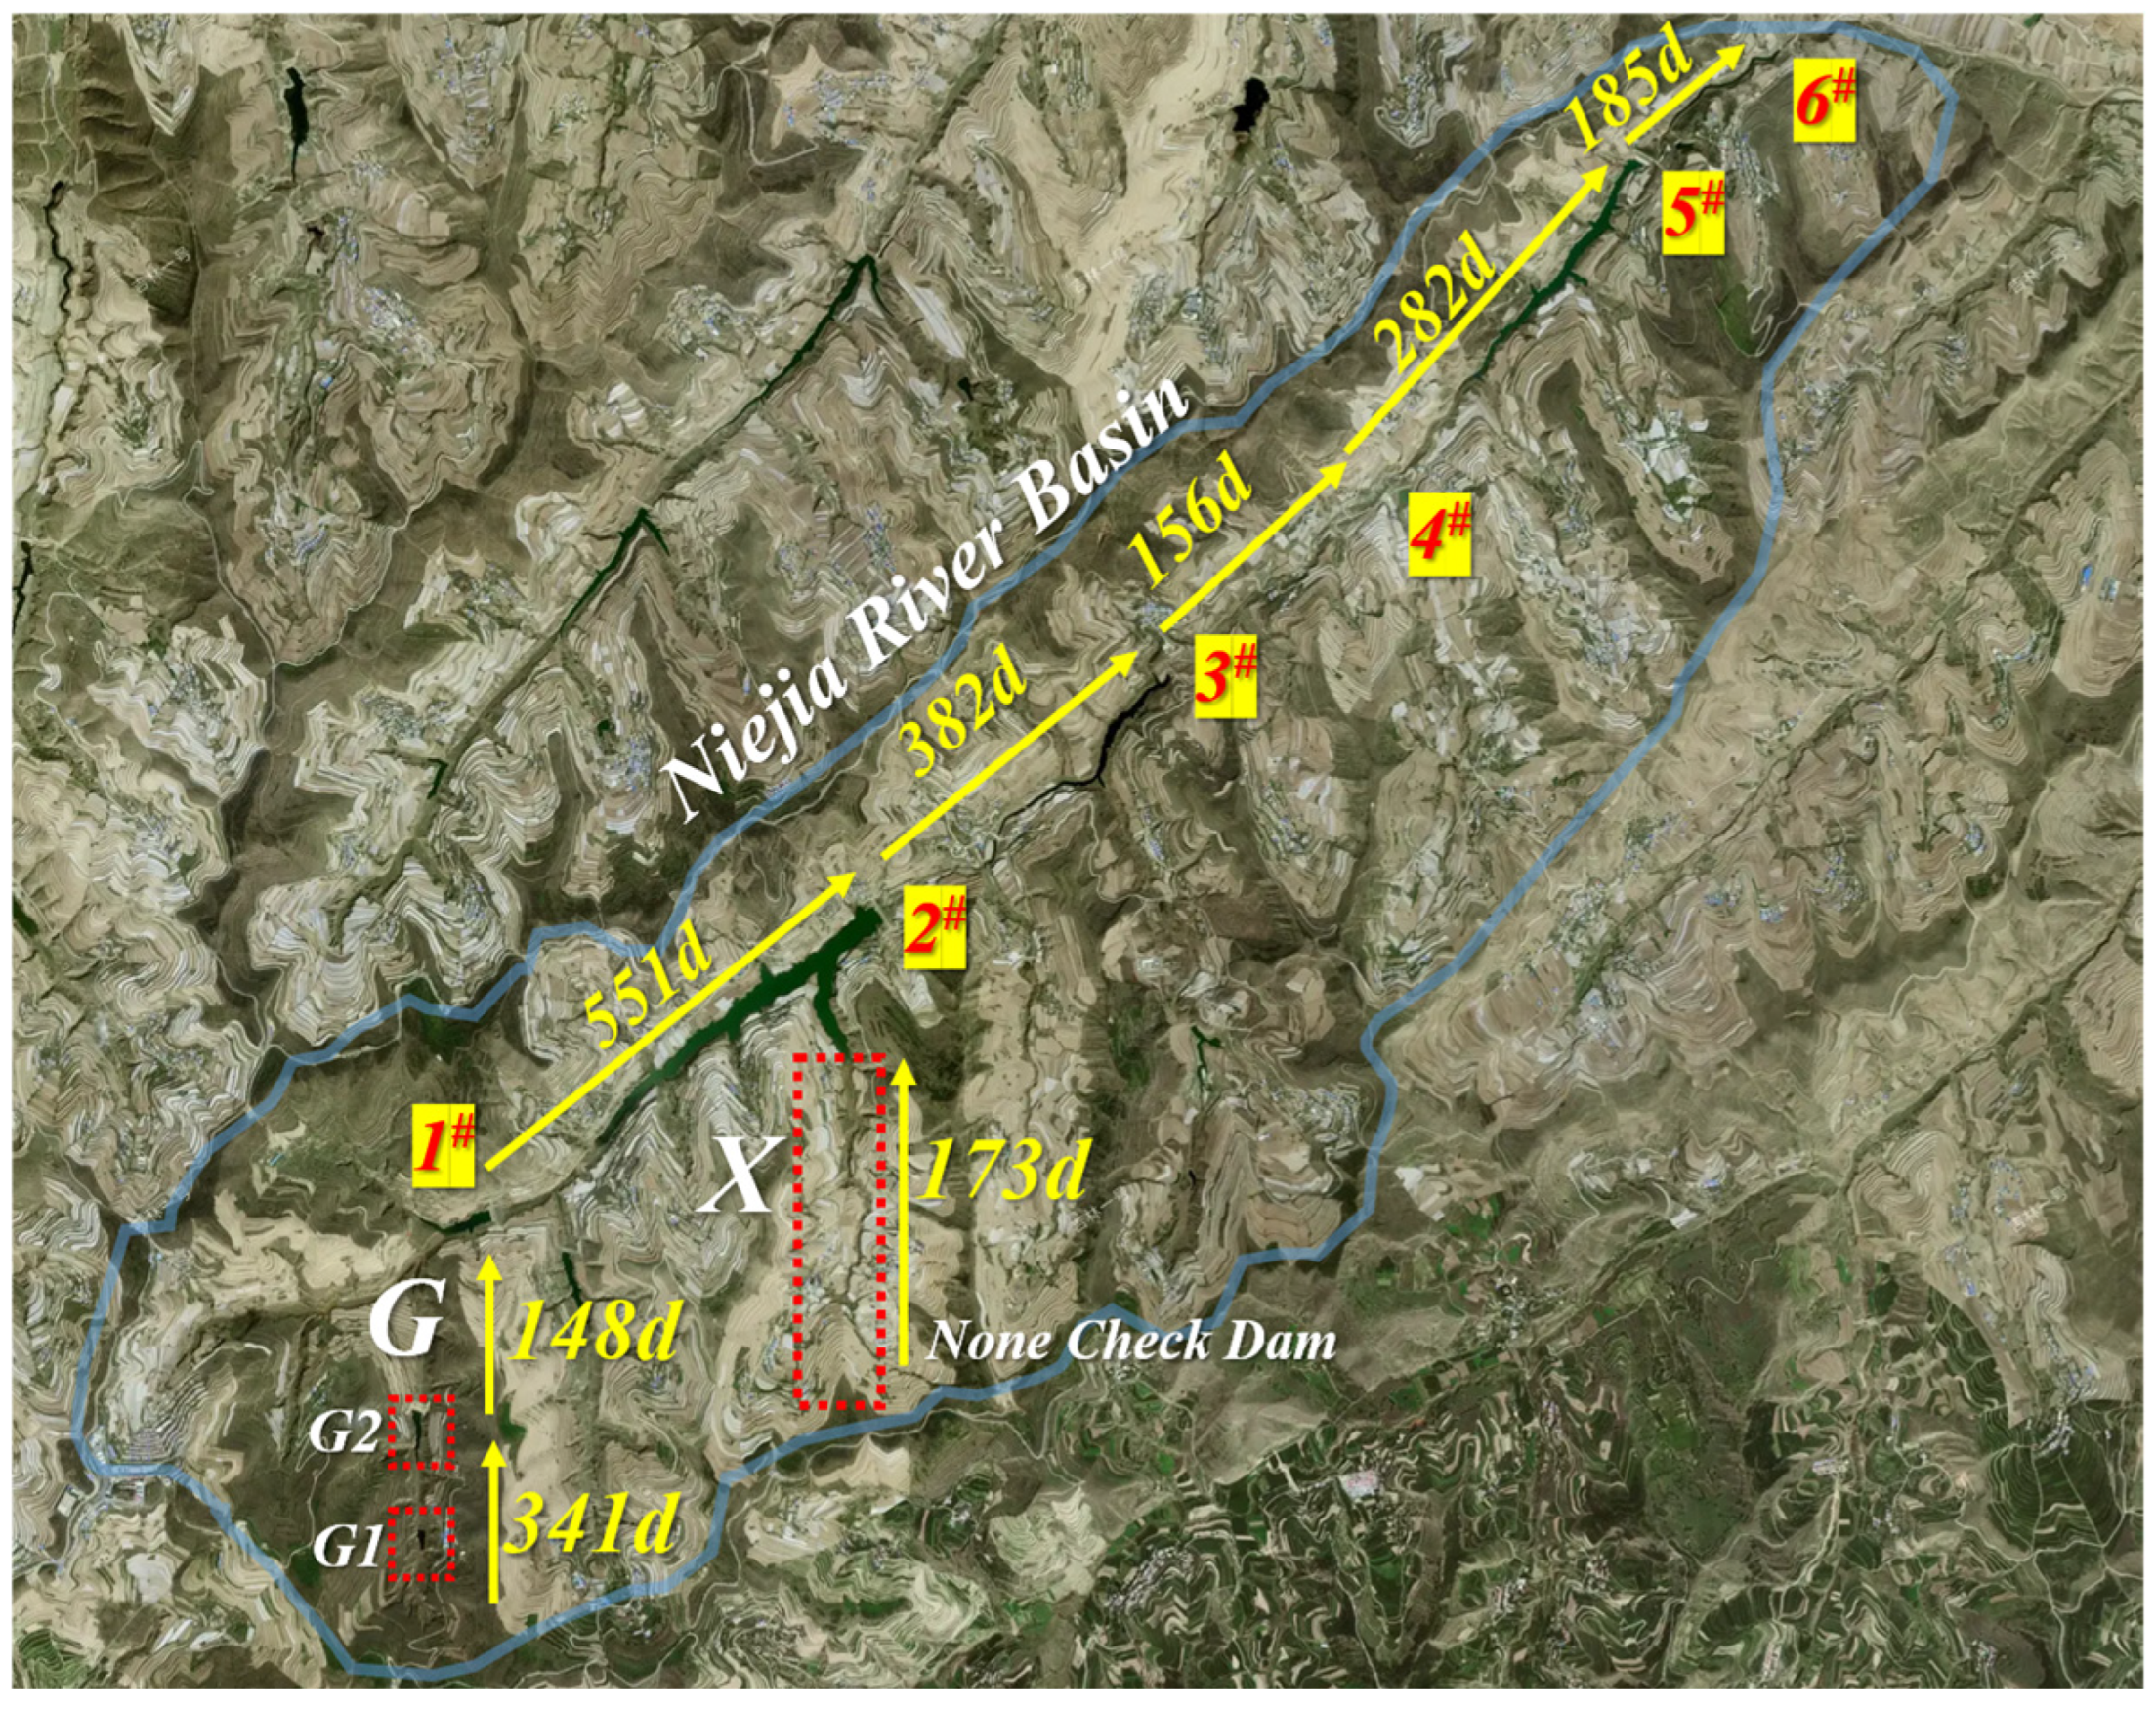
The complete transmission time of CDW between check dams shows significant spatial heterogeneity (Figure 9). In the main channel, the transmission time from 1# to 2# is the longest (551 d), while that from 3# to 4# is the shortest (156 d). More importantly, in the dammed tributary G, the overall complete transmission time of CDW from Dam G1 through Dam G2 to the main channel is 489 d; in sharp contrast, the transmission time of CDW from the undammed tributary X to the main channel only takes 173 d.

4. Discussion

The originality of this work lies not in the development of new isotopic methods but in their systematic integration to quantify the cascading effects of check dams on hydrological processes at both seasonal and spatial scales. This integrated approach offers a replicable framework for assessing the impact of soil-water conservation structures in data-scarce regions.
The average values of hydrogen and oxygen isotopes (δD = −42.8‰, δ18O = −7.07‰) in the Niejia River Basin are higher than the background average values of atmospheric precipitation in China (δD = =−54.82‰, δ18O = −7.95‰). This result is similar to the isotopic characteristics of precipitation in Guyuan City (δD = −56.17‰, δ18O = −8.60‰) as reported by Zhang et al. This positive deviation is consistent with the climatic characteristics of small watersheds in the southern part of Ningxia, indicating that the precipitation has undergone more intense evaporation enrichment and local water vapor recycling during its descent [18,19]. The seasonal enrichment of δD and δ18O in warm seasons (e.g., summer averages: δD = 37.86‰, δ18O = 6.20‰) and depletion in cold seasons (e.g., winter averages: δD = 70.60‰, δ18O = 10.49‰) result from the interplay of temperature-driven evaporation and precipitation amount effects. High temperatures in summer enhance evaporation, favoring the escape of lighter isotopes (H and 16O) and thus enriching the remaining precipitation in D and 18O. Conversely, low temperatures in winter suppress evaporation, leading to isotopic depletion. Simultaneously, precipitation amount plays a dilutive role: high summer rainfall (e.g., 2024 cumulative precipitation of 418.10 mm) dilutes isotopic concentrations, as evidenced by the significant negative correlation between δ18O and precipitation in summer (P = −0.55, p < 0.01; Table 1). In winter, low precipitation amounts and dominant snow/freezing rain forms minimize dilution, while the positive correlation between δ18O and temperature (P = 0.70, p < 0.05) underscores the dominance of thermal control on evaporation. This synergy is visually confirmed by the seasonal trajectories in Figure 2, where PRE isotopes shift from enriched to depleted states across seasons. This positive deviation is consistent with the climatic characteristics of small watersheds in the mountainous area of southern Ningxia, indicating that the precipitation has undergone more intense evaporation enrichment and local water vapor recycling during its descent [20]. The δD and δ18O of PRE show the characteristics of enrichment in warm seasons and depletion in cold seasons, mainly controlled by the combined effects of temperature and precipitation. The d-excess values exhibit an opposite seasonal pattern of “low in warm seasons and high in cold seasons”, which reveals the seasonal transformation of water vapor sources: precipitation in cold seasons mainly originates from the inland westerly belt water vapor, with higher d-excess values, while precipitation in warm seasons is influenced by the marine water vapor from the southeast monsoon that has undergone intense evaporation and terrain uplift, resulting in lower d-excess values [21]. This difference clearly indicates that the precipitation in the study area is controlled by different water vapor sources and formation conditions in different seasons and with different properties.
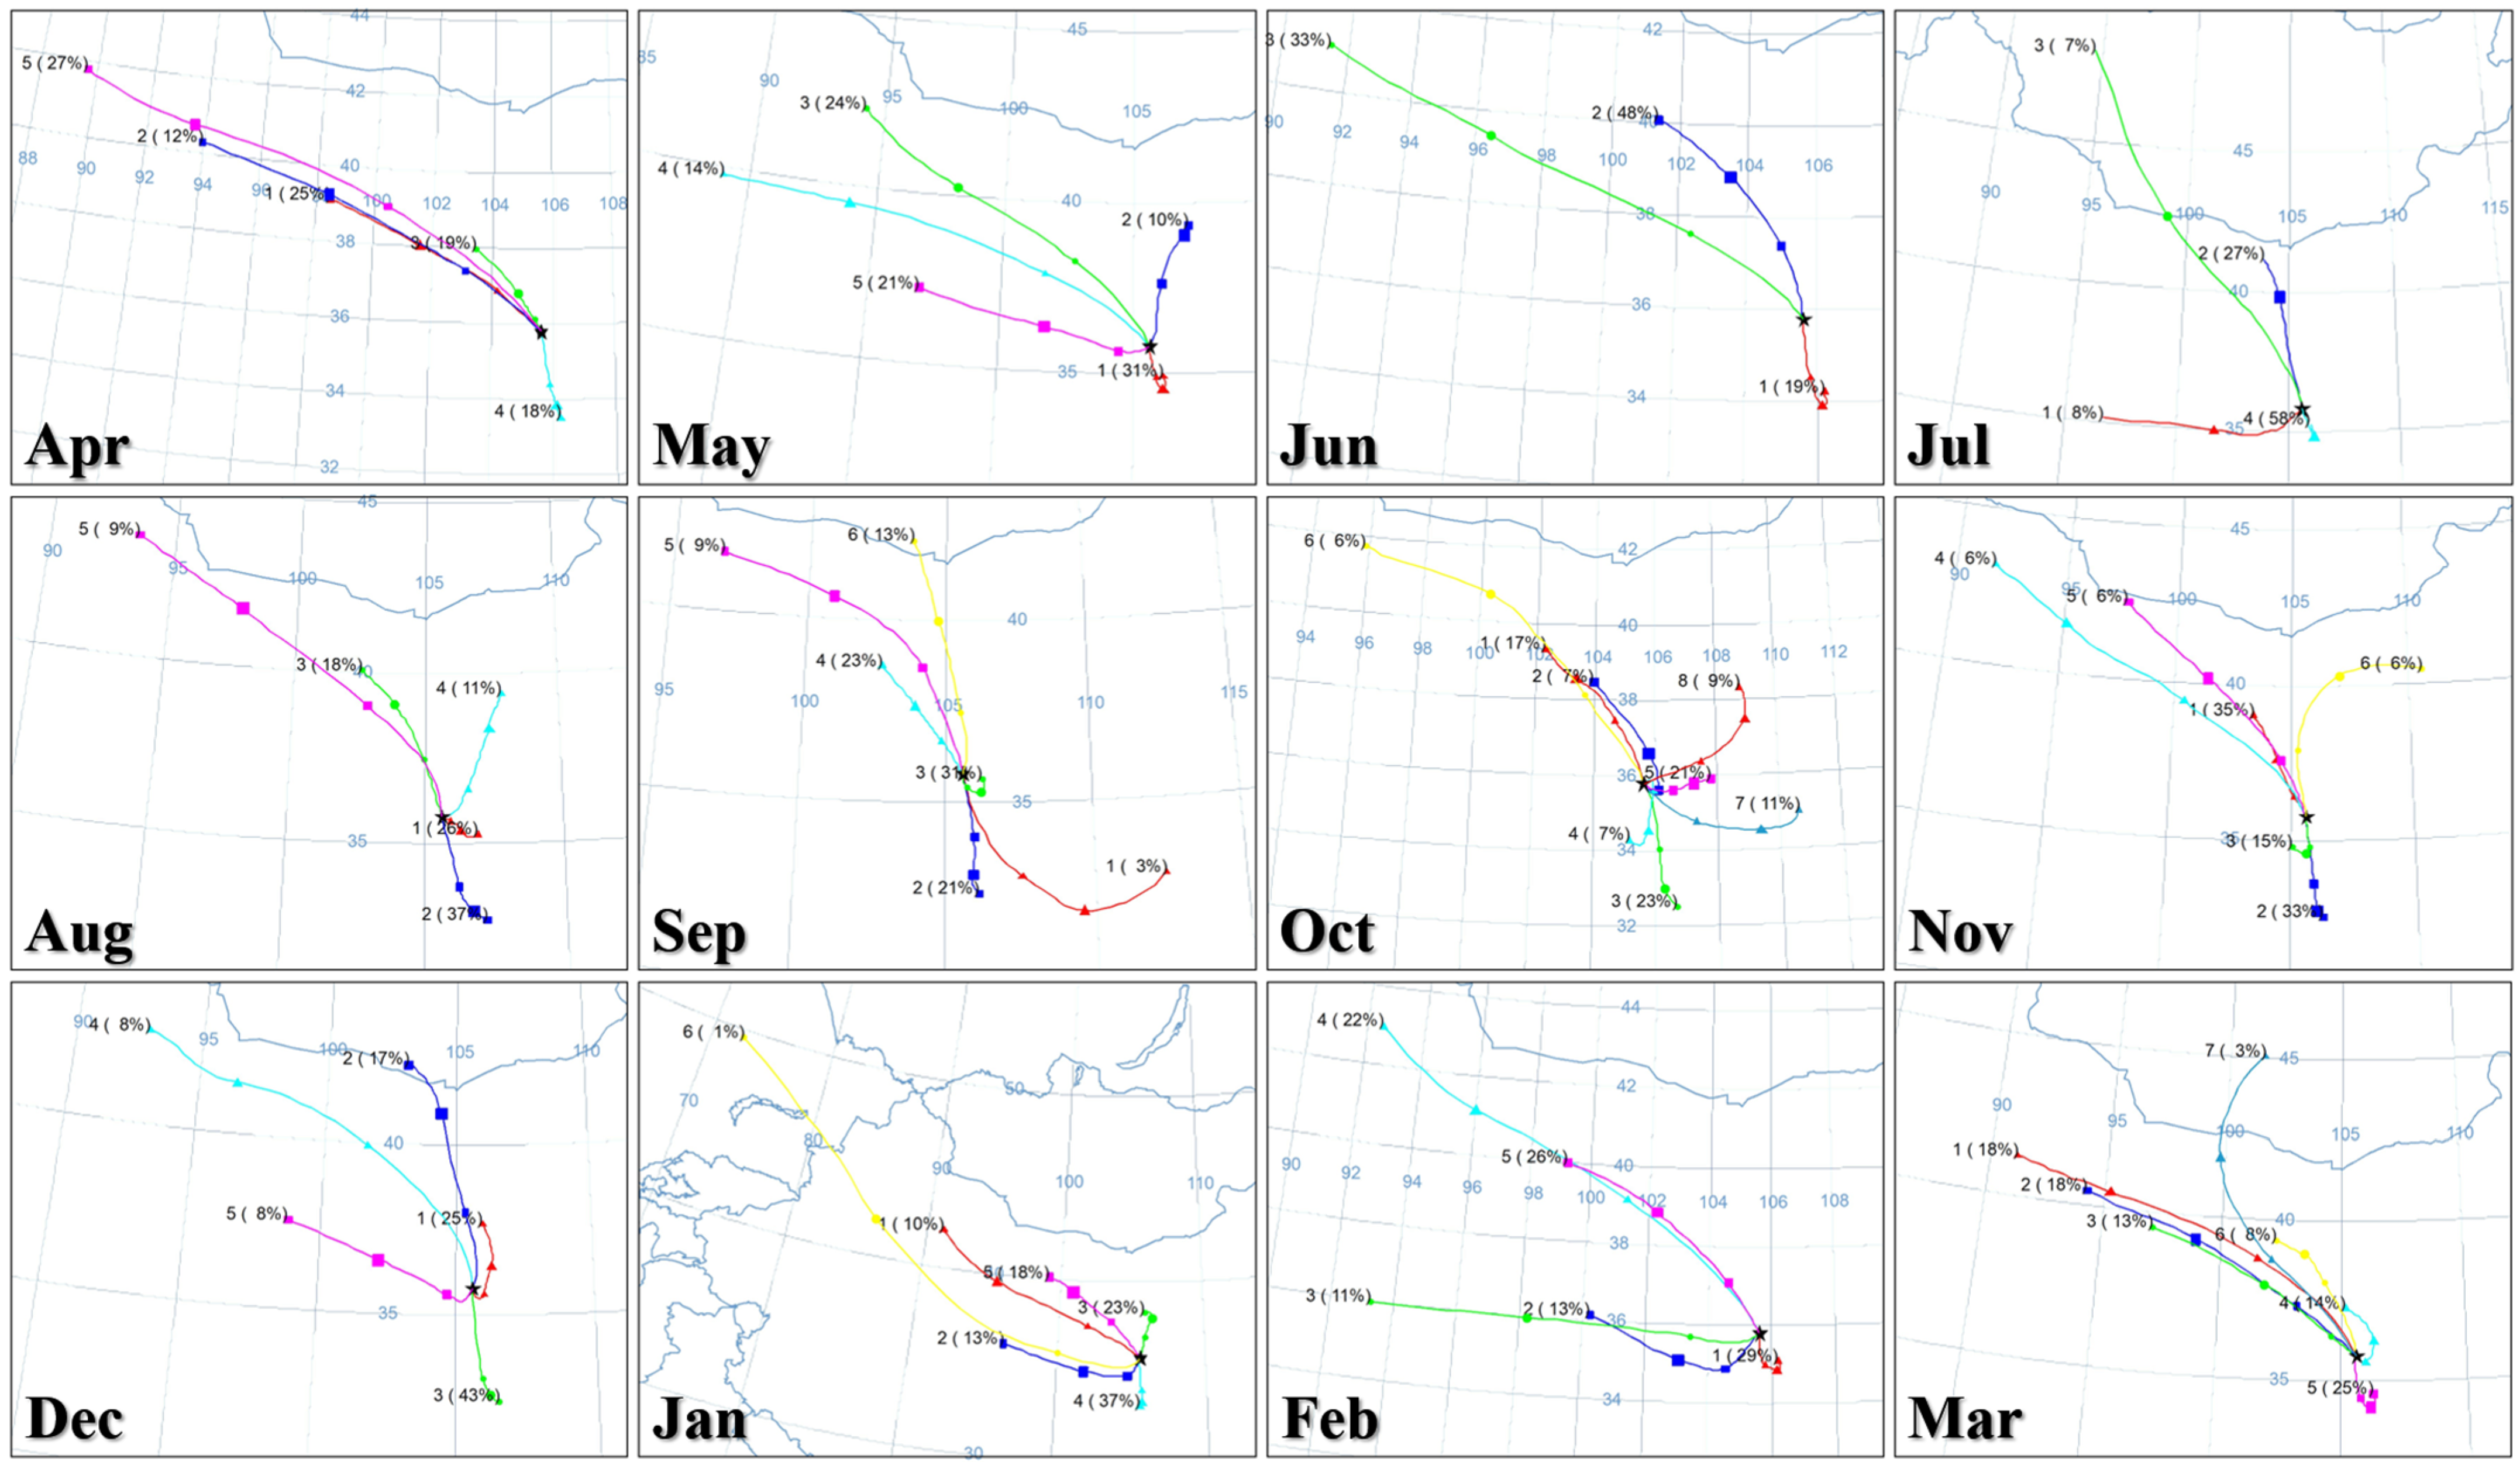
The LMWL is located above and to the left of the GMWL, with a slope slightly smaller than that of the global atmospheric precipitation line, indicating that the atmospheric precipitation has been strongly affected by evaporation during its descent, which is consistent with the typical characteristics of an inland arid climate. The intercept of the LMWL is 10.39‰, while that of the GMWL is 10‰. The high intercept suggests that the local water vapor cycle dominated by evaporation in the basin has a significant contribution to atmospheric precipitation. Using the HYSPLIT backward trajectory model is an effective way to verify the water vapor source through climate simulation (Figure 10). Through the simulation of water vapor trajectories, it was found that the water vapor sources in the study area have obvious seasonal characteristics, mainly relying on local small-scale climate water vapor circulation and water vapor transport from the westerlies. In spring, the study area’s water vapor becomes less dependent on local small-scale climate circulation, and water vapor from the westerlies and the Arctic Ocean with depleted isotopes is transported. In summer, due to the input of the southeast monsoon, water vapor with relatively enriched isotopes is brought into the study area and condensed into precipitation. In autumn, the dependence on local small-scale climate circulation for water vapor sources increases; in winter, the role of water vapor transport from the westerlies strengthens. Yuan et al. This study also pointed out that the weakening of the westerlies in spring is the main cause of reduced precipitation, indirectly supporting the seasonal switching of water vapor sources [22].
D-excess is a sensitive indicator of the degree of evaporation experienced by water bodies, with lower values typically indicating more intense evaporation [23]. Notably, the d-excess of CDW in the study area was negative throughout all seasons, profoundly revealing that the water in the check dams is under continuous and intense evaporation stress. Its seasonal dynamics showed the lowest value in spring (−16.64‰) and the highest in winter (−8.27‰), with intermediate values in summer and autumn. This pattern is the result of the combined effects of meteorological conditions and water supply sources: in spring, the rising temperature, low humidity, and strong sunlight create a high potential evaporation capacity, and the low precipitation and the supply of isotopically poor water from the westerly wind belt lead to the most intense fractionation of CDW, causing the d-excess to reach its lowest point. In contrast, in winter, the low temperature significantly suppresses evaporation, and the proportion of groundwater supply (with a relatively higher d-excess; see Table 1) increases (40.41%; see Section 3.2), the combined effect of which enriches the d-excess of CDW relatively. Sreedevi et al. also found significant seasonal variations in the d-excess of groundwater in the Badain Jaran Desert: the lowest in spring/early summer and the highest in winter, with intermediate values in summer and autumn [24]. The slope (4.43) and intercept (−18.46) of the surface water line (CDWL) are significantly lower than those of the GMWL and LMWL, indicating that the CDW in the check dams has undergone extremely intense evaporation fractionation. The significant negative correlation between δ18O and d-excess in the CDW samples (Figure 5) further validates that evaporation is the key process controlling the isotopic composition of CDW. Under ideal conditions, if only controlled by evaporation, the δ18O of CDW should continuously enrich along the flow direction. However, the δ18O values of CDW along the main channel in this study showed a fluctuating pattern of “first increase, then decrease, and then increase” (Figure 7). This abnormal phenomenon reveals that the hydrological processes in the basin are far more complex than simple evaporation. In the background of intense evaporation, there are also the mixing effects of water from different sources along the way (such as inflow from tributaries and groundwater discharge), as well as frequent interactions between surface water and groundwater (UGW-CDW), which interfere with and reshape the isotopic evolution path dominated by evaporation [25]. Therefore, the isotopic signals of water in the check dam sequence are actually a comprehensive manifestation of multiple hydrological processes such as evaporation, mixing, and water exchange.
Compared with the dynamic CDW, groundwater (UGW) is generally regarded as “old water” with a longer circulation period and a more delayed response to short-term meteorological events. However, this study observed that the hydrogen and oxygen isotopes of UGW still exhibited significant seasonal variations: the most enriched in spring, gradually depleted in summer and autumn, and reaching the most depleted state in winter. This phenomenon reveals that there is an active and seasonal hydraulic connection between the shallow groundwater system and the surface environment in the study area. The isotopic enrichment in spring can be attributed to the increase in temperature at the end of spring and the beginning of summer, which enhances the evaporation in the vadose zone, resulting in the water vapor source for groundwater recharge being already relatively enriched; at the same time, the preferential infiltration of snowmelt or a small amount of spring precipitation (with relatively enriched isotopic values, see Section 3.1.1) may also be a contributing factor. In summer and autumn, although precipitation is abundant, its isotopic values fluctuate greatly within the season and are generally more depleted than in spring and winter. This more depleted precipitation, after a lagged infiltration, gradually dominates the composition of UGW. In winter, the recharge effect of low-temperature precipitation (with the most depleted isotopic values) eventually manifests, causing the isotopic values of UGW to reach the lowest point of the year. The seasonal variations in the d-excess of UGW (high in spring, low in summer and autumn, and moderate in winter) further confirm the key role of evaporation in regulating its isotopic composition. The high d-excess in spring may reflect the characteristics of residual water after intense evaporation, while the low d-excess in summer and autumn is related to the recharge of precipitation with low d-excess characteristics that infiltrated during the intense evaporation season. The findings of Zhao et al. [26] in a subtropical basin are similar to this pattern, confirming that even in different climatic zones, the seasonal alternation of evaporation and recharge sources is a fundamental driving force controlling the isotopic composition of groundwater. There is a significant negative correlation between the d-excess and δ18O of UGW (Figure 6), which is highly consistent with the isotope kinetic fractionation theory during the evaporation process in closed water bodies. The evaporation experiment conducted by Wu et al. [27] in the Badain Jaran Desert revealed the exact same pattern (d-excess = −3.4δ18O-30.3, R2 = 0.974). These two studies mutually confirm that the shallow groundwater system in the Niejia River Basin, despite its slow circulation, still undergoes significant chemical evolution dominated by evaporation. This highlights that in arid and semi-arid regions, evaporation is not only a crucial water quantity control factor for surface water but also for shallow groundwater.
Through the analysis of the meteorological conditions and the seasonal characteristics of the PRE isotopes in the study area, the replenishment patterns of different water bodies within the basin are in line with the local microclimate features. Specifically, in spring, the amount of P is relatively low, while T rises and the water level of UGW increases, resulting in a significantly lower proportion of PRE replenishment compared to UGW replenishment. At the same time, the ice on the CDW of the check dams begins to melt and flow downstream to replenish. In summer, due to the southeast monsoon transporting a large amount of P into the study area, along with the gradually increasing T, the microclimate water vapor cycle in the study area is strengthened, causing the proportion of PRE replenishment to reach the highest level of the year. As PRE increases, the water level of the CDW of the check dams rises, and the proportion of CDW replenishment along the course increases, with its average level being the highest throughout the year. The proportion of UGW replenishment decreases. The high replenishment of CDW by PRE in summer is due to the rapid convergence of high-intensity precipitation through surface runoff into CDW, and at the same time, high temperatures enhance the local water vapor cycle, forming positive feedback of “precipitation-evaporation-reprecipitation” [28]. In autumn, the proportion of PRE replenishment to the CDW of the check dams is lower than in summer, and the proportion of CDW replenishment along the course also decreases, while the proportion of UGW replenishment increases. In winter, with snow and freezing rain as the main forms of PRE, the proportion of its replenishment to the CDW of the check dams is relatively high. Due to the low temperature, the CDW of the check dams freezes and has poor fluidity, and the proportion of CDW replenishment along the course drops to the lowest level of the year, while the proportion of UGW replenishment increases. This obvious isotopic variability is largely related to the seasonal changes in water sources and hydro-meteorological processes [29].
The calculation of transport time based on the sine fitting of hydrogen and oxygen isotopes and the exponential model (EM) provides crucial evidence in the temporal dimension for understanding the hydrological functions of the watershed. The relatively short average turnover time of 137.9 d between precipitation recharge (PRE) and channel discharge water (CDW) indicates a rapid response of the watershed to precipitation input, further confirming that surface runoff is an important path of hydrological response. This is consistent with the typical hydrogeological structure of the Loess Plateau, where “red soil under loess” (red clay aquiclude under loess) is characteristic. The rapid response of the watershed to precipitation input, as evidenced by the short average turnover time between PRE and CDW (137.9 d), is primarily driven by the unique hydrogeological framework of the Loess Plateau. The highly permeable loess layers facilitate immediate infiltration of rainfall, but the underlying red clay aquiclude promotes lateral interflow and surface runoff rather than deep percolation, leading to quick connectivity between precipitation and channel discharge. This is consistent with the dominance of surface pathways, as further confirmed by the significantly shorter transmission time in undammed tributaries (e.g., 173 d in tributary X) compared to dammed ones (e.g., 489 d in tributary G). The spatial heterogeneity in transmission times, illustrated in Figure 9, underscores that natural watershed conditions favor fast hydrological responses, which are only prolonged by check dam interventions. The high infiltration rate of the loess layer facilitates rapid water infiltration, but the relatively impermeable layer beneath it promotes the formation of lateral interflow, thereby shortening the time for precipitation to reach the channel [30]. In sharp contrast, the average turnover time of 703.9 days between unconfined groundwater (UGW) and CDW profoundly reveals the large storage capacity and strong lag effect of the groundwater system, which is highly consistent with the common hydrogeological understanding [31].
More notable is the strong spatial heterogeneity of the transmission time. The 1# check dam at the uppermost part of the main channel has the longest PRE-CDW turnover time (206 d), while the dam-less tributary X has the shortest (106 d). This directly reflects the “retarding effect” of sediment dams [30]. The 1# dam, due to its location and reservoir capacity, significantly prolongs the convergence time of water flow, while the dam-less tributary maintains a relatively natural and efficient water flow path. The differences in UGW turnover time (ranging from 603 days at the 1# dam to 1001 d at the 5# dam) may be controlled by the aquifer structure, burial depth, and the local hydrogeological conditions altered by the dam [32,33]. The extremely long CDW turnover time at the 5# dam suggests that it may be located in the stagnation zone or the discharge end of the regional UGW. Kitambo et al. pointed out that different aquifer structures (such as loose porous media and fractured media) themselves can lead to significant differences in groundwater storage and flow characteristics, which is one of the fundamental reasons for the different UGW turnover times at various dam sites within the region [34].
One of the most core findings of this study is that check dams significantly reshape the water transmission efficiency of the watershed. The overall transmission time of the gully with check dams (G) is 2.8 times that of the gully without check dams (X), which is 489 d and 173 d, respectively, providing the most direct quantitative evidence for the “retarding effect” of check dams. The transmission time between 1# and 2# is as long as 551 d, which is almost equivalent to 1.5 hydrological years, indicating that the sequence of check dams has formed a significant “cascading reservoir effect” [35]. On the one hand, the extended transmission time means that check dams enhance the water retention capacity of the watershed, effectively increasing groundwater recharge by slowing down the flow rate and promoting infiltration. At the same time, the reduced flow rate is conducive to the sedimentation of sediment and nutrients attached to particles (such as phosphorus and heavy metals), thereby improving the water quality downstream [36]. On the other hand, overly long water retention may lead to water temperature stratification and depletion of dissolved oxygen in the reservoir area in front of the dam, increasing the risk of eutrophication and greenhouse gas (such as methane) emissions [37]. In addition, the extended transmission time may alter the natural hydrological rhythm of the river, weaken the peak flow, and thus affect the habitat integrity and biodiversity of the downstream ecosystem [38]. Therefore, while check dams play a role in sediment retention and infiltration enhancement, their potential negative ecological effects must be carefully evaluated and managed.

5. Conclusions

Based on hydrogen and oxygen stable isotope tracing, this study reveals the reshaping effect of check dam construction on the hydrological process in the Niejia River Basin of the Loess Plateau. Through intense evaporation and mixing, check dams cause significant distance effects and seasonal dynamics in surface water isotopes and profoundly alter the inherent recharge relationships within the basin. Precipitation and groundwater are the main sources of water in check dam ponds, while the along-course recharge contribution between dams is relatively limited. Moreover, the recharge capacity of dammed tributaries to the main channel is significantly weaker than that of undammed tributaries. The check dam system has a significant “cascading reservoir effect”, extending the complete transmission time of tributary water bodies to 2.8 times that of undammed tributaries. While fulfilling the basic function of sediment retention, check dams enhance the water storage capacity of the basin through extending water transmission time and altering recharge pathways, thereby exerting ecological hydrological functions.

6. Research Limitations and Prospects

Due to the primary function of check dams in sediment interception rather than water storage, official hydrological records such as dam retention volumes, upstream water levels, or peak flow rates are not systematically monitored in the Niejia River Basin. Future studies could benefit from collaboration with local water authorities to integrate hydraulic monitoring with isotopic tracing. This study focused on isotopic tracing as a direct method to quantify water transmission times. While classical hydraulic models (e.g., flood wave routing) could provide complementary insights, their application requires high-resolution hydrological data that are unavailable in this context. Future work could explore coupled isotopic-hydraulic modeling where data permit. The ecological implications of prolonged water transmission times (e.g., on water quality or aquatic habitats) require long-term monitoring beyond the scope of this study. Subsequent research should incorporate biogeochemical indicators to validate the hydrological findings presented here.

Author Contributions

Y.S. conducted field investigations, collected samples in the field, measured indicators, drew charts and wrote the content; Y.Z., C.M. and X.-J.L. were responsible for designing the research plan, providing process guidance, and writing and revising the content; Y.-T.C. conducted a review and verification of the entire research; J.W. cooperated in conducting field sampling and index determination during the research process. All authors have read and agreed to the published version of the manuscript.

Funding

This research was funded by Xi’an University of Science and Technology—National Natural Science Foundation of China (General Program, Project No. 42473069). This research was also funded by the Ningxia University—Ningxia Hui Autonomous Region Natural Science Foundation for Outstanding Young Scholars (Project No. 2024AAC05021).

Data Availability Statement

The original contributions presented in this study are included in the article. Further inquiries can be directed to the corresponding authors.

Acknowledgments

We thank all authors who submitted their valuable papers to the Special Issue, entitled “The construction of check dams on the Loess Plateau has pro-longed water transmission times and altered recharge relation-ships” of Water. Furthermore, we thank all reviewers and the editorial team of Water for their great efforts and support.

Conflicts of Interest

The authors declare no conflicts of interest.

References

  1. Fu, B.; Wang, S.; Liu, Y.; Liu, J.; Liang, W.; Miao, C. Hydrogeomorphic ecosystem responses to natural and anthropogenic changes in the Loess Plateau of China. Annu. Rev. Earth Planet. Sci. 2017, 45, 223–243. [Google Scholar] [CrossRef]
  2. Wang, Y.; Bo, F.; Li, C.; Yi, L.; Yang, G. Check dam in the Loess Plateau of China: Engineering for environmental services and food security. Environ. Sci. Technol. 2011, 45, 10298–10299. [Google Scholar] [CrossRef]
  3. Xu, Y.D.; Fu, B.J.; He, C.S. Assessing the hydrological effect of the check dams in the Loess Plateau, China, by model simulations. Hydrol. Earth Syst. Sci. 2013, 17, 2185–2193. [Google Scholar] [CrossRef]
  4. Craig, H. Isotopic variations in meteoric waters. Science 1961, 133, 1702–1703. [Google Scholar] [CrossRef] [PubMed]
  5. Hu, M.; Zhang, Y.; Wu, K.; Shen, H.; Yao, M.; Dahlgren, R.A.; Chen, D. Assessment of streamflow components and hydrologic transit times using stable isotopes of oxygen and hydrogen in waters of a subtropical watershed in eastern China. J. Hydrol. 2020, 589, 125363. [Google Scholar] [CrossRef]
  6. Chen, H.; Li, J.; Zhao, C.; Wang, C.; Hao, W.; Meng, L.; Huang, C. Seasonal and spatial variations of water recharging in the Yangtze River using hydrogen and oxygen stable isotopes. J. Hydrol. 2024, 639, 131563. [Google Scholar] [CrossRef]
  7. Hamidi, M.D.; Gröcke, D.R.; Joshi, S.K.; Greenwell, H.C. Investigating groundwater recharge using hydrogen and oxygen stable isotopes in Kabul city, a semi-arid region. J. Hydrol. 2023, 626, 130187. [Google Scholar] [CrossRef]
  8. Ren, X.; Li, P.; He, X.; Zhang, Q. Tracing the sources and evaporation fate of surface water and groundwater using stable isotopes of hydrogen and oxygen. Sci. Total Environ. 2024, 931, 172708. [Google Scholar] [CrossRef]
  9. Nyssen, J.; Clymans, W.; Descheemaeker, K.; Poesen, J.; Vandecasteele, I.; Vanmaercke, M.; Walraevens, K. Impact of soil and water conservation measures on catchment hydrological response—A case in north Ethiopia. Hydrol. Process. 2010, 24, 1880–1895. [Google Scholar] [CrossRef]
  10. Xue, S.; Li, P.; Cui, Z.; Li, Z. The influence of different check dam configurations on the downstream river topography and water–sediment relationship. J. Hydrol. 2025, 656, 133046. [Google Scholar] [CrossRef]
  11. Han, H.; Hou, J.; Huang, M.; Li, Z.; Xu, K.; Zhang, D.; Wang, C. Impact of soil and water conservation measures and precipitation on streamflow in the middle and lower reaches of the Hulu River Basin, China. Catena 2020, 195, 104792. [Google Scholar] [CrossRef]
  12. Qu, S.; Wang, C.; Yang, N.; Duan, L.; Yu, R.; Zhang, K.; Sun, P. Large-scale surface water-groundwater origins and connectivity in the Ordos Basin, China: Insight from hydrogen and oxygen isotopes. Environ. Res. 2023, 236, 116837. [Google Scholar] [CrossRef]
  13. McGuire, K.J.; McDonnell, J.J. A review and evaluation of catchment transit time modeling. J. Hydrol. 2006, 330, 543–563. [Google Scholar] [CrossRef]
  14. Zuo, H.; Li, B.; Wang, Y. Characteristics of Streamflow Components in the Tarim River Basin Based on Hydrogen and Oxygen Isotopes. Acta Sci. Nat. Univ. Pekin. 2025, 61, 358–368. [Google Scholar]
  15. Stein, A.F.; Draxler, R.R.; Rolph, G.D.; Stunder, B.J.B.; Cohen, M.D.; Ngan, F. NOAA’s HYSPLIT atmospheric transport and dispersion modeling system. Bull. Amer. Meteor. Soc 2015, 96, 2059–2077. [Google Scholar] [CrossRef]
  16. Guanghe, X.; Huang, B.; Kunpeng, L.; Chen, J. Studies on Submersible Short-Circuit Blowing Based on Orthogonal Experiments, Back Propagation Neural Network Prediction, and Pearson Correlation Analysis. Appl. Sci. 2024, 14, 10321. [Google Scholar] [CrossRef]
  17. Wei, L.; Xiubao, S.; Guoyu, R. A review of seasonal division and change research. Prog. Geogr. 2024, 43, 826–840. [Google Scholar] [CrossRef]
  18. Zhang, F.; Huang, T.; Man, W.; Hu, H.; Long, Y.; Li, Z.; Pang, Z. Contribution of recycled moisture to precipitation: A modified D-excess-based model. Geophys. Res. Lett. 2021, 48, e2021GL095909. [Google Scholar] [CrossRef]
  19. Zheng, S.; Hou, F.; Ni, B. Research on Stable Isotopes of Hydrogen and Oxygen in Atmospheric Precipitation in China. Chin. Sci. Bull. 1983, 801–806. [Google Scholar] [CrossRef]
  20. Cui, L.; Song, X.; Zhong, G. Comparative analysis of three methods for HYSPLIT atmospheric trajectories clustering. Atmosphere 2021, 12, 698. [Google Scholar] [CrossRef]
  21. Song, X.; Mi, N.; Mi, W.; Li, L. Spatial non-stationary characteristics between grass yield and its influencing factors in the Ningxia temperate grasslands based on a mixed geographically weighted regression model. J. Geogr. Sci. 2022, 32, 1076–1102. [Google Scholar] [CrossRef]
  22. Xu, R.; Qiu, Y. The difference in cloud water resources and precipitation on the eastern and western sides of the Liupan mountains caused by topographic effects. Atmosphere 2023, 14, 1502. [Google Scholar] [CrossRef]
  23. Yuan, X.; Yang, K.; Lu, H.; Sun, J.; Wang, Y.; Liu, Y.; Tang, Q. Weakened subtropical westerlies reduced early spring precipitation in the Southeast Tibetan Plateau. J. Clim. 2023, 36, 4363–4373. [Google Scholar] [CrossRef]
  24. Wang, Y.; Du, R.; Cao, X.; Yu, H.; Xu, Y.; Yu, Y.; Peng, J. Evaporation dominates the loss of plateau lake in Southwest China using water isotope balance assessment. Sci. Total Environ. 2023, 873, 162415. [Google Scholar] [CrossRef]
  25. Sreedevi, P.D.; Sreekanth, P.D.; Reddy, D.V. Deuterium excess of groundwater as a proxy for recharge in an evaporative environment of a granitic aquifer, South India. J. Geol. Soc. India 2021, 97, 649–655. [Google Scholar] [CrossRef]
  26. Zhao, L.; Yin, L.; Ao, H.; Cheng, G.; Zhou, M.; Yang, Y.; Zhou, J. Isotopic evidence for the moisture origin and composition of surface runoff in the headwaters of the Heihe River basin. Chin. Sci. Bull. 2011, 56, 406–415. [Google Scholar] [CrossRef]
  27. Wu, H.; Zhao, Q.; Qin, X.; Gao, Q.; Lyu, C. Spatio-temporal distribution characteristics of hydrogen and oxygen isotope components in the Tuojia River and their influencing factors. J. Appl. Ecol. 2018, 29, 1461–1469. [Google Scholar]
  28. Ahmed, M.; Chen, Y.; Khalil, M.M. Isotopic composition of groundwater resources in arid environments. J. Hydrol. 2022, 609, 127773. [Google Scholar] [CrossRef]
  29. Chen, M.; Gao, J.; Luo, L.; Zhao, A.; Niu, X.; Yu, W.; Chen, G. Temporal variations of stable isotopic compositions in atmospheric water vapor on the Southeastern Tibetan Plateau and their controlling factors. Atmos. Res. 2024, 303, 107328. [Google Scholar] [CrossRef]
  30. Wu, H.; Zhang, C.; Li, X.Y.; Fu, C.; Wu, H.; Wang, P.; Liu, J. Hydrometeorological processes and moisture sources in the northeastern Tibetan Plateau: Insights from a 7-yr study on precipitation isotopes. J. Clim. 2022, 35, 6519–6531. [Google Scholar] [CrossRef]
  31. Jasechko, S.; Sharp, Z.D.; Gibson, J.J.; JeanBirks, S.; Yi, Y.; Fawcett, P.J. Uncertainties in transpiration estimates Reply. Nature 2014, 506, E2–E3. [Google Scholar] [CrossRef]
  32. Kendall, C.; McDonnell, J.J. (Eds.) Isotope Tracers in Catchment Hydrology; Elsevier: Amsterdam, The Netherlands, 2012. [Google Scholar]
  33. Moazeni-Noghondar, S.; Golkarian, A.; Azari, M.; Asgari Lajayer, B. Study on soil water retention and infiltration rate: A case study in eastern Iran. Environ. Earth Sci. 2021, 80, 474. [Google Scholar] [CrossRef]
  34. Kitambo, B.M.; Wongchuig, S.; Tshimanga, R.M.; Paris, A.; Blazquez, A.; Moreira, D.; Papa, F. Hydrogeological control of groundwater variations in the Congo River Basin revealed by GRACE water storage change decomposition. J. Hydrol. Reg. Stud. 2025, 62, 102810. [Google Scholar] [CrossRef]
  35. Yin, G.; Zhang, H.; Shi, Y. Cascade effects of triggered earthquakes of cascade dams: Taking Xiluodu and Xiangjiaba reservoirs as examples. Chin. J. Geophys. 2023, 66, 2470–2488. (In Chinese) [Google Scholar]
  36. Bai, L.L.; Shi, P.; Wang, W.; Li, Z.B.; Yu, K.X.; Li, P.; Chen, W.F. Sediment sources and their impacts on a check dam-controlled watershed, Loess Plateau, China. J. Mt. Sci. 2023, 20, 1660–1673. [Google Scholar] [CrossRef]
  37. Deemer, B.R.; Harrison, J.A.; Li, S.; Beaulieu, J.J.; DelSontro, T.; Barros, N.; Vonk, J.A. Greenhouse gas emissions from reservoir water surfaces: A new global synthesis. BioScience 2016, 66, 949–964. [Google Scholar] [CrossRef]
  38. Poff, N.L.; Zimmerman, J.K. Ecological responses to altered flow regimes: A literature review to inform the science and management of environmental flows. Freshw. Biol. 2010, 55, 194–205. [Google Scholar] [CrossRef]
Figure 1. The topography of the Niejia River Basin, sampling areas, and meteorological conditions from 2024 to 2025.
Water 17 03320 g001
Figure 2. Seasonal characteristics of hydrogen and oxygen isotopes and d-excess values in precipitation (PRE), surface water (CDW) and groundwater (UGW) in the Niejia River Basin.
Water 17 03320 g002
Figure 3. The local precipitation line (LMWL), surface water line (CDWL) and groundwater line (GWL) in the Niejia River Basin.
Water 17 03320 g003
Figure 4. The relationship between the annual scale decline of water δ18O and precipitation (P), temperature (T), and relative humidity (RH).
Water 17 03320 g004
Figure 5. The relationship between δ18O and d-excess values in surface water.
Water 17 03320 g005
Figure 6. The relationship between δ18O and d-excess values in groundwater water.
Water 17 03320 g006
Figure 7. The relationship between CDW δ18O and distance.
Water 17 03320 g007
Figure 8. Seasonal characteristics of the proportion of water replenishment to check dams by different water bodies in the Niejia River Basin.
Water 17 03320 g008
Figure 9. The CDW transmission time in the Niejia River Basin.
Water 17 03320 g009
Figure 10. HYSPLIT’s backward trajectory simulates the source of water vapor.
Water 17 03320 g010
Table 1. The Pearson correlation coefficient (P) between the seasonal-scale water oxygen isotope ratio (δ18O) and precipitation (P), temperature (T), and relative humidity (RH).
δ18Od-excess
PTRHPTRH
Spring0.18−0.61 *−0.51 *0.160.04−0.04
Summer−0.55 **−0.28−0.210.42 *−0.150.35
Autumn−0.02−0.16−0.290.230.220.16
Winter0.63 *0.70 *−0.62 *−0.34−0.300.32
Note: *, ** represent significant correlations at the 0.05, 0.01 levels, respectively.
Table 2. Seasonal characteristics of different water replenishment ratios in the branch gullies of the Niejia River Basin.
TributarySeasonsPRE/%UGW/%Recharge Downward/%
to G2
G1Spring51.2748.739.89
Summer68.9431.0613.45
Autumn56.7143.2910.36
Winter44.3255.686.34
to 1#
G2Spring45.2144.97.92
Summer55.3831.1715.78
Autumn52.6536.9916.38
Winter39.6554.0110.99
to 2#
XSpring48.1251.8812.55
Summer62.3337.6726.39
Autumn65.0134.9924.55
Winter37.9962.0114.61
Table 3. The transmission time of CDW with PRE and UGW in the Niejia River Basin.
Check DamsPRE/dUGW/d
1#206603
2#134975
3#138956
4#124916
5#1421001
6#115789
G1125372
G2151478
X106245
Disclaimer/Publisher’s Note: The statements, opinions and data contained in all publications are solely those of the individual author(s) and contributor(s) and not of MDPI and/or the editor(s). MDPI and/or the editor(s) disclaim responsibility for any injury to people or property resulting from any ideas, methods, instructions or products referred to in the content.