Article

A Spatio-Temporal Assessment of Industrial Water Use in African Countries

1
College of Environmental Science and Engineering, Tongji University, Shanghai 200092, China
2
UNEP-Tongji Institute of Environment for Sustainable Development, Shanghai 200092, China
3
College of Environmental and Biosystems Engineering, University of Nairobi, Nairobi 00100, Kenya
4
Institute of Carbon Neutrality, Tongji University, Shanghai 200092, China
5
Key Laboratory of Cities’ Mitigation and Adaptation to Climate Change in Shanghai, Shanghai 200092, China
*
Author to whom correspondence should be addressed.
Water 2025, 17(22), 3313; https://doi.org/10.3390/w17223313
Submission received: 12 September 2025 / Revised: 2 October 2025 / Accepted: 10 October 2025 / Published: 20 November 2025

Abstract

Africa’s industries have been developing at a pace more rapid than other continents, including Asia, over the past two to three decades. This research investigated the industrial water use in 1987–2017 in twenty major African countries, representing 77% of the population and 81% of the GDP in Africa. A decoupling analysis of industrial water use from economic growth was also carried out, and hierarchical cluster analysis (HCA) was conducted. The key findings included the following: (i) HCA could divide the patterns of the countries’ water use into four groups. The group of Algeria, Tunisia, Angola, and Morocco exhibited the highest average industrial water use per capita in 2017. (ii) An expansive negative decoupling became more significant during the 10-year period from 2008 to 2017. (iii) Population growth, economic development, and industrial structure played a prominent role in driving industrial water use over the past two decades. (iv) Technological advancements in water conservation varied across countries and periods. Some countries, including Kenya, South Africa, Ghana, Egypt, and Tunisia, witnessed a more rapid increase in water withdrawal from 2008 to 2017, but less significant progress in water-saving technologies. This research might be informative for decision-makers to formulate sustainable water policies in line with Africa’s sustainable agenda by the year of 2063.

1. Introduction

Water scarcity has become a significant concern globally, interplayed with multiple issues, ranging from food security to economic prosperity [1,2]. Humans’ increased water demand is expected to deplete water resources in many areas, especially in African countries with projected population shifts in the coming years [3,4,5]. According to the Food and Agriculture Organization of the United Nations [6], 768 km3 of freshwater was extracted for industrial purposes globally, accounting for 19% of total water withdrawals. Though the majority of water in Africa is used in agriculture, industrial water use is emerging as an important consideration. As the sector continues to grow, it has the potential to become a significant water consumer in the future, thereby creating increased competition for water resources as African economies develop. It is estimated that the global total industrial water use will range between 461 and 1560 km3 per year in 2050 and between 196 and 1463 km3 per year in 2100 [7].
Africa has experienced substantial growth in its manufacturing sector, outpacing the rest of the world, with an annual growth rate of 3.5% between 2005 and 2014. Some countries, such as Nigeria and Angola, have even achieved annual output growth rates exceeding 10% [8]. For instance, around 80 African cities are among the world’s top-100 fastest-growing cities in the world, and economic growth across Africa will continue to outpace that of other regions for at least the first half of the decade, with the continent continuing to host seven of the world’s ten fastest-growing economies [9,10]. Furthermore, Africa is marked by rapid economic development and population explosion in countries such as Morocco, Ethiopia, Kenya, Ghana, Egypt, and South Africa, which are projected to rise at rates exceeding 4% real GDP growth. In order to achieve high levels of economic growth and development, the African continent has recently transitioned from an agricultural-based economy to an industrialized one [11]. This dynamic shift is expected to result in sizeable industrial water withdrawals and pollution, hence leading to both water quantity and quality scarcity.
Accurate data on water consumption is crucial for effective planning. However, historical records on domestic and industrial water consumption are often missing, incomplete, or unavailable, posing challenges for research and decision making [12]. Developed countries have made progress in reducing water use through technological advancements and improvements in industrial structures. However, limited access to technology, financial constraints, and weak environmental regulations in Africa have resulted in low water use efficiency and increased pollution of water resources [11]. Understanding water use trends and decoupling status, assessing the impacts of economic growth on water resource use, and analyzing the corresponding driving factors behind them are critical toward ensuring the optimal abstraction of freshwater resources and the increase in water use efficiency in Africa. Industrial water consumption, therefore, must be evaluated based on sustainable water extraction rates.
Numerous methodologies have been developed for assessing the sustainability of industrial water resource use [13]. Decoupling theory, first proposed by Weizsäcker in 1990 [14], reflects the non-synchronous changes between economic growth and environmental damage. The Organization for Economic Co-operation and Development (OECD, 2001) published a report on the decoupling relationship between economic growth and environmental impacts at the turn of the 21st century, dividing “decoupling” into two types: absolute decoupling and relative decoupling. Tapio improved the OECD model [15,16,17] by introducing decoupling elasticity into the decoupling model, resulting in eight decoupling state categories (weak, strong, weak negative, strong negative, expansive negative, and recessive decoupling, and expansive and recessive coupling) [18,19,20]. Xing et al. [21] used the decoupling model to assess industrial development from wastewater in China. Zhang et al. [22] conducted research in the Northwest arid region of China on water resource utilization and economic development. Wang et al. [23] indicated that the water resource decoupling status in the industrial sector in three Chinese megacities was better than that in the agricultural sector.
Decomposition analysis is a technique for breaking down a single aggregate indicator into numerous easily understood factors. There are primarily two decomposition analysis methods: structural decomposition analysis (SDA) and index decomposition analysis (IDA). Owing to its simplicity and flexibility in application [2,24], IDA has been widely used in research on water resources [2,25]. On this basis, we applied IDA to decompose the drivers of changes in industrial water withdrawal in Africa.
A quantitative analysis of changing industrial water use in Tianjin using a decomposition method revealed that technology inhibits water use, with an average annual reduction of 7,900,104 m3 [26]. Wang et al. [27] evaluated the decoupling state between economic growth and water consumption and found that population and economic growth had positive increments in water consumption. Ma et al. [28], using the Logarithmic Mean Divisia Index (LMDI), revealed that more than half of China’s provinces displayed this tendency of decoupling from economic development. Yang and Chen [29] demonstrated that wealth and population cause positive variations in water use in the productive sector, while structure and technology drivers cause negative variations.
Industrial structure and water use intensity, as observed by Wang et al. [27], are the main drivers of decoupling, while population and economic development have incremental effects. Similar research on water use and technology has yielded a similar result [15,30]. Zhang et al. [2] concluded that reducing water use at the expense of economic growth does not align with the sustainable development priorities of developing countries, emphasizing the need for water use regulations based on local water resources and economic and social conditions. Other studies have focused on the driving factors of water use in energy generation [31,32] and agriculture [33], among other sectors.
In the African context, Engo et al. [34] used the LMDI to identify carbon emissions’ driving forces and decoupling indicators for the industrial sector in Northern Africa, including Egypt, Morocco, Algeria, and Tunisia. Simbi et al. [35] conducted a decomposition and decoupling analysis of Africa’s economic growth and carbon dioxide emissions. From 1995 to 2015, Achraf et al. [36] utilized input–output structural decomposition analysis (SDA) to evaluate the causes of sectoral water variations in Morocco quantitatively. The findings indicated that the technological effect served as a multiplier, while the economic system efficiency effect aided water conservation.
This study makes three key contributions to the understanding of industrial water use in Africa. First, it addresses a critical empirical gap by examining industrial water use across twenty African countries over three decades, a sector that has received less attention than agriculture yet is poised to expand and intensify competition for scarce freshwater as industrialization progresses. Second, we combined Tapio’s decoupling framework with robust driver decomposition (LMDI) to quantify how GDP growth, population dynamics, industrial structure, and technology jointly influence industrial water withdrawals over time, providing mechanistic insight into the factors driving coupling or decoupling between economic growth and water use. Third, we applied hierarchical cluster analysis (Ward’s method) to group countries by similar decoupling and driver profiles, enabling cross-country comparisons that revealed regional patterns and policy-relevant clusters.
By integrating decoupling, decomposition, and clustering, this study advances prior work and provides actionable evidence for differentiated industrial water management strategies across Africa. A selection of twenty countries (Table 1) in Africa was analyzed to reveal the spatio-temporal changes in industrial water withdrawals and regional characteristics over three decades. The remaining sections of this paper are organized as follows: the methods and materials are stated in Section 2. In Section 3 and Section 4, the results are presented and discussed. Section 5 reviews our main conclusions.

2. Methods

This study adopted the definition of industrial water withdrawal provided by the Food and Agriculture Organization AQUASTAT [37,38]. Water use refers to the annual quantity of water withdrawn from surface or groundwater resources for various sectors, including irrigation, industrial, urban, and rural purposes.

2.1. Data Sources

The data for this study focused on industrial water withdrawal in twenty selected African countries from 1988 to 2017. The analysis was divided into three ten-year periods: 1988–1997, 1998–2007, and 2008–2017. The selection of countries was based on their GDP, utilizing World Bank data from 2016. The initial step involved collecting data on GDP, industrial value-added, population, and industrial sector water withdrawal, which were utilized in the analysis. Industrial water withdrawal data were sourced from international AQUASTAT statistics [39]. GDP, population, and industrial value-added data (including construction) were obtained from the World Bank in 2019 [40]. GDP was adjusted to constant 2010 prices in USD. Mapping was conducted using the ArcGIS 10.7 software.

2.2. Decoupling Analysis

Decoupling analysis assesses the degree of decoupling between the economy and the environment by comparing their respective growth rates. A decoupling relationship occurs when the economy grows faster than the associated environmental consequences [21]. The decoupling index between industrial water withdrawal (IWW) and industrial output was calculated using Equation (1):
d i = W / W 0 G / G 0 =   ( W t W 0 ) / W 0 ( G t G o ) / G 0
In Equation (1), di represents the decoupling index between IWW and industrial output, ΔW denotes the change in water withdrawal, ΔG represents the change in gross domestic product (GDP), G represents the gross domestic product of the industry, and W represents industrial water consumption. The superscripts t and 0 indicate the initial and final years, respectively. Based on Tapio’s classification system [17], the di values correspond to eight distinct states of decoupling. Table 2 shows decoupling standards from the Tapio model used in making the judgments, ranging from the most desirable state of “strong decoupling” to the least desirable of “strong negative decoupling”. A result indicating weak decoupling, though not as favored as strong decoupling, is still satisfactory compared with the other degrees, which are not as favorable [20].

2.3. Cluster Analysis

In the second stage, cluster analysis was conducted on the standardized variables. Cluster analysis is a multivariate statistical technique used to group objects, items, or individuals based on their similarities across selected variables. The basic principle is that objects within the same cluster are more similar to each other than to those in other clusters, according to a chosen similarity or distance measure [41]. Clustering can generally be classified into two types: agglomerative, where objects are progressively merged into larger clusters, and divisive, where clusters are successively split.
Our study applied hierarchical agglomerative clustering, specifically Ward’s method, which minimizes the variance within clusters and maximizes the variance between clusters [42]. This method has been widely applied in cross-country resource studies; for example, Kacperska et al. [43] grouped EU and Visegrad countries based on renewable energy usage, revealing distinct regional disparities. Similarly, the present analysis identified clusters of African countries that reflected differences in industrial water use efficiency and economic development trajectories. The cluster analysis was performed in the Statistica 10.0 software. In this analysis, the Euclidean distances between countries were analyzed.

2.4. Decomposition Analysis

The LMDI (Logarithmic Mean Divisia Index) model was employed in this research to decompose the driving factors that influence changes in industrial water withdrawal. The factors considered included the technical effect, population impacts, economic development effect, and industrial structure effect [15,28,44,45]. The decomposition of industrial water use factors was based on Kaya’s identity, as shown in the following equations:
W = i 20 W i t = i = 1 20 W i V i   . V i G i . G i P i . P i
The subscript i represents the countries from order 1 to 20 considered in this research; Wti indicates the total quantity of industrial water withdrawal; and Wi, Gi, Vi, and Pi indicate the effect of industrial water withdrawal, GDP, industry value-added, and population effect. The equation can be rewritten as shown below.
W t = i = 1 20 W t e c , i . W s t r , i . W e c o , i . W p o p , i  
where Wtec, Wstr, Wpop, and Weco are the four factors influencing water consumption, namely, the technical effect, structure, economic development, and population, respectively. It is worth noting that the technical effect represents the proportion of industrial water use to the industrial added value, i.e., water discharge per unit of industrial consumption, whereas industrial structure indicates the proportion of industrial added value to the country’s GDP.
In order to define a decomposition form for a change in water usage during a 0–t period, the LMDI addition decomposition method is expressed as follows:
∆W = Wt − W0 = (∆WPop,i + ∆Wstr,i + ∆Wtec,i + ∆Weco,i + ∆Wr,i)
∆Weco is the effect of economic development on the water withdrawal changes, representing the ratio of regional GDP to the population, demonstrating the changes in water withdrawal as a result of the economic development of the country, whereas ∆Wstr is the industrial structure effect, representing the proportion of industrial added value to the GDP in that country. This is defined as the influence of changes in industrial structure on industrial water consumption; ∆Wtec,i is the technology effect, signifying the ratio of industrial water consumption to the value-added in the industry; ∆Wpop,i is the water change caused by the population size; and ∆Wr,i indicates the decomposition residual. The subscript I represents the selected countries in Africa.
The following are the equations for calculating the contribution of each element to the intensity of industry water consumption:
W e c o , i = i H W i   t , W i 0     · l n W e c o , i t W e c o , i 0
W s t r , i = i H W i   t , W i 0     ·   l n W s t r , i t W s t r , i 0
W t e c , i = i H W i   t , W i 0   ·   l n W t e c , i t W t e c , i 0
W p o p , i = i H W i   t , W i 0     ·   l n W p o p , i t W p o p , i 0
where the order 0 and t represent the water use in the first and final years, respectively, and ΔWeco,i, ΔWstr,i, ΔWtec,i, and ΔWpop,I represent the contributions of economic development, industrial structure, technology, and the population factions to the changes in industrial water use. The subscript i denotes the countries of order 1–20 selected in this study. A positive number implies that raising that component promotes industrial consumption, whereas a negative value suggests lowering that factor inhibits industrial water withdrawal.
The H W i t   , H i 0 , as illustrated in Equations (4)–(7), is the weight function. Equation (9) shows the definition of the weight function.
H W i t , W i O = W i       t W i o l n W i   t l n W i t                                 W 0 t . W i o 0 W 0 t                                                               W 0 t = W i 0 0                                                                         W 0 t . W i   0 = 0
The decomposition residual Wr is calculated as follows:
Δ W r = Δ W ( Δ W Pop + W str + W tec + W eco ) = W t W 0 H W i t , H i 0 · l n p o p i t p o p i 0 + l n s t r i t s t r i 0 + l n t e c i t t e c i 0 + l n e c o i t e c o i 0     = W t     W 0 H W i t , W i 0   ·   l n H t H t = 0
The LMDI may be decomposed without the residual, as shown in Equation (10), which is an advantage over the Laspeyres index decomposition method. The decoupling elasticity values of the four impact factors can be obtained as illustrated below.
e 1 = W / W I V A / I V A = ( W p o p + W s t r + W t e c + W e c o ) / W I V A / I V A     = W p o p / W I V A / I V A + W x t e c / W I V A / I V A + W s t r / W I V A / I V A + W t e c / W I V A / I V A     = e p o p · e t e c · e s t r · e e c o
where epop is the decoupling index of population, eeco is the decoupling index of the economic factor, estr is the decoupling index of industrial structure, and etec is the decoupling index of industrial technical effectiveness. The IVA represents industrial value added.

3. Results

3.1. Spatial Distribution of Industrial Water Withdrawal

Figure 1 depicts the trends in industrial water use for the twenty selected countries across three study periods: 1988–1997, 1998–2007, and 2008–2017, providing a comprehensive overview. The industrial water use data are divided into six sections with the natural jerk breakpoint method. In 1988–1997, it can be observed that there was a moderate (0–50%) increase in the industrial water use in fifteen countries. During the period of 1998–2008, there was a general increase in the industrial water use in all the countries except Mali, Egypt, Sudan, and Uganda. Notably, Ethiopia had the highest increase (155%) during this period. The GDP of Ethiopia increased by 104% between 1998 and 2007, compared with 82% in the subsequent period. The industrial sector, which forms a major part of the economy, expanded by 168%, and this rapid growth directly drove the highest increase in industrial water consumption during the study period. Other countries with the highest increases included Tunisia, Cameroon, and Angola, among others.
In the most recent period of 2008–2017, a downward trend in industrial water use was observed in the majority of countries. Algeria, Morocco, and Botswana experienced the most significant decrease in industrial water withdrawal during this period. However, industrial water use rose sharply in Tunisia (555%), South Africa (202%), and Kenya (165%), respectively. This growth can be attributed to three reinforcing factors: rapid population increase, robust economic expansion, and the rising share of industry in national GDP, which, together, intensified demand for industrial water
It is worth noting that Algeria consistently exhibited a gradual decrease in industrial water use across all study periods, with the largest decline occurring in the latter period (57%). Algeria recorded moderate GDP growth of 11%, 52%, and 33% across the three periods, respectively. The decline in industrial water use in the last period was linked to the reduced water intensity of industrial output, a fall in the industrial sector’s share of GDP from 120% to 60%, and relatively moderate population growth, which, together, supported more efficient water use.

3.2. Hierarchical Cluster Analysis of Industrial Water Use and GDP

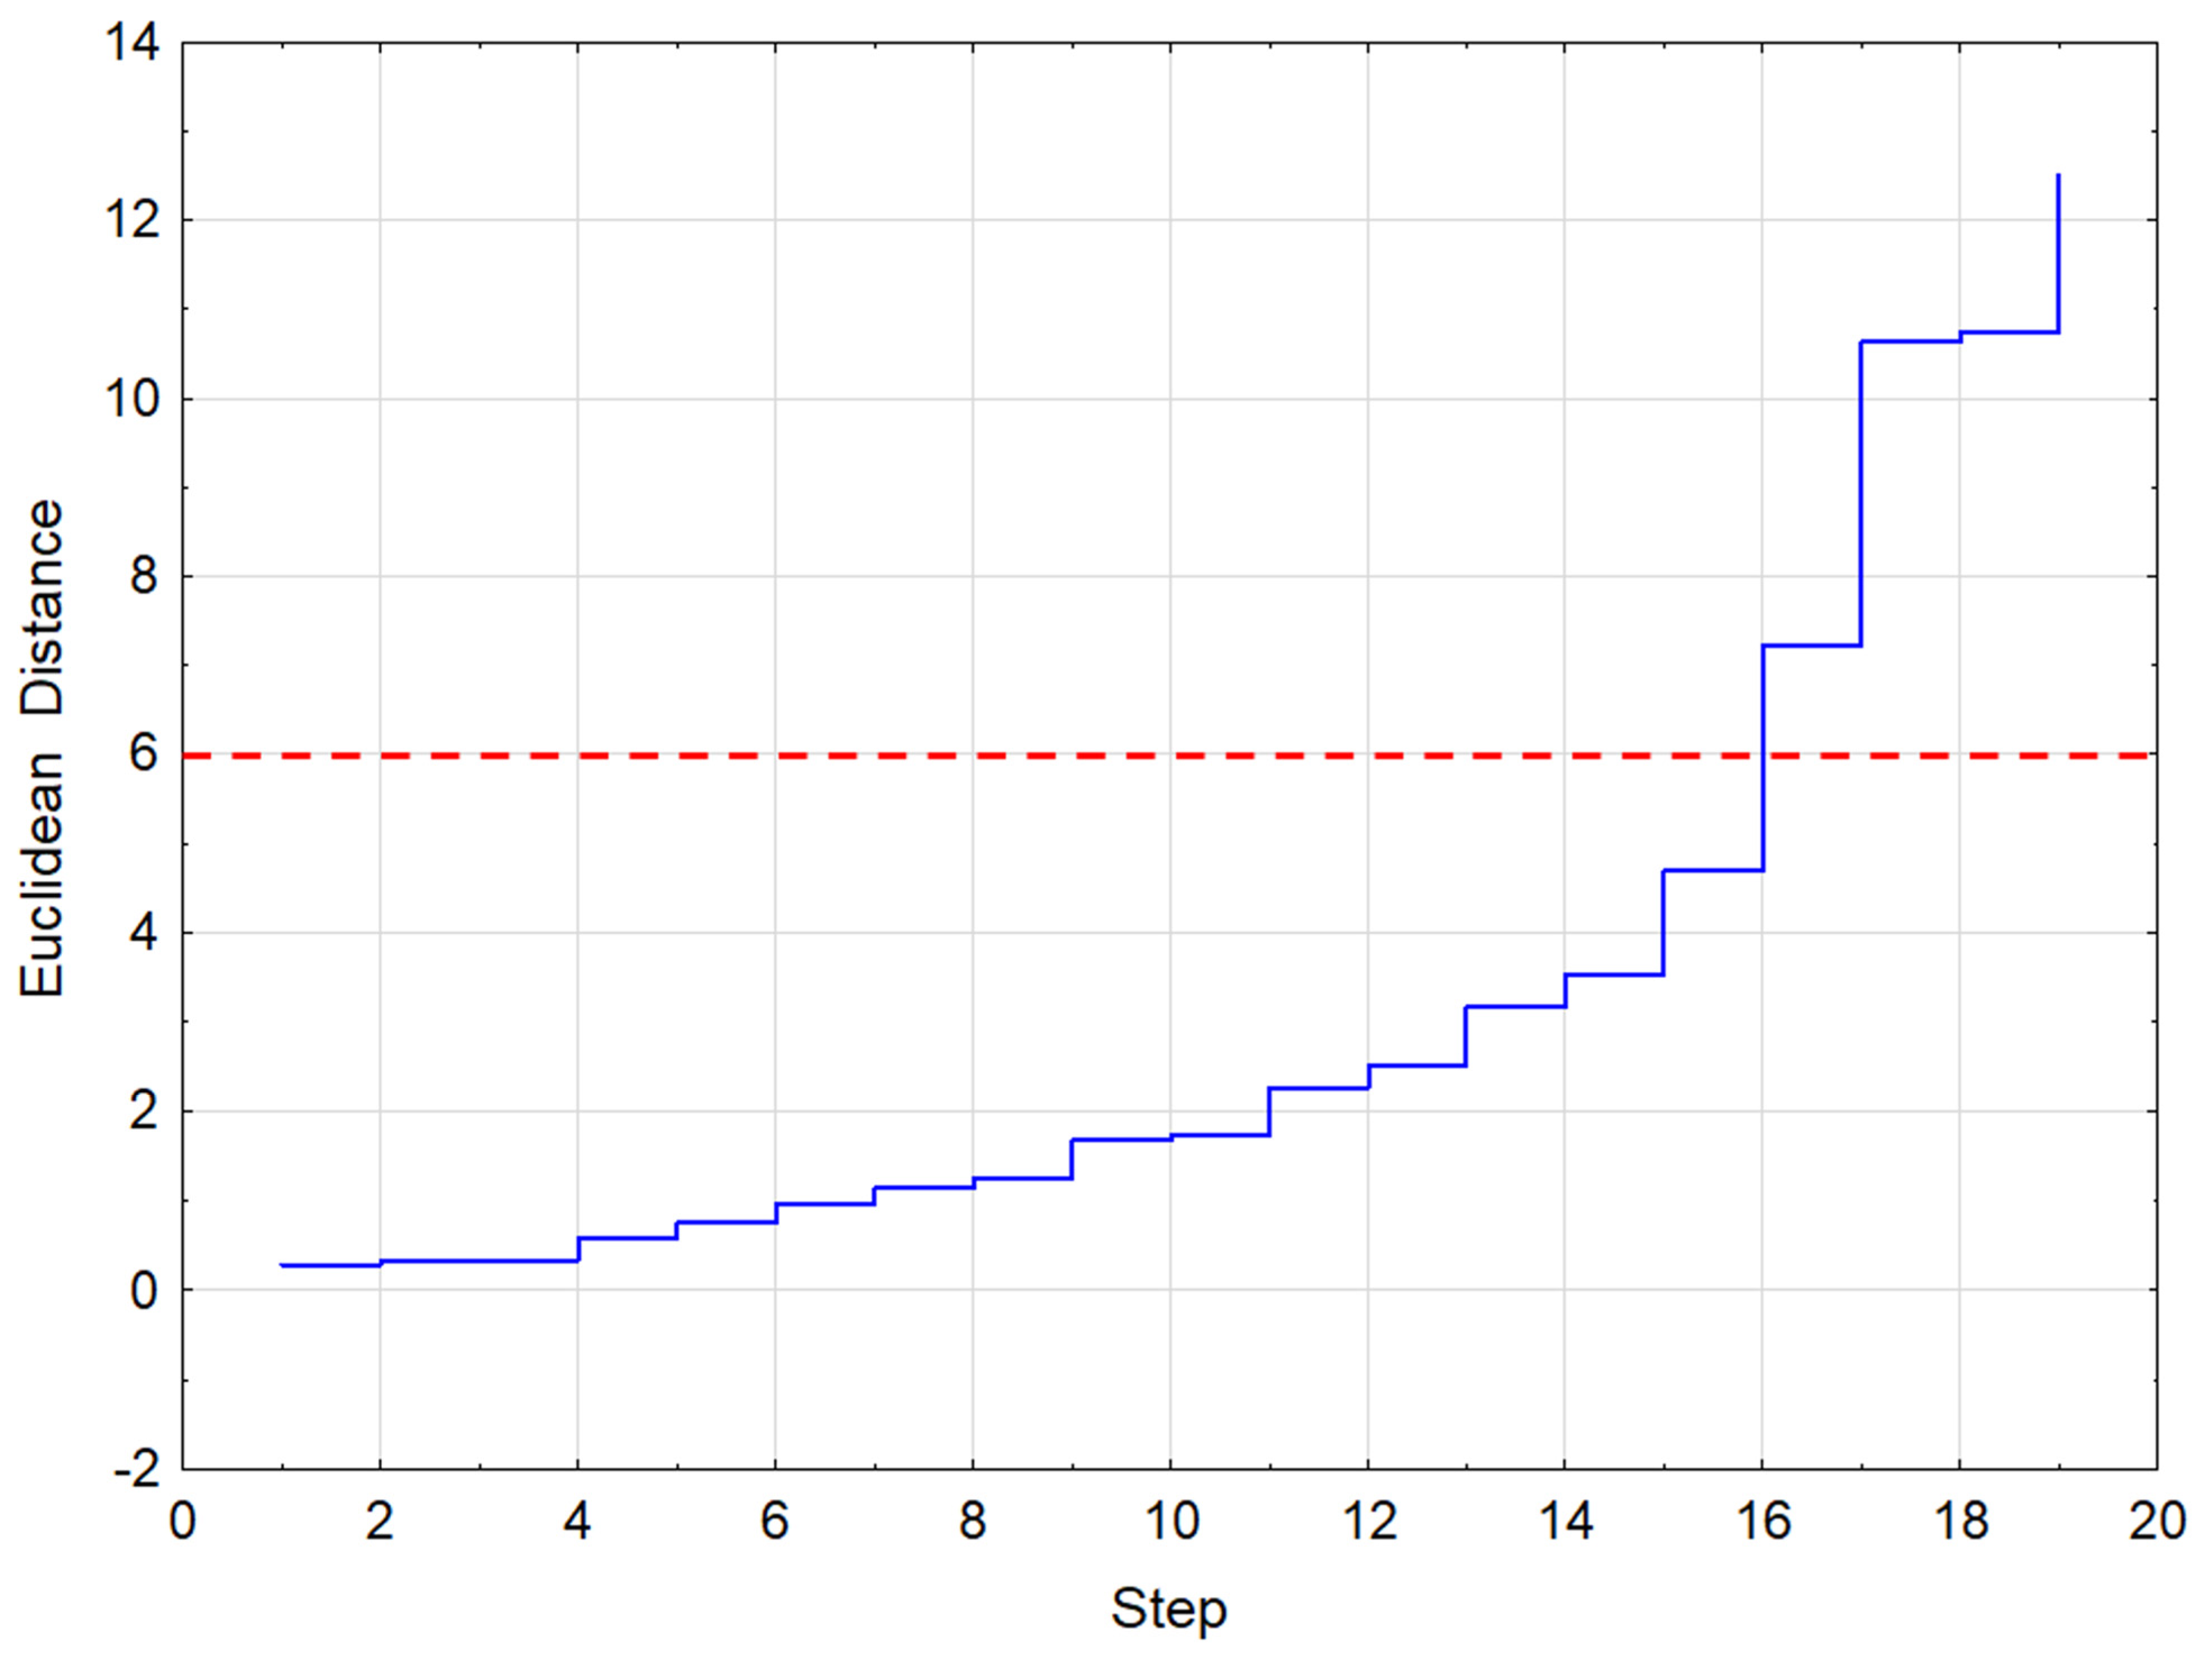
To analyze the relationship between industrial use and per capita GDP, a hierarchical cluster analysis was conducted on the standardized variables. In this analysis, the Euclidean distances between countries were calculated, and the results were visualized in a tree diagram. The amalgamation schedule, which is closely related to the cluster analysis results, is also plotted in Figure 2.
To determine the optimal number of clusters for the hierarchical cluster analysis, we can refer to the graph of the amalgamation schedule. In Figure 3, it is evident that at the 17th step, there was a sharp increase in the Euclidean distance when it reached a value of 2500 (highlighted by the red line). This cutoff point of 2500, suggested by the amalgamation schedule, allowed us to identify four distinct clusters of African countries (as depicted in Figure 3).
Based on the results from the cluster analysis, the first cluster included Algeria, Angola, Tunisia, Botswana, and South Africa. The GDP per capita in these countries was relatively higher (USD 3976.4) and the water consumption was relatively lower in 2017.
The second cluster included only two countries: Botswana and South Africa. These countries had the highest average GDP per capita (USD 7667.3) and the lowest industrial water withdrawal among the other clusters in 2017. These countries had the best industrial water use efficiency. The overall objective was to decouple industrial growth and general economic growth from the excesses of water consumption.
The third cluster included Cameroon, Zambia, Senegal, Egypt, Nigeria, Ethiopia, Ghana, and Sudan. These countries had the highest water use of 1.497 km3/year and significantly lower GDP per capita (USD 1964) in 2017. These countries can be considered the least efficient in industrial water use since the water consumption per economic output was very high. The last cluster included the D.R. Congo, Cote d’Ivoire, Kenya, Mali, Tanzania, and Uganda. The countries had the lowest average GDP per capita below USD 1000 in the year of 2017. Evidently, the water use efficiency trajectory in these countries is critical in determining whether their water use will be sustainable in the future as their GDP increases to mimic other countries.

3.3. Decoupling of Water Use from Economic Growth

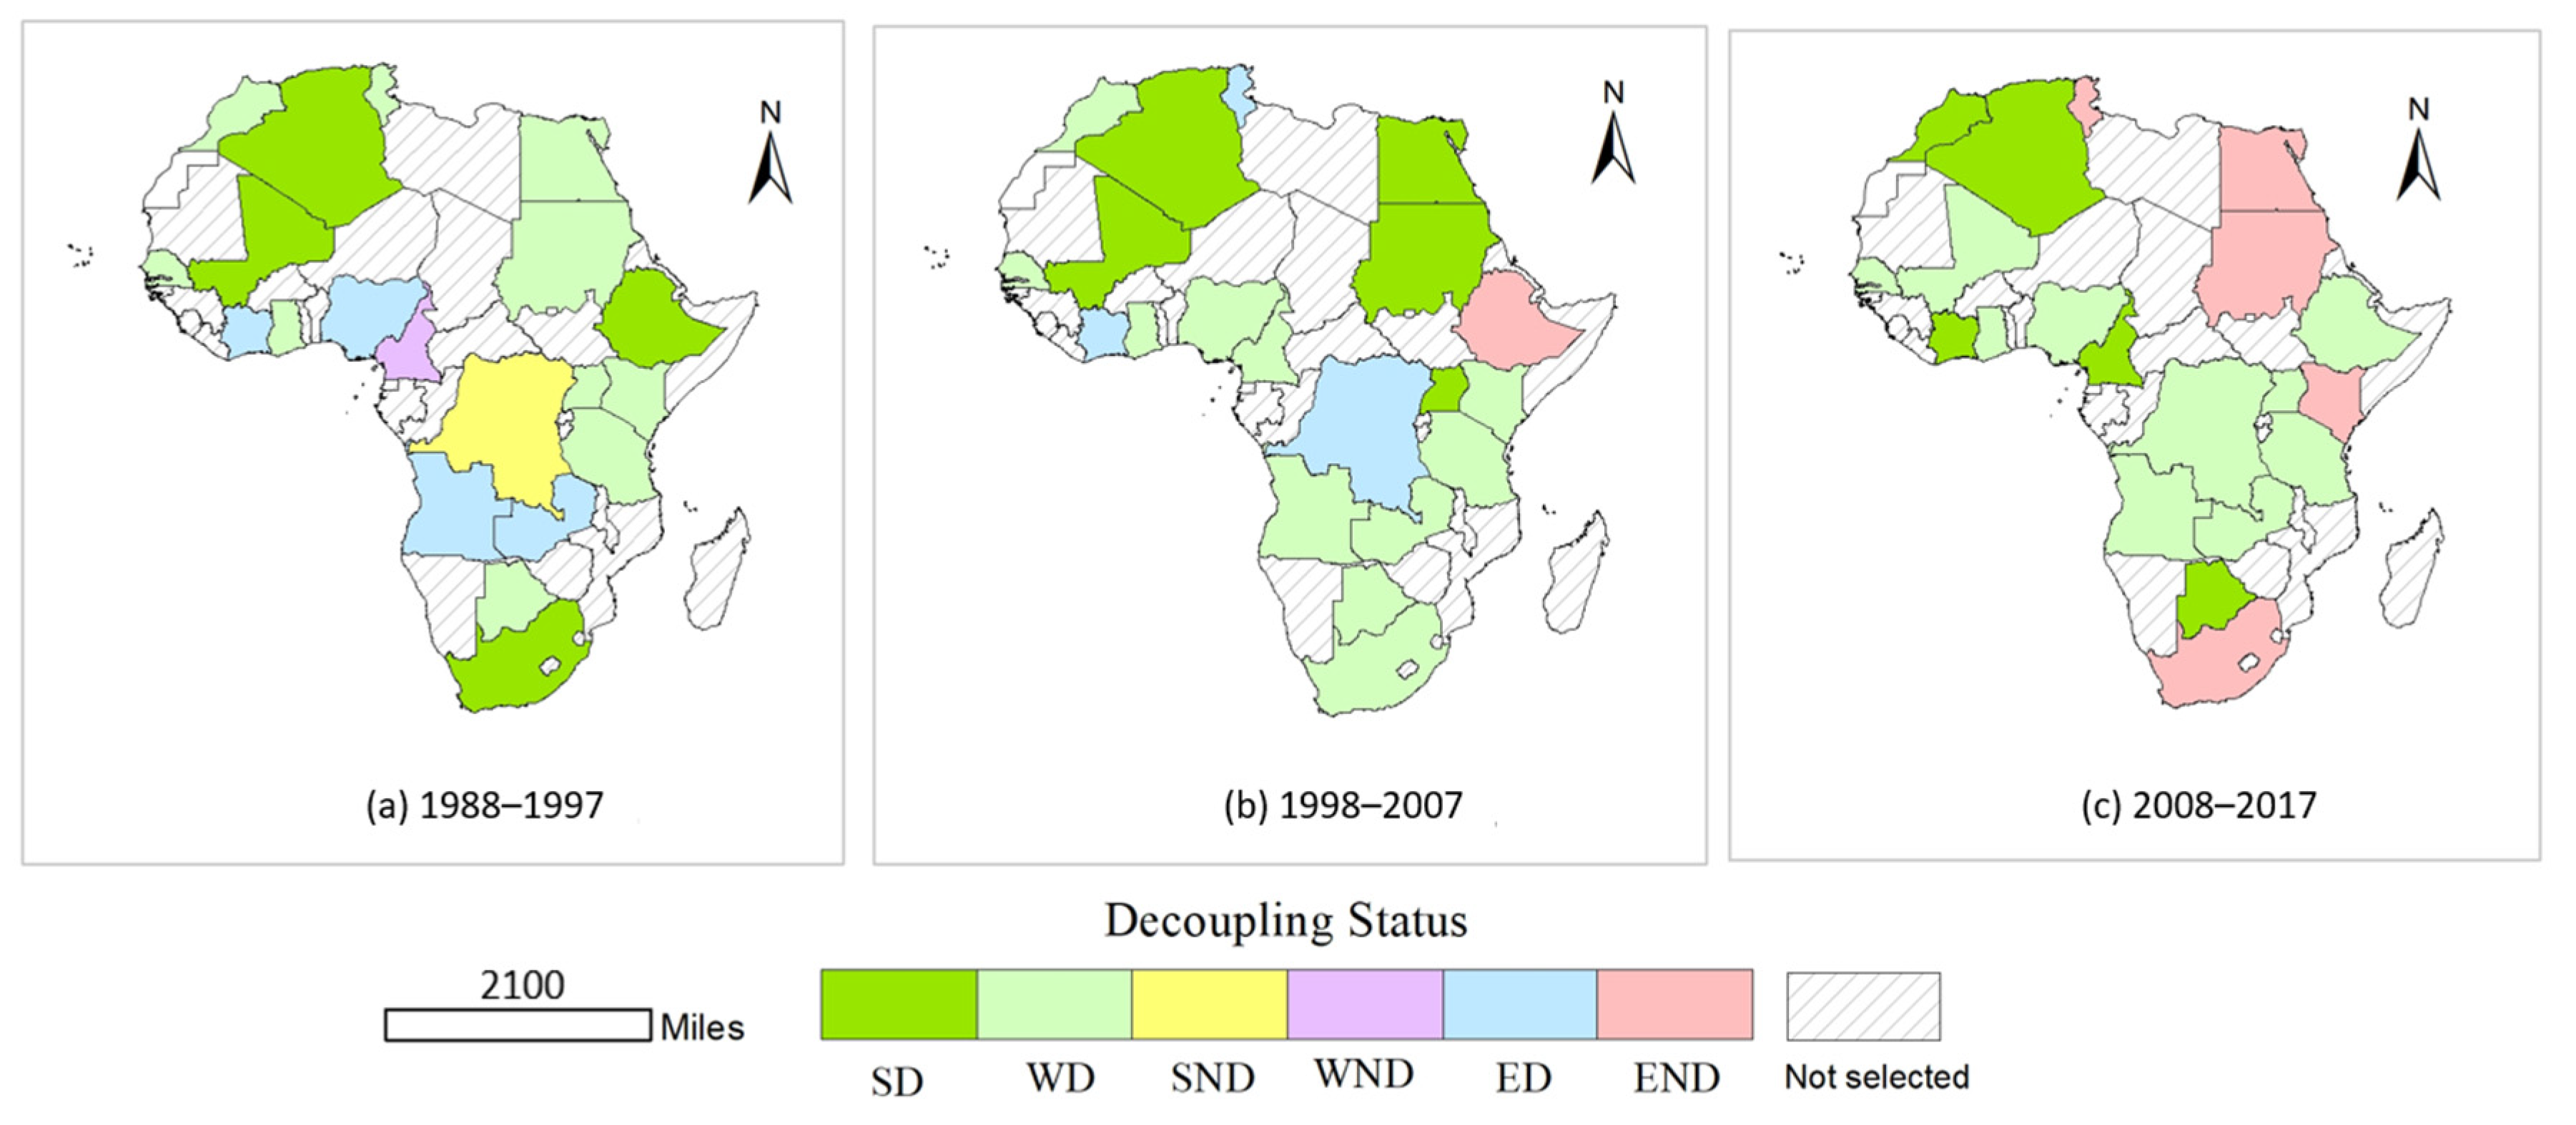
The decoupling results (Figure 4) reveal that the African economies in the three periods were different. Five decoupling states occurred during 1988–1998, followed by four states in 1998–2007, while only three decoupling states occurred in 2008–2017. This reveals the trend of the expansion of the economies during the latter period. The few states observed from 1998 could be a result of the United Nations Millennium Development Goals. The economies of many countries in Africa grew, and thus, decoupling states became evident.
During 1988–1997, the strong decoupling state occurred only in four countries: South Africa, Algeria, Mali, and Ethiopia. The mentioned countries showed that there was economic growth while they maintained their water use reduction. The weak decoupling occurred in half of the countries; this revealed that the economy grew, however, with increased industrial water use.
In the period of 1998–2007, there was positive GDP growth in all countries except Tunisia, the Ivory Coast, and the D.R. Congo, the countries in which an elastic coupling state occurred. Strong decoupling occurred in Algeria, Mali, Egypt, and Uganda, while the twelve countries experienced weak decoupling. The expansive negative decoupling state only occurred in Ethiopia during this period. The economy of Ethiopia rapidly expanded in this period from USD 2.2 billion to almost USD 10 billion. This expansive growth was accompanied by extensive water use and, hence, the expansive negative decoupling state.
There were only three states in the 2008–2017 period. Generally, the ‘good states’ (strong and weak decoupling) occurred in this period. The ‘good decoupling’ shows that there was economic growth with a reduction in industrial water use in five countries, while there was a moderate increase in water use in ten countries. Expansive negative decoupling occurred in South Africa, Kenya, Tunisia, Egypt, and Sudan. This shows increased GDP growth in these countries; however, the industrial water use increased faster than the GDP, hence the expansive negative decoupling state. Notably, Algeria was the only country to show a perfectly strong decoupling state throughout the period.

3.4. Decomposition Analysis of Industrial Water Withdrawal

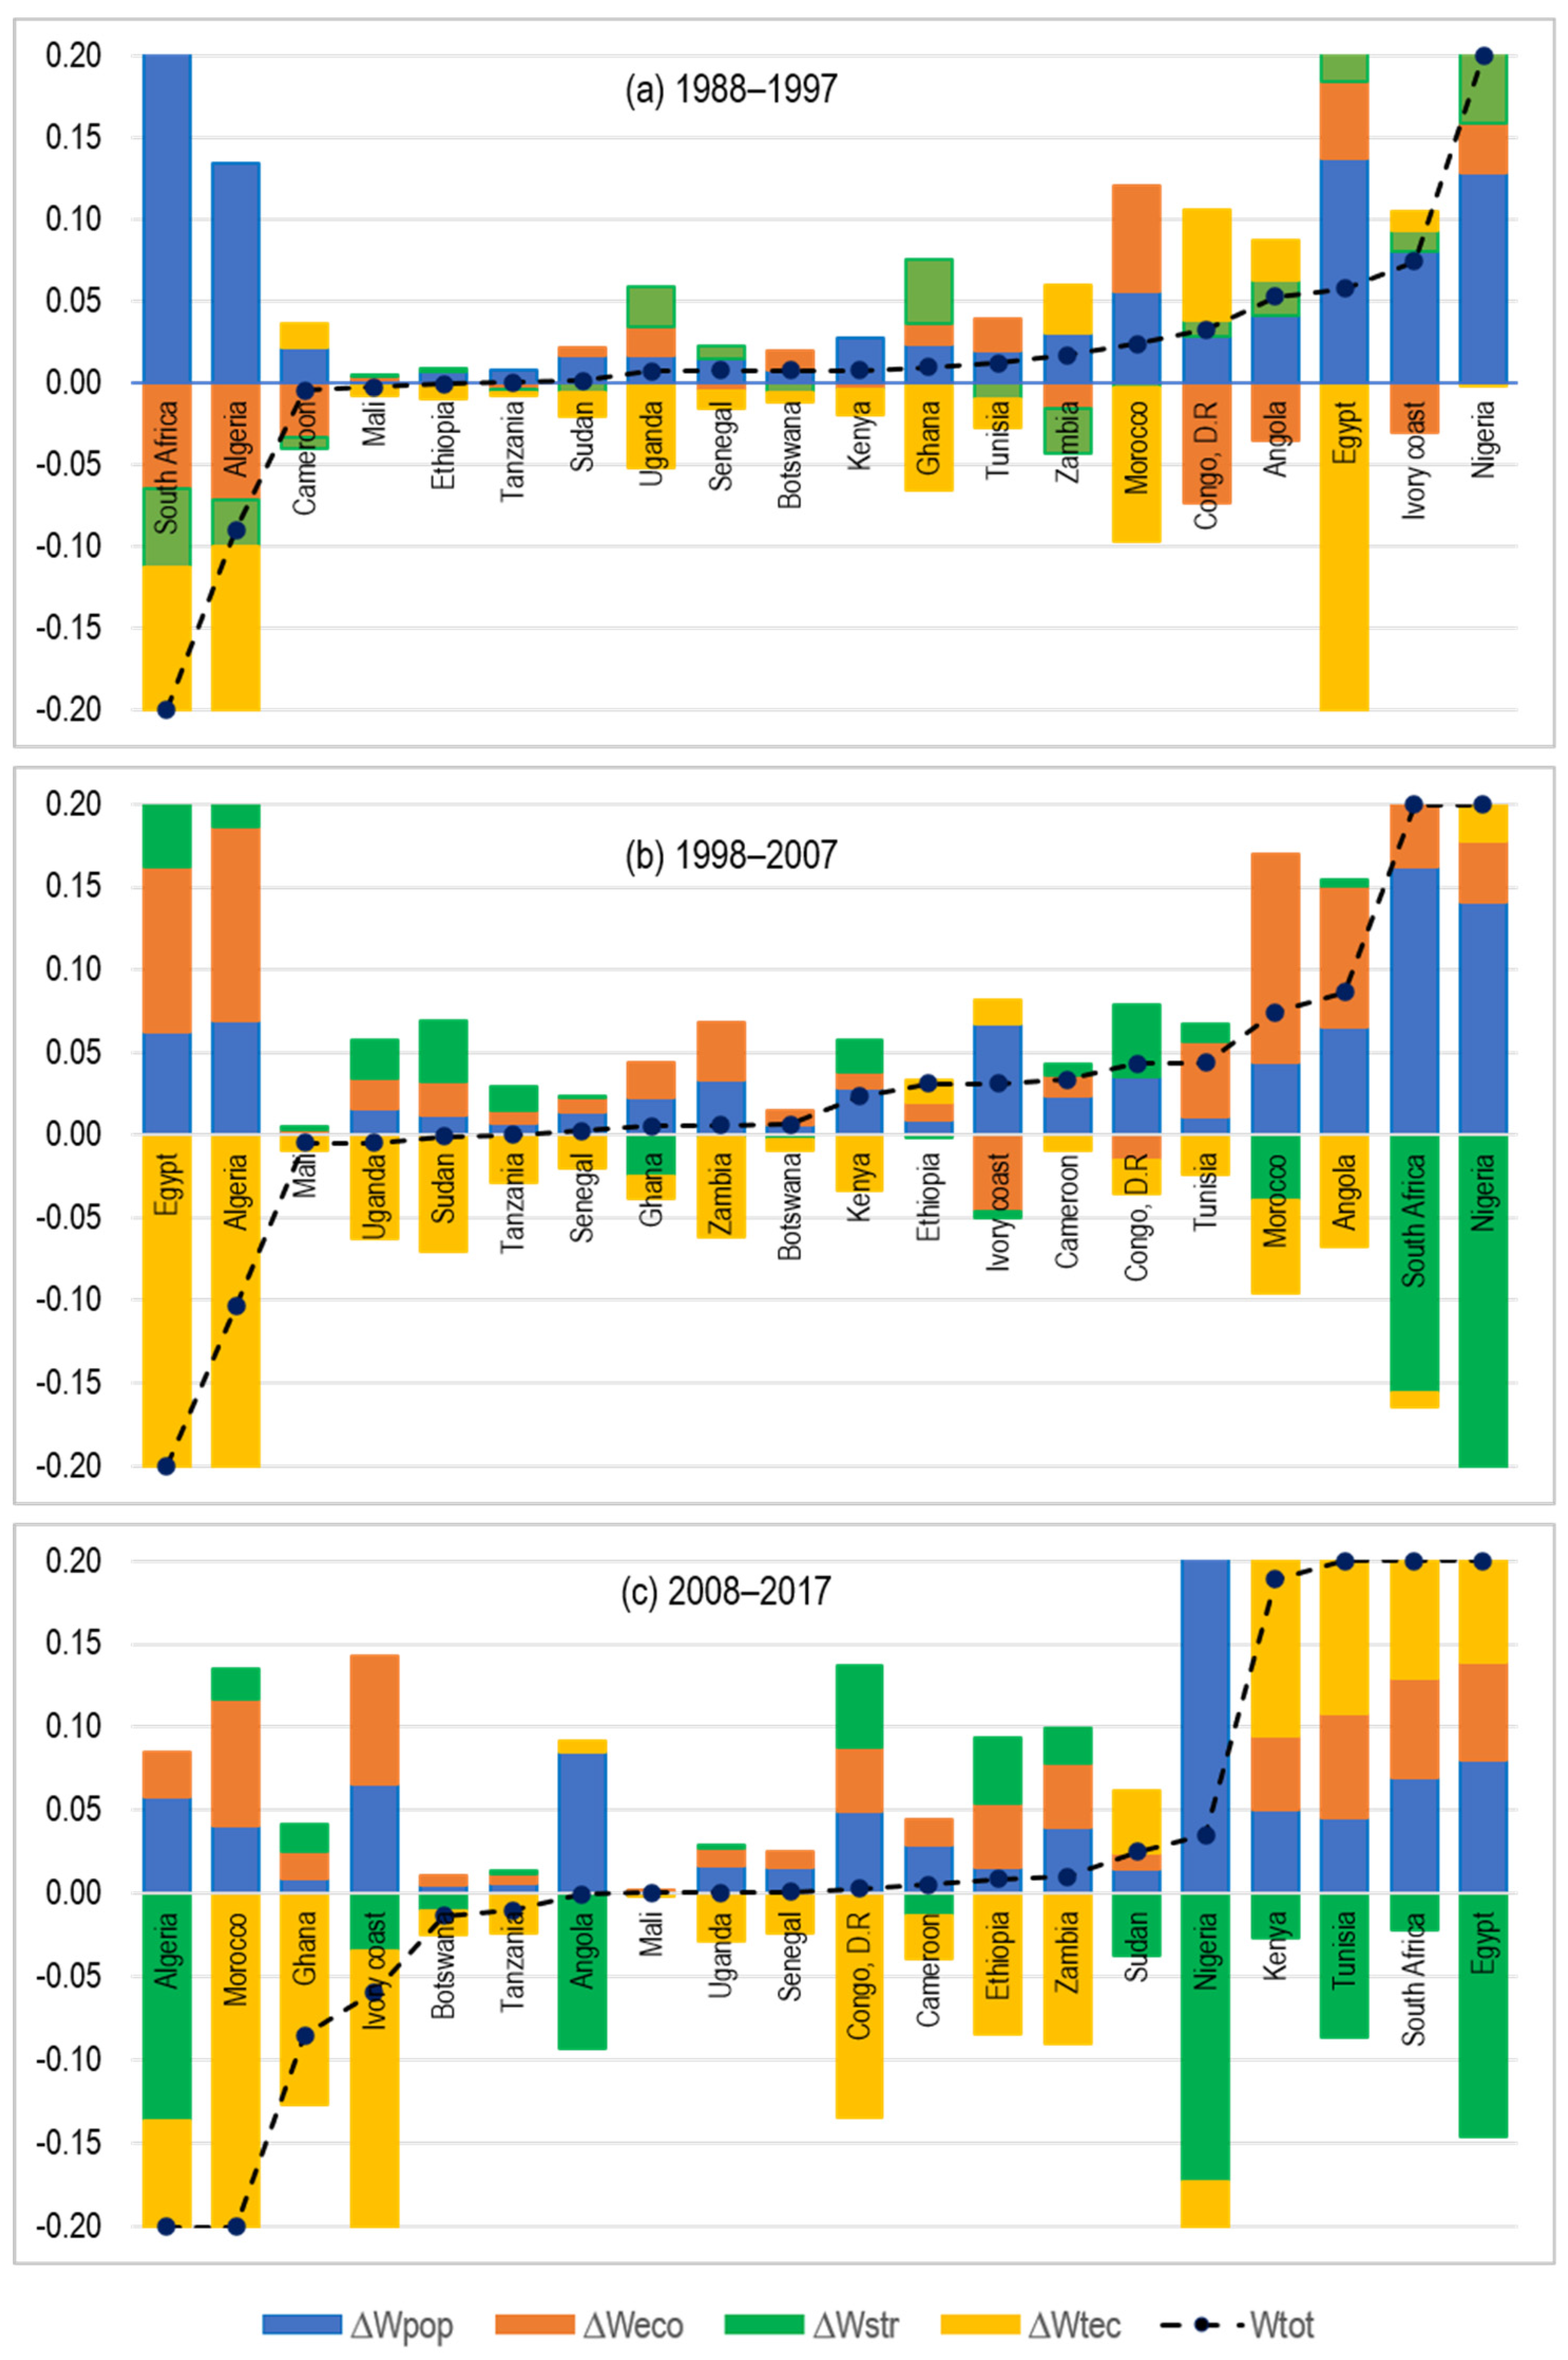
The population impact (∆Wpop), as shown in Figure 5, was more than zero and was a significant factor in promoting industrial water use in all the periods. During the three study periods, South Africa, Nigeria, and Egypt contributed the highest water use. It is worth noting that, though the population promoted water use in Algeria, the trend decreased from 0.134 km3 in the 1988–1997 period to 0.058 km3 in the period of 2008–2017.
The contribution of the technical effect fluctuated significantly from promoting water use to a reduction in the entire period. The variation was significant, with a reduction of up to −3.919 km3 and promotion of up to 2.332 km3. As illustrated in Figure 5, there was a significant promotion of water use in Angola and the D.R. Congo in 1988–1997 (0.024 and 0.068 km3, respectively). Other countries that promoted water use during this period include Cameroon, the Ivory Coast, Morocco, and Tunisia. The technology effect in the remaining countries contributed to reducing the water use in the same period, with a significant reduction observed in Egypt and Algeria (−3 to −4 km3). During 1998–2007, industrial technology reduced water use in all the countries except Ethiopia, Nigeria, and the Ivory Coast. In 2008–2017, the technical impact fluctuated drastically in promoting and reducing water use. Effective promotion of water use was observed in South Africa, Sudan, Tunisia, and Egypt, with a promotion of 0.12–2.5 km3. Other countries with significant promotion included Kenya, Mali, and Botswana, among others.
The spatial impact of the economic development on industrial water use illustrates that the economic development impact hindered the industrial water use in 1988–1997 in most countries. However, in successive periods, the economic structure shifted from inhibiting water use to promoting it. This observation is in tandem with the economic growth of these countries, as most countries saw an increase in GDP in 1998–2007 and 2007–2017, especially in the latter period. During 1998–2007, economic development promoted discharge by 0.06–1 km3 in South Africa, Angola, Nigeria, Algeria, and Egypt. It is worth noting that the economies of these countries increased drastically during this period.
The contribution of the industrial structure fluctuated from promoting water use and inhibiting it, and the trend was different from one period to another. In 1988–1997, industrial structure promoted water use in ten countries, though the contribution was minimal (0.0–0.02 km3). Egypt had a slightly higher contribution, followed by Nigeria. In the 1998–2007 period, as illustrated in Figure 5b, the variation in the fluctuation was more visible. The industrial structure led to water use reduction, especially in South Africa, Nigeria, Morocco, and Ghana. Similarly, it promoted water use in about eight countries, with Sudan, Egypt, the D.R. Congo, and Algeria experiencing a greater amount. During the 2008–2017 period, the industrial structure led to a reduction in water use in all countries except the D.R. Congo, Morocco, and Ghana. This illustrates that the industrial structure improved throughout the period in reducing industrial water use.
To explore further the impacts of the four drivers on industrial water use, the aggregate of the driving factors was calculated for each country, as illustrated in Figure 5a. It can be observed that the aggregate was negated only in Algeria, South Africa, Cameroon, and Mali during the 1988–1997 period, as shown in Figure 5a. This technology inhibited water use in most countries during this period, except in the D.R. Congo, Angola, Zambia, and Cameroon, where it had the opposite effect. The economic development and the population impact fluctuated during the period. All the drivers promoted water use in Nigeria, hence showing a more pronounced positive aggregate.
During the 2008–2017 period, as shown in Figure 5c, the aggregate of the drivers was positive in most countries compared with other periods. It can be noted that this was contributed to partially by the industrial structure, which shifted from inhibiting discharge in all countries in previous periods to promoting it, especially in Egypt, Kenya, South Africa, and Tunisia. The industrial structure inhibited the discharge in the other countries, and it led to a negative aggregate in Algeria, Morocco, Ghana, and the Ivory Coast, among other countries. It is also worth noting that the aggregate in Algeria was negative in all the periods due to the country’s sustainable water use and healthy economic growth.

4. Discussion

Technical factors did play a significant role in reducing water consumption, especially in the first two periods (1988–1997 and 1998–2007). However, the trend changed considerably in the 2008–2017 period as it became a negative force in Kenya, Tunisia, South Africa, and Egypt. These countries had water consumption increments of 172%, 500%, 201%, and 107% respectively. The rapid increase in water demand could not keep up with the pace of industrial technical adjustments; hence, more water was consumed per unit output. Industrial production should undergo transformation and adopt technological advancements to promote efficient water use, especially through recycling and reuse, particularly in water-scarce regions. The successful Water Reuse Pilot Project in the water-scarce region of Cape Verde (West Africa) [46] can be the blueprint for sustainable water consumption in a changing climate.
Industrial development was also a major driver promoting water use. Industrial growth greatly expanded between 20 and 40% in most countries during the study period, and the trend was expected to increase in the future by around 4.6% on average in 2022 and 2023. Industrial expansion, especially from 1998 to 2007, led to increased industrial water consumption in all countries except Algeria and Sudan. The industrial value added significantly led to reduced industrial water use in Algeria, Angola, Tunisia, Egypt, and Nigeria in the 2008–2017 period. The industrial growth in these countries shrank by 21%, 19%, 5%, 2%, and 2%, respectively. It is worth noting that the industrial contribution to economic growth in Algeria, Nigeria, Egypt, and Tunisia was significantly higher compared with other countries. The industrial structure was already at its peak by a small margin, and this could explain the reduced water withdrawal by this driver. The industrial structure in developed countries and some developing countries, including China, is increasing by a small margin, and this factor is inhibiting water consumption, unlike the case in developed countries.

5. Conclusions

Africa is the fastest-growing continent, with both demography and industrial water consumption in the region keeping an upward trend. The objective of this paper was to investigate whether industrial water use in African countries could be decoupled from economic growth and to analyze the driving factors behind this decoupling or coupling change. The main conclusions drawn from this study are as follows: Four groups of countries were identified based on their industrial water usage patterns. The cluster consisting of Algeria, Tunisia, Angola, and Morocco exhibited the highest average industrial water withdrawal per capita in 2017.
The decoupling status of industrial water withdrawal from economic growth improved notably throughout the study periods. From 2008 to 2017, fifteen countries achieved “desirable decoupling states” (strong decoupling or weak decoupling). However, five countries still experienced expansive negative decoupling, indicating that the peak of industrial water use had not yet been reached.
Economic development emerged as a primary driver promoting industrial water use in most countries. The contribution of economic development increased over the whole period. Similarly, population growth drove up water use in all countries during the 1998–2007 and 2008–2017 periods. The industrial structure effectively inhibited water withdrawal in the first two periods. Nonetheless, it promoted water use in five countries in the period of 2008–2017. While the technical driver promoted water use at the beginning, it increasingly inhibited water use in the recent period, particularly in Angola, Egypt, South Africa, and Algeria.
The competing water demands resulting from the continent’s shift toward an industrial-based economy, combined with population growth, economic expansion, and industrial structural changes, pose significant challenges. Several policy recommendations emerge for African countries to manage industrial water use more sustainably. First, proper planning is crucial to decouple industrial water consumption from excessive water intake by improving technology, transitioning to less water-intensive industries, enhancing efficiency, and reducing water waste. Second, integrating industrial water use into national water management strategies is crucial, ensuring that industrial growth does not compromise agricultural or domestic needs. Finally, regional cooperation and knowledge-sharing platforms can help countries with lower industrial water efficiency to learn from those with more advanced practices, fostering balanced and sustainable industrial development across the continent.

Author Contributions

All authors contributed to the study conception and design. Data curation, formal analysis, methodology, and original draft writing were performed by E.K. Writing—review and editing were performed by S.L. and D.O.M. Resources and research supervision were conducted by J.Z. Research supervision, funding acquisition, and writing—review and editing were performed by T.W. All authors have read and agreed to the published version of the manuscript.

Funding

This work was supported by the General Program of the National Natural Science Foundation of China (no. 71974144), the Major Program of the National Social Science Foundation of China (no. 21ZDA087), and the Open Fund of the Institute of Carbon Neutrality, Tongji University (20230012).

Data Availability Statement

The original contributions presented in this study are included in the article. Further inquiries can be directed to the corresponding author.

Conflicts of Interest

The authors have no relevant financial or non-financial interests to disclose.

References

  1. Haddeland, I.; Heinke, J.; Biemans, H.; Eisner, S.; Flörke, M.; Hanasaki, N.; Konzmann, M.; Ludwig, F.; Masaki, Y.; Schewe, J. Global water resources affected by human interventions and climate change. Proc. Natl. Acad. Sci. USA 2014, 111, 3251–3256. [Google Scholar] [CrossRef]
  2. Zhang, C.; Xu, J.; Chiu, Y.-H. Driving factors of water use change based on production and domestic dimensions in Jiangsu, China. Environ. Sci. Pollut. Res. 2020, 27, 33351–33361. [Google Scholar] [CrossRef]
  3. Veldkamp, T.; Wada, Y.; Aerts, J.; Döll, P.; Gosling, S.N.; Liu, J.; Masaki, Y.; Oki, T.; Ostberg, S.; Pokhrel, Y. Water scarcity hotspots travel downstream due to human interventions in the 20th and 21st century. Nat. Commun. 2017, 8, 15697. [Google Scholar] [CrossRef] [PubMed]
  4. Wada, Y.; Flörke, M.; Hanasaki, N.; Eisner, S.; Fischer, G.; Tramberend, S.; Satoh, Y.; van Vliet, M.T.H.; Yillia, P.; Ringler, C.; et al. Modeling global water use for the 21st century: The Water Futures and Solutions (WFaS) initiative and its approaches. Geosci. Model Dev. 2016, 9, 175–222. [Google Scholar] [CrossRef]
  5. Schewe, J.; Heinke, J.; Gerten, D.; Haddeland, I.; Arnell, N.W.; Clark, D.B.; Dankers, R.; Eisner, S.; Fekete, B.M.; Colón-González, F.J. Multimodel assessment of water scarcity under climate change. Proc. Natl. Acad. Sci. USA 2014, 111, 3245–3250. [Google Scholar] [CrossRef] [PubMed]
  6. Food and Agriculture Organization of the United Nations (FAO). AQUASTAT MainDatabase. 2016. Available online: http://www.fao.org/nr/water/aquastat/tables/WorldData-Withdrawal_eng.pdf (accessed on 10 September 2022).
  7. Fujimori, S.; Hanasaki, N.; Masui, T. Projections of industrial water withdrawal under shared socioeconomic pathways and climate mitigation scenarios. Sustain. Sci. 2017, 12, 275–292. [Google Scholar] [CrossRef]
  8. Signé, L. The Potential of Manufacturing and Industrialization in Africa: Trends, Opportunities, and Strategies; Brookings: Washington, DC, USA, 2018. [Google Scholar]
  9. Coulibaly, B.S. Foresight Africa: Top priorities for the continent 2020 to 2030; Africa Growth Initiative; Brookings: Washington, DC, USA, 2020. [Google Scholar]
  10. Busby, J.W.; Smith, T.G.; White, K.L.; Strange, S.M. Locating climate insecurity: Where are the most vulnerable places in Africa? In Climate Change, Human Security and Violent Conflict; Springer: Berlin/Heidelberg, Germany, 2012; pp. 463–511. [Google Scholar]
  11. Adu, D.T.; Denkyirah, E.K. Economic Growth and Environmental Pollution in West Africa: Testing the Environmental Kuznets Curve Hypothesis. Kasetsart J. Soc. Sci. 2018, 40, 281–288. Available online: https://so04.tci-thaijo.org/index.php/kjss/article/view/242142 (accessed on 3 March 2024). [CrossRef]
  12. Flörke, M.; Kynast, E.; Bärlund, I.; Eisner, S.; Wimmer, F.; Alcamo, J. Domestic and industrial water uses of the past 60 years as a mirror of socio-economic development: A global simulation study. Glob. Environ. Change 2013, 23, 144–156. [Google Scholar] [CrossRef]
  13. Willet, J.; Wetser, K.; Vreeburg, J.; Rijnaarts, H. Industry. Review of methods to assess sustainability of industrial water use. Water Resour. Ind. 2019, 21, 100110. [Google Scholar] [CrossRef]
  14. Weizsäcker, E.U.v. Erdpolitik: Ökologische Realpolitik an der Schwelle zum Jahrhundert der Umwelt; Büchergilde Gutenberg: Frankfurt am Main, Germany, 1990. [Google Scholar]
  15. Wang, X.; Li, R. Is urban economic output decoupling from water use in developing countries?—Empirical analysis of Beijing and Shanghai, China. Water 2019, 11, 1335. [Google Scholar] [CrossRef]
  16. Organisation for Economic Co-operation and Development. OECD Environmental Strategy for the First Decade of the 21st Century: Adopted by OECD Environmental Ministers; OECD: Paris, France, 2001. [Google Scholar]
  17. Tapio, P. Towards a theory of decoupling: Degrees of decoupling in the EU and the case of road traffic in Finland between 1970 and 2001. Transp. Policy 2005, 12, 137–151. [Google Scholar] [CrossRef]
  18. Shuai, C.; Chen, X.; Wu, Y.; Zhang, Y.; Tan, Y. A three-step strategy for decoupling economic growth from carbon emission: Empirical evidences from 133 countries. Sci. Total Environ. 2019, 646, 524–543. [Google Scholar] [CrossRef] [PubMed]
  19. Wu, Y.; Chau, K.; Lu, W.; Shen, L.; Shuai, C.; Chen, J. Decoupling relationship between economic output and carbon emission in the Chinese construction industry. Environ. Impact Assess. Rev. 2018, 71, 60–69. [Google Scholar] [CrossRef]
  20. Li, Y.; Luo, Y.; Wang, Y.; Wang, L.; Shen, M. Decomposing the decoupling of water consumption and economic growth in China’s textile industry. Sustainability 2017, 9, 412. [Google Scholar] [CrossRef]
  21. Xing, Z.; Wang, J.; Feng, K.; Hubacek, K.J. Decomposition and attribution analysis for assessing the progress in decoupling industrial development from wastewater discharge in China. J. Clean. Prod. 2020, 266, 121789. [Google Scholar] [CrossRef]
  22. Zhang, Y.; Liu, W.; Cai, Y.; Khan, S.U.; Zhao, M. Decoupling analysis of water use and economic development in arid region of China–based on quantity and quality of water use. Sci. Total Environ. 2021, 761, 143275. [Google Scholar] [CrossRef]
  23. Wang, Q.; Jiang, R.; Li, R. Decoupling analysis of economic growth from water use in City: A case study of Beijing, Shanghai, and Guangzhou of China. Sustain. Cities 2018, 41, 86–94. [Google Scholar] [CrossRef]
  24. Ang, B.W. Decomposition analysis for policymaking in energy:: Which is the preferred method? Energy Policy 2004, 32, 1131–1139. [Google Scholar] [CrossRef]
  25. Yang, H.; Zehnder, A. “Virtual water”: An unfolding concept in integrated water resources management. Water Resour. Res. 2007, 43, W12301. [Google Scholar] [CrossRef]
  26. Shang, Y.; Lu, S.; Li, X.; Sun, G.; Shang, L.; Shi, H.; Lei, X.; Ye, Y.; Sang, X.; Wang, H. Drivers of industrial water use during 2003–2012 in Tianjin, China: A structural decomposition analysis. J. Clean. Prod. 2017, 140, 1136–1147. [Google Scholar] [CrossRef]
  27. Wang, Q.; Wang, X. Moving to economic growth without water demand growth—A decomposition analysis of decoupling from economic growth and water use in 31 provinces of China. Sci. Total Environ. 2020, 726, 138362. [Google Scholar] [CrossRef]
  28. Ma, B.; Tian, G.; Kong, L.; Research, P. Spatial-temporal characteristics of China’s industrial wastewater discharge at different scales. Environ. Sci. Pollut. Res. 2020, 27, 8103–8118. [Google Scholar] [CrossRef] [PubMed]
  29. Yang, J.; Chen, X. Quantification of the driving factors of water use in the productive sector change using various decomposition methods. Water Resour. Manag. 2019, 33, 4105–4121. [Google Scholar] [CrossRef]
  30. Shang, Y.; Wang, J.; Ye, Y.; Lei, X.; Gong, J.; Shi, H. An analysis of the factors that influence industrial water use in Tianjin, China. Int. J. Water Resour. Dev. 2017, 33, 81–92. [Google Scholar] [CrossRef]
  31. Zhang, C.; Zhong, L.; Wang, J. Decoupling between water use and thermoelectric power generation growth in China. Nat. Energy 2018, 3, 792–799. [Google Scholar] [CrossRef]
  32. Jia, C.; Yan, P.; Liu, P.; Li, Z.J.R.; Reviews, S.E. Energy industrial water withdrawal under different energy development scenarios: A multi-regional approach and a case study of China. Sustain. Energy Rev. 2021, 135, 110224. [Google Scholar] [CrossRef]
  33. Avelino, A.F.T.; Dall’erba, S. What Factors Drive the Changes in Water Withdrawals in the US Agriculture and Food Manufacturing Industries between 1995 and 2010? Environ. Sci. Technol. 2020, 54, 10421–10434. [Google Scholar] [CrossRef]
  34. Engo, J.; Research, P. Driving forces and decoupling indicators for carbon emissions from the industrial sector in Egypt, Morocco, Algeria, and Tunisia. Environ. Sci. Pollut. Res. 2021, 28, 14329–14342. [Google Scholar] [CrossRef]
  35. Simbi, C.H.; Lin, J.; Yang, D.; Ndayishimiye, J.C.; Liu, Y.; Li, H.; Xu, L.; Ma, W. Decomposition and decoupling analysis of carbon dioxide emissions in African countries during 1984–2014. J. Environ. Sci. 2021, 102, 85–98. [Google Scholar] [CrossRef]
  36. Achraf, A.; Boudhar, S.; Lechheb, H.; Ouakil, H. Sectoral water footprint dynamics: An input-output structural decomposition analysis for Morocco. E3S Web Conf. 2021, 234, 00041. [Google Scholar] [CrossRef]
  37. Zhou, F.; Bo, Y.; Ciais, P.; Dumas, P.; Tang, Q.; Wang, X.; Liu, J.; Zheng, C.; Polcher, J.; Yin, Z. Deceleration of China’s human water use and its key drivers. Proc. Natl. Acad. Sci. USA 2020, 117, 7702–7711. [Google Scholar] [CrossRef]
  38. Zhao, X.; Liu, J.; Liu, Q.; Tillotson, M.R.; Guan, D.; Hubacek, K. Physical and virtual water transfers for regional water stress alleviation in China. Proc. Natl. Acad. Sci. USA 2015, 112, 1031–1035. [Google Scholar] [CrossRef]
  39. FAO. AQUASTAT—FAO’s Global Information System on Water and Agriculture. 2019. Available online: http://www.fao.org/aquastat/en/ (accessed on 2 March 2024).
  40. World Bank. World Bank Development Indicators (WDI). National Accounts Data, and OECD National Accounts Data. Available online: https://databank.worldbank.org/source/world-development-indicators (accessed on 1 August 2023).
  41. Everitt, B.S.; Landau, S.; Leese, M.; Stahl, D. Cluster Analysis; Wiley: Hoboken, NJ, USA, 2011. [Google Scholar]
  42. Murtagh, F.; Legendre, P. Ward’s hierarchical agglomerative clustering method: Which algorithms implement Ward’s criterion? J. Classific. 2014, 31, 274–295. [Google Scholar] [CrossRef]
  43. Kacperska, E.; Łukasiewicz, K.; Pietrzak, P. Use of renewable energy sources in the European Union and the Visegrad Group countries—Results of cluster analysis. Energies 2021, 14, 5680. [Google Scholar] [CrossRef]
  44. Kaya, Y. Impact of carbon dioxide emission control on GNP growth: Interpretation of proposed scenarios. In Proceedings of the Intergovernmental Panel on Climate Change, Washington, DC, USA, 30 January–2 February1989. [Google Scholar]
  45. Zhang, T.; Wang, X.; Qi, G.; Shahid, S.; Kang, Y.; Wu, H.; Zhang, X. Analysis of the Decoupling State and Driving Effects of Economic Development and Production Water Use in Jiangsu Province, China. Sustainability 2023, 15, 10258. [Google Scholar] [CrossRef]
  46. Mendoza-Grimón, V.; Fernández-Vera, J.R.; Silva, G.D.; Semedo-Varela, A.; Palacios-Díaz, M.d.P. Cape Verde (West Africa) Successful Water Reuse Pilot Project: A Sustainable Way for Increasing Food Production in a Climate Change Scenario. Water 2021, 13, 160. [Google Scholar] [CrossRef]
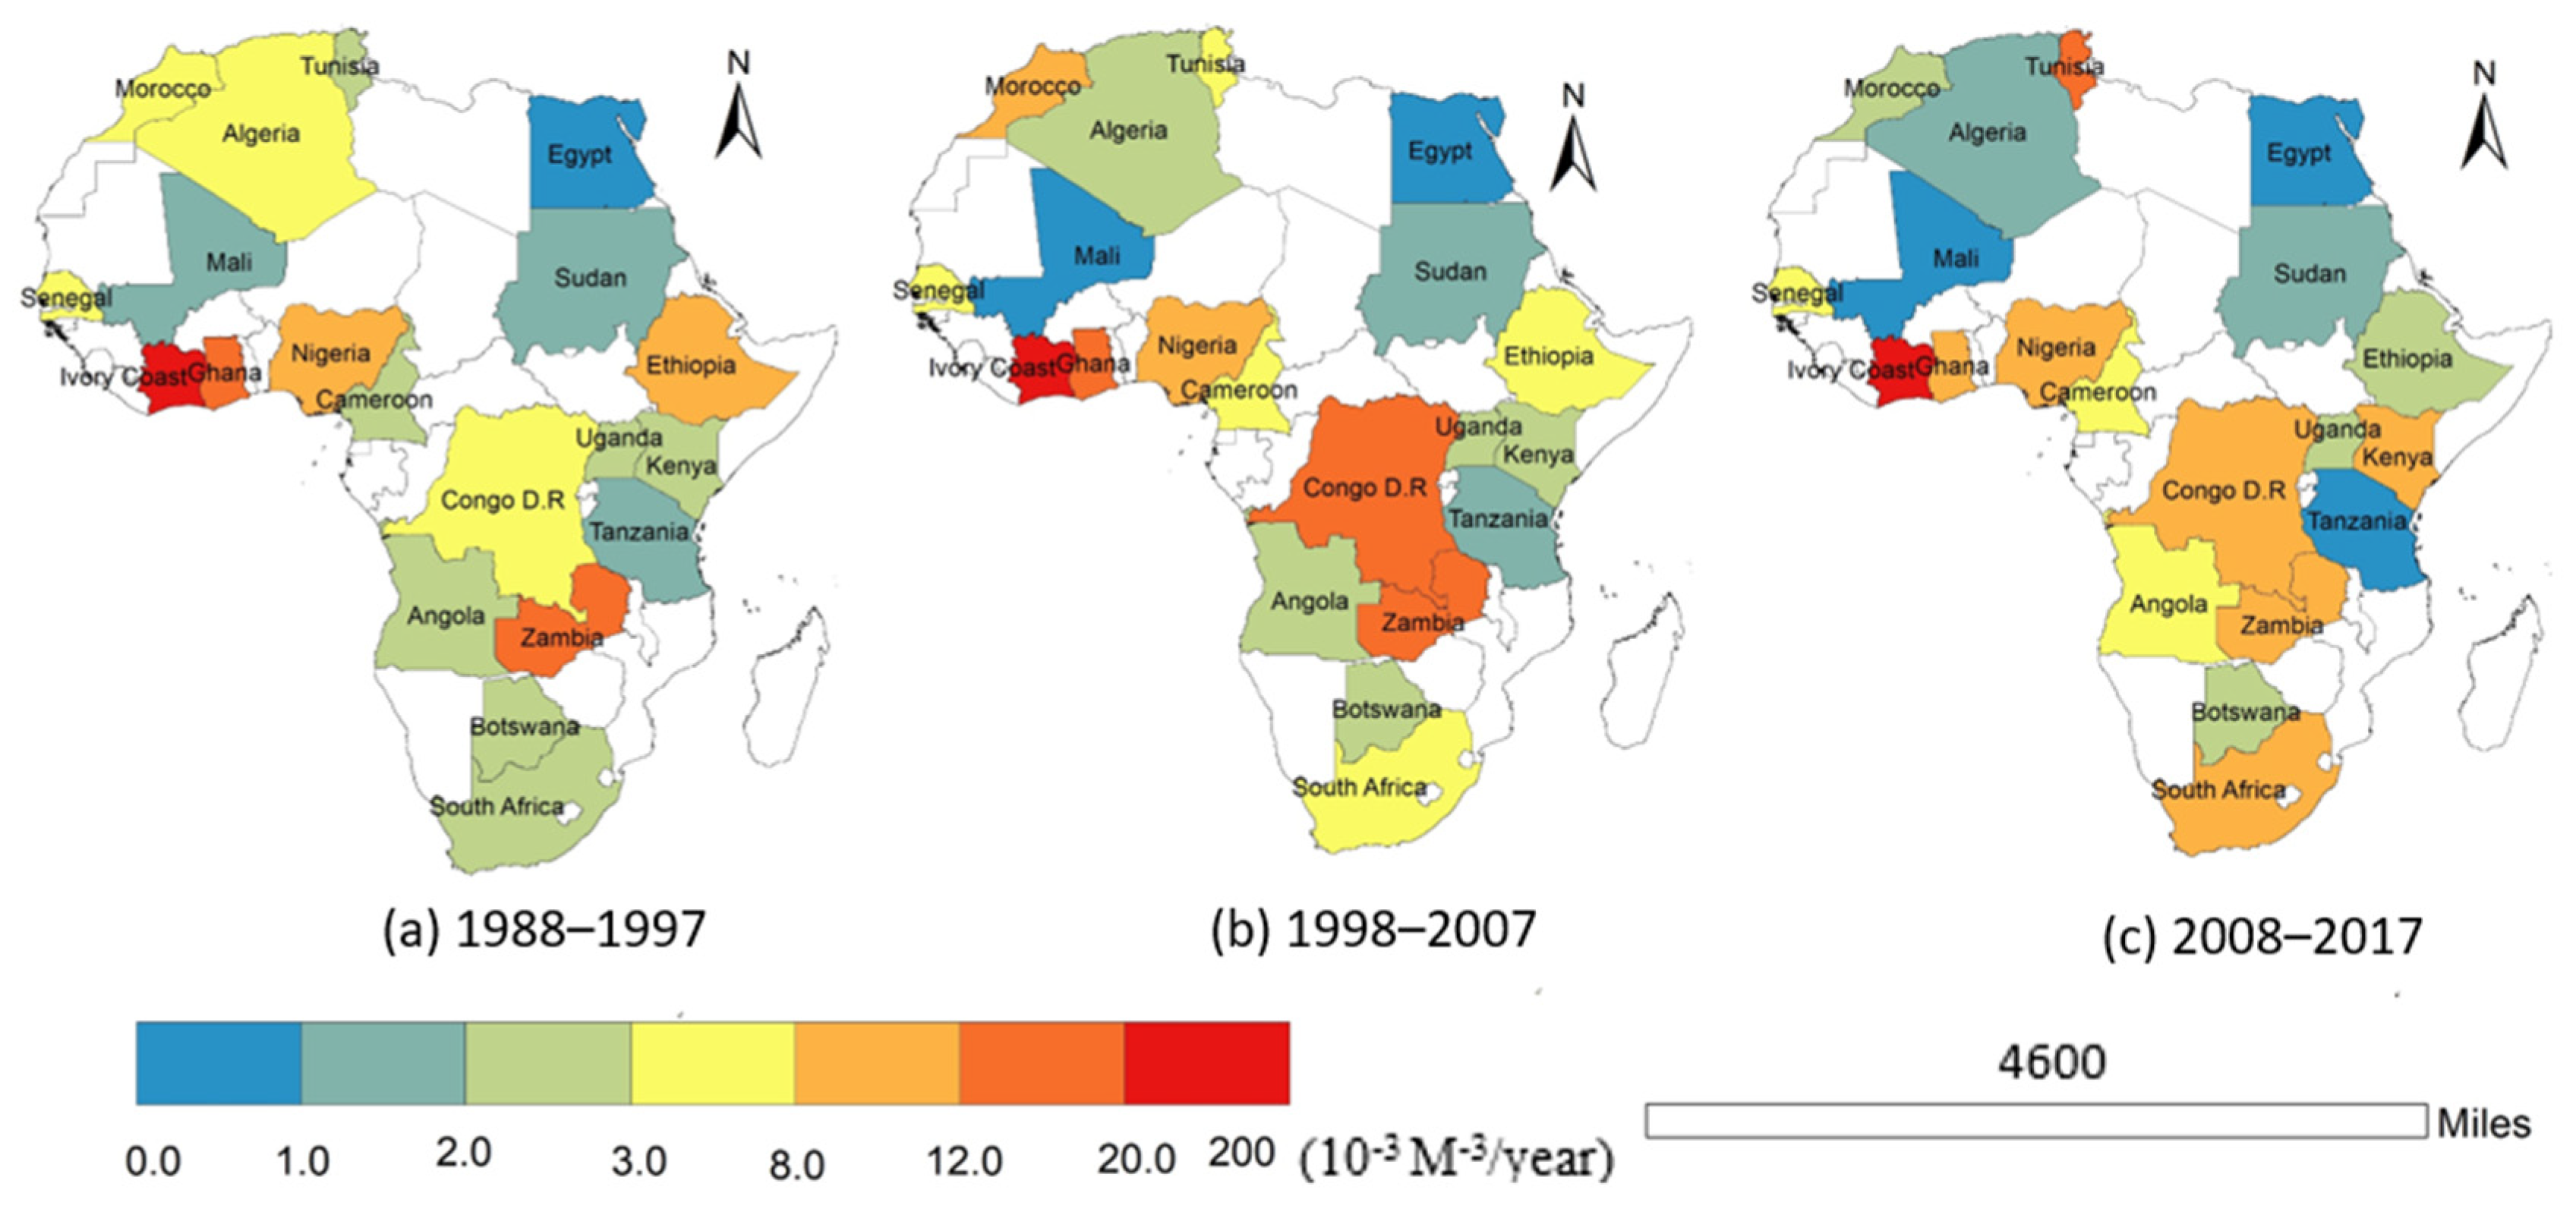
Figure 1. The trends of industrial water use per capita in 20 African countries.
Water 17 03313 g001
Figure 2. Tree diagram: hierarchical cluster analysis of industrial water use in selected African countries in the year of 2017.
Water 17 03313 g002
Figure 3. Graph of amalgamation schedule.
Water 17 03313 g003
Figure 4. The decoupling states of 20 African countries. SD—strong decoupling; WD—weak decoupling; SND—strong negative decoupling; WND—weak negative decoupling; END—expansive negative decoupling; and RD—recessive decoupling.
Water 17 03313 g004
Figure 5. The contribution of the factors influencing industrial water use. (a) shows the contribution in the 1988–1997 period, (b) shows the contribution in the 1998–2007 period, and (c) refers to the contribution in 2008–2017. Note: Some Y-values for Nigeria, South Africa, Egypt, Tunisia, Kenya, and Algeria were truncated (−0.2 to 0.2).
Water 17 03313 g005
Table 1. The description of the selected countries.
RegionPopulation (Million)Population Growth (%)Urbanization Rate (%)Area (Million km2)Selected Countries
Northern254.051.5652.47.76Egypt, Tunisia, Morocco, Sudan, and Algeria
Eastern467.442.7147.76.67Kenya, Ethiopia, Uganda, and Tanzania
Middle Africa189.563.1050.56.50D.R. Congo, Angola, and Cameroon
Southern69.171.4064.72.65South Africa, Botswana, and Zambia
Western421.562.7047.76.06Senegal, Mali, Ivory Coast, Nigeria, and Ghana
Table 2. Decoupling standards for making judgments of Tapio’s model.
Degree of Decoupling/CouplingΔWΔGΔdi
Strong decoupling (SD)<0>0<0
Weak decoupling (WD)>>0>>0>>0
Expansive coupling (EC)>0>00.8> >>0
Expansive negative decoupling (END)>0>0>1.2
Strong negative decoupling (SND)<0<0<0
Weak negative decoupling (WND)<0<00.8> >0
Recessive coupling (RC)<0<01.2> >0.8
Recessive decoupling (RD)<0<0>1
Note: ΔW: the variation in industrial water consumption; ΔG: the variation in the industrial economic output; Δdi: the decoupling elasticity of water consumption and economic growth.
Disclaimer/Publisher’s Note: The statements, opinions and data contained in all publications are solely those of the individual author(s) and contributor(s) and not of MDPI and/or the editor(s). MDPI and/or the editor(s) disclaim responsibility for any injury to people or property resulting from any ideas, methods, instructions or products referred to in the content.