Article

Simulation of the Telluric Electrical Field Frequency Selection Method and Its Application in Mineral Water Exploration

1
School of Earth Sciences and Spatial Information Engineering, Hunan University of Science and Technology, Xiangtan 411201, China
2
Changsha Institute of Mining Research Co., Ltd., Changsha 410012, China
3
State Key Laboratory of Safety Technology of Metal Mines, Changsha 410012, China
4
Department of Physics, Covenant University, Ota 112104, Nigeria
*
Authors to whom correspondence should be addressed.
Water 2025, 17(22), 3314; https://doi.org/10.3390/w17223314
Submission received: 18 October 2025 / Revised: 11 November 2025 / Accepted: 17 November 2025 / Published: 20 November 2025

Abstract

In practical engineering geophysics, anomalous bodies are typically three-dimensional (3-D) structures, making it inaccurate to represent the subsurface geoelectric model using a two-dimensional (2-D) assumption. Furthermore, the underlying mechanism of the telluric electrical field frequency selection method (TEFSM) remains insufficiently understood. To address these limitations, this study presents a 3-D forward modeling algorithm based on the edge-based finite element method to solve the TEFSM forward problem. This paper also investigates the application of TEFSM in mineral water exploration, striving to minimize the influence of strong electromagnetic interference sources such as high-voltage power lines. Specifically, the paper presents the forward theory of TEFSM and analyzes the causes of galvanic distortion, particularly static shift. Numerical simulations examine the response characteristics of anomalous bodies and the influence of galvanic distortion. The results indicate that galvanic distortion enhances shallow local anomalies in the modulus of the electric field while masking deeper targets. In contrast, the phase of the electric field effectively reflects deeper anomalous bodies and is minimally affected by galvanic distortion. Future improvements in frequency selectors may enable reliable phase measurements, thereby enhancing data interpretability. Subsequently, the TEFSM was applied to field data collected during mineral water exploration. The field test results confirm the effectiveness of TEFSM and demonstrate that it is a portable, simple, low-cost, and highly efficient method for groundwater detection.

1. Introduction

The frequency selection method (FSM) is short for the telluric electric field frequency selection method (TEFSM) [1], which utilizes natural electromagnetic (EM) fields to investigate subsurface electrical structures [2]. The source field in magnetotellurics (MT) originates from natural electromagnetic fields generated primarily by ionospheric currents at high altitudes and equatorial lightning activity. The theoretical foundation of TEFSM is similar to that of MT [3,4], but it differs in data acquisition methodology [5,6]. In TEFSM, measurement frequencies are predetermined and corresponding filter channels are preconfigured in hardware. Natural electromagnetic methods share a common fundamental principle: their primary field is an electromagnetic wave propagating vertically downward into the Earth’s subsurface. MT requires the measurement of orthogonal electric and magnetic field components at the surface, followed by the calculation of apparent resistivity using Cagniard’s (1953) formula [7]. In contrast, TEFSM only requires the measurement of a single horizontal electric field component to invert subsurface geological structures.
Liang (1976) first introduced the electric pulse natural electric field method in Karst Geology of Guangxi [8,9]. Since then, various related methods have been proposed, including the stray current method, sound frequency geoelectric field method, natural low-frequency electric field method, audio frequency telluric electricity method, underground magnetic fluid detection method, and frequency selection method of telluric current, among others. These methods share a common theoretical basis and are now collectively referred to as the frequency selection method (FSM) [10,11,12].
Field procedures for TEFSM and MT are similar; however, TEFSM measures only the horizontal components of the surface electric field at specific EM signal frequencies. This is analogous to measuring the electric field component under transverse magnetic (TM) polarization in MT when the survey line is perpendicular to the geological strike in two-dimensional settings [13,14]. In its early development, TEFSM systems typically measured only one or a few discrete frequencies—for example, the DC-1 frequency selector measured just five frequencies [11]. With advances in computer hardware, modern frequency selectors can now simultaneously measure dozens of frequencies within the 10–5000 Hz range. Due to their portability, ease of operation, and high efficiency, TEFSM instruments have been widely applied in engineering geophysics, particularly in shallow groundwater exploration and water hazard detection [11,15,16,17]. Previous research has primarily focused on instrument development and practical applications [10,18,19,20]. Recent studies suggest that TEFSM achieves favorable results in groundwater exploration, potentially due to its sensitivity to galvanic-type distortion phenomena—commonly known as static shifts—in natural EM fields [13]. Galvanic distortion arises from near-surface localized electrical heterogeneities that alter both the direction and magnitude of the electric field [21,22]. In MT studies, such distortion manifests as steep anomalies in apparent resistivity pseudo-sections [23,24] and significantly impacts inversion accuracy [25,26]. Given that TEFSM is typically used for shallow investigations—usually less than 300 m depth in groundwater applications [11], it is well-suited for detecting shallow subsurface anomalies using galvanic distortion effects [27]. Furthermore, TEFSM is often deployed in urban or culturally noisy environments with strong electromagnetic interference, especially near high-voltage power lines. To address this, we propose a practical field measurement scheme designed to minimize interference from such sources.
This study investigates the influence of galvanic distortion on TEFSM responses using multiple three-dimensional synthetic models, building upon earlier two-dimensional analyses [13]. The edge-based finite element method is employed to solve the TEFSM forward problem. Finally, the method is applied to a mineral water exploration case study.

2. Basic Theory

2.1. Three-Dimensional Forward Modeling Theory of TEFSM

We assume a time dependence of e i ω t , and the frequency-domain electromagnetic field equations for TEFSM can be expressed as [23]:
× E = i ω μ 0 H ,
× H = σ E ,
where E and H denote the electric and magnetic fields, respectively, σ represents conductivity, ω is the angular frequency, μ 0 is the permeability of free space, and i is the imaginary unit.
Given that TEFSM operates at frequencies generally below 104 Hz, the displacement current can be neglected. Through appropriate mathematical manipulation of Equations (1) and (2), the vector Helmholtz equation for the electric field is derived as follows:
× × E i ω μ 0 σ E = 0 .
Homogeneous Dirichlet boundary conditions of the first kind are applied:
n × E = n × E 0 ,
where n is the outward normal vector to the boundary mesh, and E 0 denotes the analytical electric field response of a one-dimensional background medium on the boundary.

2.2. Finite Element Method with Unstructured Tetrahedral Mesh

Given that unstructured tetrahedral meshes can accurately represent complex topography and irregularly shaped anomalous bodies, we employ such a mesh to discretize the computational domain. Within each tetrahedral element, the electric field can be expressed as:
E = k = 1 6 N k E k
where E k denotes the tangential electric field value defined on the k-th edge, and N k is the corresponding vector shape function. A first-order shape function is adopted in Equation (6) for simplicity. If the k-th edge connects nodes k 1 and k 2 , the shape function N k is given by:
N k = L k 1 L k 2 L k 2 L k 1 l k ,
where l k represents the length of the k-th edge, L k 1 and L k 2 are the local coordinates of nodes k 1 and k 2 on the k-th edge, respectively. The curl of the vector shape function N k can then be written as:
× N k = 2 L k 1 × L k 2 .
Using finite element analysis, the discrete form of Equation (3) is formulated as:
A x = b ,
where A is the stiffness matrix, b is the right-hand side vector, and x represents the unknown electric field values on the edges. To solve this system efficiently, the MKL Pardiso parallel direct solver is employed. Since solutions at different frequencies are independent, parallel computation significantly enhances computational efficiency.
The edge-based finite element method builds upon the usual finite element method by discretizing only the domain boundaries and approximating the solution across the entire domain through boundary unknowns, resulting in higher solution accuracy.

2.3. Physical Significance of Galvanic Distortion

In frequency-domain electromagnetic methods, the presence of small-scale shallow electrical anomalies leads to distortion of the observed electric field—a phenomenon known as galvanic distortion [28]. This distortion arises when localized subsurface inhomogeneities disrupt the uniformity of horizontal current density in the medium, resulting in localized amplification or attenuation of the electric field [29]. Galvanic distortion is inherent in frequency-domain electromagnetic surveys and may lead to misinterpretation in areas with strong distortion effects [30].
Galvanic distortion results from the superposition of the background electric field—generated by regional geological structures—and the scattering field produced by charge accumulation at small-scale heterogeneous interfaces near the surface [31,32]. The total electric field E r at any point r can be described as [33]:
E r = E 0 r + i ω μ k V k g r , r δ σ k r E r d V + 1 σ 0 r · k V k g r , r δ σ k r E r d V
E r = E 0 r + e 1 r + e G r ,
where σ 0 r is the conductivity of the background medium, σ k r is the conductivity of the k-th scatterer, and δ σ k r = σ k r σ 0 r . These local 3D scatterers are situated near the Earth’s surface. μ denotes the magnetic permeability of the medium, r represents the spatial coordinate within the scatterer, and V k is the volume of the k-th scatterer. E r is the electric field vector at position r , E 0 r is the regional (or primary) electric field, and g r , r is the scalar Green’s function. The terms e 1 r and e G r represent the induced and galvanic distorted electric fields, respectively, generated by near-surface anomalous bodies. The magnitude of these distortion components depends on the size, geometry, and electrical contrast of the shallow anomalies relative to the host rock.
Under the Born approximation, E r in Equation (9) can be approximated by the regional electric field E 0 r , allowing the relationship between the observed field E r and the background field E 0 r to be expressed as:
E r = I + G r I G r 1 E 0 r = c r E 0 r ,
where I is the identity matrix, G r is the dyadic Green’s function. For TEFSM, the induced distortion component is negligible. Consequently, the distortion tensor c r can generally be simplified to a second-order real-valued tensor that is frequency-independent [33].
Based on the above theoretical framework, it follows that galvanic distortion occurs whenever there is a near-surface electrical anomaly. Under strict 2D geological conditions, only the TM mode is affected by galvanic distortion [13]; however, both TE (transverse electric) and TM (transverse magnetic) modes are influenced in 3D settings. Therefore, when TEFSM is applied to investigate shallow subsurface structures, the presence of galvanic distortion can be effectively detected.

3. Simulation Analysis

In this section, three numerical models are designed to examine the impact of galvanic distortion. All models share the same simulation domain, extending from −4 to 4 km in the x-, y-, and z-directions, with a 4 km thick air layer. A survey line is placed along the y-axis, spanning from −100 to 100 m. Mesh refinement is applied near observation stations to ensure high accuracy in forward modeling. The mesh consists of 1,063,926 tetrahedral elements and 1,245,326 edges. Station spacing is set to 0.5 m within the interval [−20, 20] m and 1 m outside this range. Electric field data in the y-direction at 61 frequencies are used as observed data, with frequencies logarithmically spaced as f = 10(1:0.05:4) Hz. The total computation time for each model is 1 h and 5 min.

3.1. Galvanic Distortion Model

A plate-shaped anomalous body with resistivity ρ 1 = 0.1 Ω·m is embedded in a half-space background medium of resistivity ρ 0 = 1000 Ω·m, buried at a depth of 6 m (top depth), as illustrated in Figure 1. The dimensions of the anomalous body are 5 m × 2 m × 4 m. The angle α between the strike direction of the plate and the survey line is 30°.
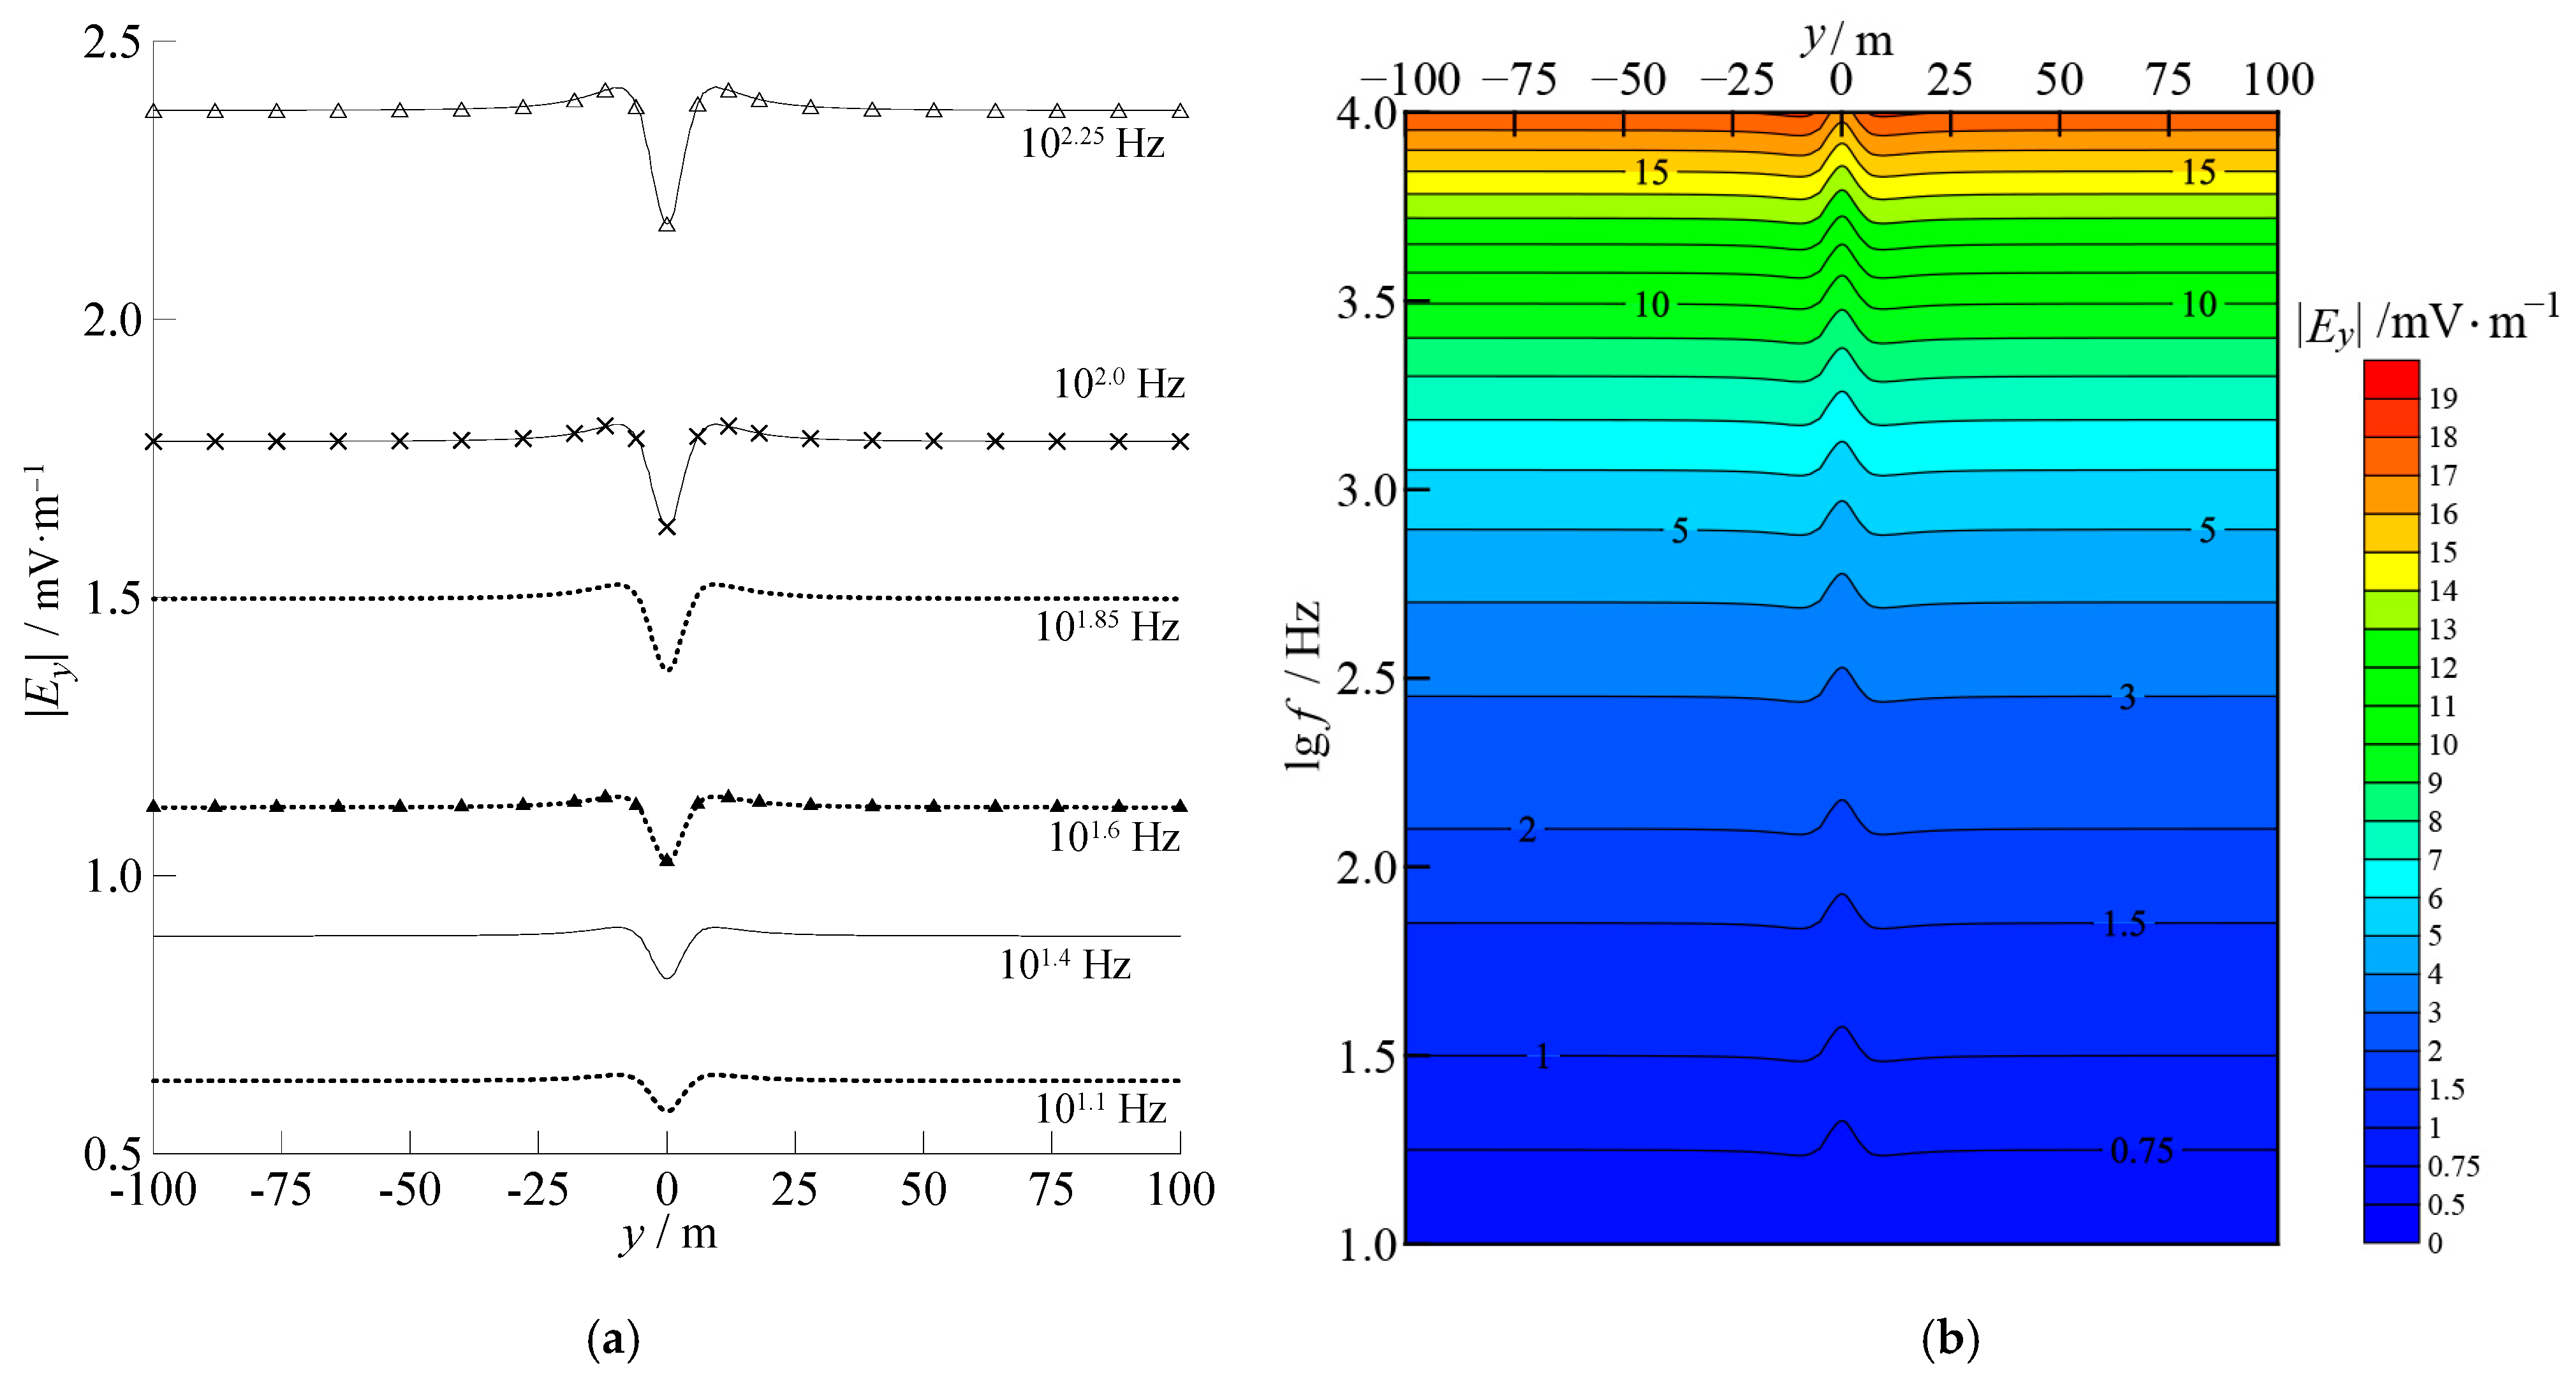
The forward modeling results are presented in Figure 2, where the magnitude of Ey is used as the observed signal. Figure 2a shows the curve plot of the electric field response, indicating that the electric field amplitude increases with frequency (f)—likely due to enhanced sensitivity at higher frequencies associated with shallower penetration depths. A distinct low-amplitude zone coincides with the location of the plate-shaped anomaly. The pseudo-section in Figure 2b reveals sharp, vertically elongated anomalies over the anomalous body across the entire frequency band, commonly referred to as the “hanging noodles” phenomenon, which is characteristic of galvanic distortion [22,24,34].

3.2. Sphere Model

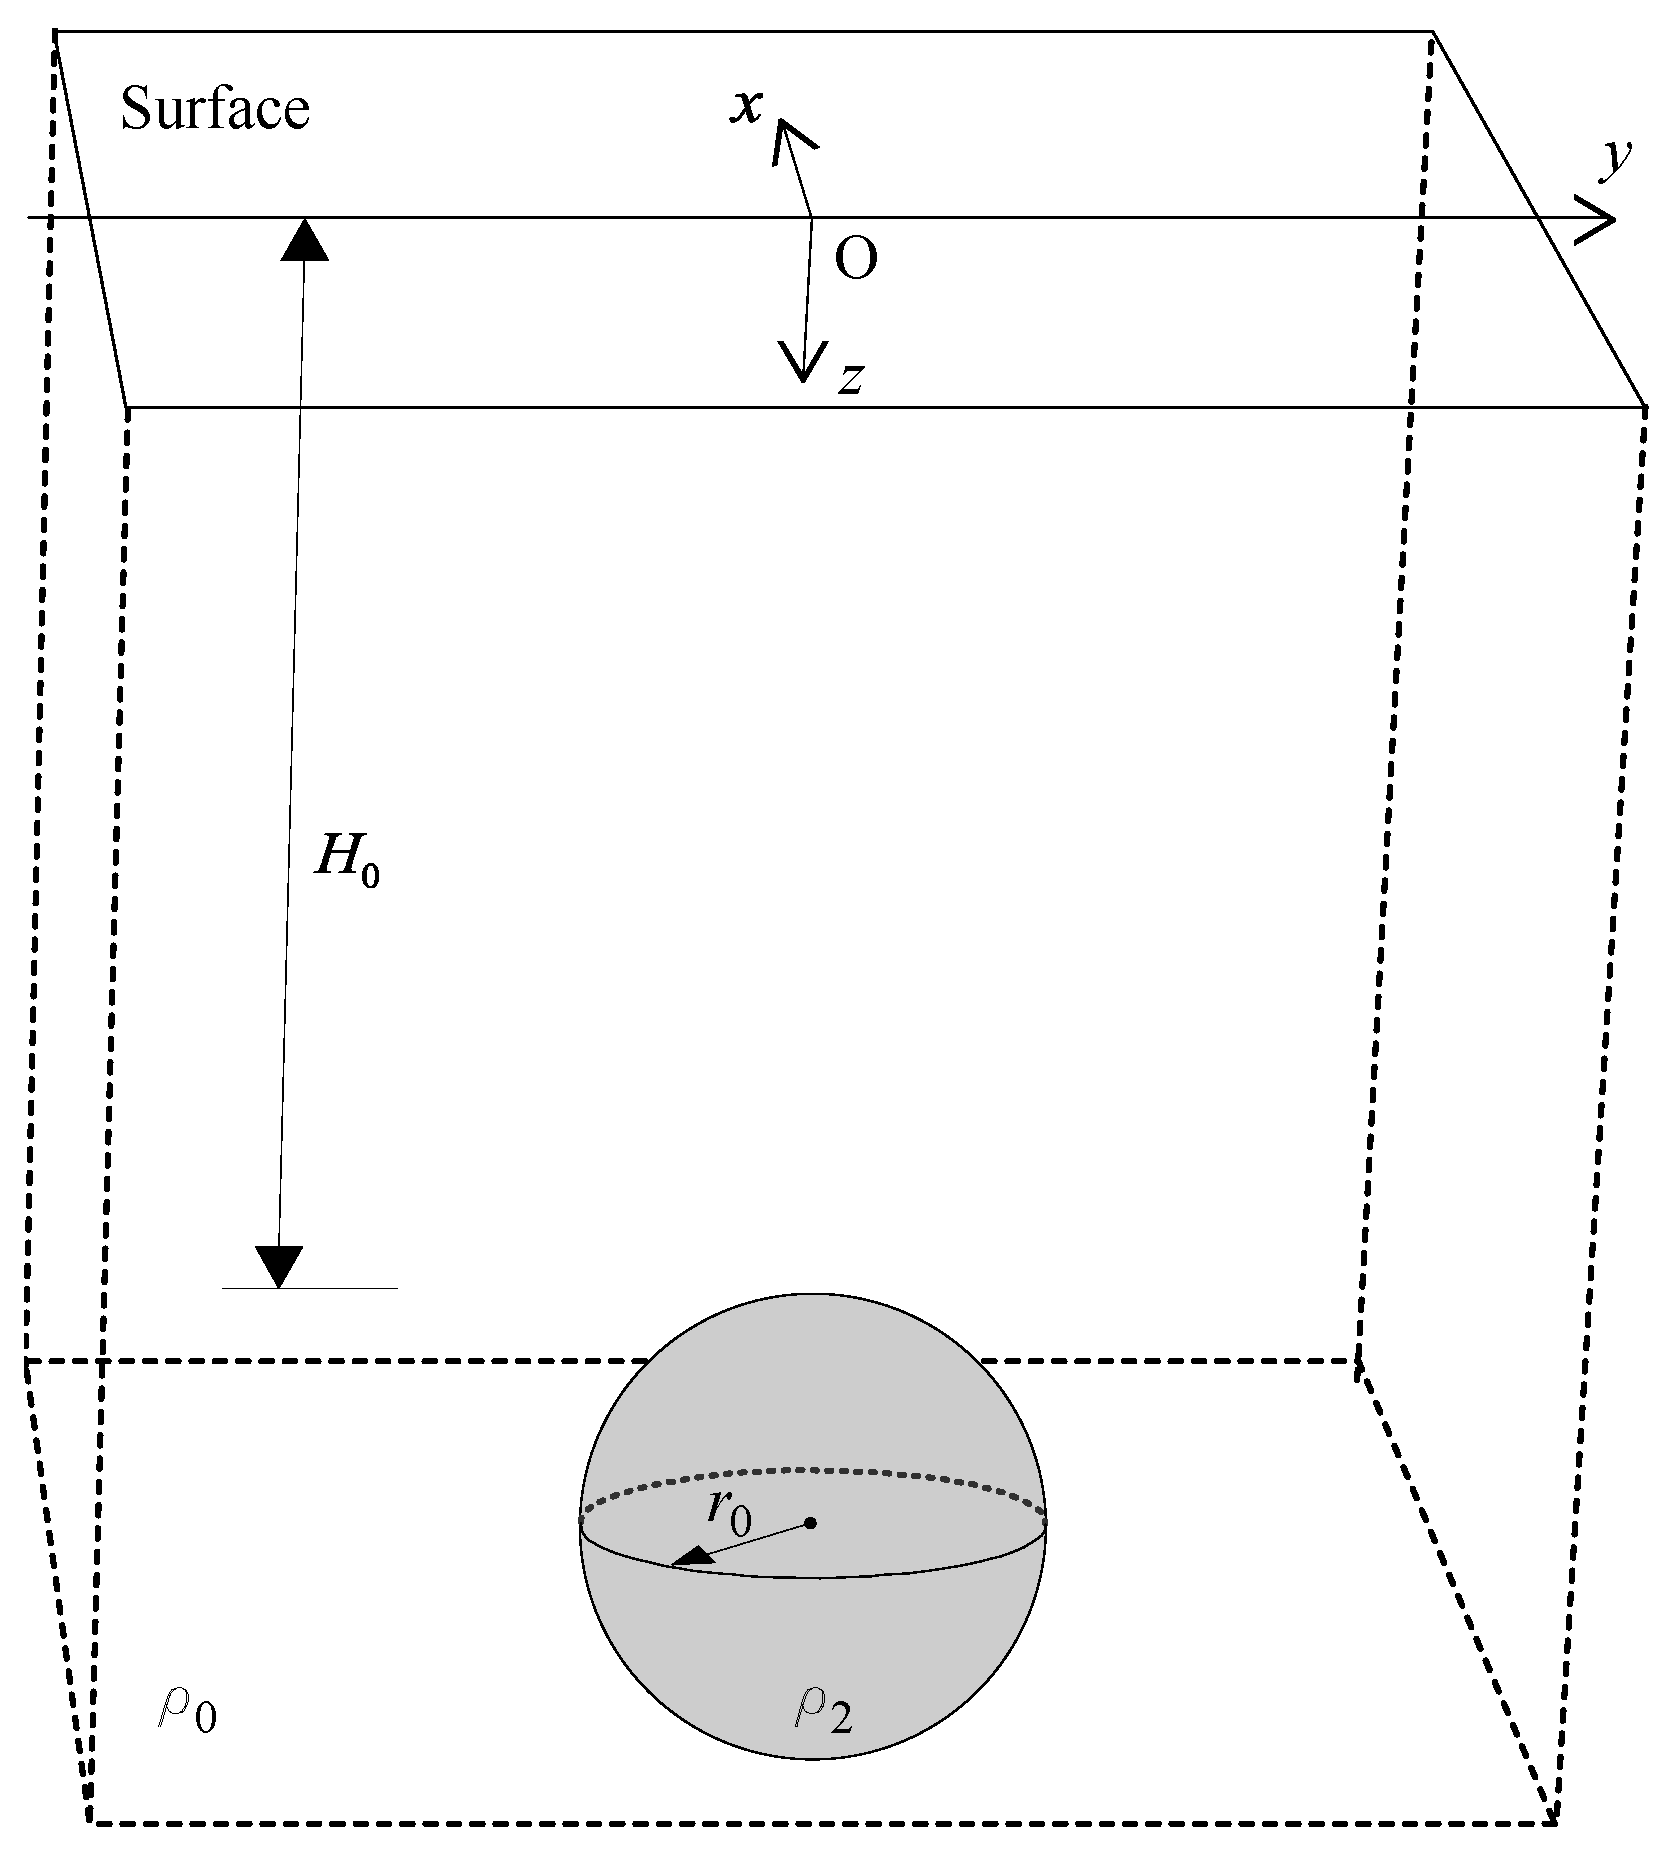
The spherical anomaly model is shown in Figure 3. The background resistivity ρ 0 is 1000 Ω·m. A spherical anomalous body with resistivity ρ 2 = 1 Ω·m is buried at a top depth of 50 m and has a radius of 25 m.
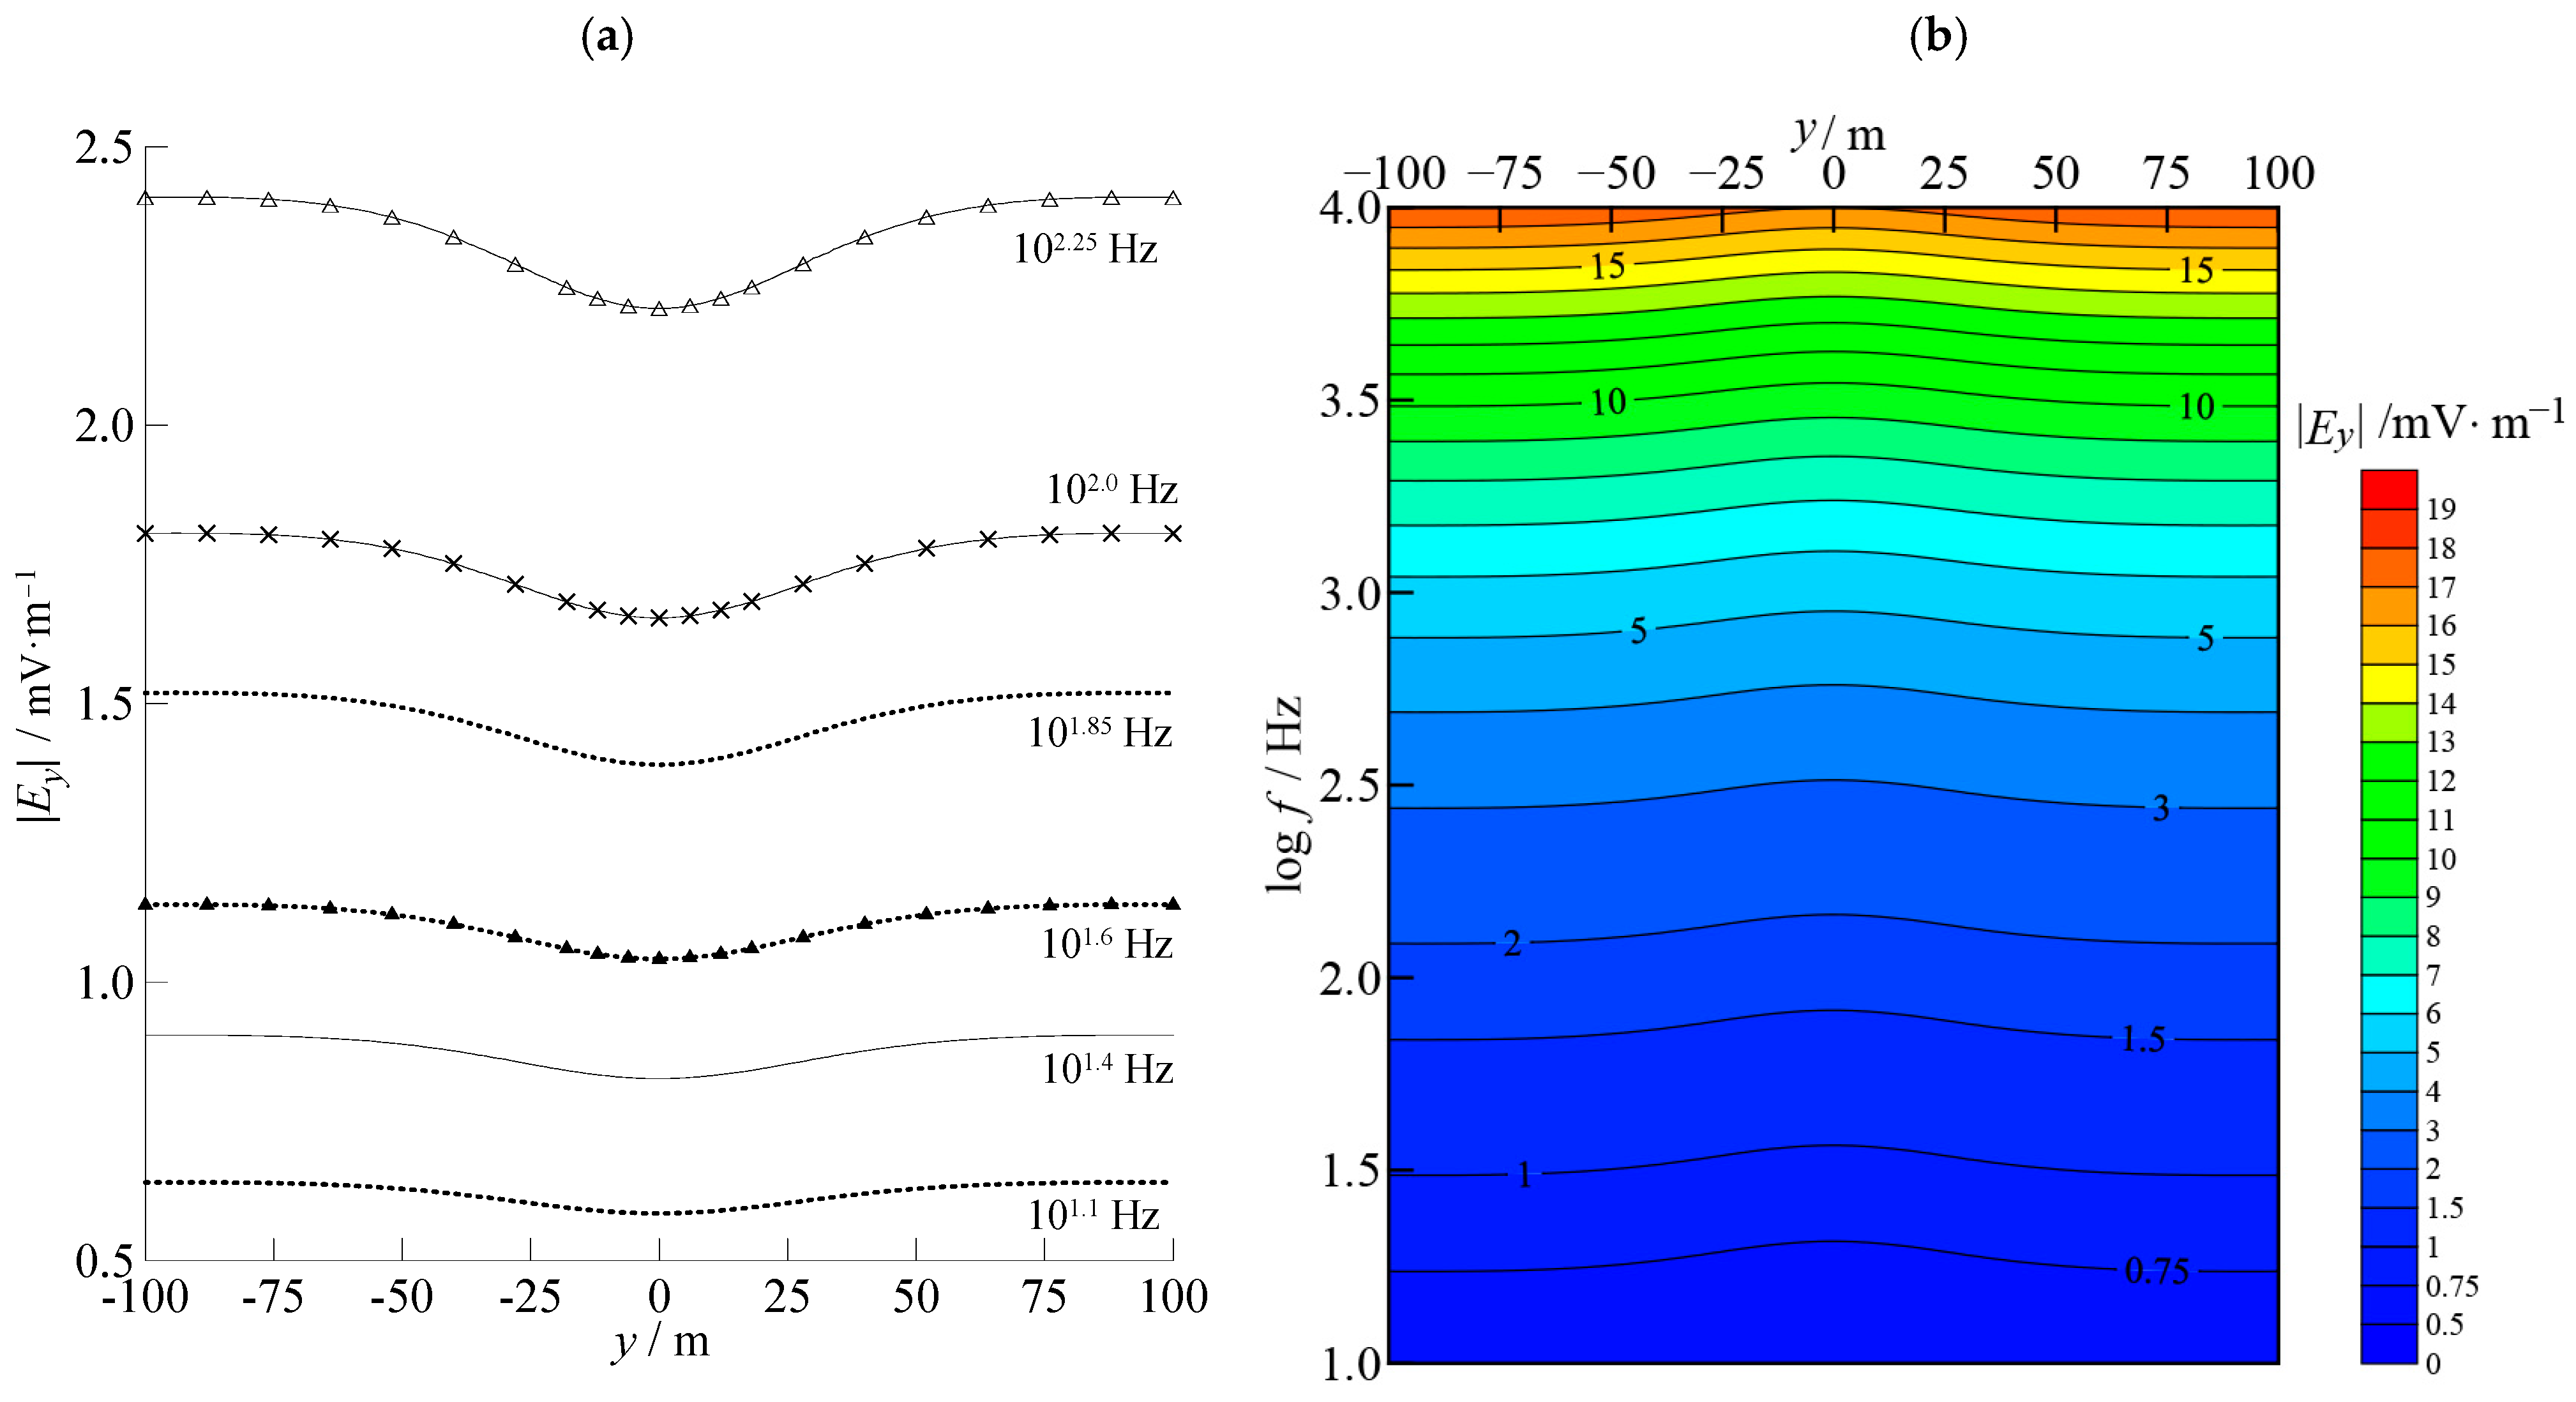
Figure 4 presents the simulation results for the spherical model. The electric field response exhibits a clear signature from the anomalous body. Due to the larger size and greater burial depth compared to the plate model, the response is broader and smoother, reflecting reduced spatial resolution at depth.

3.3. Sphere Model with Galvanic Distortion

To investigate the influence of galvanic distortion on deeper anomalies, a shallow galvanic distortion source is superimposed onto the spherical model, as depicted in Figure 5.
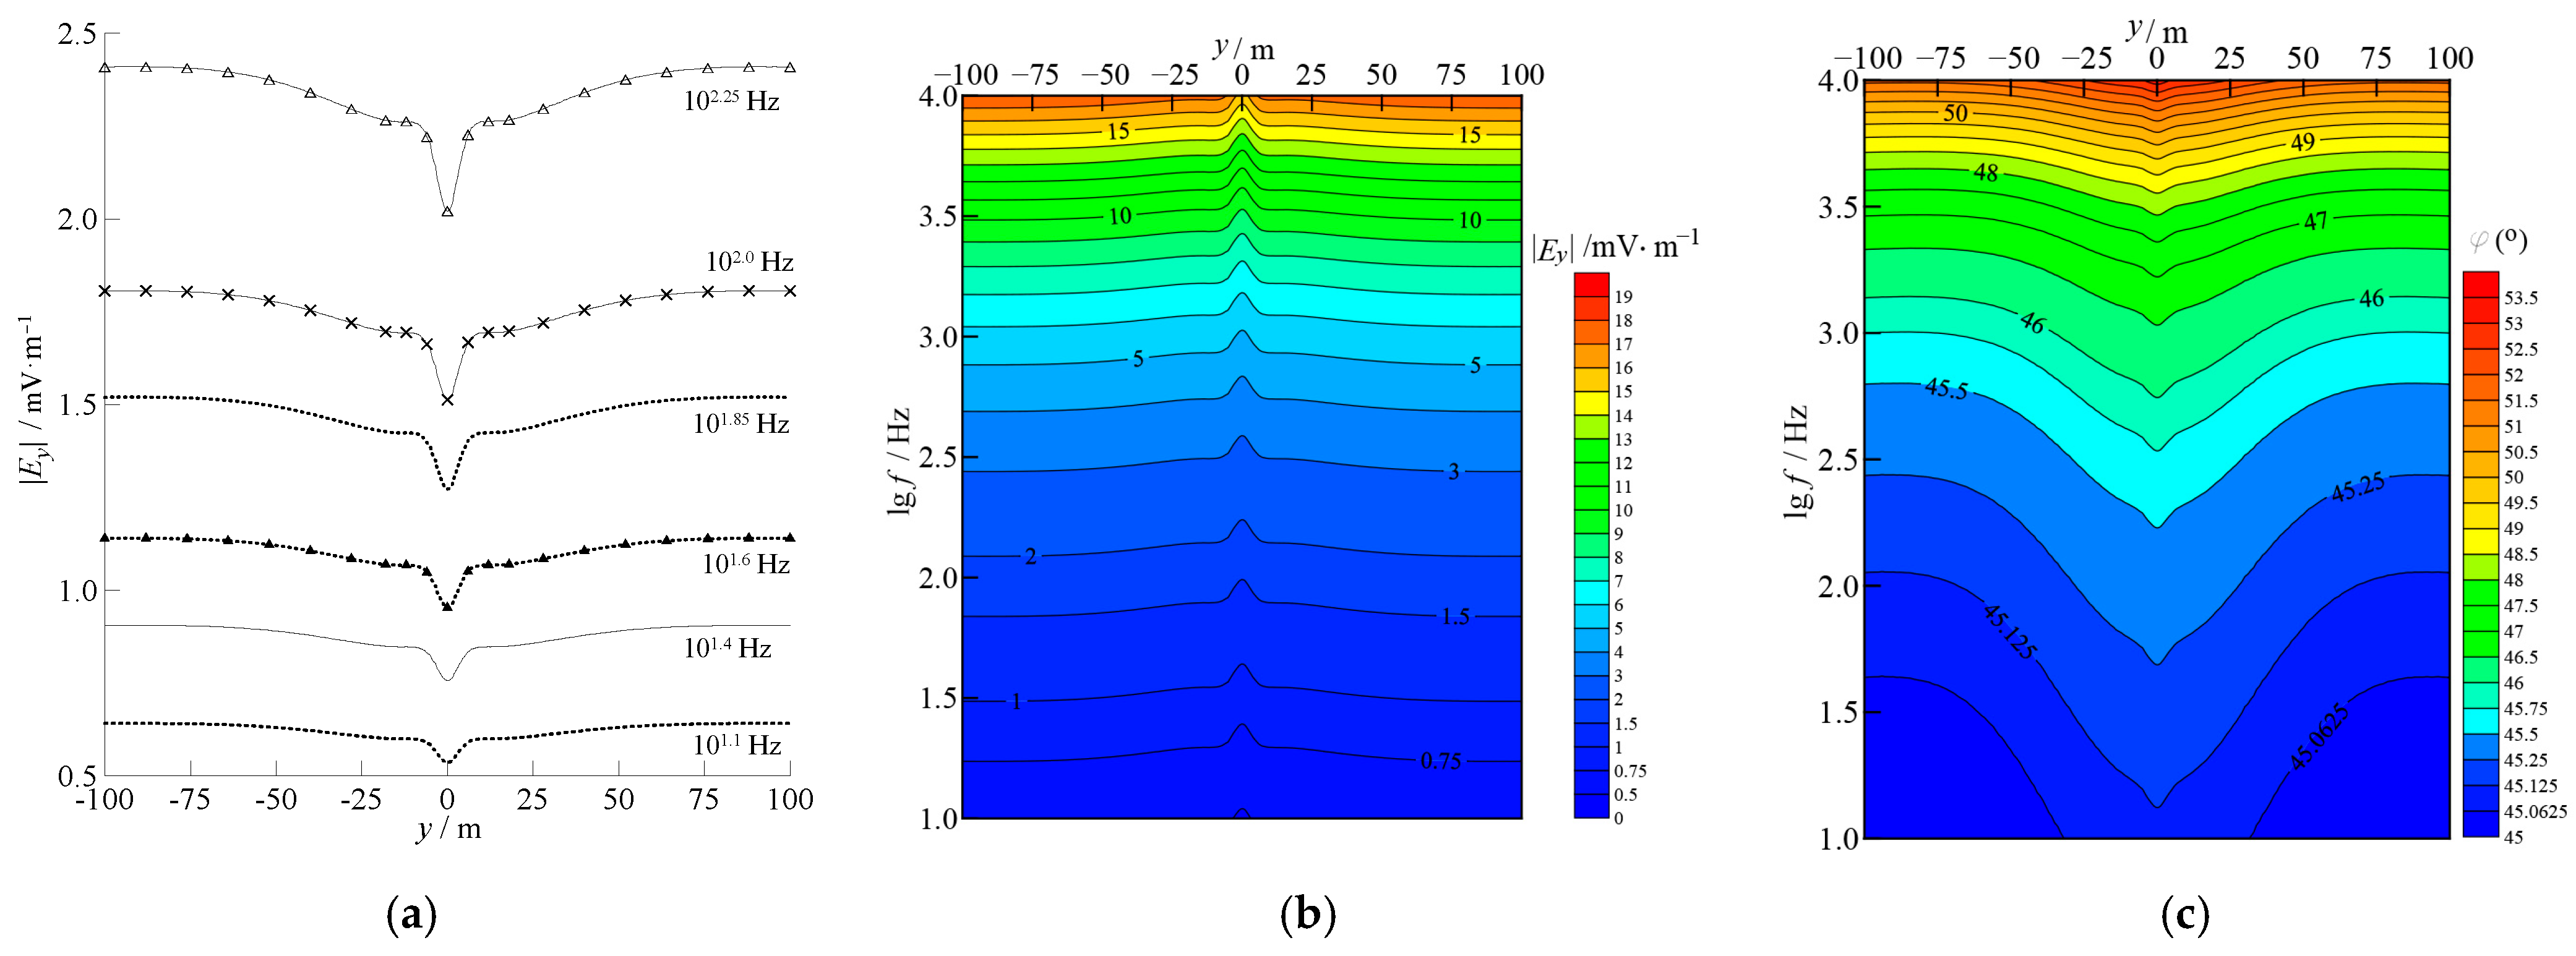
As shown in Figure 6a,b, the signature of the deep spherical anomaly is masked by strong galvanic distortion effects, making it indistinguishable in the amplitude of Ey. To address this issue, we further analyze the phase of Ey in the pseudo-section. Figure 6c demonstrates that while galvanic distortion has minimal impact on the phase response, the characteristics of the spherical anomaly remain clearly visible. Thus, in cases affected by galvanic distortion, the phase pseudo-section can effectively reveal subsurface anomalies [35]. However, current TEFSM systems do not record phase information of the electric field component. Future improvements to frequency selectors may enable phase measurement, thereby enhancing interpretability.

4. A Case Study in Mineral Water Exploration

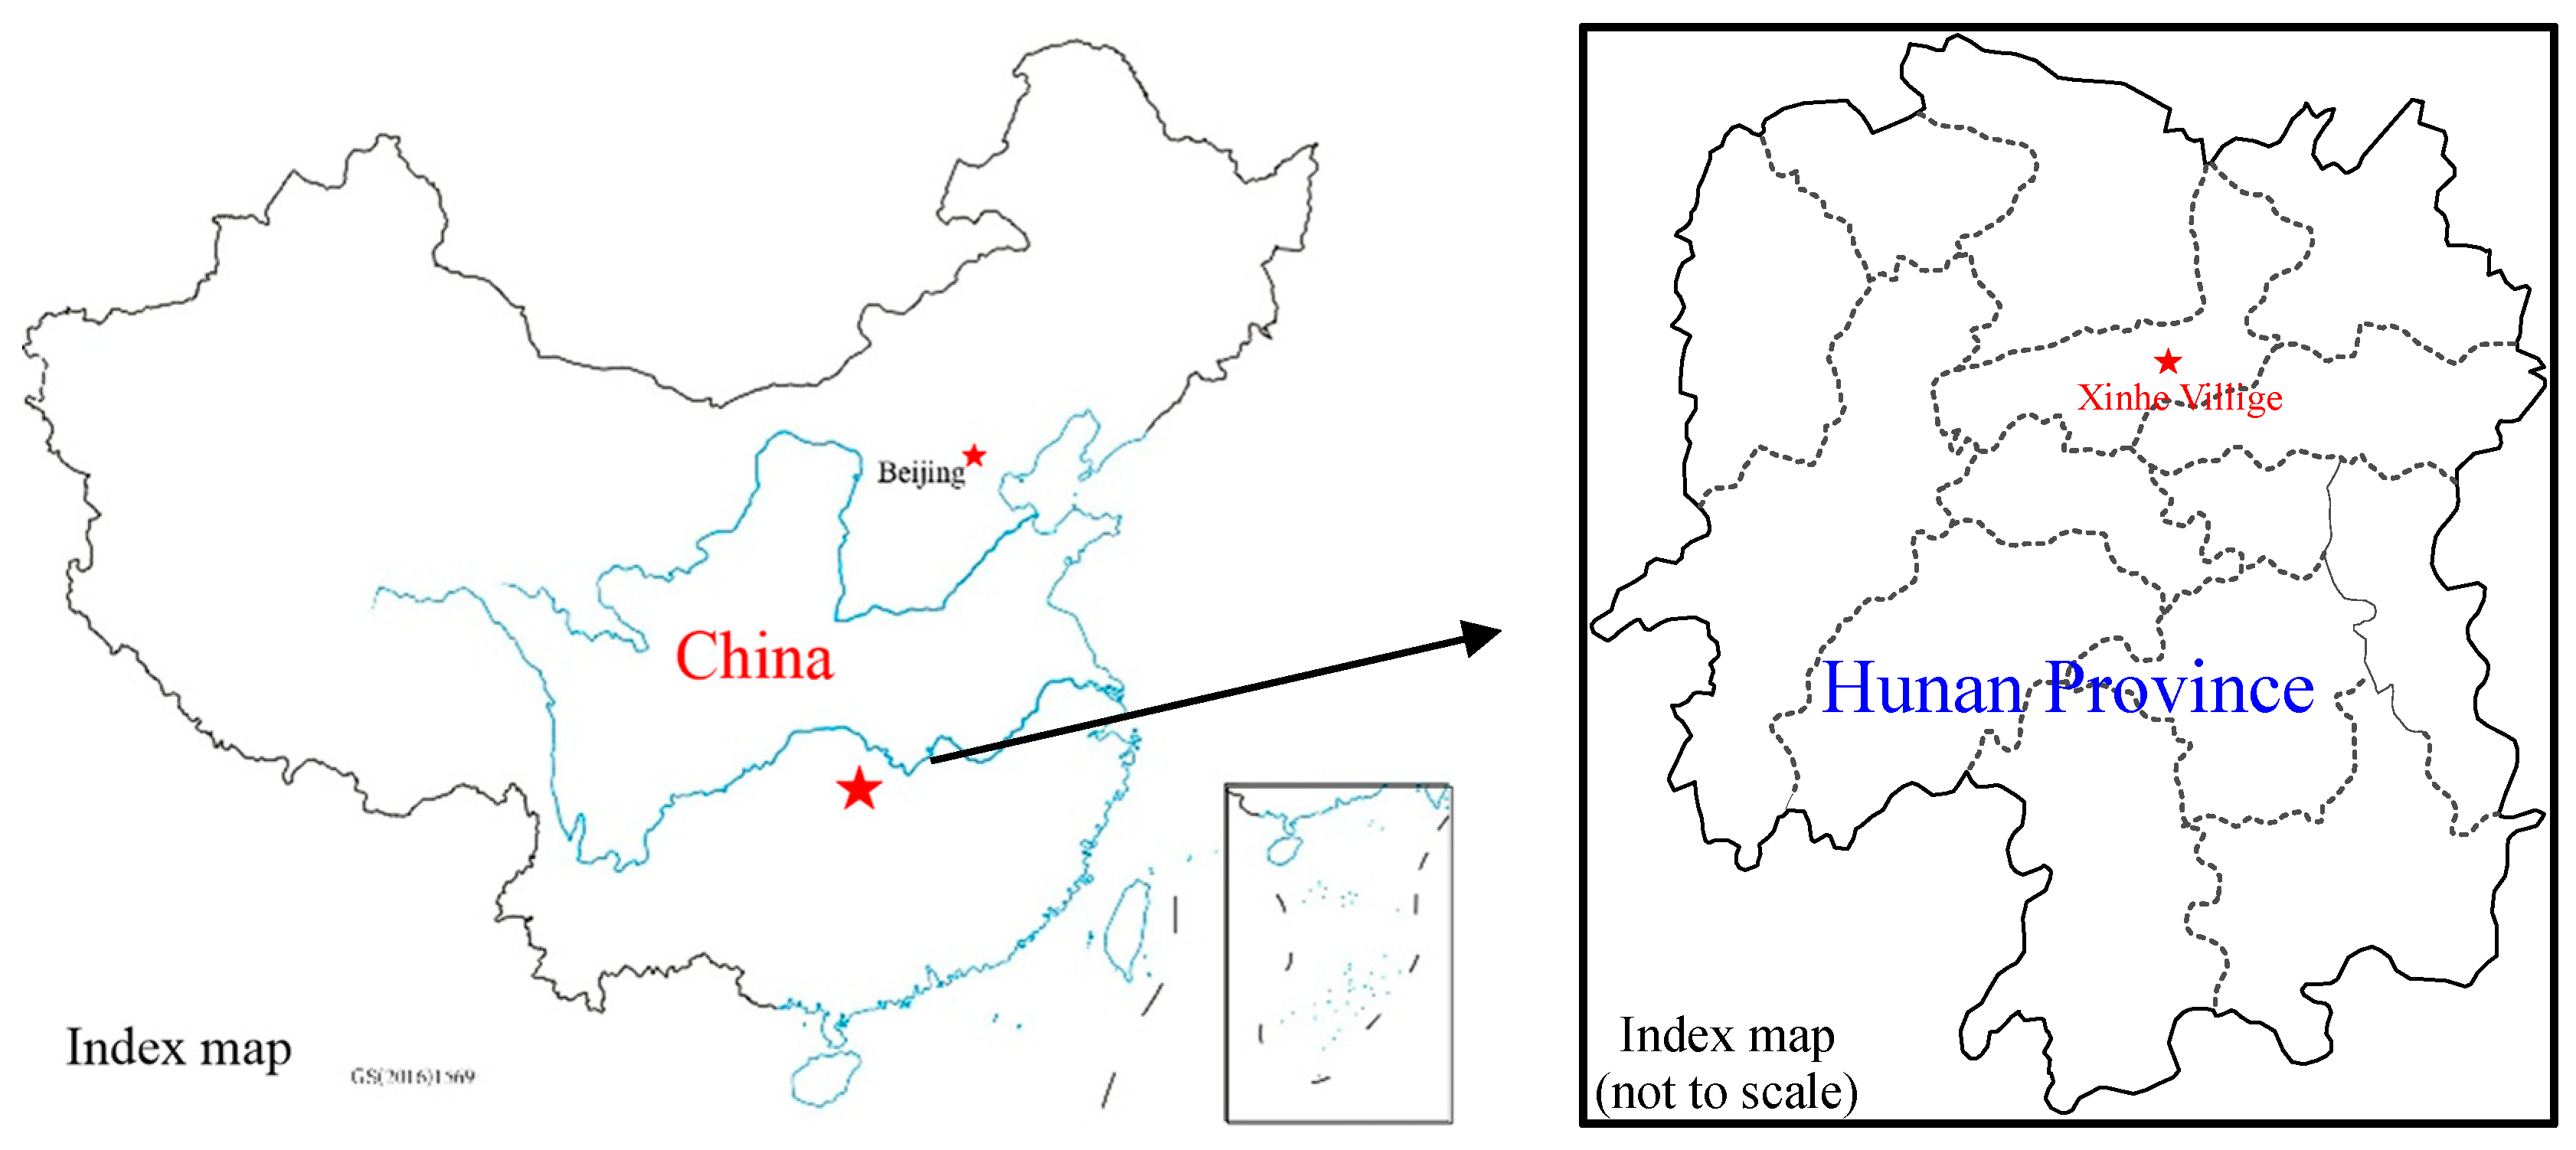
To demonstrate the practical application and effectiveness of TEFSM in utilizing galvanic distortion, we conducted a field survey for mineral exploration in Xinhe Villige, Gaoqiao Town, Taojiang County, Hunan Province, China, as illustrated in Figure 7.

4.1. Study Area

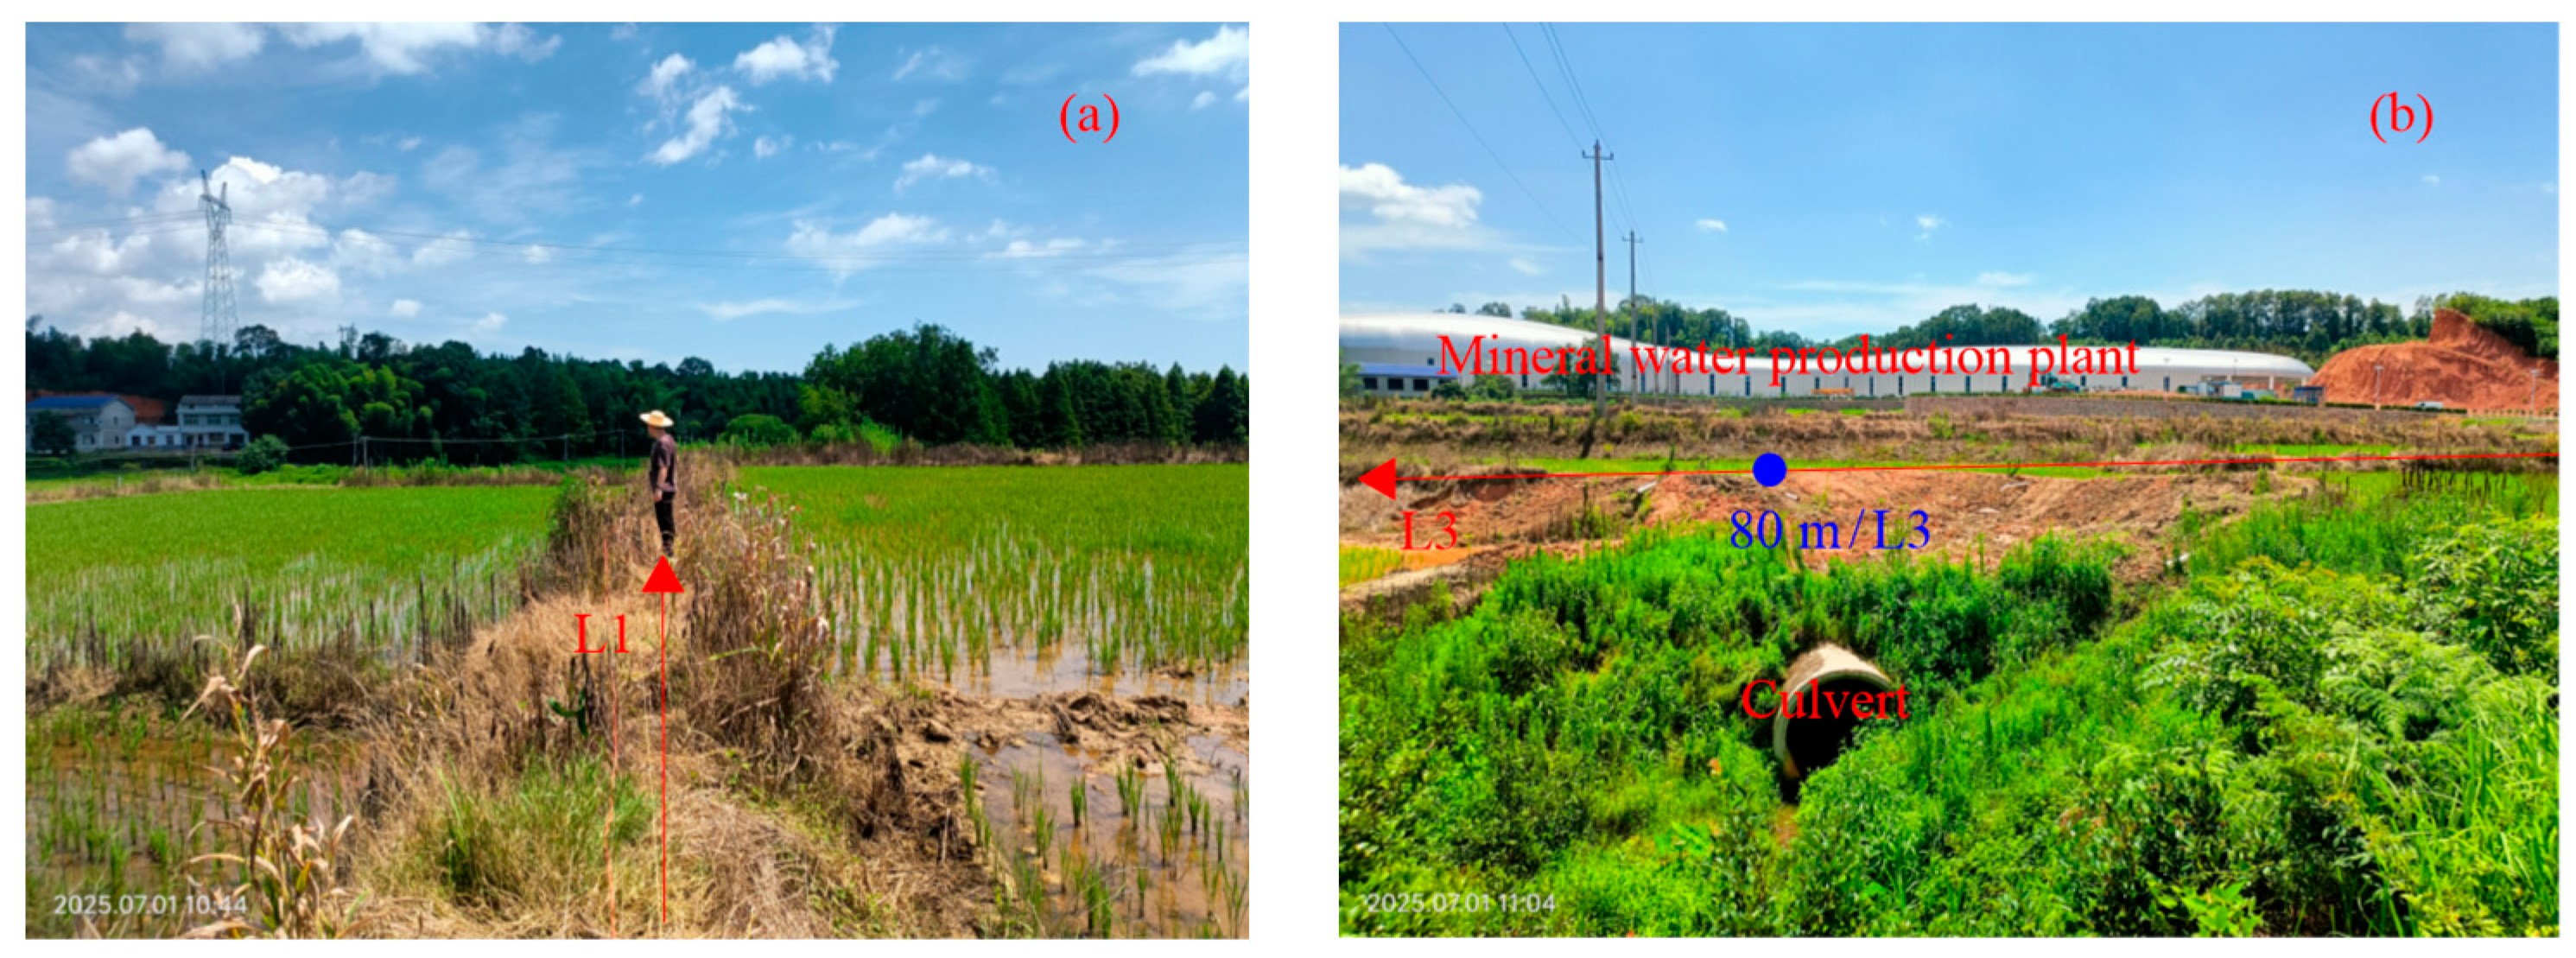
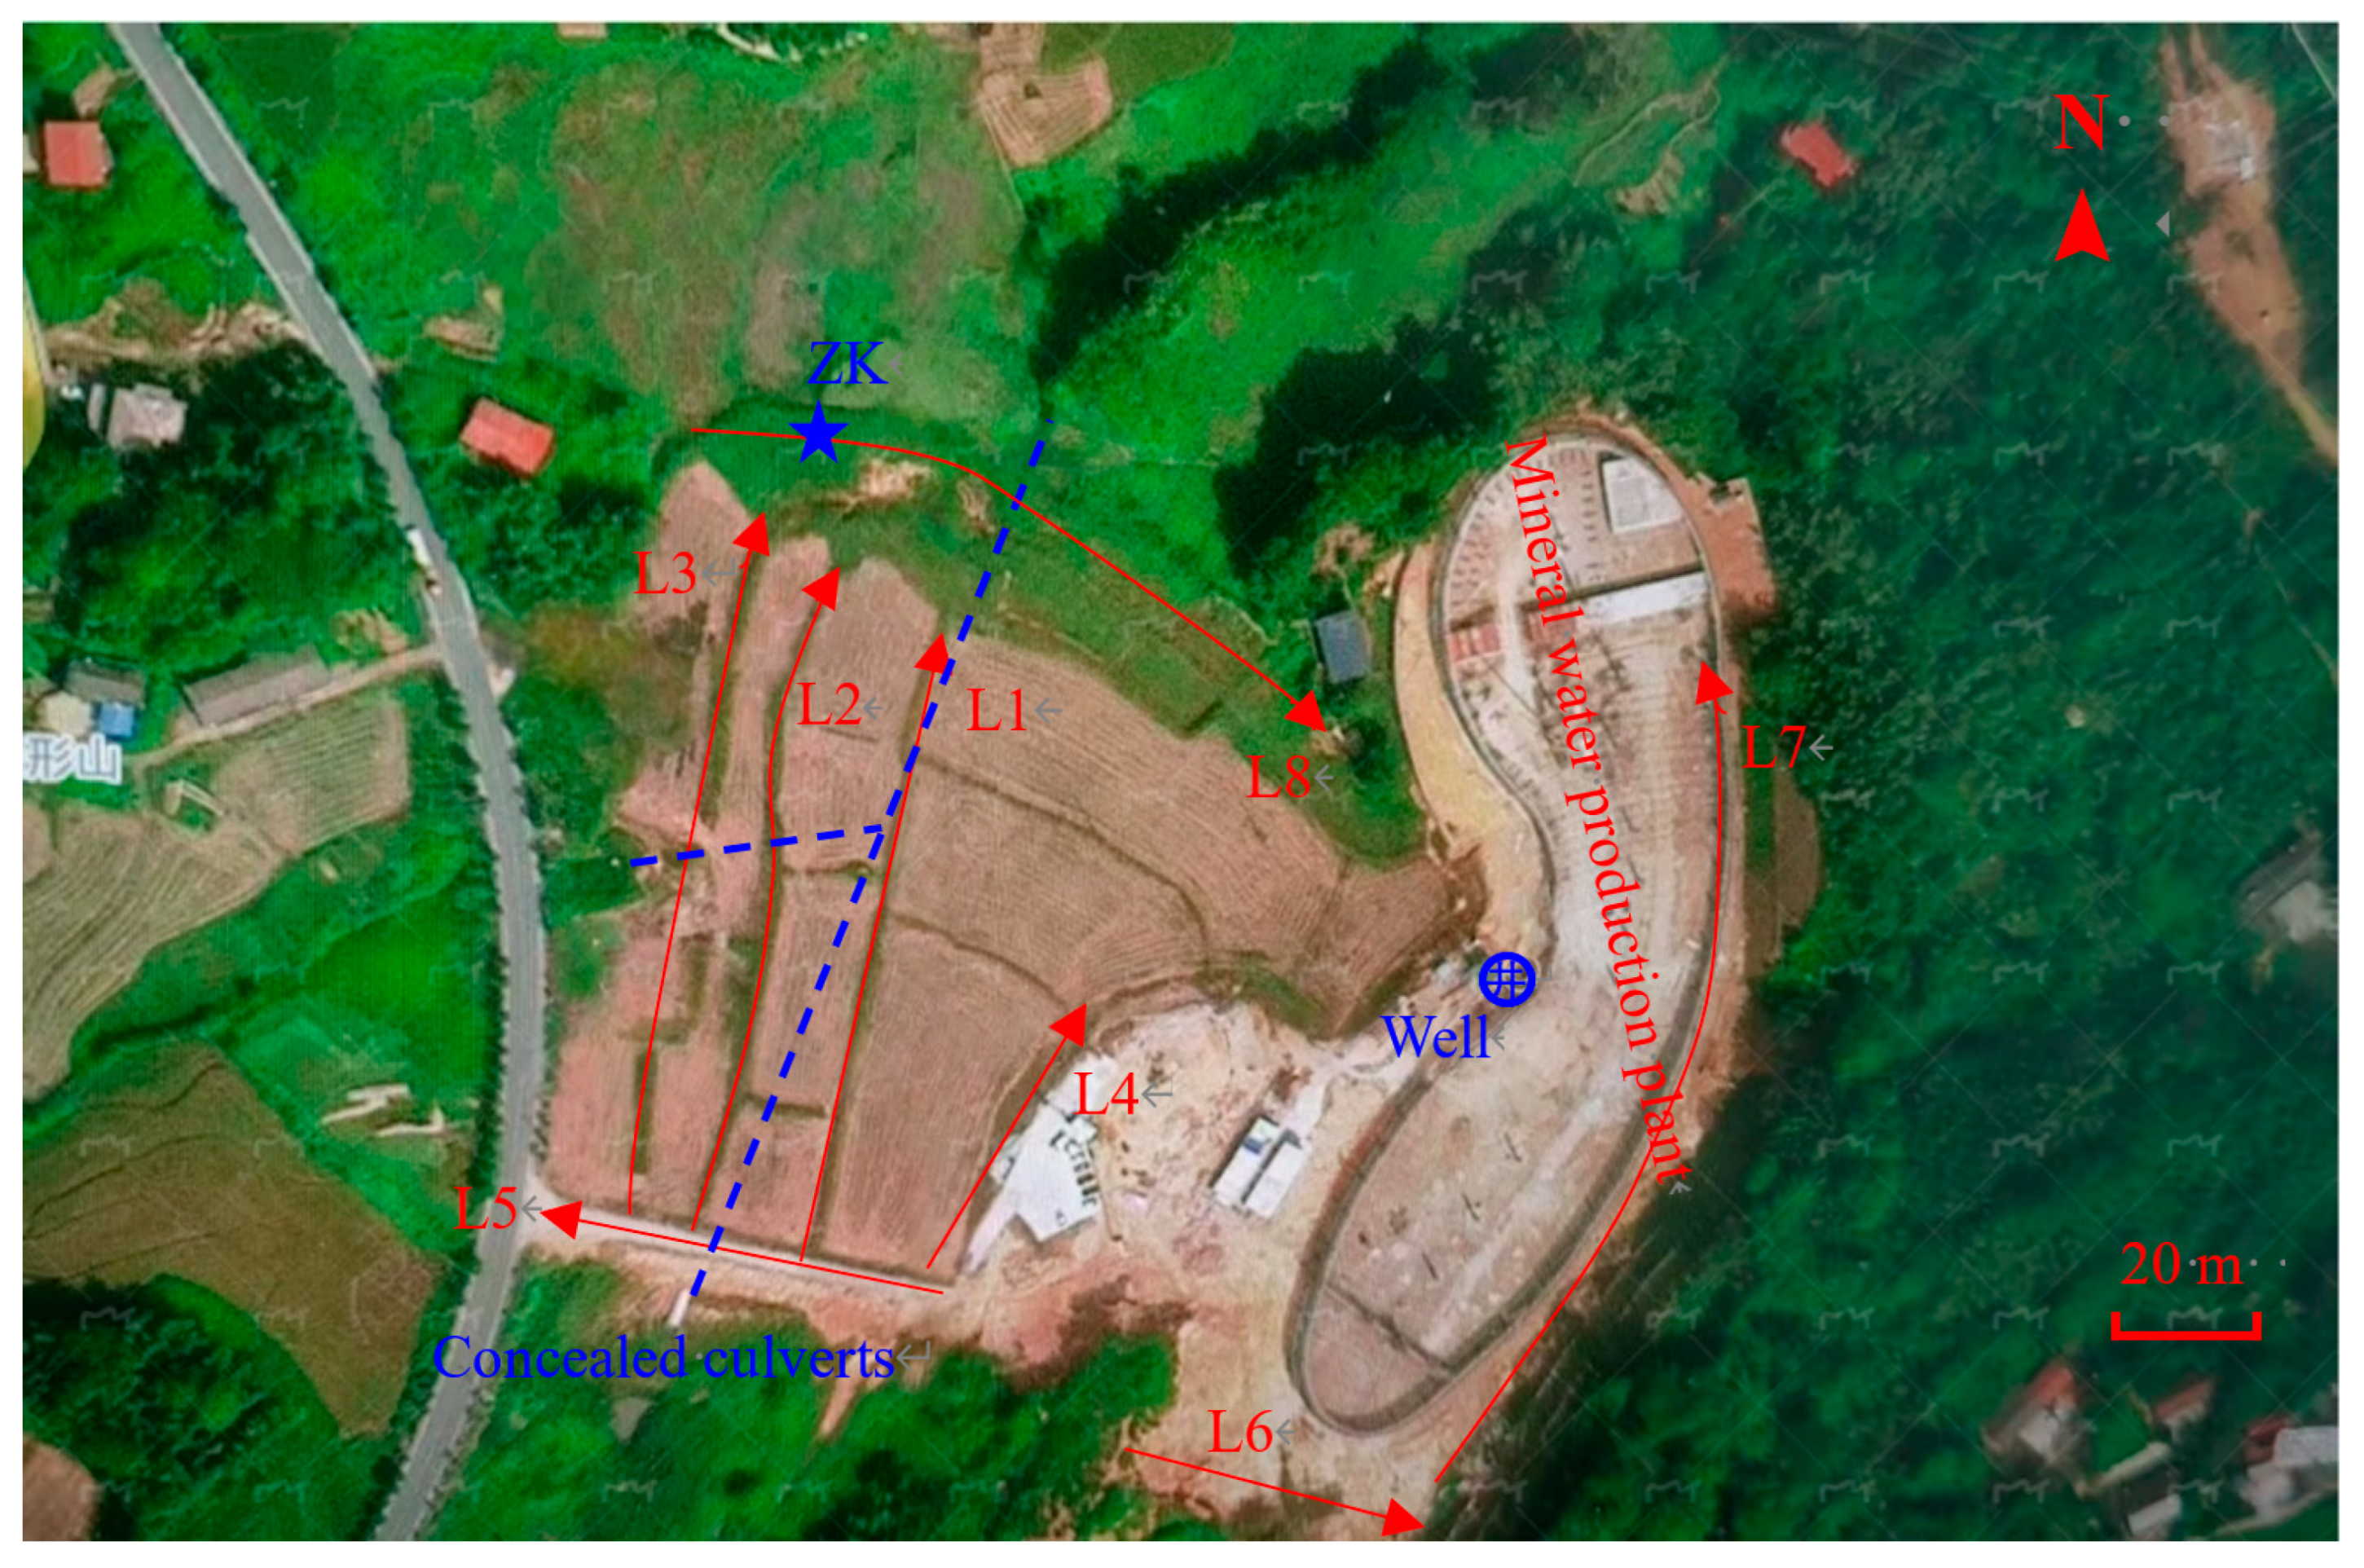
The study area lies within hilly terrain characterized by dense vegetation and agricultural land. Additionally, the region contains power transmission lines, concealed culverts, a mineral water production plant, and residential buildings, as shown in Figure 8, where L1 and L3 denote the geophysical survey line numbers.
The surface of the study area is covered by Quaternary deposits, underlain by moderately weathered granite from the Yanshanian period (γ). Stratigraphically, from youngest to oldest, the formations consist of miscellaneous fill soil (Qml), sandy cohesive soil (Qel), and moderately weathered granite (γ). The miscellaneous fill soil (Qml) exhibits non-uniform density and loose structure, typically ranging in thickness from 0.5 to 2 m. The sandy cohesive soil (Qel) results from the weathering and residual accumulation of Yanshanian granite, with an average thickness of approximately 45 m. The underlying moderately weathered granite (γ) displays medium-coarse granitic texture, blocky structure, well-developed joints and fissures, and a thickness exceeding 200 m.
Surface streams are present in the area, with seasonal variations in discharge but generally low flow velocities. Groundwater primarily comprises pore water from Quaternary unconsolidated sediments and weathered fracture water. Previous geological data indicate that the weathered fracture water in this region contains high concentrations of metasilicic acid, meeting the criteria for natural drinking water. Consequently, a natural mineral water company has established a production facility within the study area (Figure 8b), although its single production well yields only about 150 t/day.
Based on prior resistivity surveys and field outcrop measurements using small quadrupole arrays, Table 1 presents the range of apparent resistivity values for common rock types in the area. As indicated, fractured zones exhibit relatively low resistivity compared to surrounding intact rocks, making them favorable targets for electrical exploration. Thus, water-bearing fractured zones are the primary objective of this geophysical investigation.

4.2. Field Data Collection and Analysis

To support the company’s plans for expanding production capacity, further underground water exploration was initiated. Figure 9 shows the layout of the in situ geophysical survey lines; with the labeled well indicating the company’s only production well. Due to topographic constraints and dense vegetation, some survey lines deviate slightly from straight paths.
The TEFSM was employed in this hydro-geophysical survey. For improved efficiency, a triple-frequency configuration (25 Hz, 67 Hz, and 170 Hz) was used for rapid data acquisition along the survey lines, with a measurement point spacing of 5 m and electrode spacing (MN) of 10 m. Each measurement required only approximately 3 s. The potential difference ΔV was recorded using a TC300 frequency selector.
Figure 10 presents the triple-frequency exploration results along survey lines L2 and L3. Solid, dashed, and dotted lines represent data collected at 170 Hz, 67 Hz, and 25 Hz, respectively. Both profiles exhibit a clear upward trend at their tail, attributable to a high-voltage transmission line located approximately 600 m ahead of the lines and oriented nearly orthogonal to them (Figure 8a). Additional 220 V power lines cross the survey lines near 90 m/L2 and 85 m/L3 (Figure 8b).
On L2, the potential difference profile generally follows a U-shaped pattern (Figure 10a), likely due to alluvial silt deposits resulting from pond infilling between 25 m and 65 m along the line. A notable relative low potential anomaly occurs at 80 m/L3 (marked as a red point in Figure 10b), which is interpreted as being caused by a partially filled culvert and thus considered invalid (Figure 8b). After accounting for these and other sources of interference, useful anomalies on survey lines L1–L3 and L5–L7 were effectively ruled out.
Figure 11 shows the triple-frequency results for lines L4 and L8. Pronounced relatively low-value anomalies—similar in character to those depicted in Figure 2a and Figure 6a—are observed at 35 m/L4 and 25 m/L8, respectively (highlighted as red points). These features are consistent with subsurface conductive zones potentially associated with water-bearing fractures. However, electromagnetic interference from the surrounding environment may have contributed to overlapping or entangled response curves at 25 Hz and 170 Hz frequencies.
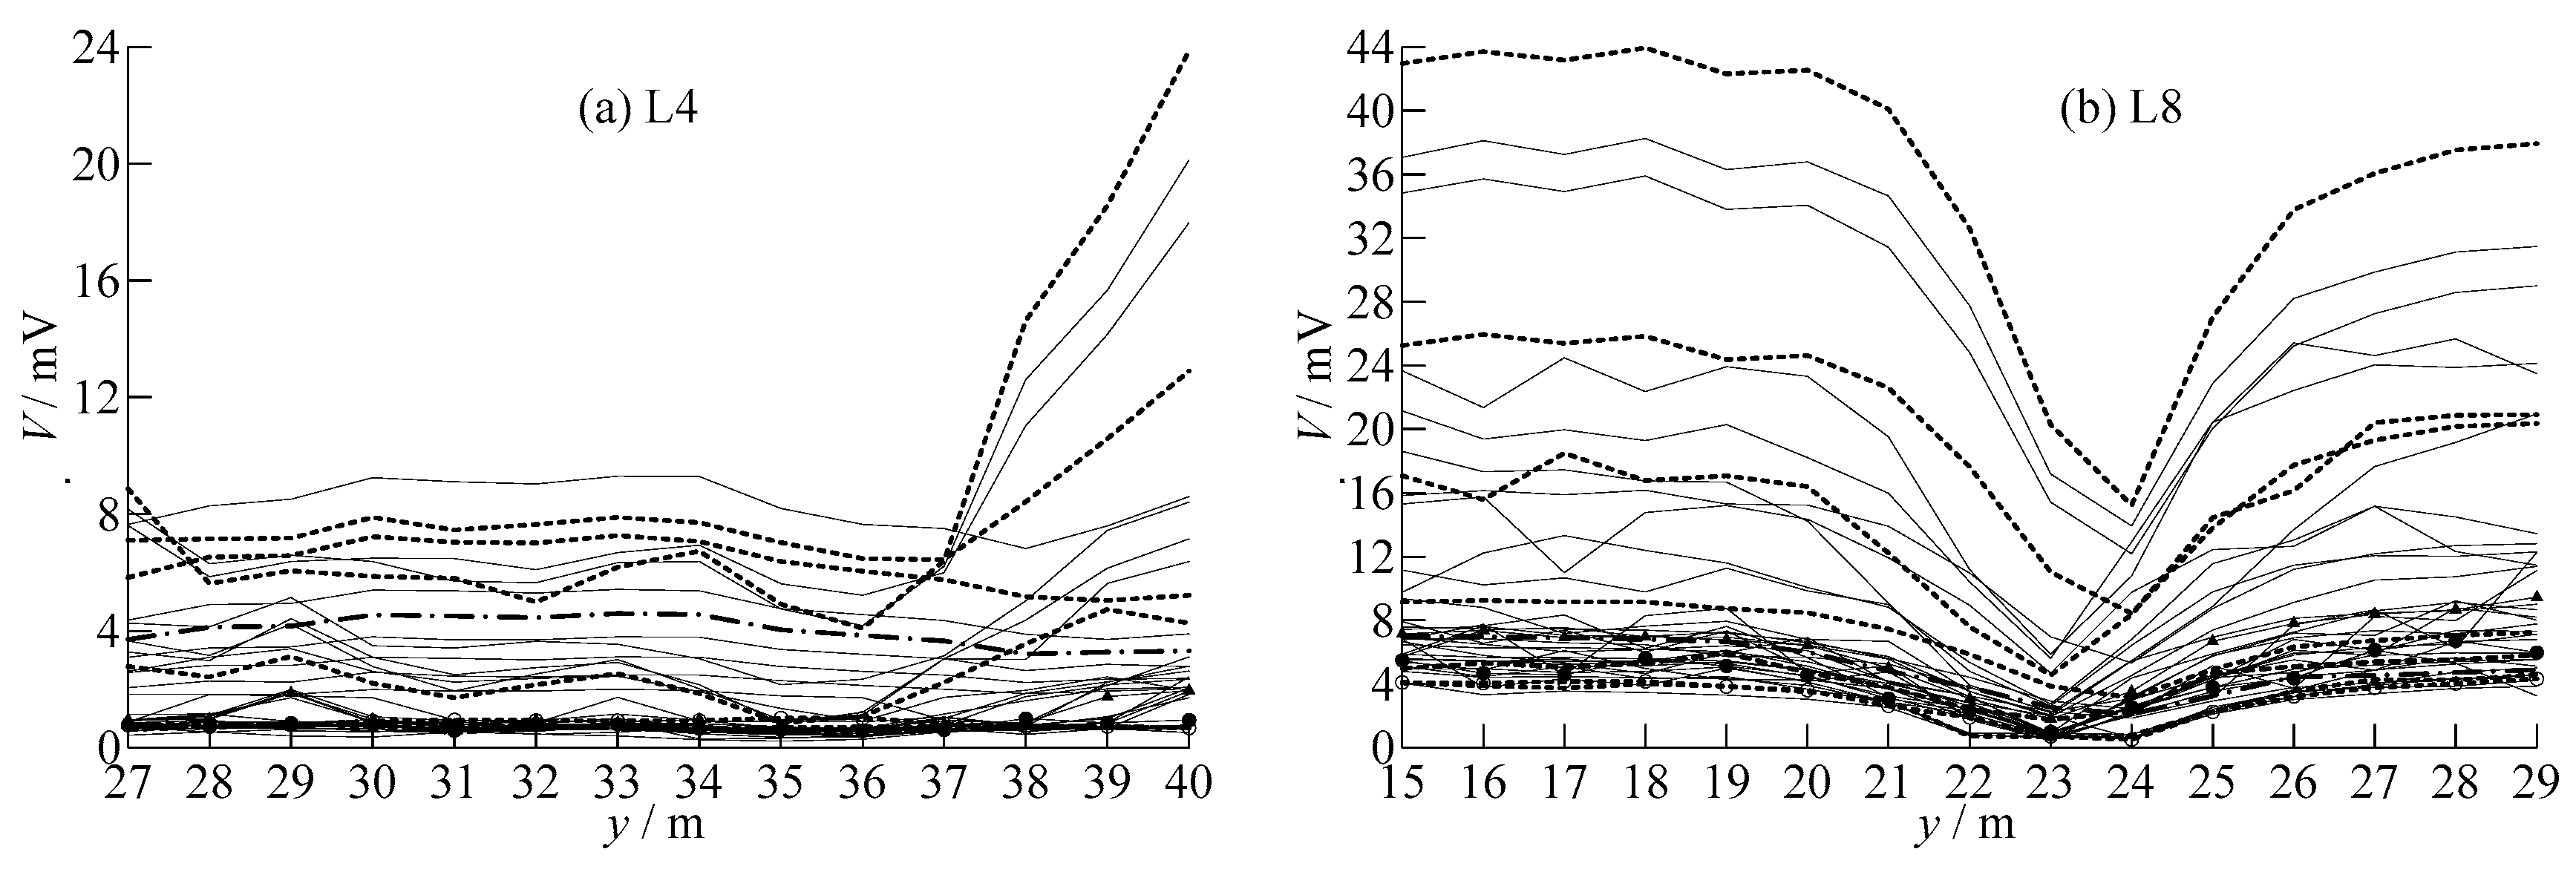
To assess the reliability of the anomalies observed at 35 m/L4 and 25 m/L8, a detailed follow-up survey was conducted using 40 frequencies within the range of 12–5000 Hz near these two locations. The electrode spacing (MN) was set to 10 m, with a measurement point interval of 1 m. Figure 12 presents the potential difference profile curves recorded at these 40 frequencies along survey lines L4 and L8. At 35 m/L4, the previously identified low-potential anomaly is no longer prominent; however, several profile curves exhibit noticeable upward deviations beyond 37 m (Figure 12a). On line L8, clear relatively low-potential anomalies are observed between 23 m and 24 m, suggesting that the anomaly at this location is more consistent and reliable (Figure 12b).
Based on the principle that high-frequency electromagnetic signals penetrate to shallower depths while low-frequency signals reach greater depths, apparent depth (hs) pseudo-sections corresponding to the data in Figure 12 were generated through inversion (Figure 13). The calculation formula for hs is as follows:
h s = c × 503 ρ / f ,
where ρ denotes resistivity, f represents frequency, and c refers to empirical coefficients, whose values vary depending on survey personnel and field conditions.
To enhance the signal-to-noise ratio (SNR), the measured data were normalized using the following formula:
K i = l o g 10 ( Δ V i / Δ V m i n ) ,
where Δ V i denotes the i-th observed potential difference, Δ V m i n represents the minimum value across all measurements on the profile, and K i is the normalized result of the i-th observation.
Figure 13 displays the ΔV pseudo-sections for lines L4 and L8. At approximately 100–300 m burial depth on 34–36 m/L4, a relatively low-potential zone is present, exhibiting a “hanging noodles” pattern (Figure 13a). However, the magnitude contrast between this anomaly and adjacent contour lines is modest, and the low-value contours show evident lateral continuity. This suggests that the response on line L4 may have been influenced by the shallow, loosely compacted soil layer, particularly since survey lines L1–L5 lie within the filled area by construction activities of the mineral water plant. This discrepancy arose because the mineral water company failed to inform the survey team in advance about on-site filling activities—information later confirmed by the author through field investigations and comparisons of historical and recent satellite imagery.
In contrast, a pronounced “hanging noodles” feature is clearly visible near 23 m/L8 (Figure 13b), standing out significantly compared to other regions in Figure 13. Below a depth of approximately 60 m, the low-value contours exhibit a marked contrast relative to surrounding values, indicating a robust and spatially coherent anomaly. It is therefore inferred that water-bearing fractured zones likely exist within the upper 300 m beneath 23 m/L8. Consequently, the drilling location (ZK) was selected at 23 m/L8 (Figure 13b).

4.3. Drilling Outcome

The final drilling depth of well ZK reached 309 m. From 0 to 61.2 m depth, the strata consisted of Quaternary sandy clay overburden; from 61.2 to 63.5 m, strongly weathered granite (Figure 14a); from 252.6 to 262.0 m, a distinct fractured zone (Figure 14c); and the remainder comprised relatively intact granite (Figure 14b). The well achieved a water yield of approximately 340 t/day.

5. Discussion

Through both simulation analysis and field application, this study demonstrates that galvanic distortion (static shift) in natural electromagnetic methods can be effectively utilized for groundwater exploration. Currently, researchers primarily rely on static effect characteristics of telluric electric field components to identify shallow conductive anomalies. Forward modeling results indicate that when two conductive bodies are vertically aligned at different depths, they may not be distinguishable based solely on electric field static effects. However, phase curve dispersion characteristics can reveal superposition patterns of such anomalies. Nevertheless, practical implementation remains limited due to the lack of frequency-selective instruments capable of accurately measuring phase parameters.
Theoretical development of TEFSM remains insufficient, and research in this domain is still limited. Future studies should focus on deeper theoretical investigations and broader experimental validation to advance the method’s applicability and reliability.

6. Conclusions

This study advances theoretical understanding of anomaly formation in TEFSM through 3-D forward modeling using the vector finite element method. The results show that static shifts can enhance the visibility of shallow anomalies, yet galvanic distortion may obscure the modulus response of deeper targets, complicating data interpretation. However, the phase of the electric field provides a robust alternative for identifying such obscured anomalies, and advancements in frequency selector technology could facilitate phase-based analysis, further improving interpretive reliability. The effectiveness of TEFSM in real-world groundwater exploration is validated by field data. Furthermore, the case study illustrates that TEFSM yields satisfactory results even in environments affected by cultural interference.

Author Contributions

T.Y. and Z.Y. wrote the main body text. Q.Q. participated in field surveys and data processing. T.A.A. improved the English language and provided editorial suggestions. M.Z. participated in field practice and data interpretation. All authors have read and agreed to the published version of the manuscript.

Funding

This research was funded by the State Key Laboratory Special Programs of China Minmetals Corporation (Grant No. 2024GZKJ03).

Data Availability Statement

The original contributions presented in this study are included in the article. Further inquiries can be directed to the corresponding author.

Acknowledgments

This research was supported by the State Key Laboratory Special Programs of China Minmetals Corporation (Grant No. 2024GZKJ03). We would like to thank Jingtao Xie for his valuable assistance in conducting the simulation calculations. At the same time, the authors gratefully acknowledge the editors and reviewers for their insightful and constructive feedback, which has significantly contributed to improving the quality of this manuscript.

Conflicts of Interest

Author Zhu Yang was employed by the Changsha Institute of Mining Research Co., Ltd. The remaining authors declare that this research was conducted in the absence of any commercial or financial relationships that could be construed as a potential conflict of interest. The authors also declare that this study received funding from the State Key Laboratory Special Programs of China Minmetals Corporation. The funder was not involved in the study design, collection, analysis, interpretation of data, the writing of this article, or the decision to submit it for publication.

References

  1. Gomo, M.; Ngobe, T. Groundwater exploration in a granite aquifer using the telluric electric frequency selection method (TEFSM) in Eswatini, Southern Africa. Sustain. Water Resour. Manag. 2024, 10, 22. [Google Scholar] [CrossRef]
  2. Yang, T.C.; Zhu, D.B.; Yawar, H.; Huang, R.; Yu, Q.; Ding, Q. Feasibility study of telluric magnetic field frequency selection method in groundwater exploration. J. Appl. Geophys. 2025, 233, 105608. [Google Scholar] [CrossRef]
  3. Cai, H.Z.; Xiong, B.; Zhdanov, M. Three-dimensional marine controlled-source electromagnetic modelling in anisotropic medium using finite element method. Chin. J. Geopohysics 2015, 58, 2839–2850. (In Chinese) [Google Scholar] [CrossRef]
  4. Gomo, M. Use of electric potential difference in audio magnetotelluric (AMT) geophysics for groundwater exploration. Groundw. Sustain. Dev. 2023, 20, 100864. [Google Scholar] [CrossRef]
  5. Liu, J.X.; Liu, R.; Guo, R.W.; Tong, X.; Xie, W. Research progress of electromagnetic method in nonferrous metal mineral exploration. Chin. J. Nonferrous Met. 2023, 33, 261–284. (In Chinese) [Google Scholar]
  6. Yao, H.B.; Ren, Z.Y.; Tang, J.T.; Lin, Y.; Yin, C.; Hu, X.; Huang, Q.; Zhang, K. 3D finite-element modeling of Earth induced electromagnetic field and its potential applications for geomagnetic satellites. Sci. China Earth Sci. 2021, 51, 1796–1812. (In Chinese) [Google Scholar] [CrossRef]
  7. Cagniard, L. Basic theory of the magneto-telluric method of geophysical prospecting. Geophysics 1953, 18, 605–635. [Google Scholar] [CrossRef]
  8. Liang, B.H. Introduction of electric pulse natural electric field method for water exploration. Karst Geol. Guangxi 1976, 2, 10–11. [Google Scholar]
  9. Yang, J. Experimental results and theoretical study of the stray current method in karst area. Geophys. Geochem. Explor. 1982, 6, 41–54. (In Chinese) [Google Scholar]
  10. Zhou, H.; Huang, C.L.; Zhou, Y. Underground magneto fluid detector and its application in mine flood detection. Miner. Eng. Res. 2009, 24, 42–45. (In Chinese) [Google Scholar]
  11. Yang, T.C.; Xia, D.L.; Wang, Q.R.; Fu, G.H. Theoretical Research and Application of Frequency Selection Method for Telluric Electricity Field; Central South University Press: Changsha, China, 2017. (In Chinese) [Google Scholar]
  12. Han, R.B.; Han, D. Theory and Practice of Frequency Selection Method for Telluric Current; Metallurgical Industry Press: Beijing, China, 2020. (In Chinese) [Google Scholar]
  13. Yang, T.C.; Gao, Q.S.; Li, H.; Fu, G. New Insights into the Anomaly Genesis of the Frequency Selection Method: Supported by Numerical Modeling and Case Studies. Pure Appl. Geophys. 2023, 180, 969–982. [Google Scholar] [CrossRef]
  14. Lu, Y.L.; Ding, H.Y.; Yang, T.C.; Liu, Y. Geothermal Water Exploration of the Maoyanhe Hot Spring Scienic Spot in Zhangjiajie Using the Natural Electric Field Frequency Selection Method. Water 2023, 15, 3418. [Google Scholar] [CrossRef]
  15. Yang, T.C.; Wang, D.Q.; Zhang, Y.P.; Fu, G.; Chen, B.; Yang, Z.; Cheng, H. Application research of comprehensive geophysical method to karst investigation in a productive mine. Prog. Geophys. 2020, 36, 1145–1153. (In Chinese) [Google Scholar]
  16. Adagunodo, T.A.; Ojoawo, A.I.; Anie, N.O.; Edukugho, P.O. Application of frequency selection and geoelectrical sounding methods for mapping of leachate’s pathways in an active dumpsite. SN Appl. Sci. 2023, 5, 352. [Google Scholar] [CrossRef]
  17. Yang, T.C.; Liang, J.; Cheng, H.; Cao, S.-J.; Dong, S.-Y.; Gong, Y.-F. The effect and the anomaly analysis of shallow groundwater exploration based on the frequency selection method of natural electric field. Geophys. Geochem. Explor. 2018, 42, 1194–1200. (In Chinese) [Google Scholar]
  18. Isah, A.; Akinbiyi, O.A.; Ugwoke, J.L.; Ayajuru, N.C.; Oyelola, R.O. Detection of groundwater level and heavy metal contamination: A case study of Olubunku dumpsite and environs, Ede North, Southwestern Nigeria. J. Afr. Earth Sci. 2022, 197, 104740. [Google Scholar] [CrossRef]
  19. Yulong, L.; Tianchun, Y.; Tizro, A.T.; Yang, L. Fast recognition on shallow groundwater and anomaly analysis using frequency selection sounding method. Water 2023, 15, 96. [Google Scholar] [CrossRef]
  20. Hu, F.; Yang, T.; Adagunodo, T.A.; Zhu, D.; Huang, R. Practice and theoretical analysis of ground penetrating radar in voids detection of urban underground pipe-jacking. J. Appl. Geophys. 2025, 233, 105639. [Google Scholar] [CrossRef]
  21. Bahr, K. Interpretation of the magnetotelluric impedance tensor: Regional induction and local telluric distortion. J. Geophys. 1988, 62, 119–127. [Google Scholar]
  22. Zhamaletdinov, A.A. A Method for Quantifying Static Shift Distortions Using a Magnetic Field of Controlled Source (CSAMT). Seism. Instrum. 2020, 56, 555–563. [Google Scholar] [CrossRef]
  23. Ward, S.H.; Hohmann, G.W. Electromagnetic theory for geophysical applications in Nabighian. In Electromagnetic Methods, Theory and Practice; Nabighian, M.N., Ed.; Society of Exploration Geophysicist: Houston, TX, USA, 1987; Volume 1, pp. 131–311. [Google Scholar]
  24. Hedlin, C. Removal of static shift in two dimensions by regularization inversion. Geophysics 1991, 56, 2102–2106. [Google Scholar] [CrossRef]
  25. Ogawa, Y.; Uchida, T. A two-dimension MT inversion assuming Gaussion static shift. Geophys. J. Int. 1996, 126, 69–76. [Google Scholar] [CrossRef]
  26. Jiang, E.; Chen, R.; Zhu, D.B.; Liu, W.; Pitiya, R. Static-shift suppression and anti-interference signal processing for CSAMT based on Guided Image Filtering. Earthq. Res. Adv. 2022, 2, 100117. [Google Scholar] [CrossRef]
  27. Melchinov, V.P.; Pavlov, A.A. Experience with a Water Detector in the Study of the Permafrost Structure. Geomagn. Aeron. 2022, 62, 271–277. [Google Scholar] [CrossRef]
  28. Guo, W.; Tang, X.G.; Sheng, G.Q. MT static correction of two-dimensional model based on the highest frequency phase method and spatial filtering method. Acta Seismol. Sin. 2022, 44, 1–15. (In Chinese) [Google Scholar]
  29. Tang, J.T.; He, J.S. Controlled Source Audio-Frequency Magnetotelluric and Its Applications; Central South University Press: Changsha, China, 2005. (In Chinese) [Google Scholar]
  30. Li, W.J. The Application of Geophysical Method in Karst Exploration; Chengdu University of Technology: Chengdu, China, 2020. (In Chinese) [Google Scholar]
  31. Berdichevsky, M.N.; Dmitriev, V.I. Distortion of magnetic and electrical fields by near-surface lateral inhomogeneities. Acta Geod. Geophys. Montan. 1976, 11, 447–483. [Google Scholar]
  32. Li, X.; Bai, D.H.; Yan, Y.L. Three-dimensional inversion of magnetotelluric resistivity model with galvanic distortion. Chin. J. Geophys. 2016, 59, 2302–2315. [Google Scholar] [CrossRef]
  33. Chave, A.D.; Smith, J.T. On electric and magnetic galvanic distortion tensor decompositions. J. Geophys. Res. Solid Earth 1994, 99, 4669–4682. [Google Scholar] [CrossRef]
  34. Bahr, K. Geological noise in magnetotelluric data: A classification of distortion types. Phys. Earth Planet. Inter. 1991, 66, 24–38. [Google Scholar] [CrossRef]
  35. Zhou, Y.; Xu, Y.X.; Liu, Y.; Zhang, S.; Zhang, L.; Li, D. Research on simulation and correction methods for static effect of electrical anisotropy in MT. Jt. Acad. Annu. Meet. China Earth Sci. 2016, 931–932. (In Chinese) [Google Scholar]
Figure 1. Galvanic distortion model.
Water 17 03314 g001
Figure 2. (a) Modulus curves of Ey for the galvanic distortion model. (b) Pseudo-section of the modulus of Ey for the galvanic distortion model.
Water 17 03314 g002
Figure 3. Sphere Model.
Water 17 03314 g003
Figure 4. (a) Modulus curves of Ey for the of sphere model. (b) Pseudo-section of the modulus of Ey for the sphere model.
Water 17 03314 g004
Figure 5. Sphere model with galvanic distortion.
Water 17 03314 g005
Figure 6. (a) Modulus curves of Ey for the sphere model with galvanic distortion. (b) Pseudo-section of the modulus of Ey. (c) Pseudo-section of the phase of Ey.
Water 17 03314 g006
Figure 7. Index map showing the location of the study site for TEFSM application. The site is indicated by red stars.
Water 17 03314 g007
Figure 8. Field photographs of the study area. (a) In situ layout of L1; (b) In situ layout of L3.
Water 17 03314 g008
Figure 9. Schematic layout of geophysical survey lines.
Water 17 03314 g009
Figure 10. Exploration results from the triple-frequency configuration on L2 and L3.
Water 17 03314 g010
Figure 11. Exploration results of the triple-frequency configuration on L4 and L8.
Water 17 03314 g011
Figure 12. Potential difference ΔV profile curves recorded at 40 frequencies along L4 and L8.
Water 17 03314 g012
Figure 13. Normalized ΔV pseudo-sections derived from 40-frequency measurements on L4 and L8.
Water 17 03314 g013
Figure 14. Core photographs. (a) Depths of 61.2–64.4 m; (b) Depths of 80.0–84.3 m; (c) Depths of 252.2–262.2 m.
Water 17 03314 g014
Table 1. Statistical summary of apparent resistivity values for representative rock types.
LithologyApparent Resistivity (Ω·m)Determination Method
Range of VariationCommon Values
Silty clay20–20040Outcrop small quadrupole configuration
Silty clay (less watery)20–200127
Granite130–14,000965
Fractured zone80–400220Electrical sounding
Disclaimer/Publisher’s Note: The statements, opinions and data contained in all publications are solely those of the individual author(s) and contributor(s) and not of MDPI and/or the editor(s). MDPI and/or the editor(s) disclaim responsibility for any injury to people or property resulting from any ideas, methods, instructions or products referred to in the content.