Article

Toward a Localized Water Footprint of Lithium Brine Extraction: A Case Study from the Salar de Atacama

Chair of Sustainable Engineering, Technical University of Berlin, 10623 Berlin, Germany
*
Author to whom correspondence should be addressed.
Water 2025, 17(22), 3311; https://doi.org/10.3390/w17223311
Submission received: 30 August 2025 / Revised: 10 November 2025 / Accepted: 13 November 2025 / Published: 19 November 2025
(This article belongs to the Section Water Use and Scarcity)

Abstract

The extraction of lithium from salt flats such as the Salar de Atacama (SdA) has raised concerns about its potential impact on the local water balance. This study evaluates the possibility of including localized mining impacts on groundwater tables, lagoons, brine–freshwater mixing, evaporation, precipitation feedback, and recharge in a localized water footprint case study of lithium mining in the SdA. Using ready-to-use hydrogeological models, we primarily assessed the effects of lithium extraction on groundwater levels, evaporation, precipitation, and basin recharge dynamics. The influence on evaporation and recharge appears to be limited, with surplus evaporation due to mining accounting for a maximum of 4% of basin-wide evaporation. Regarding groundwater tables, drawdown exceeding 25 cm to several meters has largely been confined to areas that are not critical for local ecosystems. Available hydrogeological models have also helped to estimate whether the extraction of freshwater by mining companies can exacerbate groundwater drawdown during brine extraction. Consequently, non-overlapping, geographically distinct depression cones have been identified, but total water consumption by all users in the basin has not been considered. Furthermore, the aspect of model uncertainty requires further investigation, as do changes in lagoon areas and brine–freshwater mixing, which are not yet comprehensively captured by existing models.

1. Introduction

Lithium is a critical resource [1,2,3], with global demand increasing progressively in recent years [4]. The majority of the world’s known lithium reserves (approx. 60%) are found in continental brines [5,6], with the Salar de Atacama (SdA) in northern Chile being the largest producing brine deposit in the world [7,8]. The SdA forms part of the Atacama Desert, known as the driest and oldest desert in the world [9,10,11]. The main features of the natural water balance of the SdA basin are determined by evaporation and precipitation, with no relevance of discharge to the sea [12,13]. The Atacama salt flat itself represents the basin’s sink [13,14]. It contains the salt flat nucleus from which lithium brine is extracted at an altitude of about 2300 m above sea level [13]. Within the salt flat, groundwater tables lie close to the land surface, which allows for phreatic evaporation from groundwater [15]. Precipitation, on the other hand, comes mainly from the surrounding mountain ranges, which occasionally form surface drainage networks and infiltrate into the groundwater downhill within an alluvial zone [13]. Due to the density contrast between the brine formed over long periods of time by evaporation and the inflowing freshwater from the mountains, a saline interface with a mixing zone is commonly present at the margins of the salt flat [15,16,17,18]. When groundwater recharged from the mountains reaches this zone, the density difference creates an upward groundwater flow that supports many lagoons with valuable ecosystems [13,15]. These include particularly unique ecosystems, such as the Reserva Nacional de los Flamencos, an official Ramsar site [13]. Increased lithium brine extraction has raised concerns about its potential impact on surrounding water bodies (e.g., on local groundwater levels and lagoon surface areas) [19,20,21,22]. The SdA hosts important groundwater-fed lagoons and wetland systems, including the lagoon systems of Soncor, Quelana, Peine, and Tilopozo [23]. Furthermore, the potential impact of lithium mining on local flora and fauna [19,20,24], local communities [19,20,21], and the mixing of lower-salinity water with lithium brine has been discussed in the literature [25,26].
In the SdA, the process of mining lithium involves pumping lithium-rich brine into a series of evaporation ponds [27]. Over time, various salts precipitate out and are removed as the lithium becomes increasingly concentrated [27]. A large proportion of the water content of the extracted lithium brine is consumed through evaporation from the ponds’ surface [27,28]. Water footprinting based on life cycle assessment (LCA) is an appropriate tool for assessing water-related environmental impacts (e.g., water scarcity impacts) along a product’s life cycle [29] and has been widely used in the lithium mining context [26,28,30,31,32,33,34,35,36,37]. However, default LCA-based water footprints cover global production systems and typically do not reflect the local characteristics of such an extreme environment. They focus on freshwater scarcity impacts along the supply chain, with the majority of studies not accounting for the consumption of brine [26,33,34,35,36,37], usually due to its high salinity, making it unfit for human use [33,34,36,37]. While this approach is scientifically sound and in line with the ISO water footprint standard 14046 [29], the majority of water-footprint-related work still recognizes the fact that brine extraction may have induced effects on local ecosystems [38]. Although a comprehensive water footprint assessment according to ISO should take into account all environmentally relevant attributes [29], such localized effects of brine extraction are not yet fully addressed within applied water footprinting [38].
In Link et al. [38], we suggested a set of localized accounting principles for water footprinting, specifically relevant in the context of lithium brine mining. The principles were developed based on the ISO 14046 standard [29] and known hydrological features of the salar. They address water functionality (i.e., how water of different salinity or quality supports various human and ecosystem functions) and the induced effects of extracting lithium brine on the hydrological system. A total of ten principles were defined, which are presented below as principles (a) to (j).
(a)
Defining functional water quality descriptors for different water types along the salinity gradient within the study region, offering insights into how ecosystem functions may be affected by changes in water volume, surface area, or depth;
(b)
Quantifying lithium brine extraction and evaporation losses from lithium ponds;
(c)
Modeling the spatially resolved effect of brine extraction on groundwater level decline in the surrounding environment;
(d)
Estimating changes in phreatic evaporation from shallow groundwater due to groundwater level drawdown;
(e)
Assessing the effect of brine extraction on the surrounding lagoon surface area;
(f)
Quantifying potential mixing effects between brine and lower salinity water due to lithium brine extraction;
(g)
Addressing changes in net evaporation that are determined by summing artificial evaporation from lithium ponds, reductions in phreatic evaporation due to drawdown of the groundwater level, and reductions in evaporation due to the shrinking lagoon area;
(h)
Estimating how changes in net evaporation affect precipitation feedback and basin recharge in the basin;
(i)
Linking induced hydrological effects to a functional unit representing the quantified performance of a product system (e.g., the impact of production in relation to a specified amount of intermediate lithium product);
(j)
Incorporating future scenario analyses to evaluate potential long-term impacts of brine extraction.
The aim of this work is to test the applicability of accounting principles (a) to (j) in a localized LCA-based water footprint case study of lithium mining in the SdA. This will be achieved by applying primary data-based hydrogeological models currently available for the region. Where these models do not adequately address specific aspects of the accounting principles, a review of the literature will be conducted to identify the current state of knowledge and derive recommendations for future research.

2. Materials and Methods

2.1. Case Study Region, Models, and Definition of Functional Water Quality Descriptors (a)
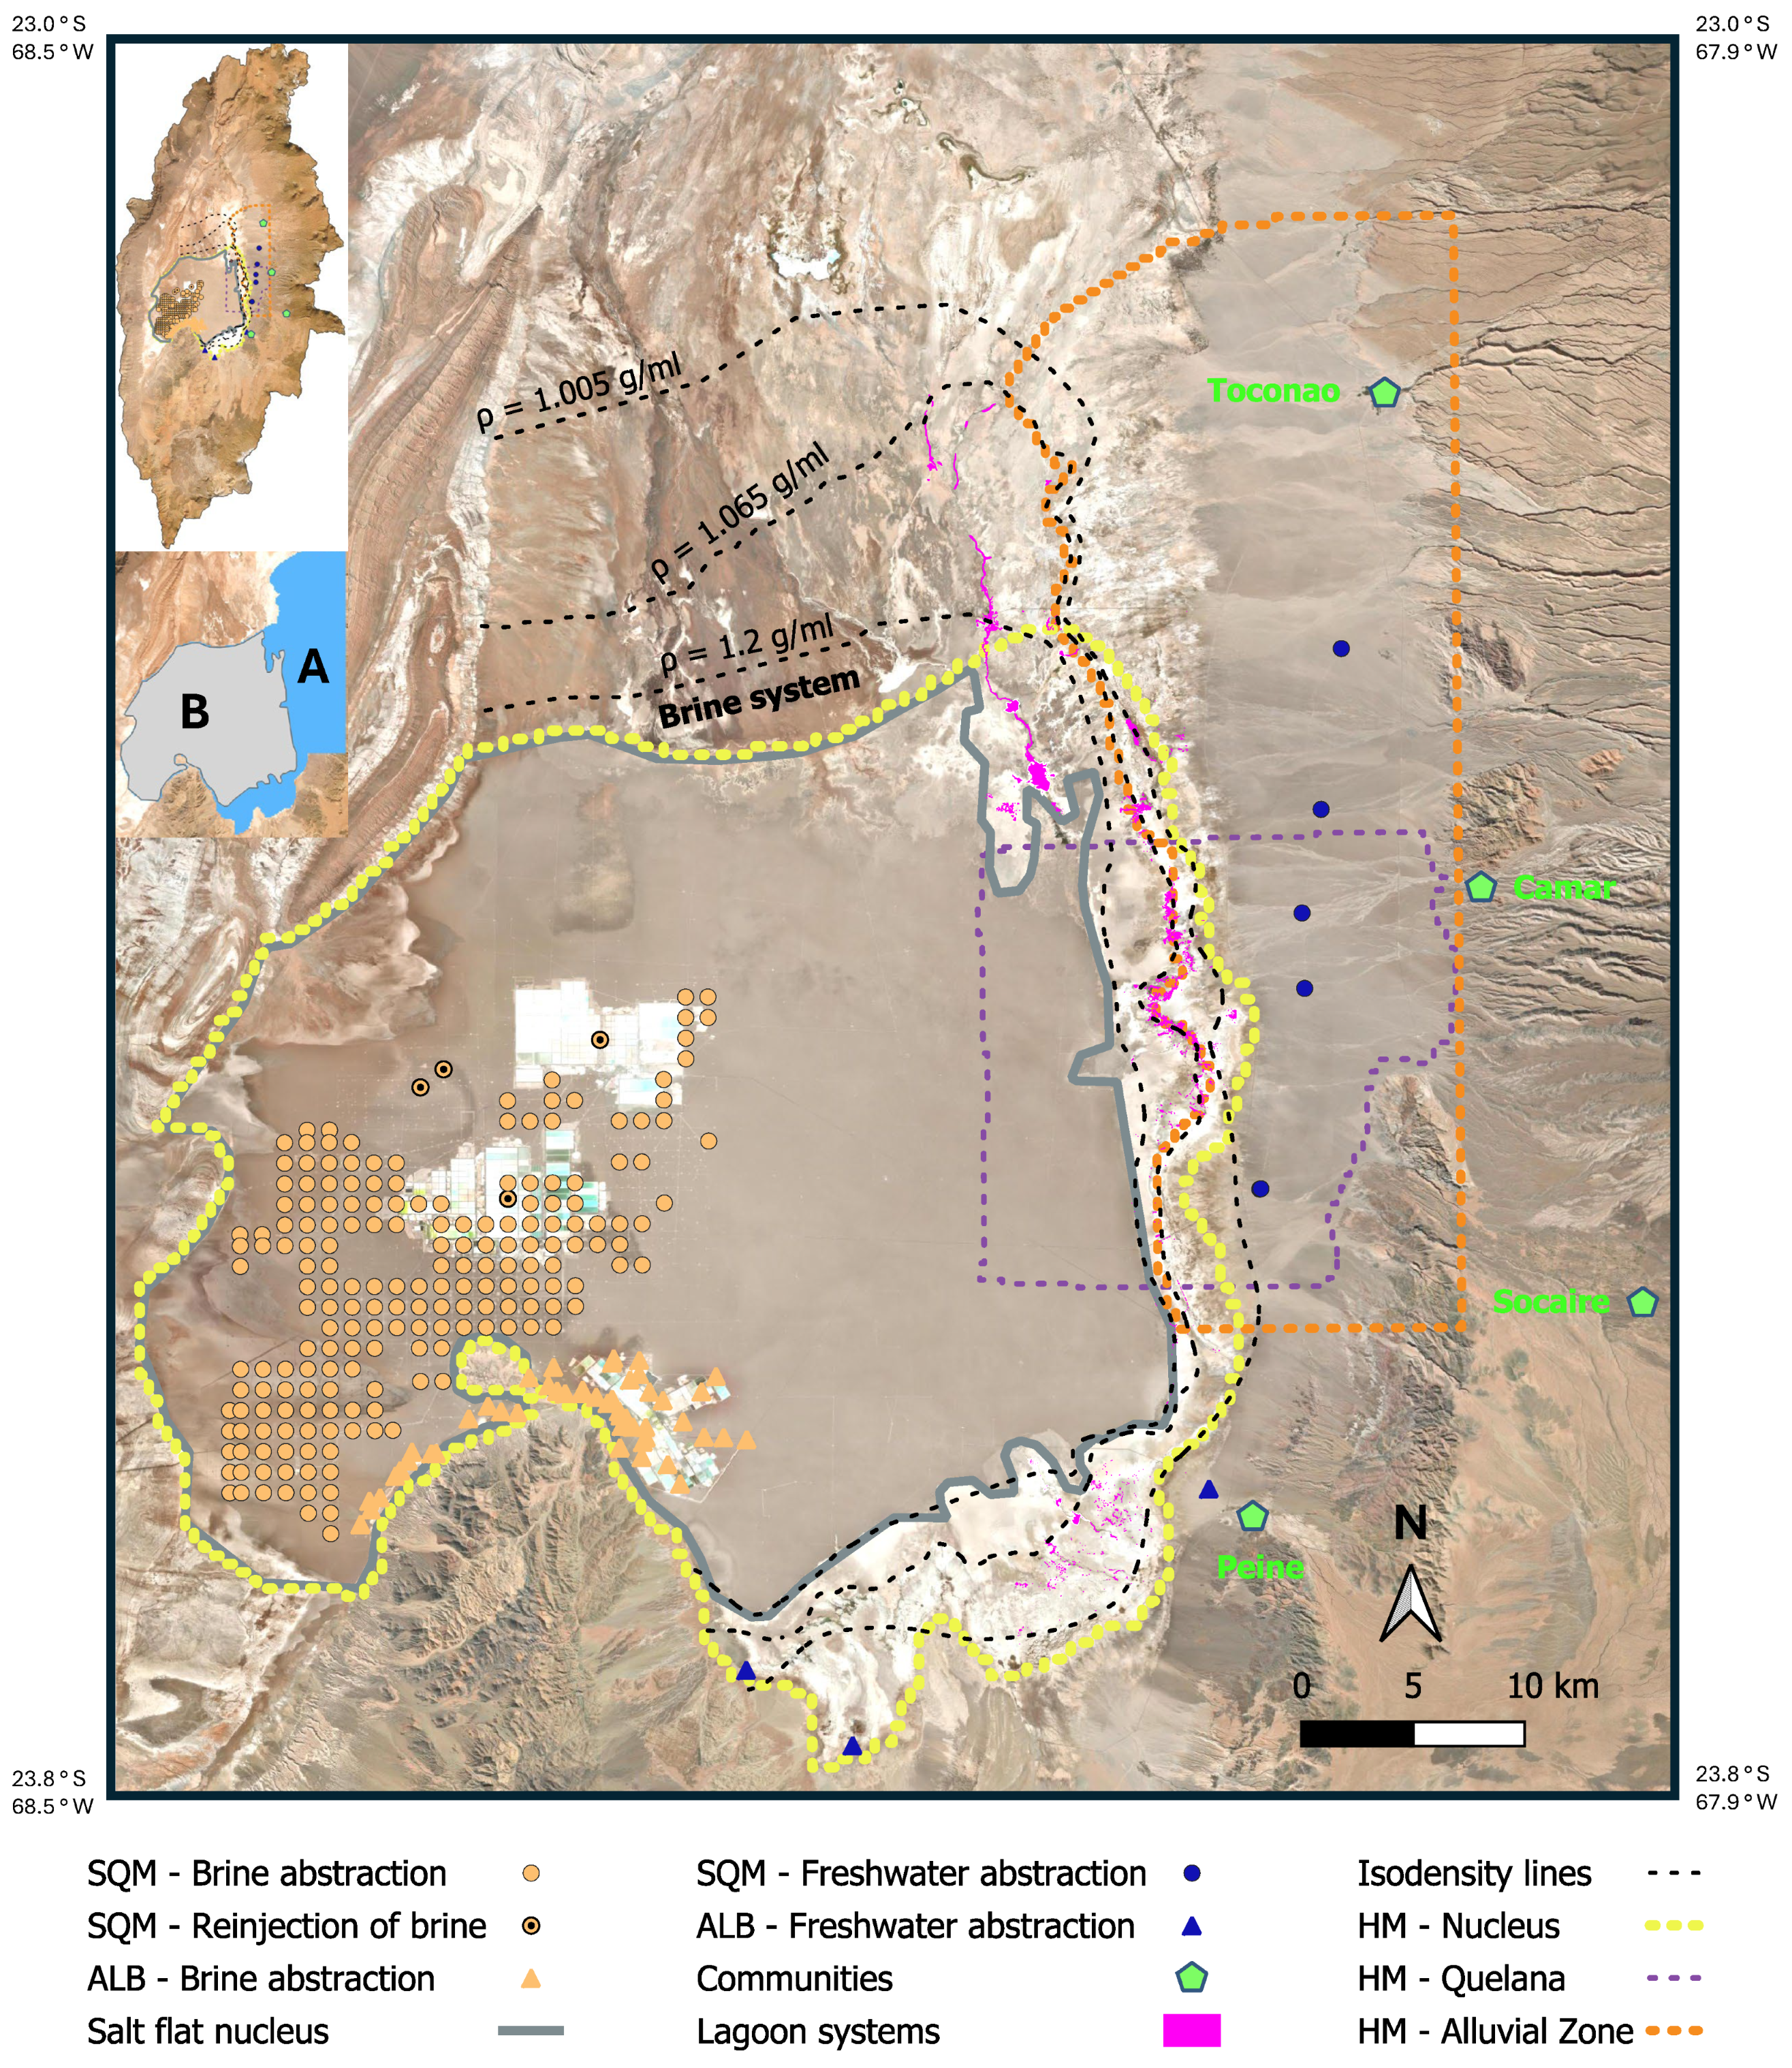
The location of the case study area is shown in Figure 1, where the salt flat nucleus represents the area suitable for lithium mining. Lithium brine extraction occurs in the western part of the salt flat nucleus. Beige labels mark the brine abstraction and reinjection points of the two operating lithium mining companies, Albemarle Corporation and Sociedad Química y Minera (SQM). Black-dashed isodensity lines indicate different fluid zones at the intersection with the groundwater surface [39]. The fluid zone fully equilibrated with the brine encompasses the salt flat nucleus and extends slightly beyond it (Figure 1) [39]. This zone corresponds to densities of ρ ≥ 1.2 g/mL [39], equivalent to electric conductivity (EC) ≥ 214,000 µS/cm or total dissolved solids (TDS) ≥ 320,000 mg/L, indicating salinity many times higher than seawater [29,33,40]. Other isodensity lines correspond to ρ = 1.065 g/mL (EC = 126,000 µS/cm; TDS = 130,000 mg/L) and ρ = 1.005 g/mL (EC = 5000 µS/cm; TDS = 2500 mg/L).
The relationship between EC (mS/cm) and TDS (g/L) is given in Equation (1), after Marazuela et al. [41]:
T D S = 3 10 5 E C 3 0.0049 E C 2 + 1.1947 E C 3.4357
Figure 1. Spatial coverage of hydrogeological models (HMs) used in the SdA case study; yellow dashed line: salt flat nucleus zone model [42]; purple dashed line: Aguas de Quelana model [43]; orange dashed line: alluvial zone model [44]; symbols indicate brine extraction/reinjection points and freshwater extraction sites by mining companies; black dashed isodensity lines mark fluid zones at groundwater surface level corresponding to varying salinity levels [39]: ρ ≥ 1.2 g/mL (EC ≥ 214,000 µS/cm; TDS ≥ 320,000 mg/L): full brine equilibrium; ρ = 1.065 g/mL (EC = 126,000 µS/cm; TDS = 130,000 mg/L); ρ = 1.005 g/mL (EC = 5000 µS/cm; TDS = 2500 mg/L); the inset in the top left shows the model boundaries within the SdA catchment area, as well as the water quality zoning (zones A and B), as defined in Table 1.
Water 17 03311 g001
We classify areas beyond the salt flat nucleus, beginning at the isodensity line of ρ = 1.005 g/mL (EC = 5000 µS/cm; TDS = 2500 mg/L), as part of the freshwater system, although they exceed the conventional freshwater threshold of TDS ≤ 1000 mg/L [29]. The SdA is an extreme environment where most waters surpass this limit [29,39]; nevertheless, waters with slightly higher TDS values can still fulfill freshwater functions such as irrigation according to local norms [45,46]. Figure 1 depicts the locations of mining companies’ freshwater wells, while additionally indicating the positions of relevant lagoons and surrounding communities. About the lagoons, Figure A1 of Appendix A provides an additional zoomed-in view of the main lagoon systems linked to the salt flat nucleus.
To test accounting principles (a) to (j) introduced in Section 1, we primarily used output data from numerical hydrogeological models provided by the mining company SQM [42,43,44]. These models are built and calibrated using primary data such as field measurements and monitoring records and focus on groundwater table modeling under different brine and groundwater extraction scenarios. They encompass the core area of lithium mining (salt flat nucleus) and adjacent areas, including larger lagoon systems [42], the “Aguas de Quelana” sector with its numerous permanent and seasonal lagoon systems [43], and the alluvial zone to the east [44]. The spatial coverage and boundaries of the models are shown in Figure 1 with yellow (nucleus), purple (“Aguas de Quelana”), and orange (alluvial zone) dashed lines. Brief model descriptions can be found in Appendix B.
As a first step for conducting the case study, we derived functional water quality descriptors according to accounting principle (a). Rather than relying on fixed salinity thresholds to define water functionality, we derived a simplified spatial zoning approach that more effectively captures both direct and indirect aspects of water functionality. The zoning is shown in the inset in the top left of Figure 1 and described in more detail in Table 1. Water functionality zone A refers to the area outside the salt flat nucleus, whose boundaries are marked by the thick grey line in Figure 1. It extends across all fluid zones, with a major part not in equilibrium with brine. This zone hosts both local lagoon systems and occasionally groundwater-dependent vegetation [13,47,48]. Some of the water in this zone is of a salinity that meets local requirements for human use. For instance, according to Chilean norms, water used for drinking purposes needs to have a TDS ≤ 1500 mg/L (NCh409; [46]) and water used in agriculture a TDS ≤ 5000 mg/L (NCh1333; [45]). On the other hand, water from local lagoon systems can also reach hypersaline conditions, e.g., within the Soncor lagoon system located near the salt flat nucleus [49]. With respect to the brine–water mixing zone, there are lagoons that are indirectly supported by brine, which induces upward groundwater flow of lower salinity water [13,15]. Overall, there is no lithium brine extraction associated with zone A. To protect local ecosystems and ensure access to groundwater for nearby communities, we suggest that extraction outside zone A should not negatively affect water heights, surface areas, and volume levels within the zone.
Table 1. Characteristics of the defined functional water quality zoning.
CharacteristicsWater Functionality Zone AWater Functionality Zone B
Fluid systemCovers all fluid zones with a major part not in equilibrium with brineExclusively refers to the fluid zone in full equilibrium with brine
Local specificationRepresents areas outside of the salt flat nucleusRepresents the area of the salt flat nucleus
Functional water quality descriptors for humansPartially meets the requirements for direct human use according to Chilean norms (e.g., when TDS ≤ 5000 mg/L) [45,46]Highly saline brine that is not intended for direct human use
Functional water quality descriptors for ecosystemsOutside the salt flat nucleus, possibly supporting local vegetation assemblages [50]
Supporting lagoons that provide habitats for local animal species adapted to high salinity conditions, either directly or indirectly (by inducing upward groundwater flow) [19]
Does not support local flora in surface ecosystems [50]
There are no critical lagoon systems in the overlying area [50]
Consideration of brine consumption in the context of water scarcityNot applicable as there is no consumption of brine in this zoneConsumption of brine as such is not considered as it does not directly deprive humans and local flora and fauna of water for direct uses
Consideration of induced (indirect) effects of brine consumption in the context of water scarcityBrine extraction shall not affect water levels, surface areas, and volumes within this zone, to protect local surface ecosystems and ensure access to groundwater for human purposes (freshwater system)Reductions in groundwater heights and volumes are acceptable, provided these effects do not extend into zone A
Water functionality class B, on the other hand, exclusively refers to the fluid zone in full equilibrium with brine. As shown in Table 1, this zone contains water that is not intended for direct human use due to its high TDS content. We neglected the direct function of the underground brine reservoirs for adapted microorganisms that inhabit them (e.g., halophytic bacteria [51]) and instead focused on their potential functions for surface ecosystems. However, brine in the salt flat nucleus does not directly support above-lying lagoon ecosystems or groundwater-dependent vegetation assemblages [50]. To sum up, the consumption of brine does not deprive humans and local flora and fauna of water for direct use. Furthermore, we assume that reductions in groundwater tables in zone B are acceptable to a certain limit as long as effects do not spill over into zone A.

2.2. Quantifying Lithium Brine Extraction and Evaporation Losses from Lithium Ponds (b)

With respect to lithium brine extraction, we considered both extraction from Albemarle Corporation and SQM (see Appendix C for assumed (net) extraction rates). The main abstraction points of lithium brine are marked by beige labels in Figure 1. The amount of water that evaporates in the evaporation ponds depends on the average water content of the pumped brine (⊘water ≈ 70%; TDS ≈ 300,000 mg/L [52]), its initial lithium content (approx. 0.17% [53]), and the target lithium content at the end of the evaporation process (6%) [7]. Based on these assumptions, about 97% of the water is evaporated during the evaporation process in the ponds, which corresponds to about 0.68 kg water per kg brine abstracted. Using net brine extraction data from Companies A and B, we calculated the volume of water that evaporated during the up-concentration process in the lithium ponds. SQM provided us with hydrogeological model outputs reflecting the conditions in 2020, which we used as a reference year [54].

2.3. Modeling the Effect of Brine Extraction on Groundwater Level Decline (c)

To assess the potential for groundwater levels to decline due to lithium mining, we used output data from SQM’s hydrogeological models (Appendix B). The relevant model [42], developed by SQM’s hydrogeological department, focuses on trends in groundwater table elevations within the nucleus system (nucleus hydrogeological model; yellow dashed line in Figure 1), which encompasses both the salt flat nucleus and the brine–water mixing zone. In terms of lowering water tables, the most suitable available output of the hydrogeological model for characterizing present-day conditions referred to the period between 1986 (when operations began) and 2020 (the reference year), forming the baseline scenario. However, the modelling of scenarios includes projections of drawdown beyond this period (Section 2.9). In addition to climatic conditions, we assumed that groundwater levels in the nucleus system are primarily driven by brine pumping. To distinguish between these effects, the outputs of a model that simulated brine extraction and its impact on local groundwater tables were separated from those of a natural forcing scenario [42]. The available brine forcing scenario also included Albemarle freshwater withdrawal. All outputs at the respective model nodes were transformed into area-related averages using Thiessen polygons. Then, we aggregated the results on a continuous rectangular grid of 400 m × 400 m resolution.

2.4. Estimating Changes in Phreatic Evaporation from Shallow Groundwater Tables (d)

Based on the estimation of groundwater drawdown due to lithium brine extraction, we derived potential changes in phreatic evaporation. We used an existing local dataset from a study by SRK Consulting to determine evaporation as a function of varying groundwater levels [55]. This dataset covers the full extent of the hydrogeological model that was used to assess variations in the groundwater table within the nucleus zone (delineated by the yellow dashed line in Figure 1 and Figure 2) and extends slightly beyond its boundaries. It divides the area into zones with similar evaporation behavior, as shown in Figure 2.
The relationship between evaporation and varying groundwater levels in each zone was defined empirically. Two empirical relationships were used to characterize evaporation behavior: the method by Philip [56], presented in Equation (2), and the approach based on Morel-Seytoux and Mermoud [57], presented in Equation (3).
E v a p o r a t i o n   r a t e   [ m m d 1 ] = a e G W d e p t h b
E v a p o r a t i o n   r a t e   m m d 1 = a G W d e p t h b  
In both equations, a and b are fitting parameters that are adjusted to match observed data. Appendix D summarizes, for each evaporation zone, the selected empirical equation, the maximum evaporation rates, the fitted parameter values (a and b), and the start adjustment groundwater table depth in cases where the Morel-Seytoux and Mermoud method [57] was applied.

2.5. Estimating Effects on Surrounding Lagoon Surface Area (e)

Lagoon systems and potential reductions in lagoon surface area have not yet been implemented in the available hydrogeological models. Therefore, we only explored this aspect through the literature by considering research by Guiterrez et al. [20] and Guzmán et al. [23] that analyzed effects on lagoons in the SdA. In addition, we considered stable groundwater levels in the vicinity of the lagoon systems as a potential indication that the systems may not be significantly affected by brine extraction.

2.6. Quantifying Potential Mixing Effects Between Brine and Lower Salinity Water (f)

As mixing effects were not yet quantifiable with available hydrogeological models, the issue was briefly summarized using a selection of relevant literature [25,26,32,58,59].

2.7. Estimating Changes in Net Evaporation (g) and Effects on Precipitation Feedback and Basin Recharge (h)

The aspect of net evaporation was addressed by determining the difference between artificial surplus evaporation from lithium ponds and potential reductions in phreatic evaporation due to brine extraction. Changes in surface water evaporation were not included. Finally, short-term precipitation feedback and recharge were incorporated using a global dataset on atmospheric moisture tracking [60] and knowledge of the average recharge fraction of local precipitation. The moisture tracking dataset used contains the spatially resolved areas of reprecipitation for land evaporation across a 1.5° × 1.5° grid [60]. Using annual averages, we aggregated this information to the shape of the SdA basin and determined the fraction of evaporated water that rains back within the same basin. According to Berger et al. [61], this process is referred to as basin internal evaporation recycling (BIER). To estimate the average recharge fraction of precipitation, we used the average values reported by Moran et al. [62] and incorporated findings from hydrogeological investigations conducted by SQM [63].

2.8. Linking Induced Hydrological Effects to a Functional Unit (i)

Considering functional water aspects next to induced changes in groundwater levels, evaporation, precipitation feedback, and recharge, the accounting in the case study focused on the following numbers. First, the average groundwater drawdown related to functionality zone A was considered. This served to demonstrate the average effect of brine extraction on groundwater levels in areas critical to the local ecosystem. Second, changes in basin recharge outside the salt flat nucleus were analyzed. For simplicity, it was assumed that all basin recharge occurs outside the salt flat nucleus, where precipitation is significantly higher. The effects on recharge were related to the overall water budget of the region, taking into account annually renewable water resources as reported by Moran et al. [62].
The results were related to one ton of harvested concentrated lithium brine that was set as a functional unit. In addition, to assess whether the effects of brine extraction can be separated from the effects of other water extraction, we considered the 2020 outputs of the hydrogeological models for the Aguas de Quelana system (dashed purple line in Figure 1) and the alluvial zone (dashed orange line in Figure 1). These outputs considered additional groundwater extraction for freshwater purposes in comparison to scenarios including natural forcing plus brine pumping (Aguas de Quelana) or natural forcing alone (alluvial zone). We made the simplified assumption that in the alluvial zone, groundwater levels are mainly influenced by groundwater extraction for freshwater purposes and that the influence of brine abstraction is negligible so far. This assumption is supported by existing studies that have limited the brine-induced groundwater drawdown since 1986 mainly to the west and center of the nucleus system, further extending eastward to the edge of the mixing zone [64,65]. As a conservative measure, all brine-induced effects of mining were attributed to the lithium product, with no share of the impacts being allocated to potential co-products.

2.9. Incorporation of Future Scenario Analyses (j)

Finally, future analyses were presented comparing the outputs on groundwater levels from the numerical model of the nucleus system for the years 2030, 2042, 2050, 2075, and 2100 to the year 2020. Brine and water abstraction data fed the numerical models until 2030 (end of contractual period for SQM) and 2042 (end of contractual period for Albemarle), respectively. The extension of the time horizon beyond these points served to identify possible delayed effects of brine abstraction or recovery times of groundwater tables that may occur after the operational period. Brine and groundwater extraction rates that fed the models are shown in Table A1 of Appendix C.

3. Results and Discussion

The results are presented and discussed in subsections that follow the sequence of accounting principles (a) to (j), with the headings indicating the corresponding content.

3.1. Water Functionality Zoning (a)

The applied water functionality zoning (Table 1, Figure 1) represents a simplified zoning using two functionality zones. As far as possible, it accounts for all changes in water level, surface area, or volume outside the salt flat nucleus, where sensitive ecosystems or humans may be affected. We consider this a rather conservative assumption. However, other approaches to water functionality zoning may be equally valid and scientifically sound.

3.2. Evaporation from Lithium Ponds (b)

Based on the methodology described in Section 2.2, the evaporation from lithium ponds (reference year 2020) was estimated to be 44,000,000 m3 per year.

3.3. Spatially Resolved Effect of Brine Extraction on Groundwater Level Decline (c)

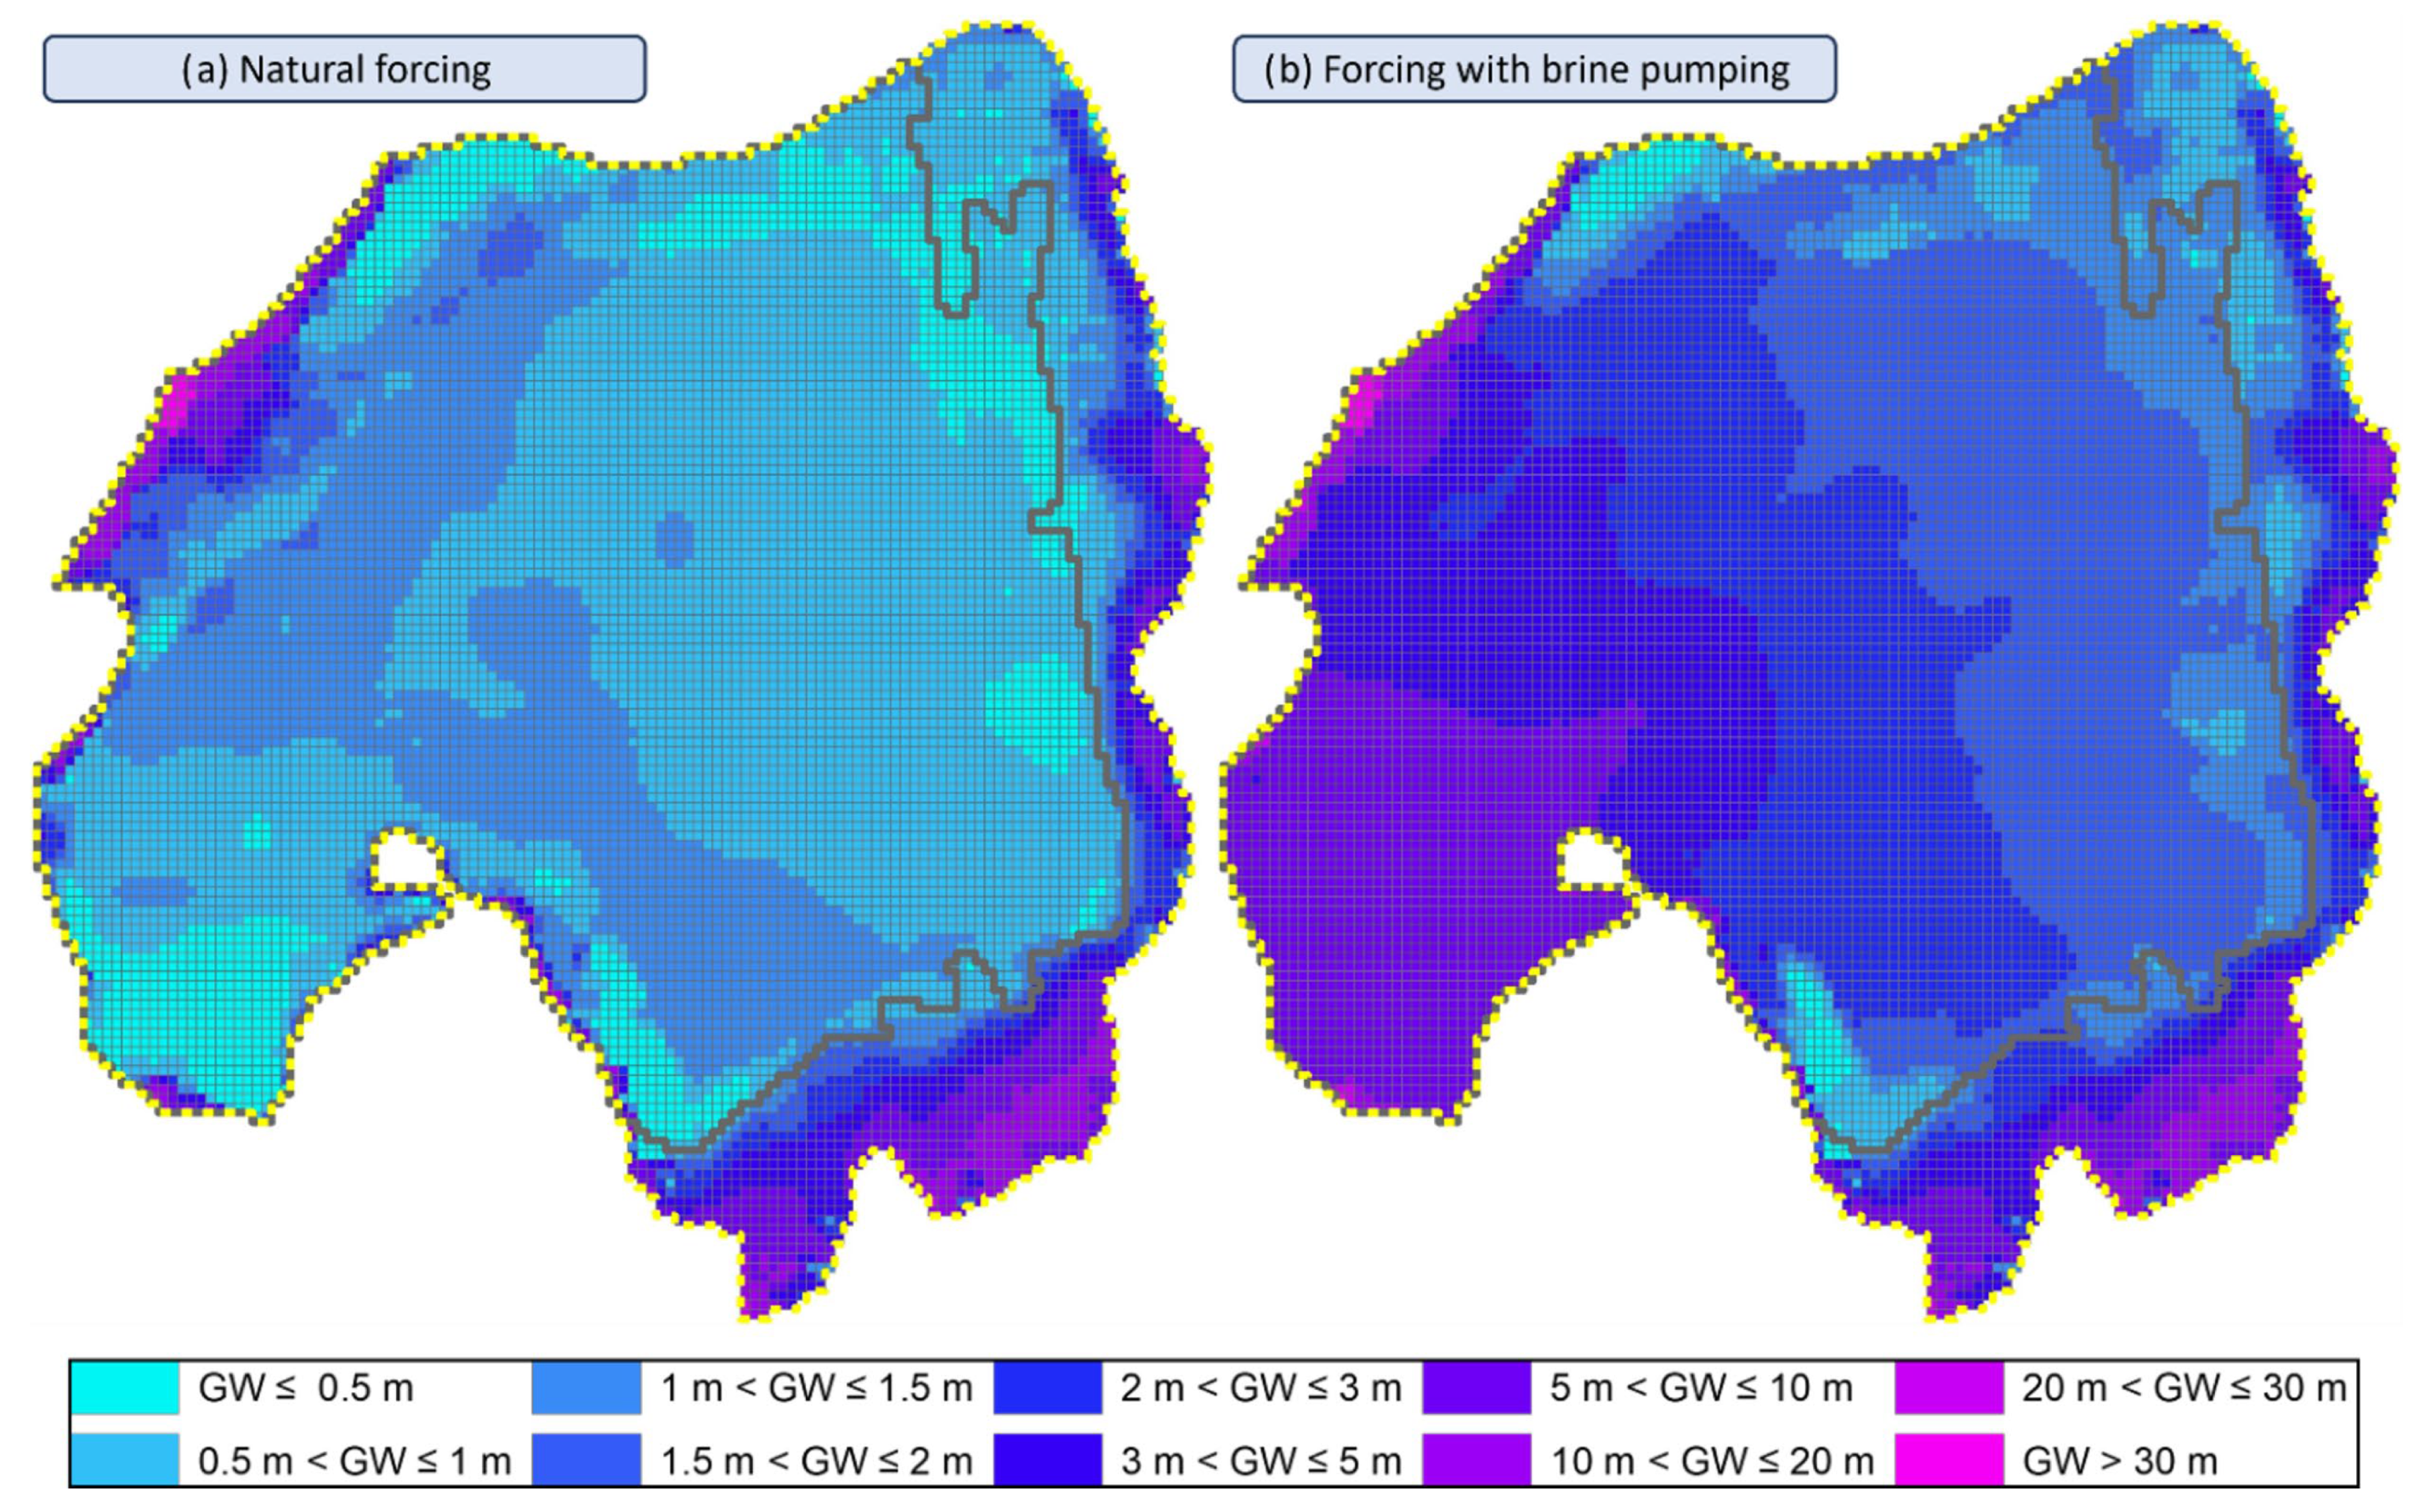
Figure 3 shows the groundwater levels for the reference year 2020, under both a natural forcing scenario and a scenario that includes brine extraction. The absolute difference between the two scenarios is plotted in Figure A2 of Appendix E. This indicates that drawdown is largely confined to the salt flat nucleus, especially in the west near SQM wells, which extract more brine than Albemarle’s operations, with declines exceeding seven meters in certain locations. Outside the salt flat nucleus, the drawdown is generally less than 25 cm, with an average of 13 cm, and a few outliers of up to 4 m.
The outliers in the southwestern part of the model can be explained by the freshwater extraction of Albemarle, which was part of the brine forcing scenario. A slight lowering of the groundwater table also takes place in areas where lagoon systems are present. However, this drawdown does not extend extensively across the boundary of the salt flat nucleus, so the potential effects of brine extraction on sensitive ecosystems are considered to be rather small up to this period. Nevertheless, potential uncertainties of the hydrogeological model should be considered. These uncertainties were discussed with the modelers and can be summarized as follows: the nucleus model is a regional model primarily focused on brine density. It has a transitional zone in the east, which can be challenging to handle. Thus, while it is possible to develop representative flow and hydraulic head trends in this zone, it is difficult to calibrate the magnitude of the head accurately, which can result in errors of up to 5 m. Additionally, the nucleus model has a long processing time. Due to this limitation, conducting a comprehensive uncertainty analysis becomes impractical. Improvements could involve optimizing the model’s run time to allow for a more thorough analysis of the system and its uncertainties. Adding an uncertainty analysis component to the modeling process would allow the range of possible outcomes to be quantified and better understood, providing a more comprehensive assessment. In addition, fine-tuning of some conceptual aspects of the model, such as geometry, groundwater recharge, and surficial recharge, could be targeted to improve the accuracy and reliability of the model.

3.4. Changes in Phreatic Evaporation (d)

Phreatic evaporation under natural conditions within the delineation of the model for the nucleus system was estimated to be 34,570,000 m3 per year. This is slightly less than the annual evaporation from lithium ponds. Brine extraction and lowering of the water table can reduce phreatic evaporation to 8,910,000 m3 per year, representing a reduction of approximately 74%. However, it should be kept in mind that these figures allow, at best, a rough classification of the possible orders of magnitude for the change in evaporation. In the study area, evaporation can change exponentially with the depth of the groundwater table, so shifts in the water table of just a few centimeters can result in significant changes in evaporation (see Appendix D). Thus, the results are subject to some uncertainty. The fact that changes in groundwater levels and evaporation may also be present beyond the boundaries of the model may add to this. The uncertainty of the variable evaporation is also reflected in the literature, which gives a wide range of values for the evaporation discharge in the basin, ranging from 1.6 to 22.7 m3·s−1 (approx. 50 million to over 700 million m3 per year) [64,66].

3.5. Effects on Surrounding Lagoon Surface Area (e)

As lagoon systems have not yet been incorporated into existing numerical hydrogeological models, the results are based on a comparison of the available literature on this issue in the SdA. Guiterrez et al. [20] explored the impact of climate change and lithium mining on surface water availability, primary productivity, and populations of three flamingo species in the Lithium Triangle. The study used climate and primary productivity data, remote sensing data on surface water levels, and a 30-year dataset on flamingo abundance and evaluated them using structural equation modeling. The authors found that the abundance of flamingo species varied significantly from year to year in response to varying surface water levels and primary productivity in the region. However, there were no observable long-term trends. In addition, the results postulated that mining in the SdA is negatively correlated with the population of two out of three flamingo species.
Guzmán et al. [23], on the other hand, investigated the dynamic behavior of the main lagoon systems in the SdA using Landsat satellite imagery processing and statistical analysis for the period between 1986 and 2018. Multivariate analysis indicated no negative impact of brine extraction on lagoon area evolution [23]. The authors noted that the limited resolution of Landsat imagery and the exclusion of small surface water bodies from the analysis may have introduced errors in the surface measurements [23]. Therefore, they suggested that future research should compare results from different image sources or technologies with better spatial resolution [23]. High spatial resolution is particularly important in the Aguas de Quelana lagoon system because there is a large number of dispersed, highly dynamic, and non-permanent lagoons [67].
Since there are conflicting results regarding the influence of lithium brine extraction on the evolution of lagoon surface area, we recommend that future research focus more heavily on the development of numerical hydrogeological models that couple brine/groundwater dynamics with surface water behavior. However, the fact that groundwater levels around sensitive lagoon systems did not decrease significantly may indicate that the impact of brine extraction on these systems has been rather small so far. Assuming that lithium extraction is not the predominant driver of changes in lagoon surface area to date would also be consistent with the work of Moran et al. [62], who emphasized the importance of other influencing factors, such as climate and the full range of water users (e.g., the copper industry), in the basin.

3.6. Potential Mixing Effects Between Brine and Lower Salinity Water (f)

Several studies have suggested that brine could mix with lower-salinity waters in the SdA. Depending on the permeability of the salar’s boundaries, Houston et al. [25] proposed that brine extraction and the resulting depression cone could facilitate this process. Chordia et al. [26] recommended including mining-induced freshwater seepage into the brine aquifer when calculating freshwater consumption, but were unable to do so due to a lack of data. Mas-Fons et al. [32] included freshwater seepage in their water consumption scenarios but did not specify how. We assume that they made a conservative assumption, namely that for every cubic meter of brine extracted, an equivalent amount of freshwater would seep in. A valuable tool to identify and characterize the occurrence of mixing processes may be isotopic analysis [58,59]. Finally, it is recommended that enhanced future numerical hydrogeological models incorporate such multi-density flow dynamics.

3.7. Net Evaporation (g) and Effects on Precipitation Feedback and Basin Recharge (h)

Net evaporation, the difference between additional evaporation from evaporation ponds minus the reduction in phreatic evaporation due to drawdown of the water table, was estimated to be 18,340,000 m3 per year. Since potential reductions in phreatic evaporation beyond the boundaries of the nucleus model were not considered, this value could also be significantly lower. This implies that evaporation from lithium ponds and reductions in phreatic evaporation could further offset each other. The overall relevance of the determined net evaporative flux can be assessed by comparing it with the total evaporation in the catchment. Taking Marazuela et al. [13] into account, we can estimate a value of 14.9 m3 s−1. This corresponds to an evaporative flux of approximately 470 million m3 per year, making the positive net evaporative contribution from lithium mining marginal and less than 4% of the total.
Part of the net evaporative flux rains back in the originating basin, which refers to the BIER. Figure 4 shows the average fraction of BIER for the SdA basin based on numerical moisture tracking [60]. On average, about 0.65% of the water evaporated in the SdA may return to the basin through reprecipitation. However, this also means that most of the atmospheric moisture rains down on remote areas, such as the Argentinian region in the east of the basin. Furthermore, only a fraction of the precipitation that returns to the basin of origin contributes to the building of new surface and subsurface runoff and thus to basin recharge. Based on Moran et al. [62] and further hydrogeological research [63], the recharge fraction of the rainfall within the basin ranges from 8.8% to a maximum of 70%. Therefore, the runoff relevant part of the basin internal evaporation recycling (BIERrunoff) represents a percentage share between 0.06% and 0.46%. Multiplying this by the potential net evaporation from lithium mining gives an indication of how mining activity could potentially affect basin recharge. In this context, lithium brine mining could potentially stimulate an additional recharge of between 10,500 and 83,500 m3 per year. This compares to a total catchment recharge of approx. 85 to 517 million m3 per year (2700 to 16,400 L·s−1) [62,63]. Thus, the potential for lithium mining to affect basin recharge through increased evaporation and precipitation feedback is very low and, in our view, negligible. Based on our analysis, no more than 0.1% of catchment recharge could be attributed to this. This contrasts sharply with the findings of Guzmán et al. [68], who postulated that surplus evaporation from lithium ponds could reduce (fresh)water stress in the basin through induced precipitation pulses. Based on statistical analysis, they attributed 20.5% of regional precipitation in the SdA to lithium mining [68]. If true, this would imply a far greater impact on basin recharge than we have suggested. However, we believe that an effect of this magnitude is highly unlikely and is due to weaknesses in the study design. One major weakness of the study by Guzman et al. [68] is the assumption of a closed system with respect to the SdA basin, which is not an appropriate assumption for the atmospheric compartment.

3.8. Relating Results to a Functional Unit (i)

For one ton of lithium concentrate (6%), as obtained at the end of the residence time in the evaporation ponds, approx. 3.125 tons of lithium brine must be extracted. Regarding changes in the depth of the groundwater table, we have established a relationship between the total amount of brine extracted by mining companies during their operational period and the average drawdown outside the salt flat nucleus. Considering 913,200,000 m3 or tons of brine extracted in the period from 1986 to 2020, the average drawdown per ton of brine is 1.44 × 10⁻¹⁰ m. With respect to the functional unit, this results in an average drawdown of 4.5 × 10⁻¹⁰ m per ton of concentrated lithium brine.
In terms of volumetric accounting, a relation is shown between lithium mining, increased evaporative fluxes, and basin recharge. Approx. 0.5 to 4 L of water recharge can be attributed to lithium mining in the SdA basin per ton of concentrated lithium brine production. Compared to direct and indirect water consumption [33,37], this amount of positive water gain is insignificant.
In the following, we will examine the extent to which the effects of brine extraction can be separated from other water consumption. Figure 5 shows the scenario of groundwater drawdown due to sole brine extraction compared to a scenario considering parallel water abstraction by mining companies from groundwater wells. Except for a small overlap in the southwestern part of the alluvial model, the depression cones do not overlap to date, allowing the effects to be largely separated. Examples of model uncertainty for the two additional models used in this context were provided by the developers and cover the following aspects. First, the southern domain of the Aguas de Quelana model is constrained by a no-flow boundary condition, and it is important to recognize that this simplification introduces a degree of uncertainty in that part due to a delayed effect of the boundary condition. Overall, this simplification was intended by the model developers, as the initial area of interest for which the model was developed was more in the northern part. Furthermore, the Aguas de Quelana model is a density-dependent complex model, making it more challenging to represent with intricate detail. Although monitoring wells vary widely, the model captures the dynamics of the system. For the hydrogeological model of the alluvial system, conceptual aspects, such as geometry or groundwater recharge, could be further refined to improve its accuracy and reliability. In addition, the alluvial zone may be directly affected by other water users in addition to mining, which is not yet accounted for in the available models.

3.9. Future Scenario Analyses (j)

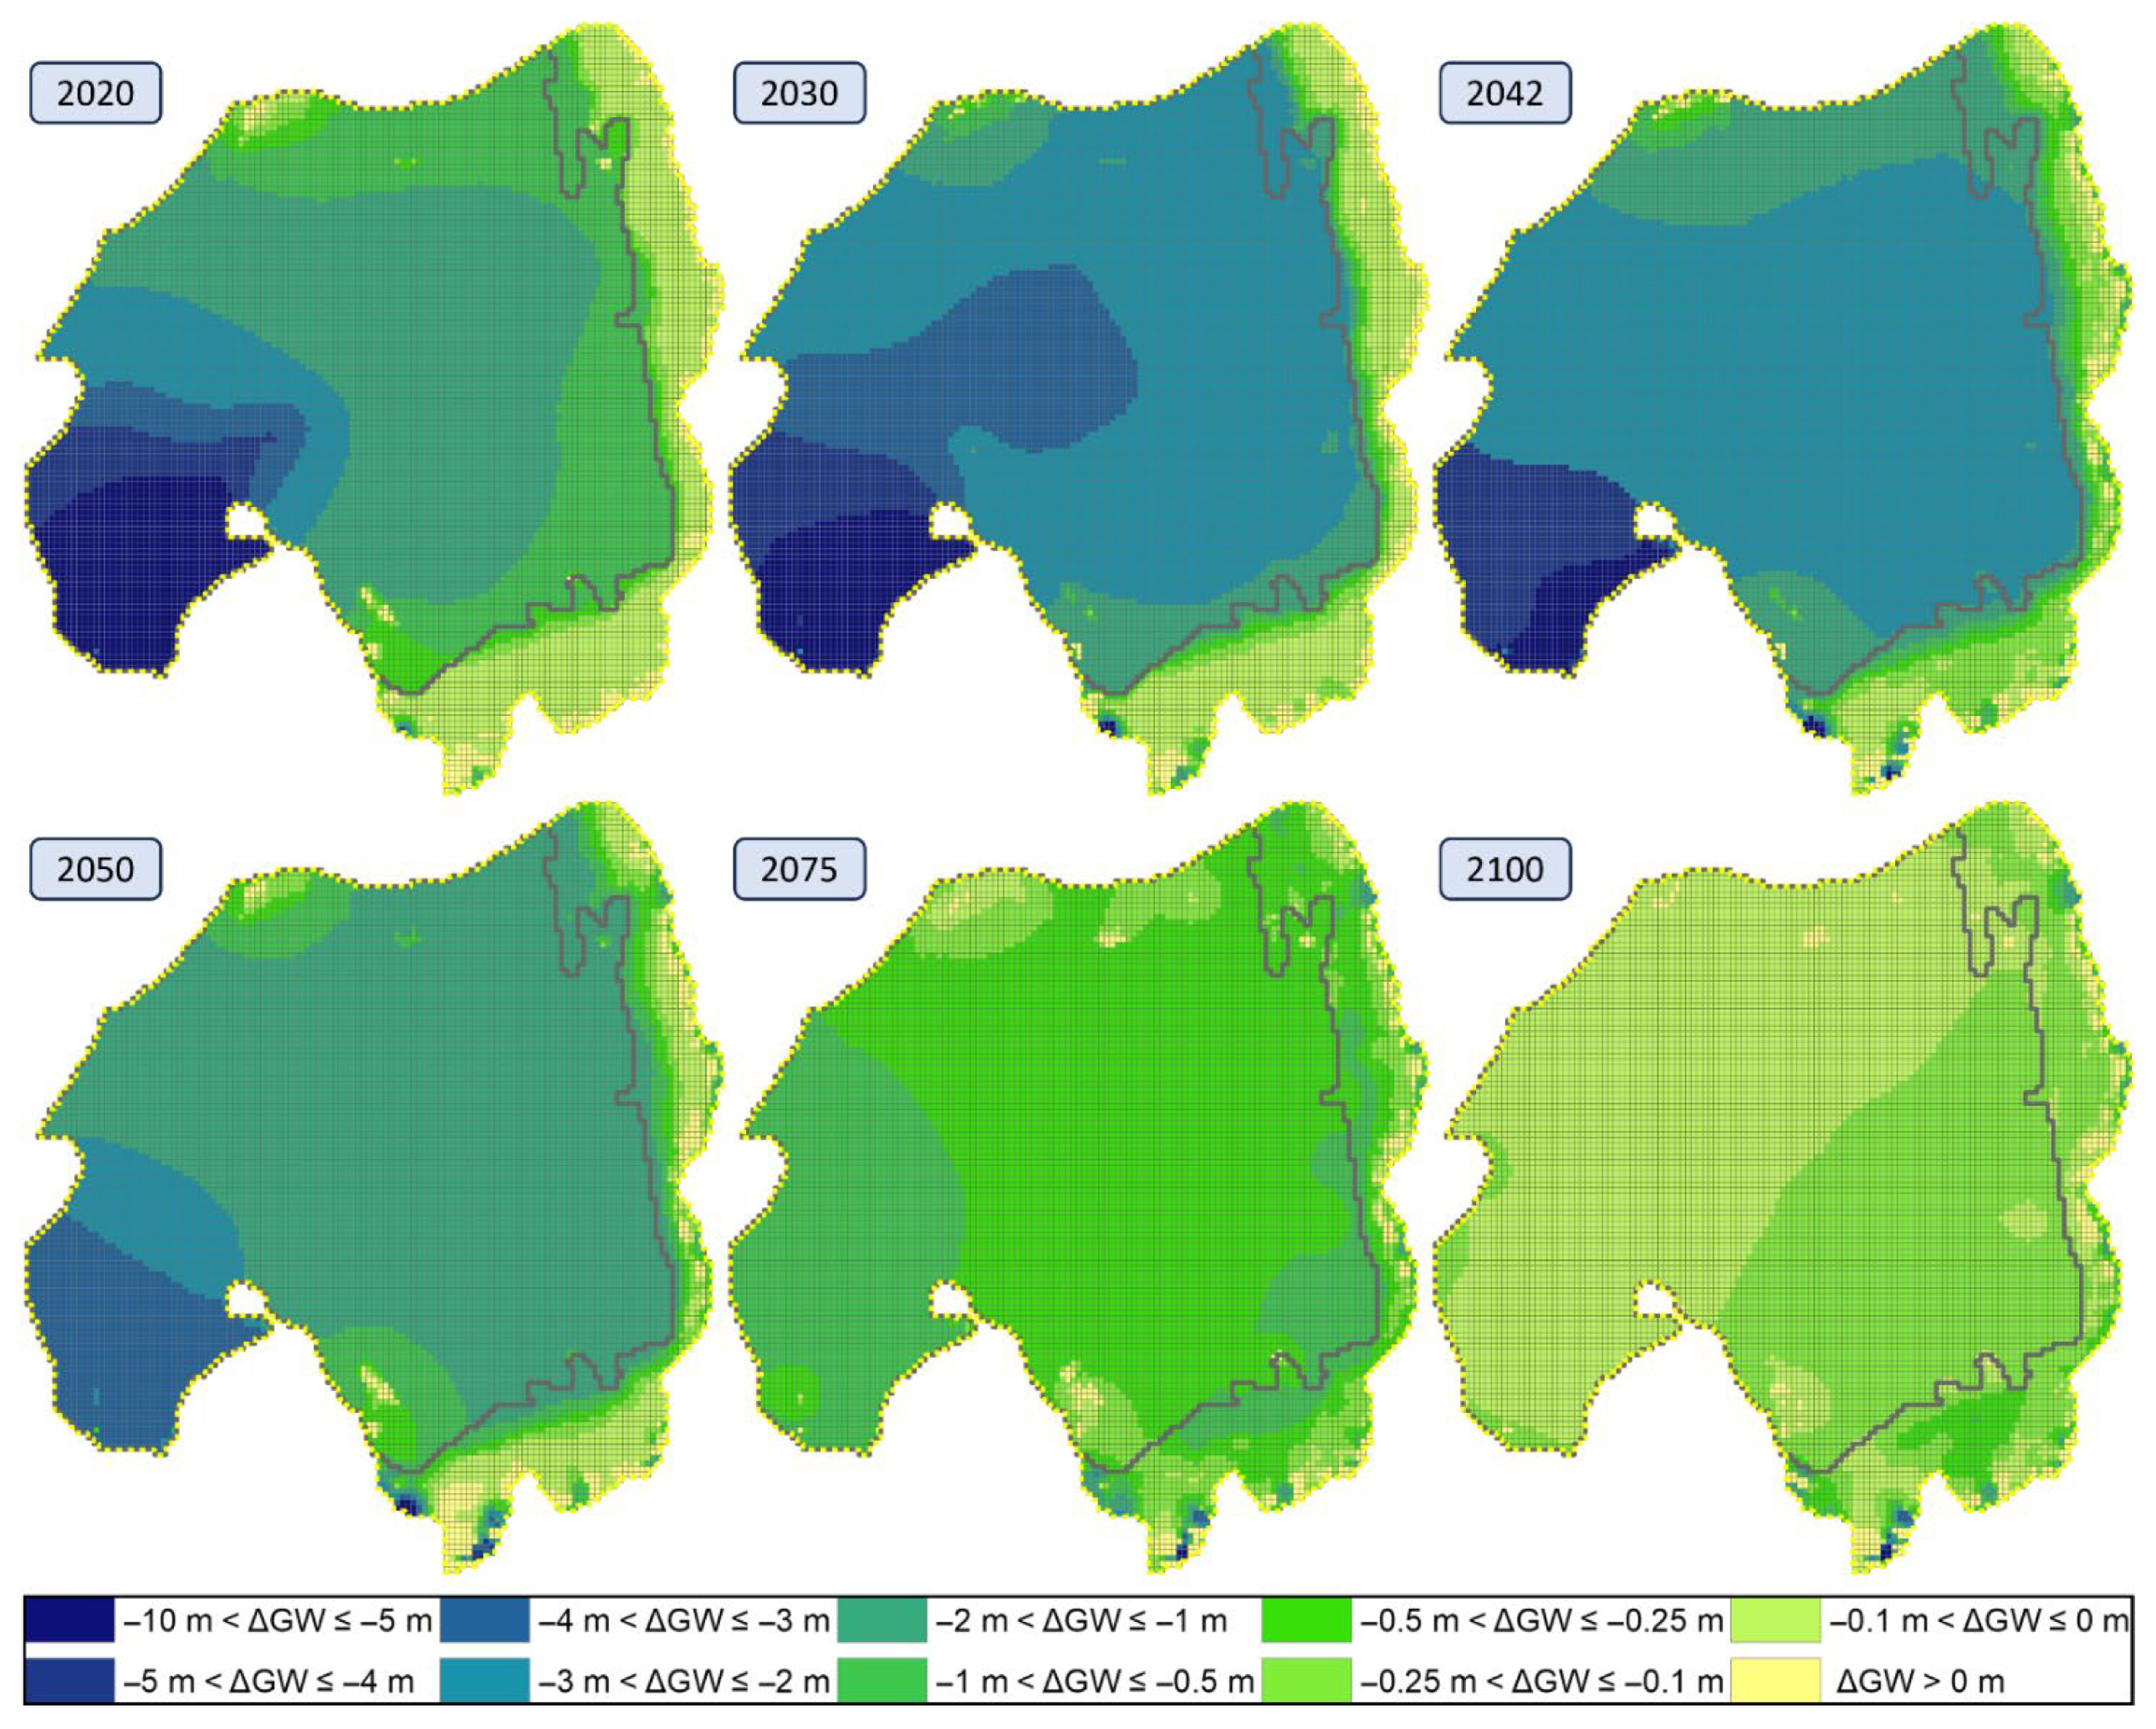
Figure 6 shows the modeled groundwater changes for 2020 and the considered future scenarios for the years 2030, 2042, 2050, 2075, and 2100. Continuing from 2020, the results initially show a further spread of the groundwater drawdown, but this remains largely confined to the rather uncritical area of the salt flat nucleus. After the end of the SQM operation period (2030), a slight recovery of the groundwater level is observed until 2042 (e.g., in the center of the salt flat nucleus). After Albemarle’s contract expires in 2042, the results for the following points in time show the potential for water table recovery after brine pumping has stopped. In the reference years 2050, 2075, and 2100, a gradual recovery of water levels is observed, eventually reducing the drawdown relative to the natural state in 2020 for most of the area to less than 0.5 m (2075) and 0.25 m (2100). However, it should be noted that the model uncertainties mentioned in Section 3.3 apply here as well. In addition, there are other uncertainties, such as future climate change and its impact on groundwater levels. We also emphasize that the assumption of the end of lithium mining by 2042 is not a realistic future scenario. We expect lithium brine operations to continue beyond the end of the SQM (2030) and Albemarle (2042) contracts. However, future technologies such as direct lithium extraction (DLE) [69] may be implemented in the future to reduce net lithium extraction and allow reinjection at locations where critical groundwater drawdown occurs. The incorporation of such aspects into hydrogeological modeling is a major future challenge.

4. Conclusions

This study tested localized water footprinting principles to assess the impact of lithium brine extraction on the SdA water balance. Unlike existing studies, which focus on basin-wide assessments of anthropogenic activities, total water and brine budgets, and their sources [62], this work aimed to analyze the feasibility of using ready-to-use models to establish the quantitative relationship between brine extraction and its induced hydrological effects. This is particularly relevant for localized, comprehensive water footprint studies, where information on changes in water table, lagoon area, or volume per unit of brine extracted is needed to characterize ecosystem impacts. When testing the applicability of previously defined accounting principles, it was found that they could not all be applied equally. However, several were feasible, including estimating the effects on evaporation, basin recharge and groundwater drawdown. While mining has negligible effects on evaporation, precipitation, and basin recharge, continuous monitoring and modeling of groundwater levels are recommended. Existing numerical groundwater models suggest that current and near-future drawdown is expected to be confined to areas where it is unlikely to affect the local flora and fauna or nearby communities. However, they lack the extraction scenarios needed to identify potential tipping points, critical thresholds beyond which ecosystems may undergo long-term or irreversible disturbance. In this context, an analysis of the sustainability implications of DLE technologies is needed to determine whether they could help minimize risks associated with brine extraction.
The use of hydrogeological model outputs is subject to additional limitations. While obtaining first-hand numerical modeling data calibrated with on-site monitoring is beneficial, heavy reliance on company-provided data represents a core limitation. Model uncertainty remains a critical issue, and several aspects are not yet fully incorporated into available models, including water consumption by users other than lithium mining, potential mixing of brine and lower-salinity water, and the coupling of groundwater with surface water models to better capture influences on local lagoon systems. Addressing these gaps represents important tasks for future work. Nevertheless, the case study provides an example of integrating highly localized effects into water footprinting, going beyond conventional applications.

Author Contributions

Conceptualization, A.L., S.M., L.R. and M.F.; methodology, A.L., S.M., L.R. and M.F.; investigation, A.L., S.M. and L.R.; writing—original draft preparation, A.L.; writing—review and editing, A.L., S.M., L.R., V.C., L.H., D.B. and M.F.; visualization, A.L.; supervision, S.M., L.R. and M.F.; project administration, M.F.; funding acquisition, A.L., L.R. and M.F. All authors have read and agreed to the published version of the manuscript.

Funding

Funding for this study was provided by Sociedad Química y Minera de Chile (SQM).

Data Availability Statement

The raw data used in this article refers partly to in-house models from Sociedad Química y Minera de Chile, which contain proprietary information.

Acknowledgments

We would like to thank Sebastián Franco, Verónica Gautier, Francisca Rios, Valentin Barrera, and others at SQM for their assistance with data collection. In particular, we thank the SQM hydrology team for providing data from their hydrogeological models and support on data use and interpretation.

Conflicts of Interest

All authors certify that they have no affiliations with or involvement in any organization or entity with any financial interest or non-financial interest in the subject matter or materials discussed in this manuscript. The authors declare that this study received funding from Sociedad Química y Minera de Chile (SQM). The funder provided data for the case study. The funder was not involved in the study design, the writing of this article, or the decision to submit it for publication.

Abbreviations

The following abbreviations are used in this manuscript:
BIERBasin internal evaporation recycling
ECElectric conductivity
DLEDirect lithium extraction
LCALife cycle assessment
SdASalar de Atacama
SQMSociedad Química y Minera
TDSTotal dissolved solids

Appendix A. Main Lagoon Systems Linked to the Salt Flat Nucleus
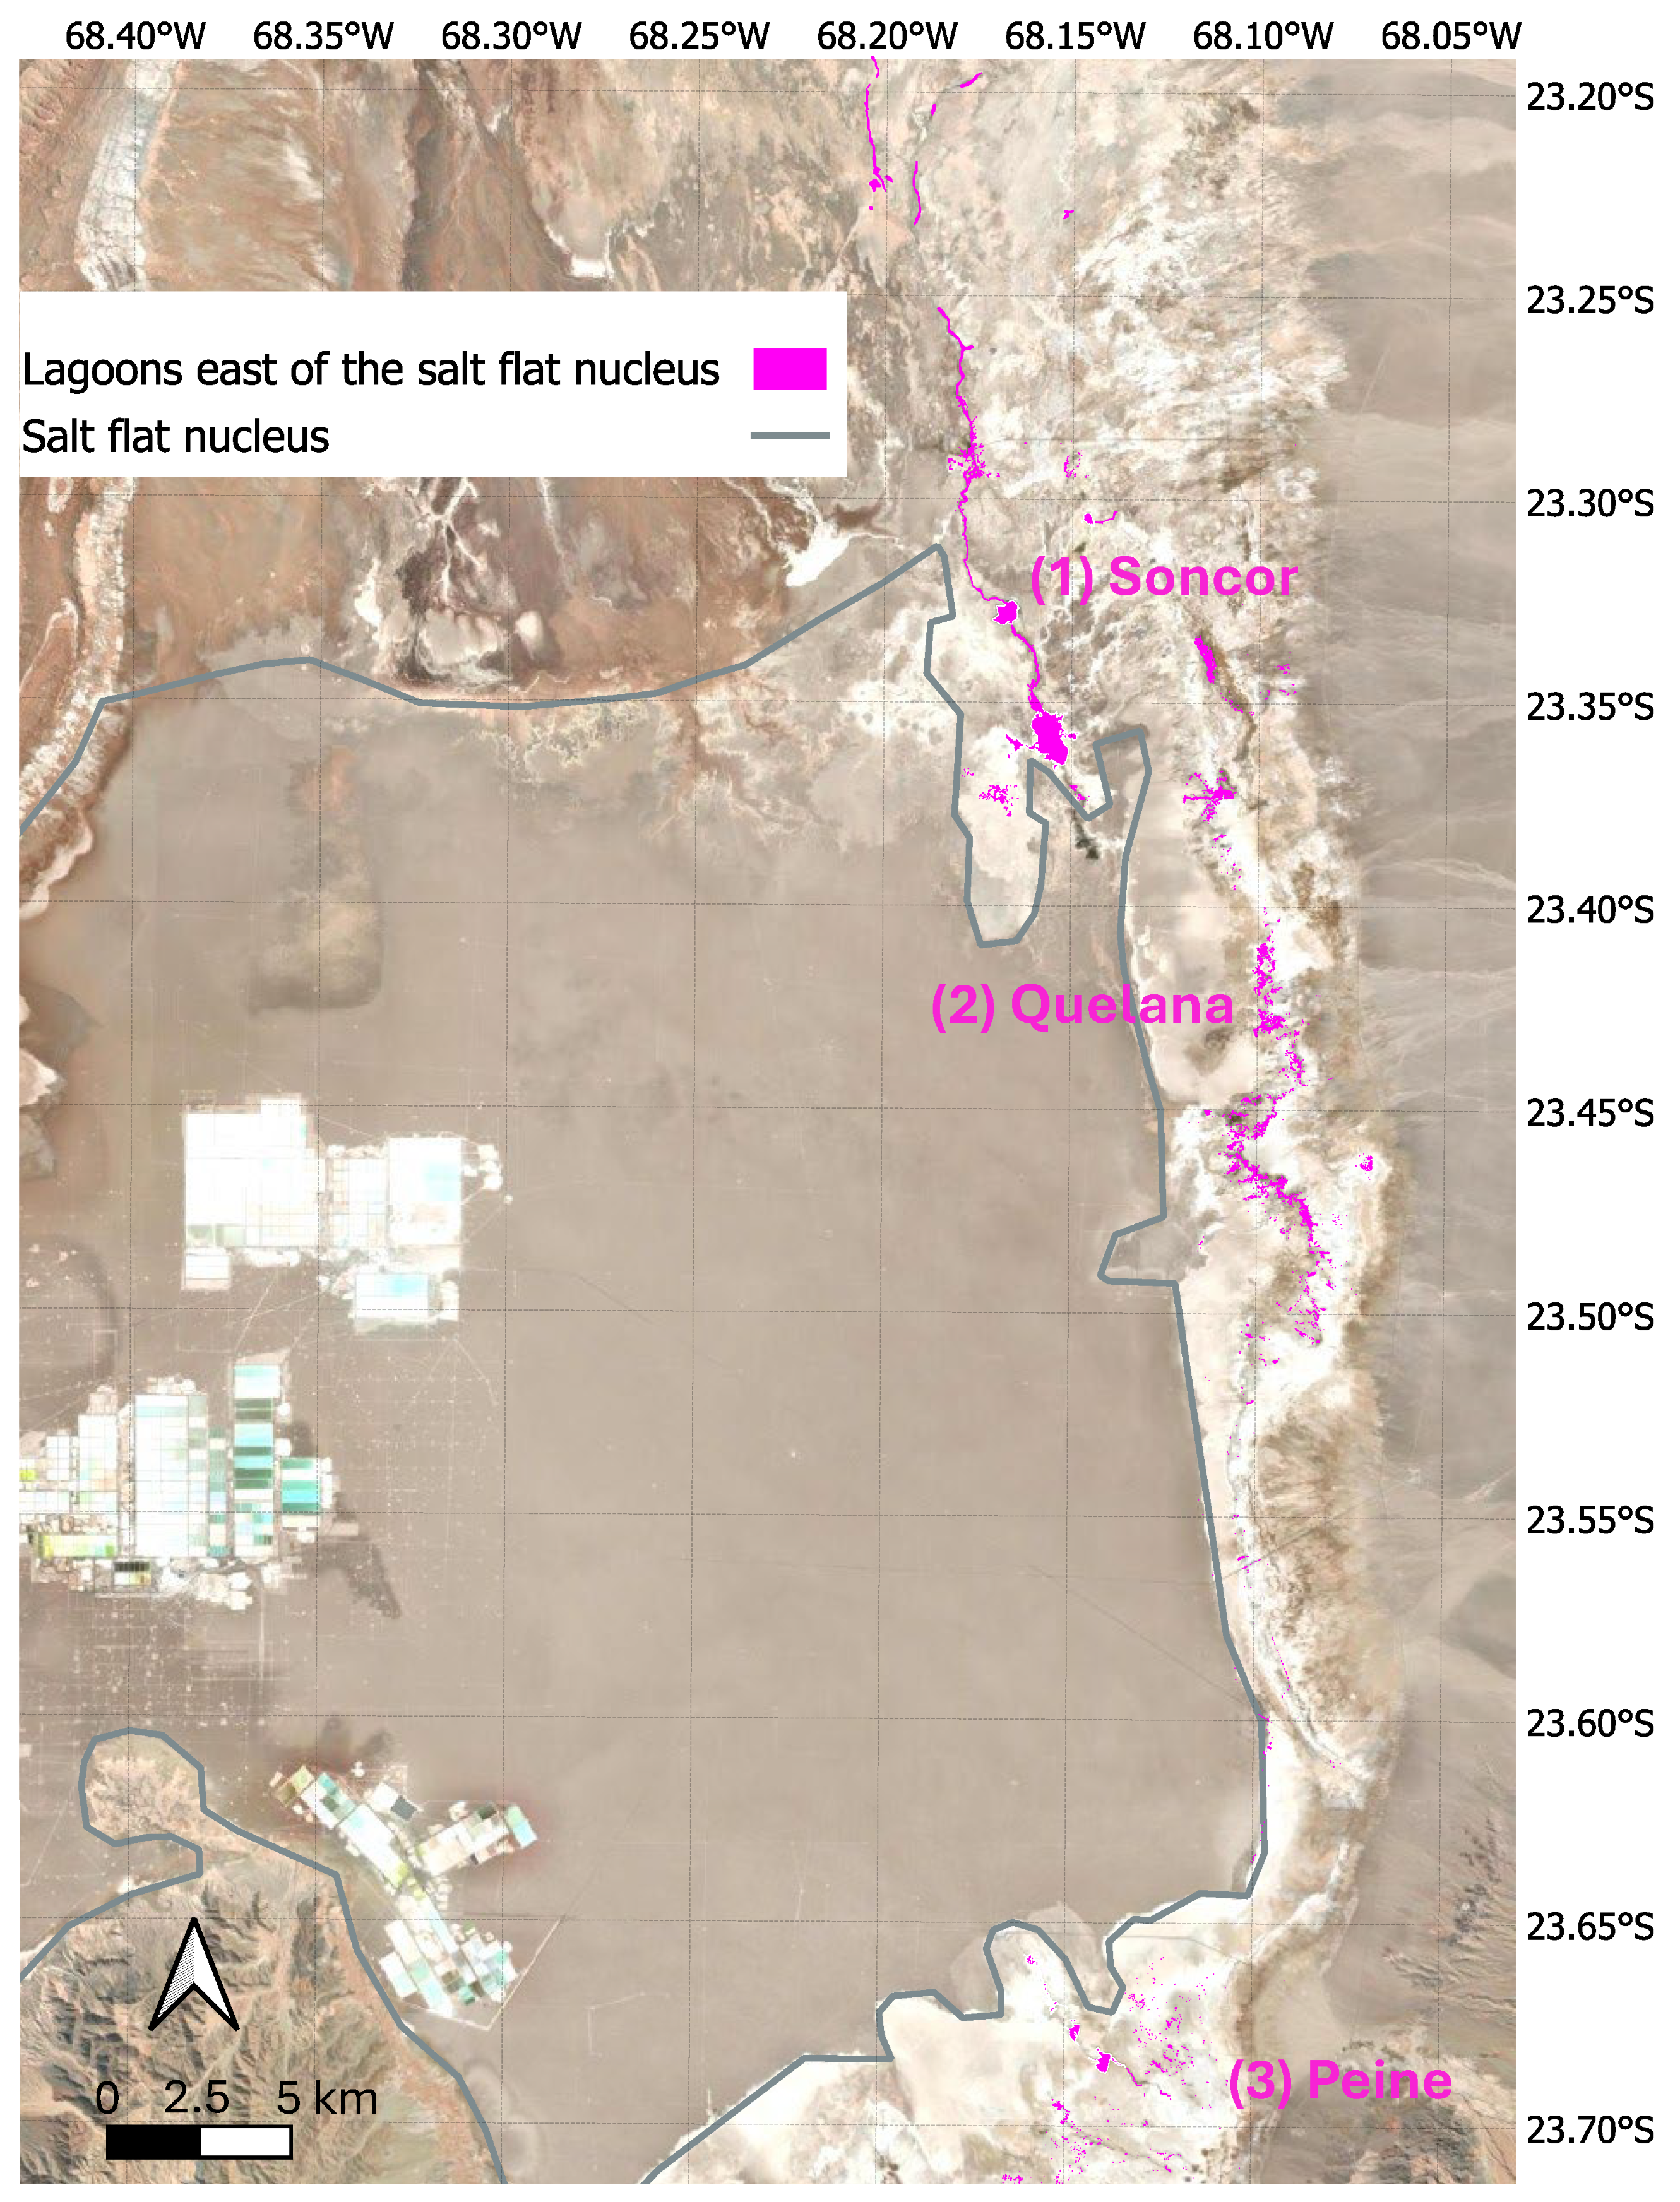
Figure A1. Zoomed-in view of the main lagoon systems [70] located from the northeast to southeast of the salt flat nucleus, consisting of the Soncor, Quelana, and Peine lagoon systems.
Water 17 03311 g0a1

Appendix B. Description of Hydrogeological Models [42,43,44]

The nucleus model [42] uses the software FEFLOW v7.3. It is a numerical method based on finite elements. The model was executed under two different settings: once as a pseudo-stationary model to determine the starting conditions and once as a transient model to determine the development of the system over time. The model ran from 1 January 1986 to 31 December 2100. Initially, 24,166 elements and 12,295 nodes, each with a diameter between 2 m and 2368 m, onaverage 461 m, were used. After reducing the nodes in the marginal areas, a three-dimensional model was designed with 96,664 elements and 61,475 nodes. Calibration of the model referred to trial-and-error calibration using the PEST++ v5 software and consisted of adjusting a series of parameters that condition the flow dynamics of the zone. This process was carried out for 82 observation points. The calibration period ran from 1 January 1986 to 3 July 2010 and the validation period from 4 July 2010 to 31 December 2020. Two different calibration parameters were used: the hydraulic conductivity and the storage coefficient. The following variables were integrated into the model: sub-surface inflows, surface inflows, evaporation, storage coefficient, direct recharge by precipitation, water extraction, and water return by companies.
The numerical model for the system Aguas de Quelana [43] relied as well on the software FEFLOW v.7.3. It represents a variable density model. As for the nucleus model, two model runs were executed: a pseudo-stationary model for the initial condition of the system and an independent transient model for the changes in the system over time. The model ran from 1 January 1986 to 31 December 2100. The grid contains a total of 12,405 elements and 6307 nodes. The average size of the elements is 296.62 m in diameter, with a maximum of 882.62 m and a minimum of 18.95 m. The trial-and-error calibration using the PEST++ v5 software involved the setting of a series of parameters that condition the dynamics of the dynamic flows of the area. The calibration period ran from 1 January 1986 to 3 July 2010 and the validation period from 3 July 2010 to 31 December 2020. For the calibration, 65 observation points were used. The parameters permeability, hydraulic conductivity, storage coefficient, direct recharge by precipitation, evaporation, alluvial lateral recharge, lateral nucleus flow, and water extraction were integrated into the model.
The numerical model for the alluvial zone [44] used the Groundwater Vistas version 7 software. The three-dimensional flow code MODFLOW-USG was applied in this environment. To generate the grid and vertical discretization of the numerical model, a 3D hydrogeologic model was created in Leapfrog Geo. The model ran from 1 November 1986 to 31 December 2100. The area is divided into 4 layers with a thickness between 3.8 and 843 m. The model has a total of 315,948 cells, of which 300,904 are active cells. The cells have an area between 50 × 50 m and 400 × 400 m. Historical data was available from 1997 to 2020. 70% of this data was used for calibration and the remaining 30% for validation. For the model of the eastern edge, two periods were defined: the period for calibration from 1997 to 2013 and the period for validation from 2014 to 2020. Calibration was performed with the PEST++ v5 software complemented by additional trial-and-error calibration. To calibrate the transient model, the hydrogeological units defined in the conceptual model were divided into subzones, generating a spatial variation in the hydraulic parameters. Calibration data of 60 wells were considered, with measurements for the period from March 1997 to December 2020. The parameters evapotranspiration, surface and subsurface inflows, drainage, evaporation rates of the soil, evapotranspiration of vegetation, evaporation rates of water bodies, outflow of water, and water pumping for industrial usage were integrated into the model.

Appendix C. Brine and Groundwater Extraction Rates by Mining Companies

Table A1 shows the projected brine and groundwater extraction rates for Albemarle Corporation and SQM during their contractual periods. These rates were used to feed the hydrogeological models [42,43,44]. After the contractual period ends, there is a recovery phase during which no extraction is assumed to occur.
Table A1. (Net) brine extraction and water withdrawal for freshwater purposes by SQM and Albemarle that fed the hydrogeological models; the periods we looked at more closely are highlighted in blue [54].
YearBrine Extraction; SQM (Mm3/yr)Indirect Brine Reinjection; SQM (Mm3/d)Direct Brine Reinjection; SQM (Mm3/d)Net Brine Extraction;
SQM (Mm3/yr)
Net Brine Extraction;
SQM (L/s)
Brine Extraction;
Albemarle (Mm3/yr)
Brine Extraction;
Albemarle (L/s)
Freshwater Extraction; Quelana System (Mm3/yr)Freshwater Extraction; Alluvial System (Mm3/yr)Freshwater Extraction; Quelana System (L/s)Freshwater Extraction; Alluvial System (L/s)
19860.00.00.00.00.00.927.30.00.00.00.0
19870.00.00.00.00.00.928.50.00.00.00.0
19880.00.00.00.00.01.339.80.00.00.00.0
19890.00.00.00.00.01.546.70.00.00.00.0
19900.00.00.00.00.01.959.30.00.00.00.0
19910.00.00.00.00.01.753.50.00.00.00.0
19920.00.00.00.00.01.649.30.00.00.00.0
19930.00.00.00.00.01.651.60.00.00.00.0
19940.50.00.00.516.61.753.60.00.00.00.0
19958.80.00.08.8279.81.650.80.00.00.00.0
199612.3−3.3−3.35.7180.71.649.40.00.00.00.0
199719.7−2.9−4.112.7402.92.167.80.10.14.34.3
199824.3−1.5−3.019.8626.42.786.12.02.062.462.4
199929.5−1.8−3.524.1764.62.579.32.32.373.373.3
200029.8−1.8−3.924.0762.22.682.22.22.268.568.5
200122.9−1.6−4.117.2546.02.580.41.91.960.060.0
200224.2−2.2−4.517.4552.32.888.92.12.166.466.4
200324.6−2.6−6.016.0508.02.889.42.42.474.874.8
200424.6−2.9−5.716.0506.52.887.32.52.578.378.3
200527.3−3.3−8.115.9503.43.5111.22.82.889.489.4
200626.9−2.9−7.116.9535.43.7116.92.42.477.677.6
200727.4−2.7−7.617.2544.73.8120.12.62.683.283.2
200829.8−2.0−7.020.9661.76.1194.73.94.5122.4142.6
200927.9−2.2−6.918.8597.23.8119.54.87.3152.4231.6
201041.1−0.6−4.436.11145.76.0190.34.77.2150.1228.8
201148.0−1.1−4.842.11336.15.7182.24.77.1149.7225.8
201247.6−0.1−4.243.31374.05.9186.14.77.1147.6224.4
201354.20.0−4.250.01586.44.4141.14.77.1148.0224.5
201456.00.0−3.852.11652.34.2133.34.77.2150.1228.6
201559.30.0−4.155.21750.44.6144.84.87.2151.1229.9
201664.10.0−4.559.61891.14.9156.93.35.8106.1185.4
201755.50.0−4.051.51632.38.2260.74.77.1148.1225.8
201841.40.0−4.237.21179.710.8341.03.15.699.6177.9
201946.90.0−4.142.81357.513.9442.23.05.393.9167.3
202055.10.0−4.450.81609.414.0442.42.93.792.7116.1
202140.40.00.040.41280.016.1511.43.13.797.4116.9
202240.40.0−7.632.81039.313.3422.02.13.866.7120.0
202338.60.0−7.231.4994.713.3422.02.13.866.7120.0
202436.80.0−6.730.0952.813.3422.02.13.866.7120.0
202534.90.0−6.428.5904.513.3422.02.13.866.7120.0
202633.10.0−6.127.1858.513.3422.02.13.866.7120.0
202729.30.0−5.423.8756.213.3422.02.13.866.7120.0
202825.90.0−4.621.3674.613.3422.02.13.866.7120.0
202925.90.0−4.321.6685.713.3422.02.13.866.7120.0
203025.90.0−4.321.6686.213.3422.02.13.866.7120.0
20310.00.00.00.00.013.3422.00.00.00.00.0
20320.00.00.00.00.013.3422.00.00.00.00.0
20330.00.00.00.00.013.3422.00.00.00.00.0
20340.00.00.00.00.013.3422.00.00.00.00.0
20350.00.00.00.00.013.3422.00.00.00.00.0
20360.00.00.00.00.013.3422.00.00.00.00.0
20370.00.00.00.00.013.3422.00.00.00.00.0
20380.00.00.00.00.013.3422.00.00.00.00.0
20390.00.00.00.00.013.3422.00.00.00.00.0
20400.00.00.00.00.013.3422.00.00.00.00.0
20410.00.00.00.00.013.3422.00.00.00.00.0
20420.00.00.00.00.00.00.00.00.00.00.0
20500.00.00.00.00.00.00.00.00.00.00.0
20750.00.00.00.00.00.00.00.00.00.00.0
21000.00.00.00.00.00.00.00.00.00.00.0

Appendix D. Phreatic Evaporation Rates

Table A2 shows the assumed relationship between evaporation and the depth of the groundwater table (GWdepth), which was used to calculate phreatic evaporation for the evaporation zones shown in Figure 2.
Table A2. Phreatic evaporation rate in relation to different evaporation zones; each zone characterizes this relationship either based on the method by Philip [56] (evaporation rate [mm ∗ d−1] = a ∗ exp(GWdepthb)) or Morel-Seytoux and Mermoud [57] (evaporation rate [mm ∗ d−1] = a ∗ GWdepth−b).
ZoneMaximum Evaporation Rate [mm/d]Start Adjustment DepthEvaporation [mm/d]Parameter aParameter b
Nucleus3.53 G W d e p t h 0.031   m a G W d e p t h b 0.01351.6
SS-S3.53 G W d e p t h 0.015   m a G W d e p t h b 0.060.9
SS-A5.82 G W d e p t h 0.028   m a G W d e p t h b 0.111.1
CS5.82 G W d e p t h 0.111   m a G W d e p t h b 0.11.85
A125.82/ a e x p ( G W d e p t h b ) 5.8−4.2
A12-T5.82 G W d e p t h 0.02   m a G W d e p t h b 0.11
SE-S3.53 G W d e p t h 0.032   m a G W d e p t h b 0.041.3
SE-A5.82 G W d e p t h 0.125   m a G W d e p t h b 0.1781.65
Zi1-S3.53 G W d e p t h 0.012   m a G W d e p t h b 0.041
Zi2-S3.53 G W d e p t h 0.007   m a G W d e p t h b 0.0051.3
CE5.82 G W d e p t h 0.107   m a G W d e p t h b 0.1151.75
A2-S3.53 G W d e p t h 0.029   m a G W d e p t h b 0.0351.3
STNN3.53 G W d e p t h 0.032   m a G W d e p t h b 0.041.3
A12-W-S3.53/ a e x p ( G W d e p t h b ) 3.53−4.5

Appendix E. Groundwater Level Changes for 2020
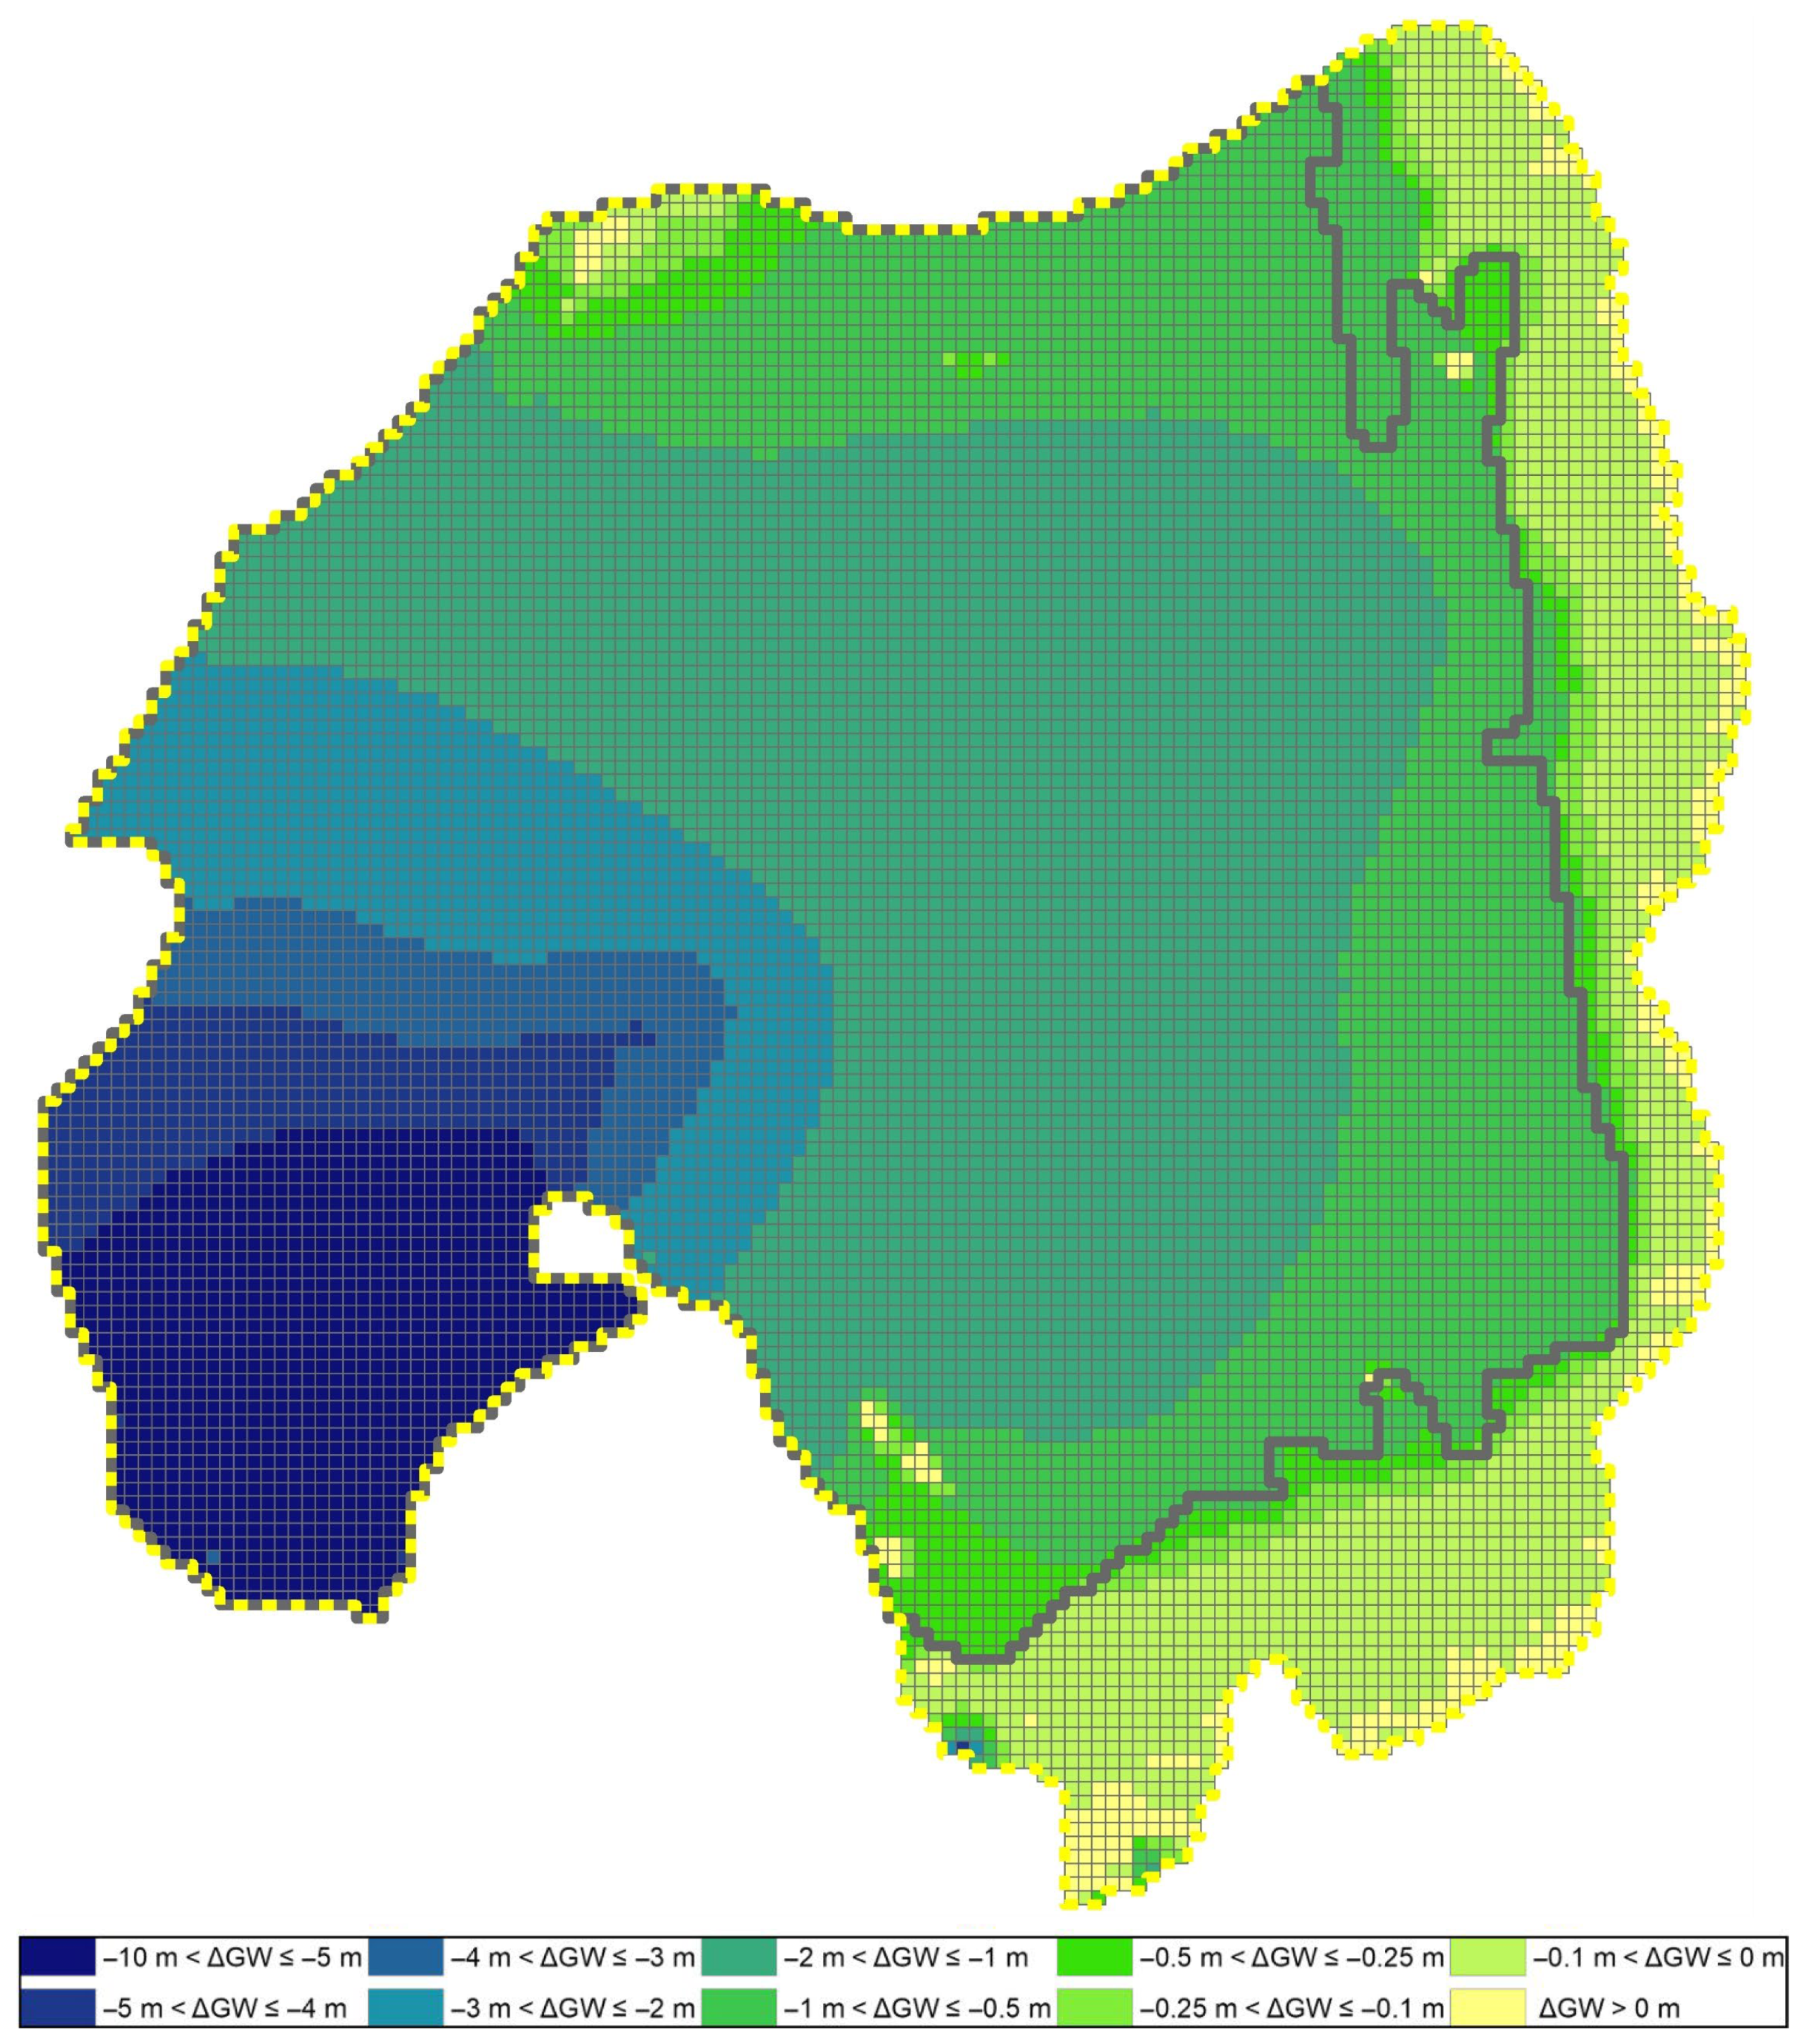
Figure A2. Groundwater level changes (ΔGW) due to brine extraction for 2020.
Water 17 03311 g0a2

References

  1. Fromer, N.; Eggert, R.G.; Lifton, J. Critical Materials for Sustainable Energy Applications. 2011. Available online: https://resnick.caltech.edu/documents/13372/R_Critical.pdf (accessed on 10 August 2025).
  2. Cabeza, L.F.; Gutierrez, A.; Barreneche, C.; Ushak, S.; Fernández, Á.G.; Inés Fernádez, A.; Grágeda, M. Lithium in Thermal Energy Storage: A State-of-the-Art Review. Renew. Sustain. Energy Rev. 2015, 42, 1106–1112. [Google Scholar] [CrossRef]
  3. Sun, X.; Ouyang, M.; Hao, H. Surging Lithium Price Will Not Impede the Electric Vehicle Boom. Joule 2022, 6, 1738–1742. [Google Scholar] [CrossRef]
  4. Bae, H.; Kim, Y. Technologies of Lithium Recycling from Waste Lithium Ion Batteries: A Review. Mater. Adv. 2021, 2, 3234. [Google Scholar] [CrossRef]
  5. Swain, B. Recovery and Recycling of Lithium: A Review. Sep. Purif. Technol. 2017, 172, 388–403. [Google Scholar] [CrossRef]
  6. Perez-Rodríguez, S.; Milton, J.A.; Garcia-Araez, N. Novel Method of Lithium Production from Brines Combining a Battery Material and Sodium Sulfite as a Cheap and Environmentally Friendly Reducing Agent. ACS Sustain. Chem. Eng. 2020, 8, 6243–6251. [Google Scholar] [CrossRef]
  7. Cabello, J. Lithium Brine Production, Reserves, Resources and Exploration in Chile: An Updated Review. Ore Geol. Rev. 2021, 128, 103883. [Google Scholar] [CrossRef]
  8. Munk, L.A.; Boutt, D.F.; Hynek, S.A.; Moran, B.J. Hydrogeochemical Fluxes and Processes Contributing to the Formation of Lithium-Enriched Brines in a Hyper-Arid Continental Basin. Chem. Geol. 2018, 493, 37–57. [Google Scholar] [CrossRef]
  9. Gómez-Silva, B.; Rainey, F.A.; Warren-Rhodes, K.A.; McKay, C.P.; Navarro-González, R. Atacama Desert Soil Microbiology. In Microbiology of Extreme Soils; Springer: Berlin/Heidelberg, Germany, 2008; pp. 117–132. [Google Scholar]
  10. Azua-Bustos, A.; Urrejola, C.; Vicuña, R. Life at the Dry Edge: Microorganisms of the Atacama Desert. FEBS Lett. 2012, 586, 2939–2945. [Google Scholar] [CrossRef]
  11. Bull, A.T.; Asenjo, J.A. Microbiology of Hyper-Arid Environments: Recent Insights from the Atacama Desert, Chile. Antonie Van Leeuwenhoek Int. J. Gen. Mol. Microbiol. 2013, 103, 1173–1179. [Google Scholar] [CrossRef]
  12. Babidge, S. Sustaining Ignorance: The Uncertainties of Groundwater and Its Extraction in the Salar de Atacama, Northern Chile. J. R. Anthropol. Inst. 2019, 25, 83–102. [Google Scholar] [CrossRef]
  13. Marazuela, M.A.; Vázquez-Suñé, E.; Ayora, C.; García-Gil, A.; Palma, T. Hydrodynamics of Salt Flat Basins: The Salar de Atacama Example. Sci. Total Environ. 2019, 651, 668–683. [Google Scholar] [CrossRef] [PubMed]
  14. Ortiz, C.; Aravena, R.; Briones, E.; Suárez, F.; Tore, C.; Muñoz, J.F. Sources of Surface Water for the Soncor Ecosystem, Salar de Atacama Basin, Northern Chile. Hydrol. Sci. J. 2013, 59, 336–350. [Google Scholar] [CrossRef]
  15. Marazuela, M.A.; Vázquez-Suñé, E.; Ayora, C.; García-Gil, A.; Palma, T. The Effect of Brine Pumping on the Natural Hydrodynamics of the Salar de Atacama: The Damping Capacity of Salt Flats. Sci. Total Environ. 2019, 654, 1118–1131. [Google Scholar] [CrossRef] [PubMed]
  16. Holzbecher, E. Groundwater Flow Pattern in the Vicinity of a Salt Lake. Hydrobiologia 2005, 532, 233–242. [Google Scholar] [CrossRef]
  17. Nield, D.A.; Simmons, C.T.; Kuznetsov, A.V.; Ward, J.D. On the Evolution of Salt Lakes: Episodic Convection beneath an Evaporating Salt Lake. Water Resour. Res. 2008, 44, W02439. [Google Scholar] [CrossRef]
  18. Hamann, E.; Post, V.; Kohfahl, C.; Prommer, H.; Simmons, C.T. Numerical Investigation of Coupled Density-Driven Flow and Hydrogeochemical Processes below Playas. Water Resour. Res. 2015, 51, 9338–9352. [Google Scholar] [CrossRef]
  19. Gajardo, G.; Redón, S. Andean Hypersaline Lakes in the Atacama Desert, Northern Chile: Between Lithium Exploitation and Unique Biodiversity Conservation. Conserv. Sci. Pract. 2019, 1, e94. [Google Scholar] [CrossRef]
  20. Gutiérrez, J.S.; Senner, N.R.; Moore, J.N.; Donnelly, J.P.; Dorador, C.; Navedo, J.G. Climate Change and Lithium Mining Influence Flamingo Abundance in the Lithium Triangle. Proc. R. Soc. B 2022, 289, 20212388. [Google Scholar] [CrossRef]
  21. Jerez, B.; Garcés, I.; Torres, R. Lithium Extractivism and Water Injustices in the Salar de Atacama, Chile: The Colonial Shadow of Green Electromobility. Polit. Geogr. 2021, 87, 962–6298. [Google Scholar] [CrossRef]
  22. Schomberg, A.C.; Bringezu, S. How Can the Water Use of Lithium Brine Mining Be Adequately Assessed? Resour. Conserv. Recycl. 2023, 190, 106806. [Google Scholar] [CrossRef]
  23. Guzmán, J.I.; Retamal, C.; Faúndez, P.; Joaquín Jara, J. Evolution of the Surface Area of Critical Lagoon Systems in the Salar de Atacama. Nat. Resour. Res. 2022, 31, 2571–2588. [Google Scholar] [CrossRef]
  24. Liu, W.; Agusdinata, D.B.; Myint, S.W. Spatiotemporal Patterns of Lithium Mining and Environmental Degradation in the Atacama Salt Flat, Chile. Int. J. Appl. Earth Obs. Geoinf. 2019, 80, 145–156. [Google Scholar] [CrossRef]
  25. Houston, J.; Butcher, A.; Ehren, P.; Evans, K.; Godfrey, L. The Evaluation of Brine Prospects and the Requirement for Modifications to Filing Standards. Econ. Geol. 2011, 106, 1225–1239. [Google Scholar] [CrossRef]
  26. Chordia, M.; Wickerts, S.; Nordelöf, A.; Arvidsson, R. Life Cycle Environmental Impacts of Current and Future Battery-Grade Lithium Supply from Brine and Spodumene. Resour. Conserv. Recycl. 2022, 187, 106634. [Google Scholar] [CrossRef]
  27. Drobe, M. Lithium–Sustainability Information; BGR: Hannover, Germany, 2020; Available online: https://www.deutsche-rohstoffagentur.de/EN/Gemeinsames/Produkte/Downloads/Informationen_Nachhaltigkeit/lithium_en.pdf?__blob=publicationFile&v=5 (accessed on 10 August 2025).
  28. Mousavinezhad, S.; Nili, S.; Fahimi, A.; Vahidi, E. Environmental Impact Assessment of Direct Lithium Extraction from Brine Resources: Global Warming Potential, Land Use, Water Consumption, and Charting Sustainable Scenarios. Resour. Conserv. Recycl. 2024, 205, 107583. [Google Scholar] [CrossRef]
  29. ISO 14046; Environmental Management—Water Footprint—Principles, Requirements and Guidelines (German and English Version EN ISO 14046:2016). ISO: Geneva, Switzerland, 2016.
  30. Schomberg, A.C.; Bringezu, S.; Flörke, M. Extended Life Cycle Assessment Reveals the Spatially-Explicit Water Scarcity Footprint of a Lithium-Ion Battery Storage. Commun. Earth Environ. 2021, 2, 11. [Google Scholar] [CrossRef]
  31. He, Z.; Korre, A.; Kelsall, G.; Nie, Z.; Colet Lagrille, M. Environmental and Life Cycle Assessment of Lithium Carbonate Production from Chilean Atacama Brines. RSC Sustain. 2025, 3, 275–290. [Google Scholar] [CrossRef]
  32. Mas-Fons, A.; Horta Arduin, R.; Loubet, P.; Pereira, T.; Parvez, A.M.; Sonnemann, G. Carbon and Water Footprint of Battery-Grade Lithium from Brine and Spodumene: A Simulation-Based LCA. J. Clean. Prod. 2024, 452, 142108. [Google Scholar] [CrossRef]
  33. Kelly, J.C.; Wang, M.; Dai, Q.; Winjobi, O. Energy, Greenhouse Gas, and Water Life Cycle Analysis of Lithium Carbonate and Lithium Hydroxide Monohydrate from Brine and Ore Resources and Their Use in Lithium Ion Battery Cathodes and Lithium Ion Batteries. Resour. Conserv. Recycl. 2021, 174, 105762. [Google Scholar] [CrossRef]
  34. Schenker, V.; Oberschelp, C.; Pfister, S. Regionalized Life Cycle Assessment of Present and Future Lithium Production for Li-Ion Batteries. Resour. Conserv. Recycl. 2022, 187, 106611. [Google Scholar] [CrossRef]
  35. Khakmardan, S.; Rolinck, M.; Cerdas, F.; Herrmann, C.; Giurco, D.; Crawford, R.; Li, W. Comparative Life Cycle Assessment of Lithium Mining, Extraction, and Refining Technologies: A Global Perspective. Procedia CIRP 2023, 116, 606–611. [Google Scholar] [CrossRef]
  36. Lagos, G.; Cifuentes, L.; Peters, D.; Castro, L.; Valdés, J.M. Carbon Footprint and Water Inventory of the Production of Lithium in the Atacama Salt Flat, Chile. Environ. Chall. 2024, 16, 100962. [Google Scholar] [CrossRef]
  37. Marinova, S.; Roche, L.; Link, A.; Finkbeiner, M. Water Footprint of Battery-Grade Lithium Production in the Salar de Atacama, Chile. J. Clean. Prod. 2025, 487, 144635. [Google Scholar] [CrossRef]
  38. Link, A.; Marinova, S.; Roche, L.; Coroamă, V.; Hinkers, L.; Borchardt, D.; Finkbeiner, M. Lithium Mining in the Salar de Atacama—Accounting Practices for Water Footprinting. Water 2025, 17, 1670. [Google Scholar] [CrossRef]
  39. SQM. Fluid Zones (Shared Internally) 2022; SQM: Santiago de Chile, Chile, 2022. [Google Scholar]
  40. Fetter, C.W. Applied Hydrogeology, 4th ed.; Pearson Education Limited: Harlow, UK, 2013; ISBN 9781292022901. [Google Scholar]
  41. Marazuela, M.A.; Vázquez-Suñé, E.; Custodio, E.; Palma, T.; García-Gil, A.; Ayora, C. 3D Mapping, Hydrodynamics and Modelling of the Freshwater-Brine Mixing Zone in Salt Flats Similar to the Salar de Atacama (Chile). J. Hydrol. 2018, 561, 223–235. [Google Scholar] [CrossRef]
  42. SQM. Estudio de Impacto Ambiental: Proyecto Plan de Reducción de Extracciones en el Salar de Atacama-Modelo Hidrogeológico Numérico del Núcleo del Salar de Atacama; SQM: Santiago de Chile, Chile, 2021. [Google Scholar]
  43. SQM. Estudio de Impacto Ambiental: Proyecto Plan de Reducción de Extracciones en el Salar de Atacama-Modelo Hidrogeológico Numérico del Systema Aguas de Quelana; SQM: Santiago de Chile, Chile, 2021. [Google Scholar]
  44. SQM. Modelo Numérico del Borde Este del Salar de Atacama; SQM: Santiago de Chile, Chile, 2021. [Google Scholar]
  45. INN NCh1333; Requisitos de Calidad del Agua Para Diferentes Usos. National Institute of Standardization (INN): Santiago de Chile, Chile, 1978. Available online: https://ciperchile.cl/pdfs/11-2013/norovirus/NCh1333-1978_Mod-1987.pdf (accessed on 10 October 2025).
  46. INN NCh409; Agua Portable-Parte 1-Requisitos. National Institute of Standardization (INN): Santiago de Chile, Chile, 2005. Available online: https://ciperchile.cl/pdfs/11-2013/norovirus/NCh409.pdf (accessed on 10 October 2025).
  47. Geobiota. Informe de Seguimiento Ambiental: Proyecto Cambios y Mejoras en la Operación Minera del Salar de Atacama–Región de Antofagasta; Geobiota: Santiago de Chile, Chile, 2021. [Google Scholar]
  48. Munk, L.A.; Boutt, D.F.; Moran, B.J.; McKnight, S.V.; Jenckes, J. Hydrogeologic and Geochemical Distinctions in Freshwater-Brine Systems of an Andean Salar. Geochem. Geophys. Geosyst. 2021, 22, e2020GC009345. [Google Scholar] [CrossRef]
  49. Saccò, M.; White, N.E.; Harrod, C.; Salazar, G.; Aguilar, P.; Cubillos, C.F.; Meredith, K.; Baxter, B.K.; Oren, A.; Anufriieva, E.; et al. Salt to Conserve: A Review on the Ecology and Preservation of Hypersaline Ecosystems. Biol. Rev. 2021, 96, 2828–2850. [Google Scholar] [CrossRef]
  50. Geobiota. Mapa de Vegetacion: Mapa de Vegetación en el Área de Influencia–Mapa General; Geobiota: Providencia, Chile, 2022. [Google Scholar]
  51. Cubillos, C.F.; Paredes, A.; Yáñez, C.; Palma, J.; Severino, E.; Vejar, D.; Grágeda, M.; Dorador, C. Insights into the Microbiology of the Chaotropic Brines of Salar de Atacama, Chile. Front. Microbiol. 2019, 10, 463175. [Google Scholar] [CrossRef]
  52. SQM. Hydrogeological Management. Available online: https://sqmlitio.com/en/sostenibilidad/manejo-hidrogeologico/ (accessed on 14 August 2023).
  53. Parada, S. SQM Salar de Atacama Facility Tour; SQM: Santiago de Chile, Chile, 2022. [Google Scholar]
  54. SQM. Brine Extraction and Water Withdrawal for Freshwater Purposes by SQM and Albemarle (Internal SQM Data Shared); SQM: Santiago de Chile, Chile, 2023. [Google Scholar]
  55. SRK. Estudio Hidrológico Salar de Atacama; SRK: Santiago de Chile, Chile, 2020. [Google Scholar]
  56. Philip, J.R. Theory of Infiltration. Soil Sci. 1957, 83, 345–357. [Google Scholar] [CrossRef]
  57. Morel-Seytoux, H.J.; Mermoud, A. Modélisation et Observation Du Flux Hydrique Vers La Surface Du Sol Depuis Une Nappe Peu Profonde. Hydrol. Cont. 1989, 4, 11–23. [Google Scholar]
  58. Boutt, D.F.; Hynek, S.A.; Munk, L.A.; Corenthal, L.G. Rapid Recharge of Fresh Water to the Halite-Hosted Brine Aquifer of Salar de Atacama, Chile. Hydrol. Process. 2016, 30, 4720–4740. [Google Scholar] [CrossRef]
  59. Herrera, C.; Urrutia, J.; Godfrey, L.; Jódar, J.; Pereira, M.; Villarroel, C.; Durán, C.; Soto, I.; Lam, E.J.; Gómez, L. An Evaluation of the Brine Flow in the Upper Part of the Halite Nucleus of the Salar de Atacama (Chile) through an Isotopic Study of Δ18O and Δ2H. Water 2024, 16, 2651. [Google Scholar] [CrossRef]
  60. Link, A.; Van Der Ent, R.; Berger, M.; Eisner, S.; Finkbeiner, M. The Fate of Land Evaporation—A Global Dataset. Earth Syst. Sci. Data 2020, 12, 1897–1912. [Google Scholar] [CrossRef]
  61. Berger, M.; Eisner, S.; Van der Ent, R.; Flörke, M.; Link, A.; Poligkeit, J.; Bach, V.; Finkbeiner, M. Enhancing the Water Accounting and Vulnerability Evaluation Model: WAVE+. Environ. Sci. Technol. 2018, 52, 10757–10766. [Google Scholar] [CrossRef] [PubMed]
  62. Moran, B.J.; Boutt, D.F.; McKnight, S.V.; Jenckes, J.; Munk, L.A.; Corkran, D.; Kirshen, A. Relic Groundwater and Prolonged Drought Confound Interpretations of Water Sustainability and Lithium Extraction in Arid Lands. Earth’s Future 2022, 10, e2021EF002555. [Google Scholar] [CrossRef]
  63. IDEA-CSIC. Quinta Actualización del Modelo Regional de Flujo del Salar de Atacama; IDEA-CSIC: Barcelona, Spain, 2019. [Google Scholar]
  64. Marazuela, M.A.; Vázquez-Suñé, E.; Ayora, C.; García-Gil, A. Towards More Sustainable Brine Extraction in Salt Flats: Learning from the Salar de Atacama. Sci. Total Environ. 2020, 703, 135605. [Google Scholar] [CrossRef] [PubMed]
  65. Liu, W.; Agusdinata, D.B. Dynamics of Local Impacts in Low-Carbon Transition: Agent-Based Modeling of Lithium Mining-Community-Aquifer Interactions in Salar de Atacama, Chile. Extr. Ind. Soc. 2021, 8, 100927. [Google Scholar] [CrossRef]
  66. Kampf, S.K.; Tyler, S.W. Spatial Characterization of Land Surface Energy Fluxes and Uncertainty Estimation at the Salar de Atacama, Northern Chile. Adv. Water Resour. 2006, 29, 336–354. [Google Scholar] [CrossRef]
  67. Cornellà, O.; Salas, J.; Aravena, R.; Guzmán, E.; Guimerà, J.; Tore, C.; von Igel, W.; Henríquez, A.; Fock, A. Hidrogeologia de Los Sistemas Lagunares Del Margen e Del Salar de Atacama. In Proceedings of the Congreso Geológico Chileno, Santiago de Chile, Chile, 22–26 November 2009; pp. 1–4. [Google Scholar]
  68. Guzmán, J.I.; Jara Donoso, J.J.; Faúndez Martelli, P. Role of Lithium Mining on the Water Stress of the Salar de Atacama Basin. 2021. Available online: https://eartharxiv.org/repository/view/2110/ (accessed on 10 October 2025).
  69. Vera, M.L.; Torres, W.R.; Galli, C.I.; Chagnes, A.; Flexer, V. Environmental Impact of Direct Lithium Extraction from Brines. Nat. Rev. Earth Environ. 2023, 4, 149–165. [Google Scholar] [CrossRef]
  70. SQM. Main Lagoon Systems Linked to the Salt Flat Nucleus (Shapefile); SQM: Santiago de Chile, Chile, 2022. [Google Scholar]
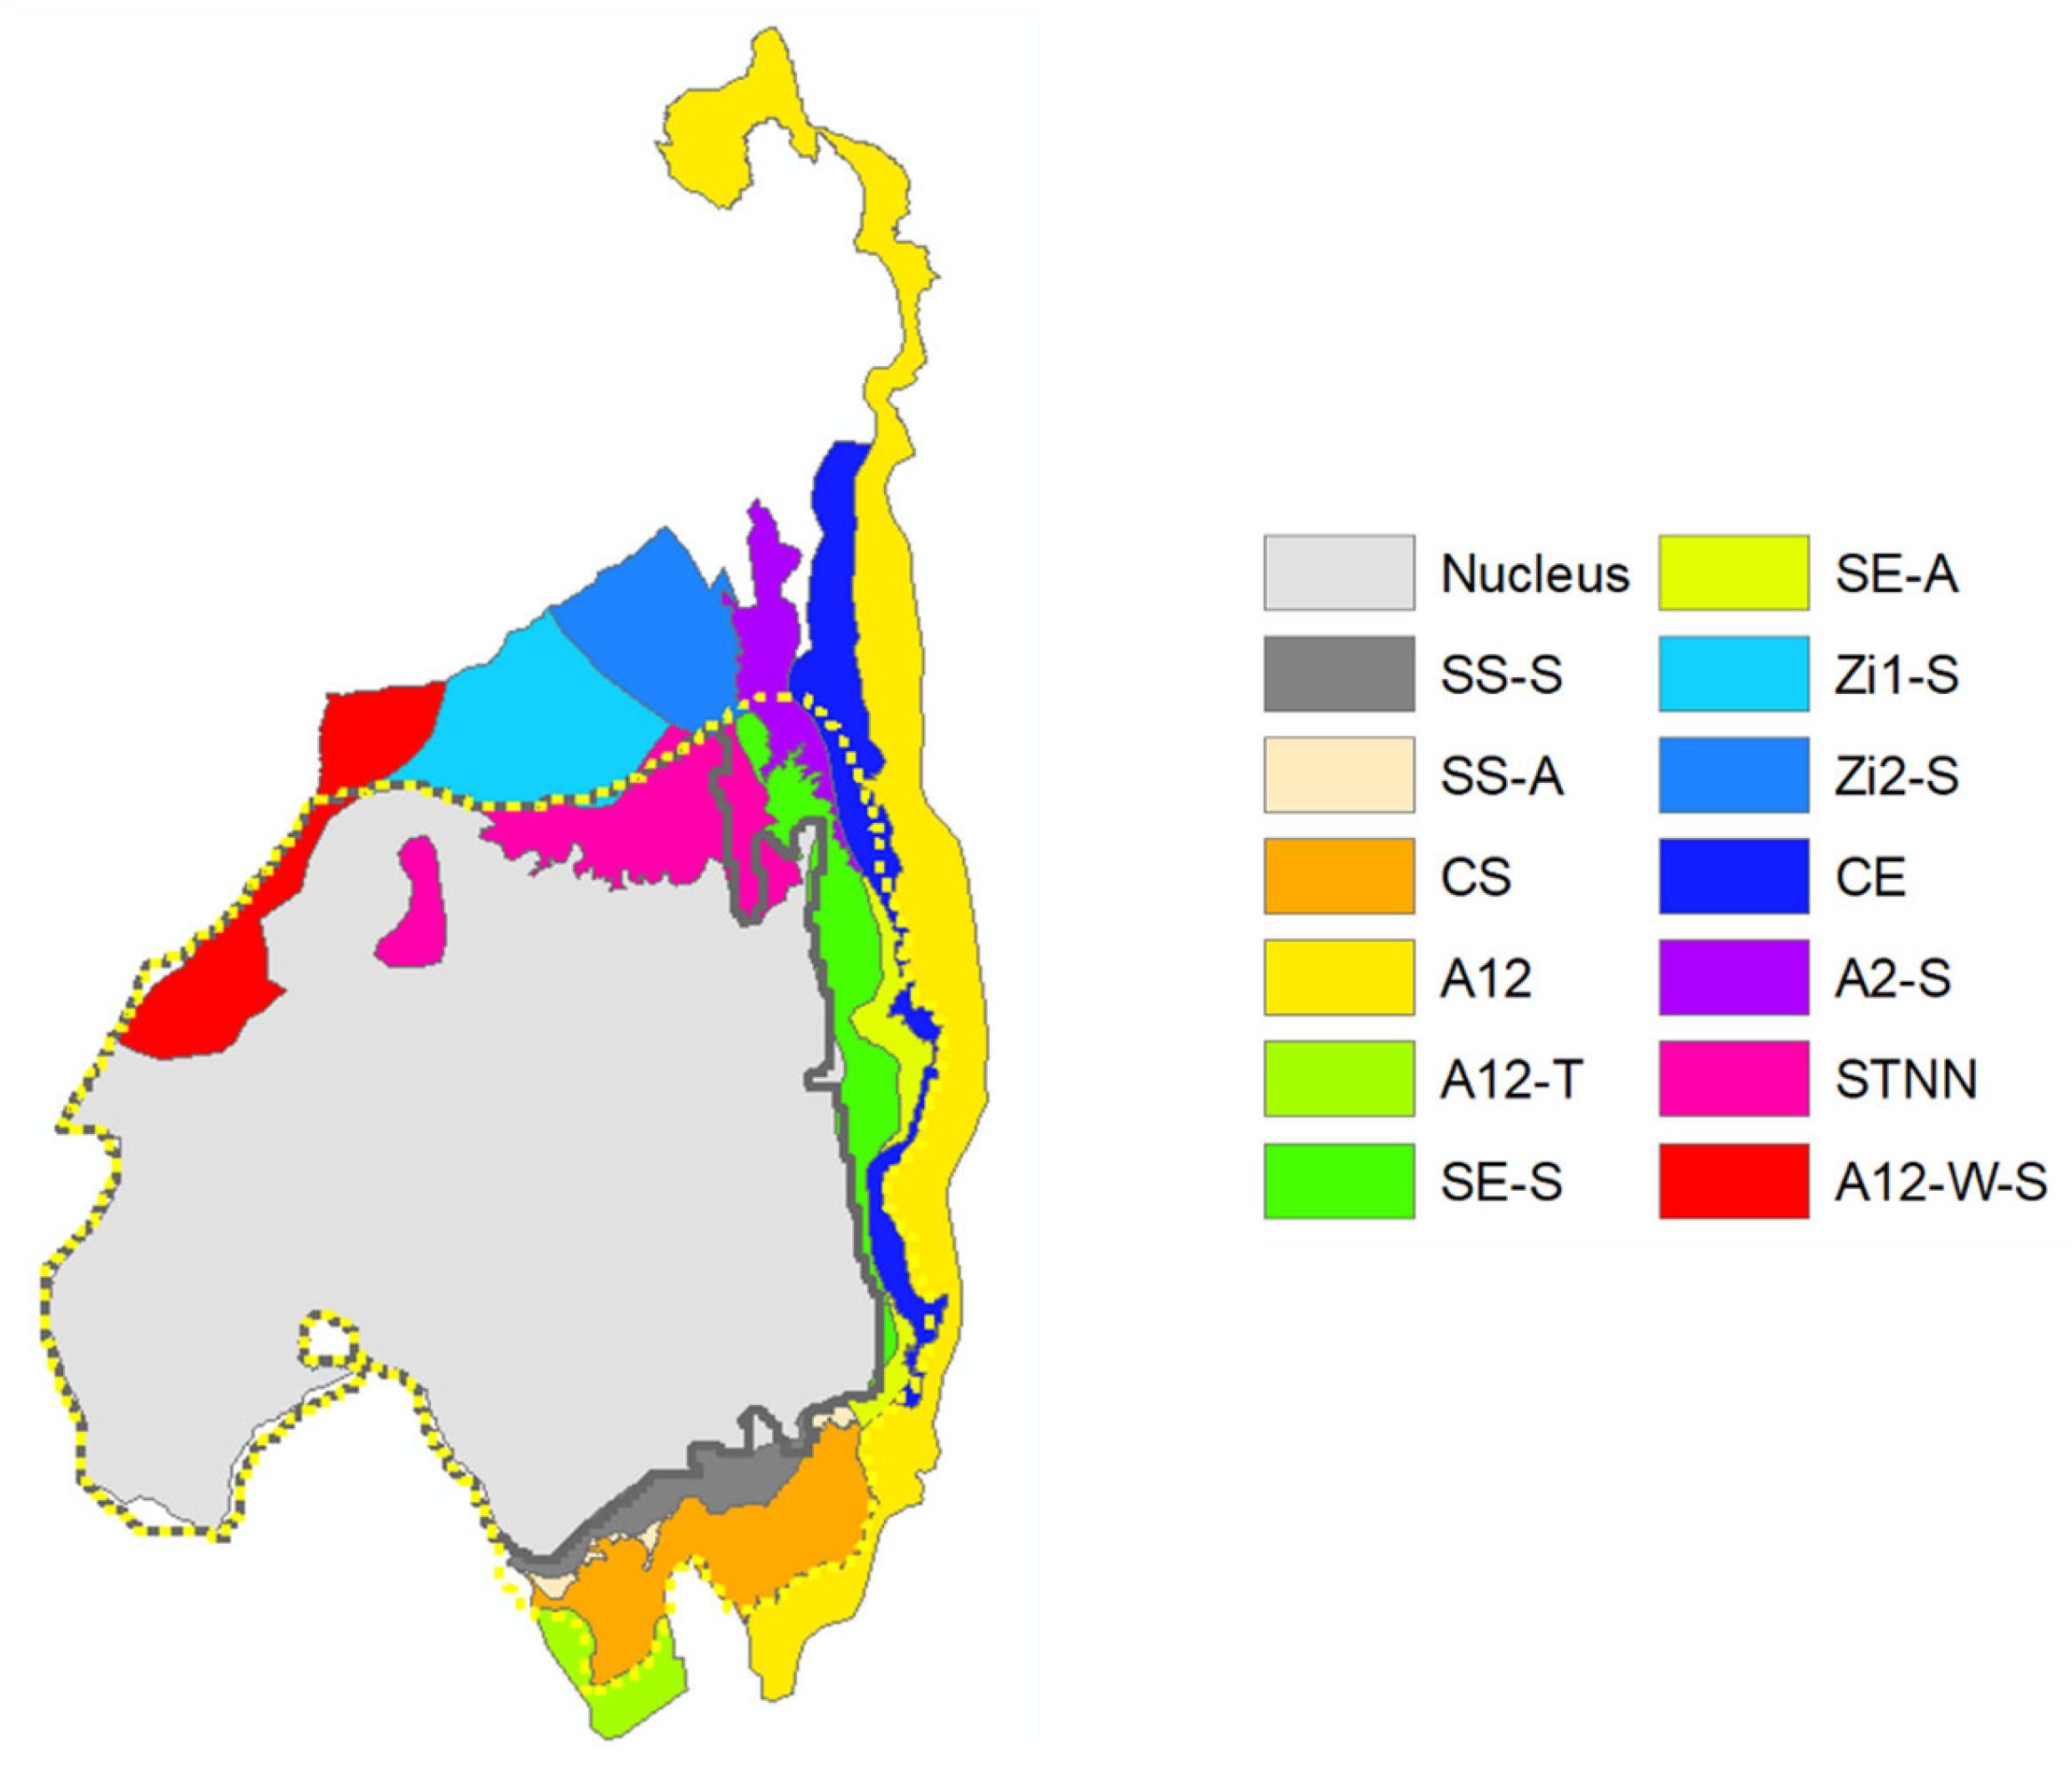
Figure 2. Evaporation zones distinguished; the yellow dashed line refers to the delineation of the hydrogeolocial model of the nucleus zone [42], with which parallel modelling of the groundwater table depth took place; the gray line marks the edge of the salt flat nucleus.
Water 17 03311 g002
Figure 3. Modeled groundwater level evolution under natural forcing and brine pumping for the reference year 2020; the gray outline shows the salt flat nucleus, beyond which the effects of groundwater lowering due to brine extraction must be avoided; the hydrogeological model system boundary is the yellow dashed line.
Water 17 03311 g003
Figure 4. Average share of reprecipitation of evaporated water in % from the source basin (SdA) outlined in red; based on numerical moisture tracking, the average basin internal evaporation recycling in the SdA basin is about 0.65%, while the rest of the atmospheric moisture is transported to remote regions of the Earth.
Water 17 03311 g004
Figure 5. Influence of additional groundwater extraction by mining companies Albemarle Corporation and SQM on groundwater drawdown (b), compared to drawdown from brine extraction alone (a); reference year: 2020. Yellow, purple, and red dashed lines indicate boundaries of the hydrogeological models for the nucleus zone, Aguas de Quelana sector, and alluvial zone, respectively; the gray line marks the salt flat nucleus, beyond which groundwater drawdown from brine extraction shall be avoided.
Water 17 03311 g005
Figure 6. Groundwater level changes (ΔGW) due to brine extraction for 2020 and future scenarios; changes in drawdown for all years are relative to the 2020 natural forcing scenario; the grey outline shows the salt flat nucleus, while the hydrogeologic model system boundary refers to the yellow dashed line.
Water 17 03311 g006
Disclaimer/Publisher’s Note: The statements, opinions and data contained in all publications are solely those of the individual author(s) and contributor(s) and not of MDPI and/or the editor(s). MDPI and/or the editor(s) disclaim responsibility for any injury to people or property resulting from any ideas, methods, instructions or products referred to in the content.