Article

Spatio-Temporal Analysis of Structural Sediment Connectivity in a Dryland Catchment of the Pamir Mountains

Mountain Societies Research Institute, University of Central Asia, Khorog 736000, GBAO, Tajikistan
*
Author to whom correspondence should be addressed.
Water 2025, 17(22), 3302; https://doi.org/10.3390/w17223302
Submission received: 18 September 2025 / Revised: 15 November 2025 / Accepted: 16 November 2025 / Published: 18 November 2025
(This article belongs to the Special Issue Flow Dynamics and Sediment Transport in Rivers and Coasts)

Abstract

Sediment connectivity constitutes a valuable metric to assess the most likely areas of sediment transport, providing a preliminary estimate of the areas to be prioritized for sediment control interventions. Assessment spatio-temporal variability in sediment connectivity can help decrease uncertainties in interpreting sediment transport and sediment yield within a catchment. In this regard, we evaluated variations in the index of sediment connectivity (IC) based on a well-established approach in the Gunt River catchment. To achieve a more effective assessment of the temporal variations in IC, we considered changes in surface soil moisture (SSM) along with normalized difference vegetation index (NDVI) from July 2015 and 2024. Also, to better represent and more accurately assess IC within this large catchment (13,700 km2), we applied weighted mean IC values (as a novel metric) based on iso-IC lines. Our results indicate that among the environmental factors affecting IC, including SSM, slope gradient, elevation, and NDVI, SSM is the most influential in such cold, dry mountainous catchments. Also, the findings demonstrated a 38.5% increase in the extent of the medium-high and high categories of IC from 2015 to 2024. Temporal monitoring of IC revealed pronounced variations in the western (close to the outlet) and eastern portions of the catchment, likely associated with the effects of climate warming on sediment connectivity. These results emphasize that SSM is a key parameter for assessing IC in the snow- and ice-melt-dominated dry mountainous catchment associated with climate warming challenges. Accordingly, temporal and spatial monitoring of SSM can allow implementation of more effective measures for reducing sediment transfer at the catchment scale.

1. Introduction

Connectivity is a key indicator to enhance understanding of hydrogeomorphic processes in catchments [1], reflecting the continuity and intensity of water flow and sediment paths during a specific period [2]. In this context, sediment connectivity is a widely used concept that depicts the potential for sediment transfer and processes including the continuum of sediment generation, detachment, transport, and deposition in various sections of a catchment (i.e., among sediment sources and potential sinks) [3]. Generally, the concept of sediment connectivity includes two distinct components: (i) structural (physical), based on physical linkages in the landscape representing the spatial distribution of potential pathways of sediment transport and specification of pathways along which sediment can be transported in the direction of flow [4] and (ii) functional (process-based), related with soil erosion and sediment transport processes operating in different components of a landscape [5].
In past decades, various studies have conducted sediment connectivity evaluation and quantification using methods such as the sediment delivery ratio (SDR) and sediment yield [6], field mapping of sediment sources and delivery [7], the index of sediment connectivity (IC) [8,9], SDR combined with IC or erosion and sediment deposition values across study areas [10,11], modified IC [12,13], new indexes inspired from IC [14,15], and machine learning models [16,17]. Morphometry-based IC, initially introduced by Borselli et al. [8], is a relatively new easy-to-use tool that allows for implementation and quantification of structural sediment connectivity at a catchment scale even for areas with limited data. This is particularly crucial in developing countries, where spatial data are often limited and modeling the spatial patterns of sediment delivery or identifying the sources and sinks of sediment is required [18].
During the past decade, researchers have attempted to improve Borselli’s original approach, including Cavalli et al. [12], who adapted this index to mountainous environments. Studies have emerged in different fields, different spatial scales, and global catchments using Cavalli’s IC indicating the importance of this index. For example, Schopper et al. [19] showed that IC offered a catchment-wide distinction between different connectivity intensities that identifies areas with weaker and stronger connections. Also, in areas with limited data, metrics like Cavalli’s IC combined with geomorphological mapping facilitated rapid assessment of sediment source configuration [20]. In a sub-catchment in Switzerland, IC application of geomorphic field mapping facilitated a comprehensive understanding of sediment connectivity and sediment cascades [21]. Crema and Bossi [21] showed that clustering of Cavalli’s IC values helped in dividing a catchment into homogenous geomorphological units, where each unit represents specific geomorphologic processes and sediment transformation capabilities. Millares and Moñino [22] assessed suspended sediment responses and relationships with hydrometeorological drivers, sediment sources, and sediment connectivity in a mountainous semi-arid catchment, highlighting the sensitivity of high mountainous areas to erosion processes due to climate change.
Some studies have evaluated temporal dynamics of IC. Here, we provided an overview of these studies which include details such as the authors, publication year, indicators/variables used for temporal assessment of IC, time periods, study catchment, and study objectives (Table 1).
Our review of previous studies indicates that most studies focused on the effects of vegetation cover and land use changes on connectivity and that the effects of surface soil moisture (SSM) on the temporal dynamics of IC have not been assessed over an extended period. Moreover, most studies assessed and compared IC values in catchments using statistical measures such as min, max, mean, median, lower and upper quartile, and interquartile ranges [22,26,33,34,35], while the best metric representing IC values in large areas remains challenging [2]. De Walque et al. [33] showed the highest (not the mean or lowest value) IC could be most representative of the IC of a larger area. Moreover, in most hydrological and environmental studies where data are not uniformly distributed, weighted mean values of variables have higher accuracy than arithmetic means, e.g., rainfall in mountainous regions [36,37,38]. Therefore, considering these issues, our study has four key objectives: (i) spatial evaluation of sediment connectivity using Cavalli’s IC in an understudied mountainous region of the world (Gunt River catchment in the Tajik Pamir); (ii) temporal assessment of IC based on changes in SSM along with vegetation cover in July 2015 and July 2024; (iii) determining the most influential factor among hydrological, biophysical, and topographic factors in relation to IC values; and (iv) computing weighted mean IC (as a novel metric) using iso-IC lines and comparing it with mean IC.

2. Materials and Methods

2.1. Study Area

The Gunt River catchment, situated in the Central Pamir region of Tajikistan, occupies approximately 13,700 km2 (Figure 1). With an average elevation of 4261 m a.s.l., the area is defined by its rugged, mountainous landscape [39]. The region experiences a cold and dry climate, receiving an average annual precipitation of 250–300 mm (from Khorog station), primarily as snow (80% of annual precipitation) in winter and spring [40]. Snow melt and glacier melt are the main sources of river discharge, with glacier melt contributing around 5% of the annual runoff [41]. Consequently, variations in snow cover and the related soil moisture significantly influence the basin’s hydrological dynamics [42]. The Gunt River, which originates from Lake Yashilkul, comprises more than 30 tributary rivers and streams. The Gunt catchment experiences extreme temperature variations, with mean annual temperatures averaging about −8 °C in winter and rising to approximately 23 °C in summer [40]. Land cover is predominantly composed of barren or sparsely vegetated areas (67.6%) and grasslands (24.0%), with mountain lakes (0.43%) with glaciers covering about 7.5% of the catchment. These glaciers are primarily located in the wetter western part of the catchment, especially along the Rushan Range. The western part is characterized by pronounced relief with steep and erosion-prone valleys, while the eastern part is a high plateau with broad valleys [40,43].

2.2. Index of Connectivity (IC)

The topography-based index of connectivity [12] was applied to model the potential sediment connectivity from the hillslopes to the outlet of the Gunt catchment. This index is the modified version of the IC that Borselli et al. [8] designed for application in mountainous environments. The refinement by Cavalli et al. [12] includes computing the contributing area by applying the D-infinity multiple flow approach, using roughness index as a weighting factor, and computing the slope factor according to the direction of steepest downslope while setting a lower and upper limit. This model provides two outputs: (i) an evaluation of the potential sediment connectivity within the entire catchment from hillslopes to the catchment outlet and (ii) the potential connection between the hillslopes and target features (e.g., the channel network). In this study, the target of the simulation was the outlet of the Gunt catchment, as our focus was on the overall connectivity between sediment sources and the catchment outlet. The IC depicts the potential connectivity among different parts of a catchment for each raster cell of the input data and comprises upslope ( D up ) and downslope ( D dn ) components expressed as follows [8]:
D up   =   W - S - A
D dn   = i = 1 n d i W i S i
D up estimates the routing potential of the generated sediment from upslope to downslope using a combination of average slope gradient ( S - ), upslope contributing area ( A ), and an averaged weighting factor ( W - ). D dn estimates the flow path length to the specified target or sink as a function of the weighting factor of the ith cell ( W i : d i m e n s i o n l e s s ) , the slope gradient of the ith cell ( S i : m/m), and the length of the flow path along the ith cell ( d i : m) based on the steepest downslope’s direction. The logarithmic ratio between D up (Equation (1)) and D dn (Equation (2)) constitutes the IC (Equation (3)), which can range from −∞ to +∞ (higher IC values indicate increasing sediment connectivity and vice versa) [8]:
IC = log 10 ( D up D dn )  

2.3. Weighting Factor

The weighting factor represents the resistance to sediment flux and varies according to specific characteristics of the study region [44]. It can be implemented for different effective factors in calculating IC if it is applied equally to upslope and downslope components [18]. High weighting factors indicate well-connected areas with strong water flow and sediment delivery, while low values represent weakly connected areas [13].
Considering that soil moisture affects spatial and temporal variation in connectivity [45], we used remotely sensed soil moisture datasets to estimate weighting factors (WSSM). In this study, the Soil Moisture Active Passive (SMAP) Level-4 (L4) surface soil moisture data for July 2015 and July 2024 were collected from the NASA/SMAP/SPL4SMGP/007 product, available at https://explorer.earthengine.google.com/ (accessed on 10 February 2025), and then the average values were calculated for both months. SMAP L4 is one of the most accurate estimates of global soil moisture that provides surface soil moisture (0–5 cm depth). For this product, SMAP L-band brightness temperature data from descending and ascending half-orbit satellite passes (approximately 6:00 a.m. and 6:00 p.m. local solar time) were assimilated into a land surface model that was gridded using an Earth-fixed, global cylindrical 9 km equal-area.
We also used the weighting factor derived from the cover-management factor (C-factor) of the Universal Soil Loss Equation (USLE)/Revised Universal Soil Loss Equation (RUSLE) [46,47] to assess the effect of vegetation cover on spatial and temporal variation in sediment connectivity in the catchment. In this regard, the normalized difference vegetation index (NDVI) data for the Gunt catchment were collected from the MODIS/061/MOD13Q1 product, available at https://explorer.earthengine.google.com/ (accessed on 10 February 2025). The MOD13Q1 V6.1 product provides NDVI based on existing National Oceanic and Atmospheric Administration-Advanced Very High-Resolution Radiometer (NOAA-AVHRR)-derived NDVI. These remotely sensed images (i.e., NDVI) were used to estimate C as the weighting factor based on the approach of Durigon et al. [48]:
W C = C = 1 N D V I 2
where lower values of C indicate dense vegetation cover and protected soil, and higher values denote unprotected and bare soil [49]. In this region maximum vegetation cover and minimum snow cover occur in summer [50], when suitable temperatures and the melting of most of the snow cover increases plant growth [51]. Moreover, snow cover, cloud cover, and precipitation decrease the accuracy of MODIS-derived NDVI [52], and snow cover decreases the accuracy of SMAP-derived soil moisture [53]. Thus, in this study, July 2015 and July 2024 were considered for assessment of temporal variability.

2.4. Calculation of the Index of Connectivity

Calculation of the IC was performed using the software SedInConnect 2.3, which operates as a stand-alone application to create connectivity maps [12,18]. Although the tool is a GIS-independent application, data were prepared in an ArcGIS environment. The first step in calculating IC involved preparation of raster maps of the hydrological DEM and the weighting factor as the main inputs of SedInConnect 2.3. To generate the hydrological DEM, we employed an algorithm available in TauDEM [12] for the SRTM data (with 1 Arc-Second resolution) [20]. The weighting factors (WSSM and WC) were calculated using tools available in ArcGIS Pro 3.4.0, and the combined weighting factor was computed by multiplying the WSSM and WC layers [13]. To prepare WSSM, the SMAP images were normalized between 0.001 and 1, with values close to 1 indicating higher soil moisture. Then, since all input layers must have the same pixel size, the WSSM layer was resampled to 30 m, the resolution used for the other input layers [18]. In the second step, ICSSM*C was calculated using the software SedInConnect (Equation (5)), resulting in a raster data file. This formula accounts for the combination of surface soil moisture and vegetation cover factors to calculate IC.
I C S S M * C = log 10 ( W S S M W C S - A i = 1 n d i W S S M i W C i S i )
where WSSM is the weight related to surface soil moisture and WC is the weight related to the C-factor of USLE. Finally, IC raster layers were categorized into four classes (low, medium-low, medium-high, and high) [16,54] using a Natural Breaks Classification algorithm. Based on previous studies, Natural Breaks [12,13,16,21,23,54] and quantiles [55] have been used for classifying the IC map [2]. Although the Natural Breaks algorithm is the most widely used method for IC classification because it searches for the greatest differences between classes and the greatest similarity within classes [56], a few very large or very small values can influence the spatial extent of the classes (e.g., high, moderate, and low connectivity) on the map.

2.5. Computation of Weighted Mean IC Values

We first divided the IC layer into the desired zones [54] using the contour tool in the Spatial Analyst extension in ArcGIS environment, and the contour type was set to contour polygon to facilitate the calculation of the area between the iso-IC lines. In the second step, the area of the zones between the iso-IC lines was calculated, and finally the weighted mean values were obtained as follows [57]:
I C w ¯ = i = 1 n ( A i × I C i ¯ ) i = 1 n A i
where I C w ¯ is the weighted mean IC, n is the number of zones (polygons) between the iso-IC lines, A i is area of zone i, and I C i ¯ is the mean IC in zone i which is calculated as follows:
I C i ¯ = I C u p p e r + I C l o w e r 2

3. Results and Discussion

3.1. Relationships Between IC and Environmental Factors

According to the assumptions in the connectivity index formula, the IC patterns vary based on two groups of environmental factors: (i) topographic factors, including elevation, slope gradient, and flow direction, which control the potential pathways of sediment transport and (ii) flow resistance factors, including vegetation cover, surface roughness, and surface soil moisture, which affect the magnitude and intensity of sediment transfer and, consequently, influence the connectivity between sources and target areas [8,12]. In this study, we examined the effect of elevation, slope gradient, NDVI, and SSM on IC.
To investigate the relationship between IC and influencing factors, raster maps of the factors were first clipped based on the boundaries of IC classes (i.e., four classes). Then, the average values in each class were calculated. Finally, the Pearson correlation coefficient (r) and coefficient of determination (R2) were determined between each factor and the average IC in each class to assess the potential of these factors on IC. The correlations between IC and environmental factors were similarly ranked on both dates (i.e., July 2015 and July 2024), where the highest correlations were for SSM followed by slope, elevation, and NDVI (Table 2). However, correlations were higher in July 2024 than in July 2015. The high correlation between IC with SSM is related to the hydrological process.
When SSM increases, soil pores become partially saturated, potentially reducing the soil’s infiltration capacity, leading to greater surface runoff during rainfall or snow and glacier melt. The generated runoff can detach soil particles from slopes and transport them downslope, thereby enhancing sediment transfer [58]. Therefore, when the soil is wetter, the hydrological connectivity between sediment sources and sinks increases, facilitating flow of water and sediment across the catchment and enhancing IC values [59]. Considering that climate warming has caused enhanced snow and glacier melt in this catchment [51], this additional water input increases surface runoff and sediment transport by augmenting SSM [59]. The positive correlation of IC with slope is expected, as increasing slope strengthens surface runoff velocity and flow energy, leading to increased sediment transport power and detachment of soil particles. Additionally, reduced runoff concentration times cause surface runoff from upstream areas to reach the main channel more rapidly. All these factors contribute to higher IC values [60].
Vegetation cover plays an important role as a resistance factor in sediment transport influencing surface roughness, runoff generation, and soil erosion [61,62], thereby affecting the flow energy, sediment transport, and consequently the degree of connectivity between sources and sinks [63]. Areas with sparse vegetation generally exhibit higher connectivity, whereas areas with dense vegetation are less connected. However, the weak positive correlation of IC with NDVI does not truly reflect the physical mechanisms in the Gunt basin and is a bit of an artifact, which is likely attributable to the extensive bare areas where average NDVI values were below or close to zero (e.g., bare soil, rocks, urban/residential areas, and water) [64]. Elevational effects on IC are indirectly related to changes in climate, soil, and vegetation [65]; thus, the negative correlation between IC and elevation is likely due to increasing distance from the main drainage network and more competent bedrock at higher elevations reducing sediment supplies. Moreover, lower liquid precipitation at higher elevations leads to less surface runoff for sediment transport [66]. Our findings are mostly consistent with previous studies of the effects of environmental factors (e.g., climate, vegetation, topography, and soil) on structural IC [28,65,67]. However, in contrast to the findings of Wang and Zhang [65] which indicated vegetation was the dominant control on IC, our results show that vegetation cover is the least influential factor due to the wide extent of exposed ground in the Gunt catchment.

3.2. Assessment of Spatio-Temporal Variations in Factors Affecting IC

To determine IC based on our methodology, NDVI and SSM maps of the Gunt catchment were prepared for July 2015 and July 2024. Additionally, elevation and slope gradient maps were developed to assess how these factors may affect IC variability within the catchment (Figure 2). To assess how elevation, slope, NDVI, and SSM affect IC, maps were categorized into four classes (three for SSM) (Figure 2 and Figure 3). Qualitative and quantitative descriptions of these factors are shown in Table 3.
Table 3. Qualitative and quantitative description and extent of elevation, slope, NDVI, and SSM in Gunt catchment.
ParameterTimeDescription of ClassesClassParameter ValueArea (km2)
Elevation (m)No timeLow elevation 12065–3000343.79
Medium elevation 23000–40003163.67
High mountainous 34000–550010,162.1
Very high mountainous 45000–666023.24
Slope (%)No timeFlat or low slope10–5%658.94
Mild slope25–15%1907.01
Moderate slope315–30%2662.19
Steep slope4>30%8444.25
NDVI July 2015Non-vegetated 1<013,523
Sparse vegetation20–0.2120.49
Moderate vegetation30.2–0.544.61
Dense vegetation4>0.50.42
NDVI July 2024Non-vegetated 1<013,341.20
Sparse vegetation20–0.2261.57
Moderate vegetation30.2–0.579.53
Dense vegetation4>0.55.70
SSM (m3/m3)July 2015Very low10.05–0.082470.02
Moderate20.08–0.118528.45
High3>0.112689.25
SSM (m3/m3) July 2024Very low10.05–0.084318.69
Moderate20.08–0.115440.87
High3>0.113928.42
Overall, 61.8% of the catchment has steep (>30%) slopes (Figure 2b), including not only the border areas but also most of the central and western parts of the catchment. Another 4.8% of the catchment includes low-gradient areas scattered mostly in the eastern parts of the catchment in and around the high-elevation Pamir Plateau, which is punctuated by high mountains and glaciers. Also, areas with relatively low (14%) and moderate (19.5%) gradient slopes are scattered throughout the catchment, particularly near valley bottoms. Most (74.2%) of the catchment includes high mountains while only 2.5% of the catchment is at low elevations located in the west and near the catchment outlet (Figure 2a).
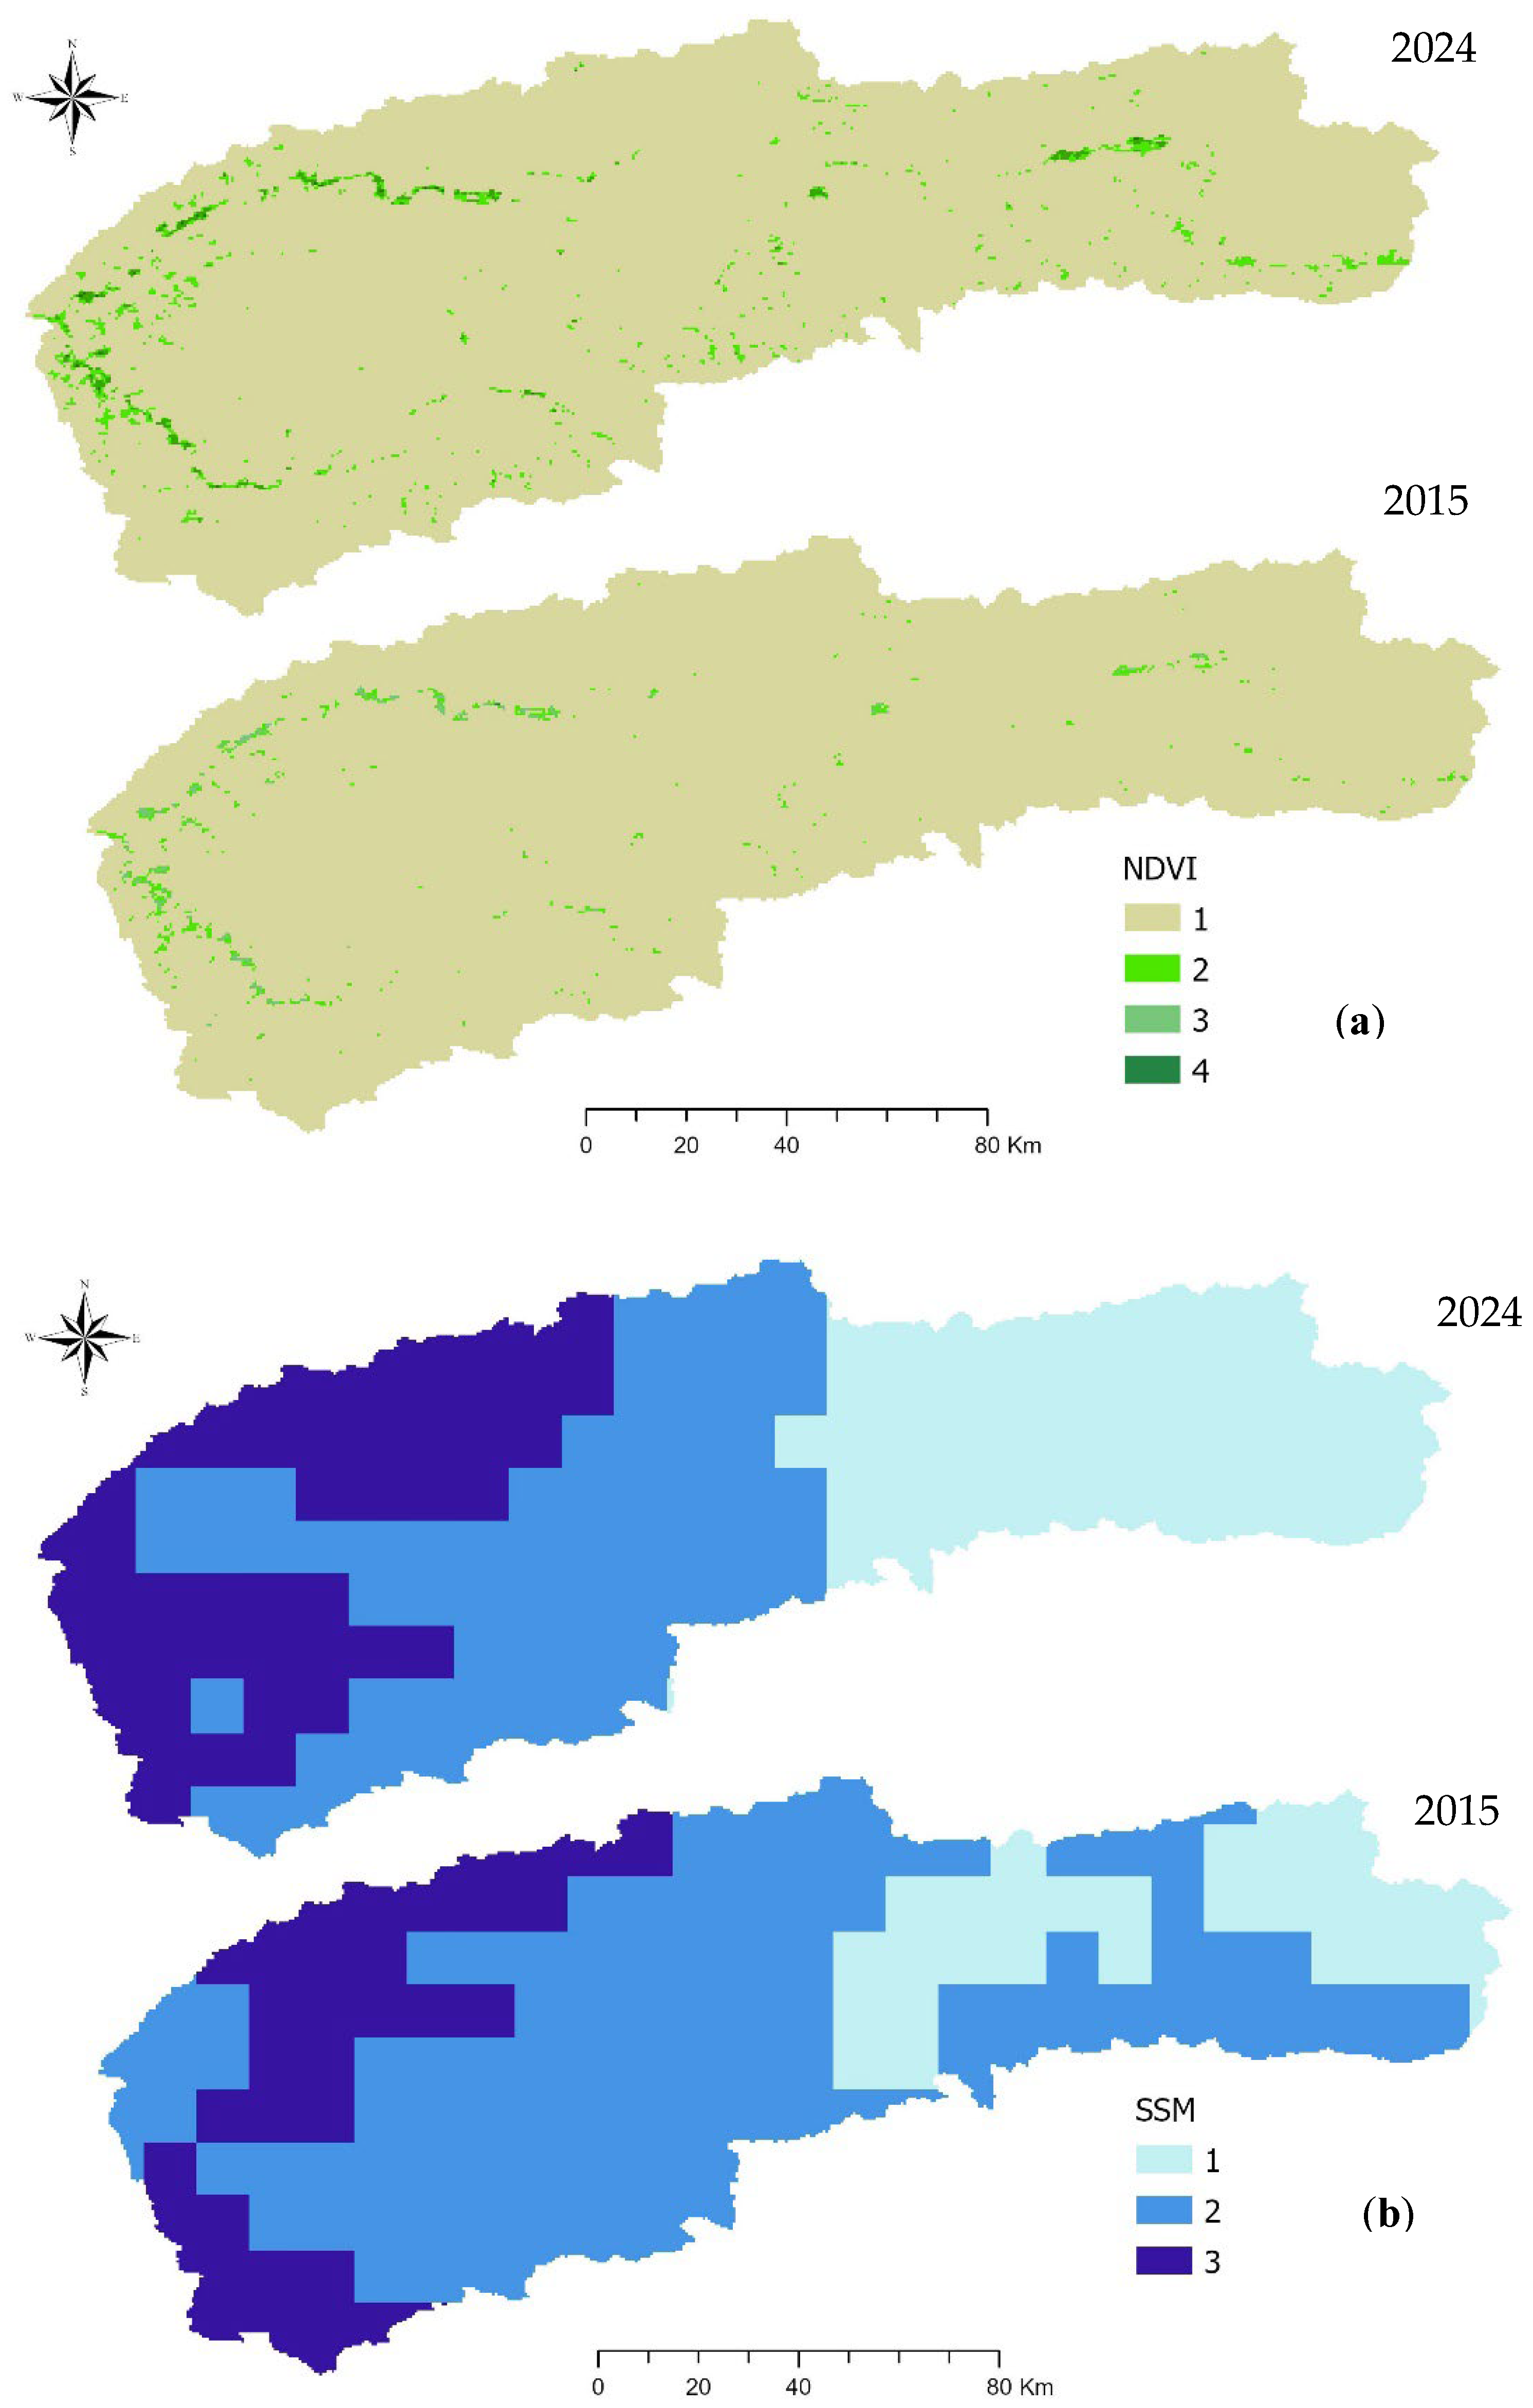
Most of the Gunt catchment includes non-vegetated areas based on NDVI classification with narrow strips of sparse, moderate, and dense vegetation cover in the western catchment near river courses and scattered areas in the east (Figure 3a). These vegetated strips align with the pattern of the catchment slope and elevation maps. Areas with low to moderate elevations and slopes < 15%, particularly in the western catchment, which receives more rainfall, have more potential for vegetation cover and are more accessible for agricultural operations [42]. Moreover, gentler slopes retain more moisture, nutrients, and organic matter, which enhance soil stability as well as vegetation cover [68]. Areas of regions with sparse, moderate, and dense vegetation cover have increased by 141.08, 34.92, and 5.28 km2, respectively, from 2015 to 2024 based on NDVI; this increase in vegetation greenness is consistent with the findings of Su et al. [69].
Runoff strongly facilitates connectivity amongst different parts of the catchment and is dependent on antecedent soil moisture conditions [70]. Soil moisture (as a hydrological factor) not only reflects the impact of precipitation and temperature within the catchment but also impacts spatial and temporal aspects of IC [45]. Among the environmental factors assessed, soil moisture was the most significant factor affecting IC in the Gunt catchment. High-elevation areas in the east (Pamir Plateau) have very low SSM; these low SSM areas increased substantially from 2015 to 2024 (Figure 3b), possibly related to temperature increases that would enhance evaporation [65]. Normatov and Normatov [51] indicated that the average annual temperature in the Gunt River basin increased from 1944 to 2016, with distinct differences observed between the western and eastern parts of the catchment. Additionally, they note that the western portion had stable precipitation, while the eastern portion has experienced declining precipitation. Thus, rising summer temperatures have likely affected the very low SSM in the eastern catchment whereas a substantial increase in area with higher soil moisture occurred in the western catchment from 2015 to 2024 (Figure 3b), possibly due to the presence of snow and glacier sources in this part of the catchment where temperature increases have caused more snow and glacier melt [71].

3.3. Assessment of the Spatio-Temporal Variations in IC

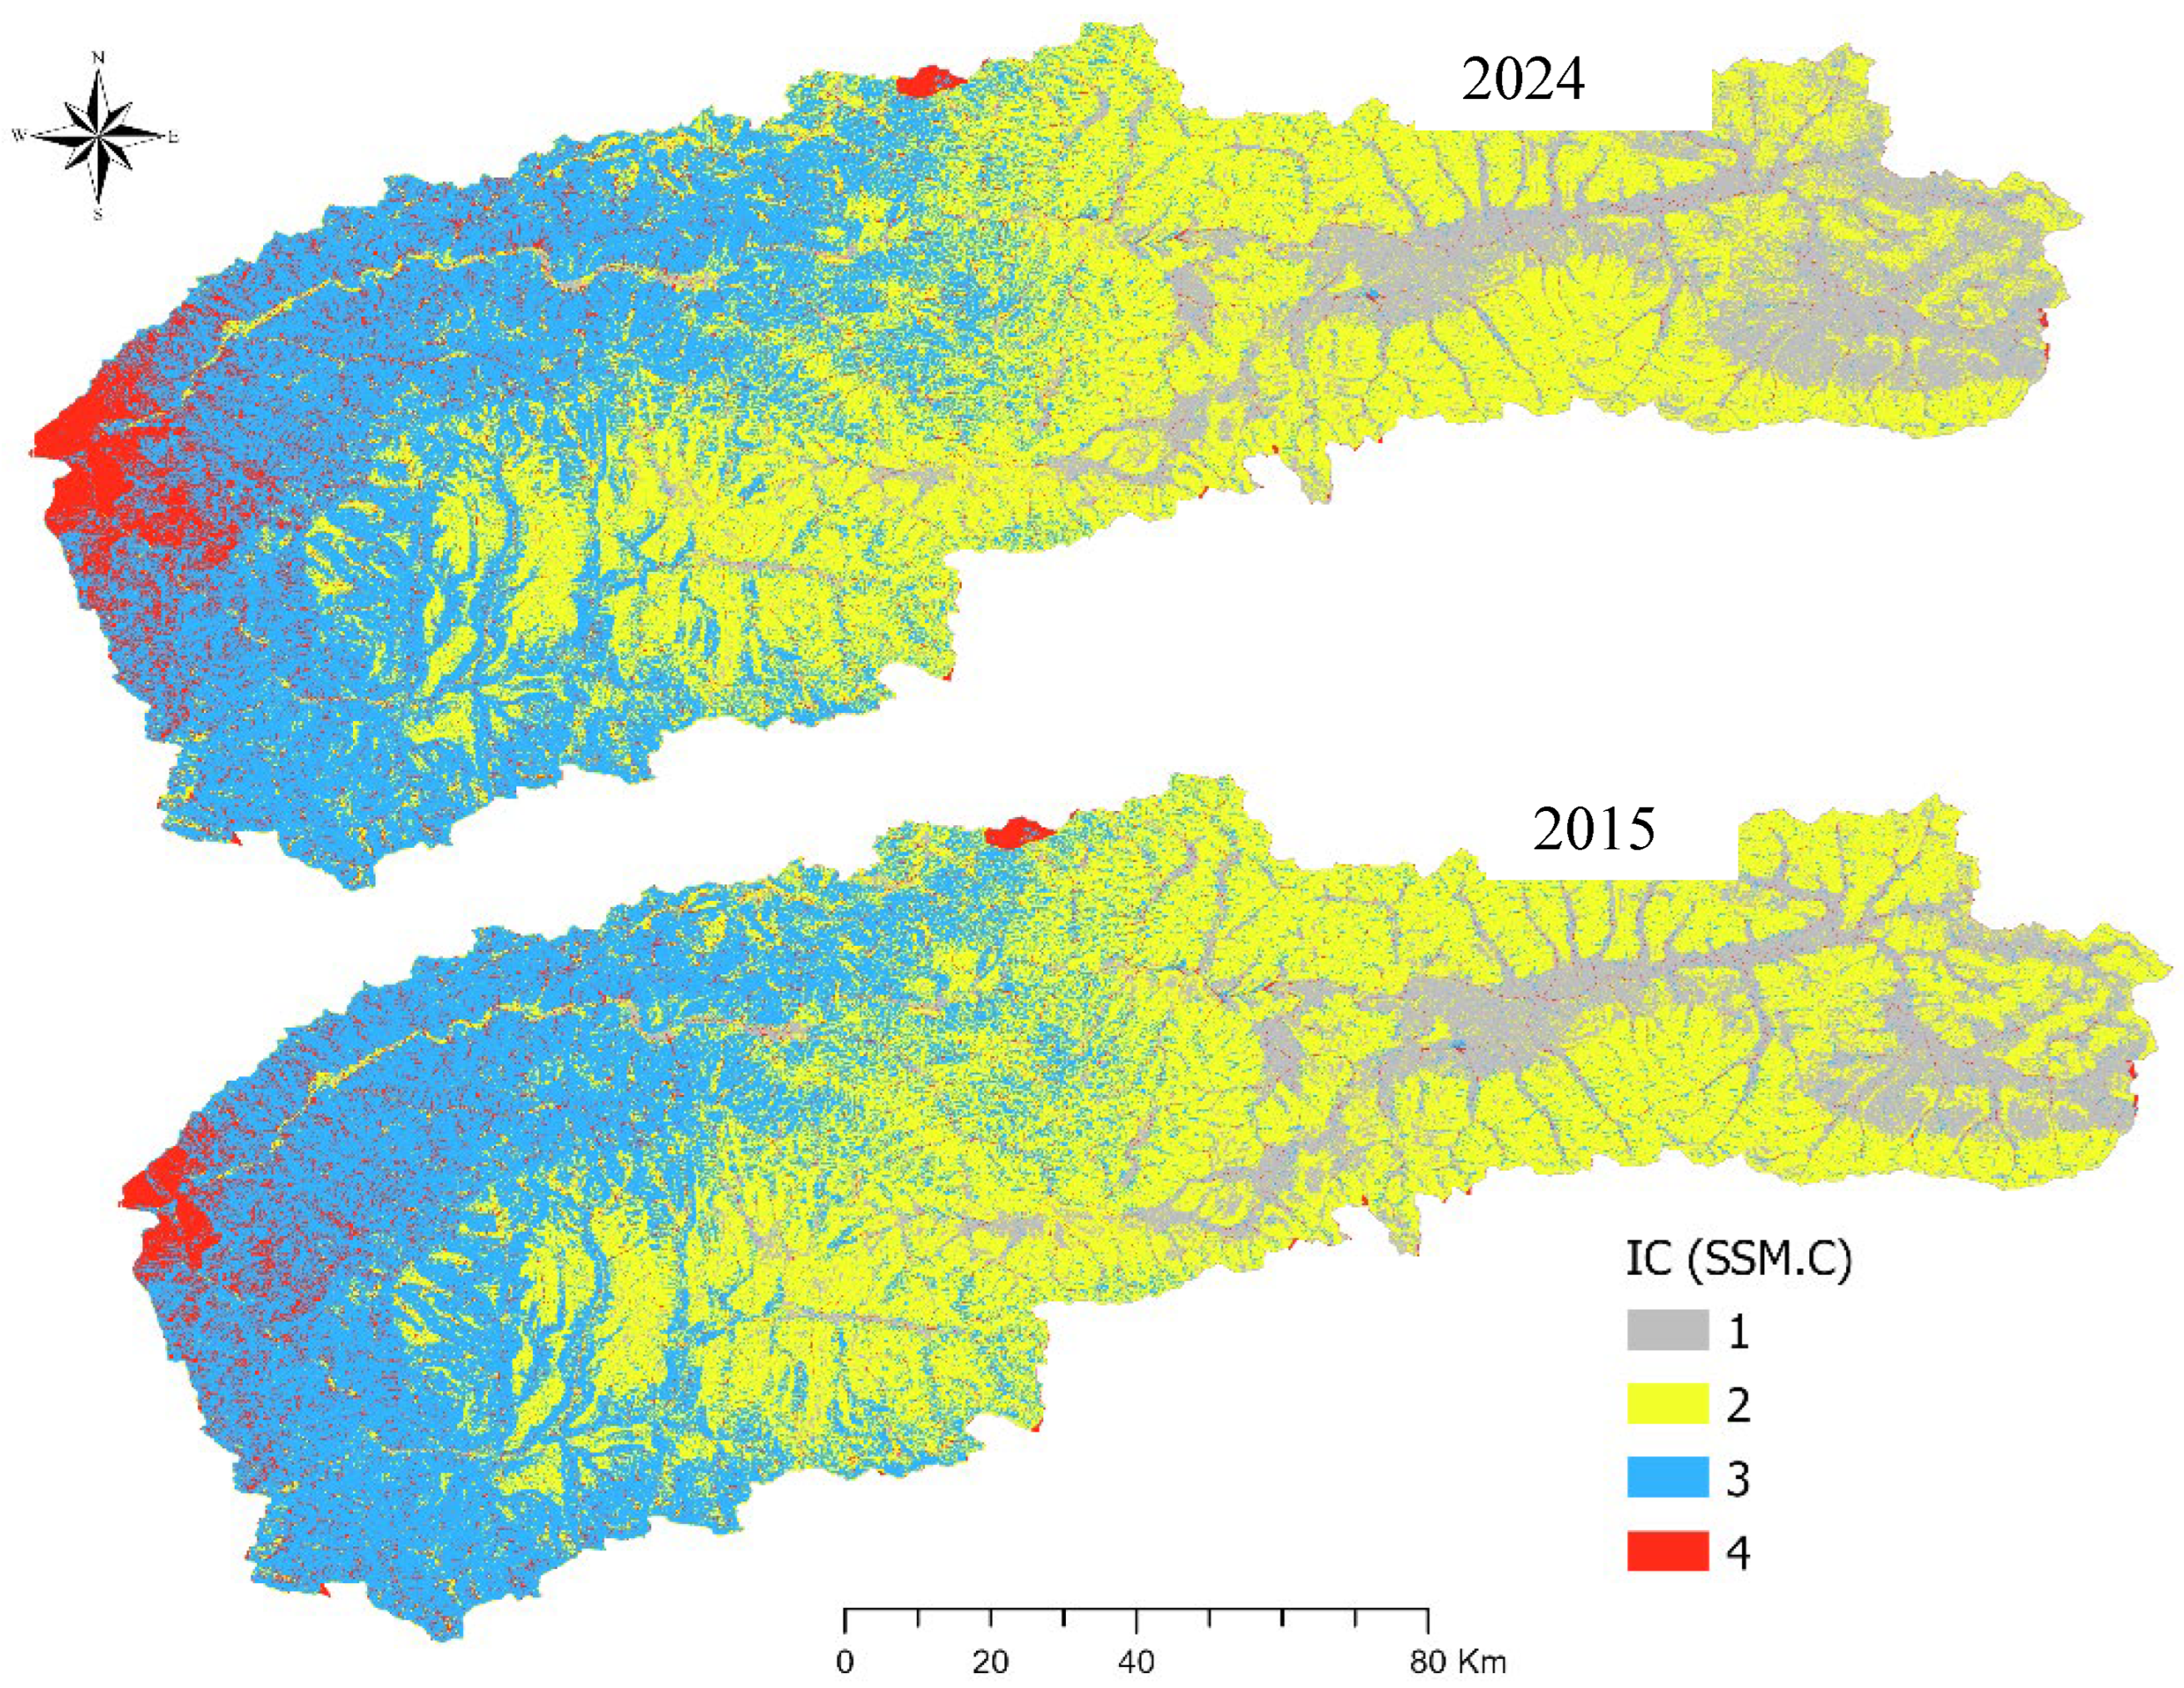
To effectively assess the spatio-temporal variation in IC, we categorized IC maps based on our methodology into four classes (low, medium-low, medium-high, and high) (Figure 4). Qualitative and quantitative descriptions of the IC maps are presented in Table 4.
The spatial distribution of slope, elevation, NDVI, and SSM affects the spatial variability of runoff, soil erosion, and sediment deposition, thus influencing the spatial heterogeneity of IC [13,31,65]. Within the Gunt catchment, IC exhibits high spatial variability with various patterns emerging (Figure 4). The west to central portions of the catchment generally have higher IC compared to other areas, due to steeper slopes, higher SSM, lower elevations, higher precipitation, and proximity to the catchment outlet, all of which increase the potential for sediment transport to streams. The areas close to the catchment outlet (Figure 4) tend to form regions with higher IC due to shorter sediment transfer pathways and steeper geomorphic features [54]. Moreover, results indicate that much of the eastern catchment has low IC values. These lower values are influenced by the presence of some lakes (Figure 1), which act as natural reservoirs, reducing the energy of water flow, leading to sediment deposition and a reduction in sediment transport downstream [72]. Furthermore, the Pamir Plateau, with slopes < 15%, occupies much of the eastern catchment (Figure 2b), reducing runoff velocity and facilitating the disconnection of intermittent streams from the main river system, thus reducing IC. Our results indicate an acceptable agreement between the calculated IC maps and slope and SSM maps (Figure 2b and Figure 3b). Changes in SSM can significantly alter the pattern of IC in the Gunt catchment.
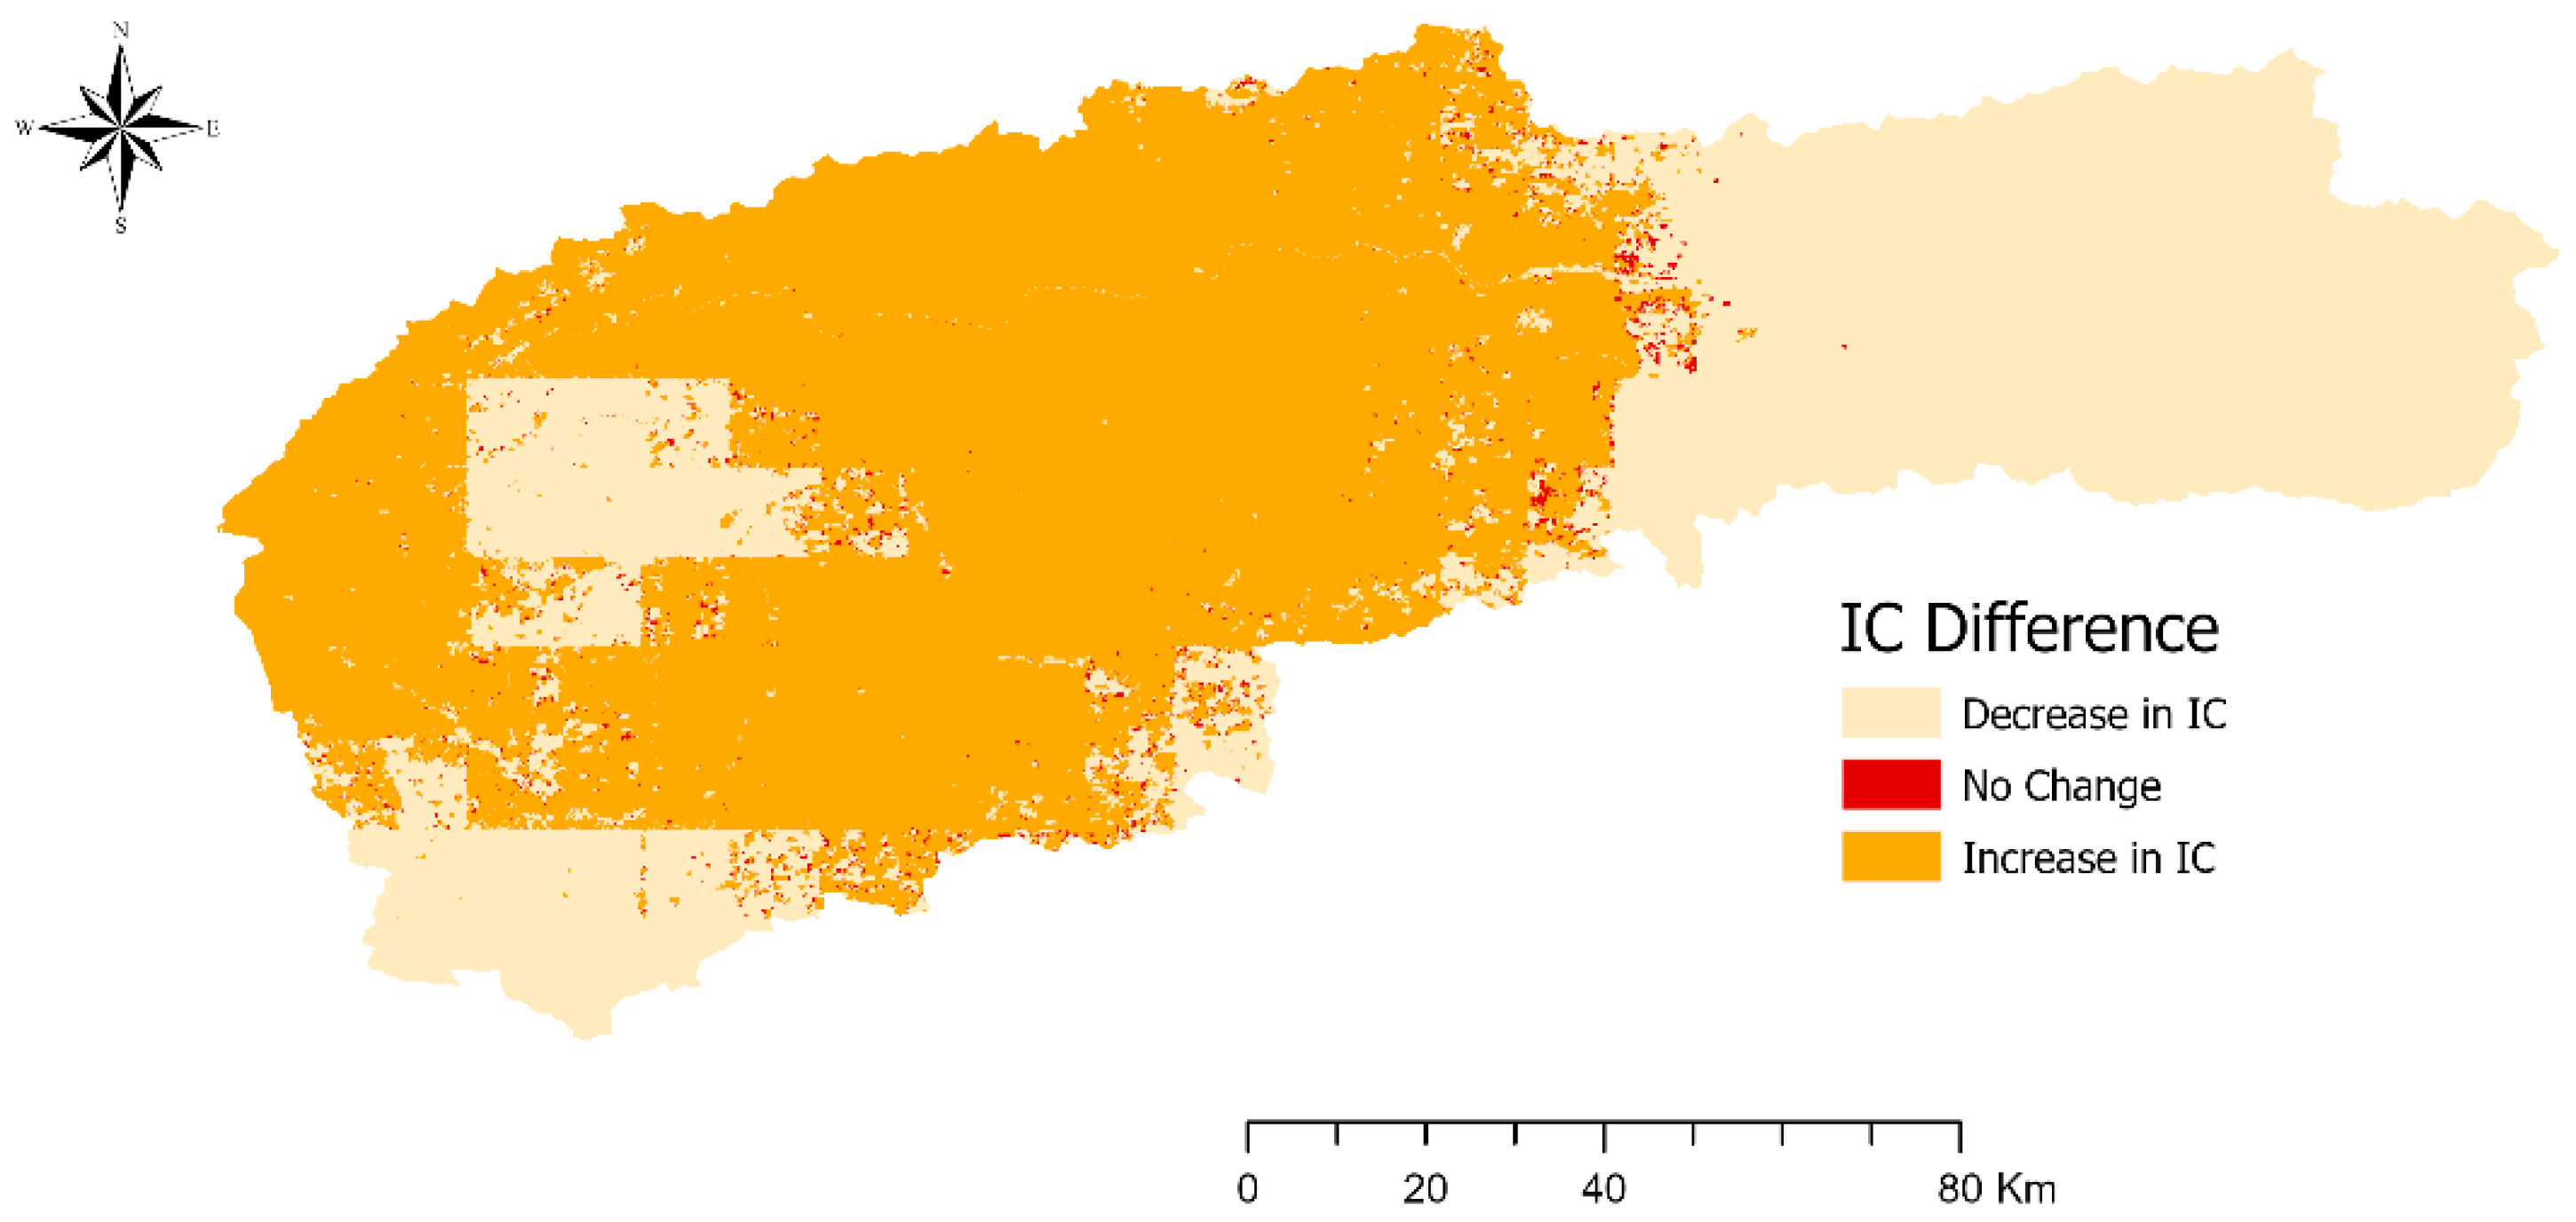
The spatial distribution of the differences in IC values between July 2015 and 2024 (Figure 5) also confirms our findings. Results reveal that much of the western catchment experienced an increase in IC, whereas decreases mainly occurred in the eastern parts. This spatial pattern is consistent with SSM trends, where the western area showed an increase in SSM, while the eastern part exhibited a reduction from 2015 to 2024. The numerous glaciers in the western catchment likely enhanced sediment and water fluxes due to increased glacier and snow melt in the warming climate. Furthermore, intensification of human activities in this area may have increased surface disturbance and sediment connectivity. In contrast, the eastern regions, where SSM has decreased, show a reduction in IC, likely resulting from reduced runoff and limited sediment transfer. These findings are also aligned with the increases in areas of high and medium-high IC in the western regions from 2015 to 2024 (Figure 4). Considering that the use of a geomorphological map of the study area can offer more detailed insights for the spatial analysis of the IC maps (Figure 4 and Figure 5), it will be provided by the authors in the future to improve the results.
Statistical parameters of IC values in the Gunt catchment show that both the weighted mean and median IC values have increased from 2015 to 2024, while mean IC has decreased (Table 5). Weighted mean values are better aligned with Gunt catchment conditions compared to arithmetic means because very high values occupied a small proportion of the total area, while low IC values comprise a much larger portion of the catchment. Therefore, by assigning lower weights to very high values and higher weights to low values that have more area, the weighted mean value provides a better indicator of average IC. In fact, the increased effect of lower IC values due to their larger proportion in the catchment and the reduced effect of high extreme values due to their lower proportion (importance) in the catchment (Figure 4 and Figure 6) make the weighted mean IC lower than the mean IC. The frequency of pixels in each zone and area between the iso-IC lines were computed for both IC maps (i.e., July 2015 and July 2024) (Figure 6 and Table 6). The comparison of the pixel frequency in each zone indicates that the highest and lowest number of pixels are in zones 1 and 4, respectively, in both IC maps. Furthermore, a higher number of pixels in zones 2, 3, and 4 (zones with high IC) in 2024 compared to 2015 is aligned with an increase in weighted mean IC from 2015 to 2024 and catchment conditions. Therefore, weighted mean IC can better represent IC in this large catchment. The comparison of the areas of IC classes revealed that low, medium-low, medium-high, and high classes occupied 13.8%, 44.6%, 36.9%, and 4.7% of the catchment in July 2015, respectively. By July 2024 these values changed as follows: areas with low, medium-low, medium-high, and high IC occupied 15.0%, 41.2%, 37.4%, and 6.5% of the Gunt catchment, respectively (Table 4). This represents a decrease of 7.7% in the medium-low class and increases of 8.75%, 1.28%, and 37.17% in the low, medium-high, and high classes from 2015 to 2024, respectively.
Within the period examined, temporal changes in IC were very minor in the middle of the catchment. Moreover, increasing areas of higher IC in the westernmost part of the catchment along with increasing areas of lower IC in the eastern catchment were observed; as noted, these changes may be associated with increasing temperature trends [51]. Increases in snow and glacier melt in the western catchment led to higher SSM and runoff and consequently higher IC, whereas an opposite trend occurred in the eastern catchment. Overall, the 38.5% increase in the medium-high and high IC classes from 2015 to 2024 reflects a warning of potential adverse catchment conditions related to land degradation, climate warming, and poor water and soil management.

3.4. Limitations and Suggestions

The limitations of this study include reliance on medium-resolution satellite data (MODIS-derived NDVI with a spatial resolution of 250 m) and low-resolution satellite data (SMAP-derived soil moisture with spatial resolution of 9 km) and the lack of IC validation through field observations and sediment measurements during the study period. Given the low spatial resolution of the soil moisture images, obtaining conclusive results is difficult. Therefore, in future studies, it is recommended to use soil moisture data with higher spatial resolution, if available, and to investigate the impact of spatial resolution on the IC values. Additionally, results should be validated by measuring sediment fluxes at key points (including the catchment outlet) during assessments coupled with investigating the predictive power of the weighted mean IC (compared to mean IC) for observed or measured catchment behavior (e.g., sediment delivery). Because soil moisture influences sediment transfer, applying soil moisture maps to quantify the weighting factor could be beneficial in other glacierized mountainous catchments where climate-induced changes in soil moisture may alter sediment connectivity. We also suggest investigating event-scale sediment connectivity, measuring functional sediment connectivity to complement structural sediment connectivity assessments [73], and examining IC in different seasons to assess the impact of snow and glacier melt on IC in mountain catchments dominated by cryosphere processes.

4. Conclusions

This study assessed the spatio-temporal variability of sediment connectivity in Gunt River catchment, Tajikistan, to better understand sediment yield and transport processes in remote mountain regions and optimize sediment management strategies by determining areas prone to sediment transport and hazards. We calculated the IC in the Gunt catchment in July 2015 and July 2024, evaluating the potential effects of environmental factors that affect the IC patterns. While we recognize that this is not a temporal continuum, this assessment revealed that median and weighted mean IC values have increased after 9 years based on multiple factors. Correlations between IC and various environmental factors (i.e., SSM, NDVI, slope, and elevation) indicate that SSM as a hydrological factor was more strongly correlated with IC than biophysical and topographic factors. Moreover, valley bottoms of the western catchment, particularly proximate to the catchment outlet, had higher IC values compared to the eastern catchment characterized by a high-elevation plateau. Additionally, temporal changes in IC indicate increasing regions with high and medium-high IC values in the Gunt catchment. Considering the lack of resources, difficulties in accessing remote areas, and technical and financial constraints in developing countries like Tajikistan, this approach using rapid calculations, low-cost technology, and use of available data identifies areas with high IC values which are more prone to erosion and sediment transfer. These areas in the Gunt catchment can be prioritized for soil conservation through the establishment of vegetation cover, structural erosion control measures, or implementation of sustainable agricultural practices—e.g., nature-based solutions and hybrid interventions [74]. Moreover, for downstream areas and regions close to the river, sediment control systems and small dams are recommended to reduce the amount of sediment entering the main channel, which helps efficient hydropower operations and enhances their long-term efficiency. This study provided one of the first quantitative assessments of the dynamics of the sediment connectivity index in Central Pamir, which can be a valuable first step in highlighting areas for soil conservation and sediment hazard interventions or further investigations.

Author Contributions

Conceptualization, methodology, investigation, formal analysis, writing—original draft, H.A.; supervision, methodology, writing—review and editing, R.C.S.; writing—review and editing, A.C. All authors have read and agreed to the published version of the manuscript.

Funding

This study received no external funding.

Data Availability Statement

The corresponding author can provide some data that backs up the study’s conclusions upon request.

Conflicts of Interest

The authors declare no conflicts of interest.

References

  1. Michaelides, K.; Chappell, A. Connectivity as a Concept for Characterising Hydrological Behaviour. Hydrol. Process. Int. J. 2009, 23, 517–522. [Google Scholar] [CrossRef]
  2. Heckmann, T.; Cavalli, M.; Cerdan, O.; Foerster, S.; Javaux, M.; Lode, E.; Smetanová, A.; Vericat, D.; Brardinoni, F. Indices of Sediment Connectivity: Opportunities, Challenges and Limitations. Earth Sci. Rev. 2018, 187, 77–108. [Google Scholar] [CrossRef]
  3. Sidle, R.C.; Gomi, T.; Usuga, J.C.L.; Jarihani, B. Hydrogeomorphic Processes and Scaling Issues in the Continuum from Soil Pedons to Catchments. Earth Sci. Rev. 2017, 175, 75–96. [Google Scholar] [CrossRef]
  4. Turnbull, L.; Hütt, M.-T.; Ioannides, A.A.; Kininmonth, S.; Poeppl, R.; Tockner, K.; Bracken, L.J.; Keesstra, S.; Liu, L.; Masselink, R. Connectivity and Complex Systems: Learning from a Multi-Disciplinary Perspective. Appl. Netw. Sci. 2018, 3, 11. [Google Scholar] [CrossRef] [PubMed]
  5. Calsamiglia, A.; Lucas-Borja, M.E.; Fortesa, J.; García-Comendador, J.; Estrany, J. Changes in Soil Quality and Hydrological Connectivity Caused by the Abandonment of Terraces in a Mediterranean Burned Catchment. Forests 2017, 8, 333. [Google Scholar] [CrossRef]
  6. Di Stefano, C.; Ferro, V. Assessing Sediment Connectivity in Dendritic and Parallel Calanchi Systems. Catena 2019, 172, 647–654. [Google Scholar] [CrossRef]
  7. Sidle, R.C.; Sasaki, S.; Otsuki, M.; Noguchi, S.; Rahim Nik, A. Sediment Pathways in a Tropical Forest: Effects of Logging Roads and Skid Trails. Hydrol. Process. 2004, 18, 703–720. [Google Scholar] [CrossRef]
  8. Borselli, L.; Cassi, P.; Torri, D. Prolegomena to Sediment and Flow Connectivity in the Landscape: A GIS and Field Numerical Assessment. Catena 2008, 75, 268–277. [Google Scholar] [CrossRef]
  9. López-Vicente, M.; Sun, X.; Onda, Y.; Kato, H.; Gomi, T.; Hiraoka, M. Effect of Tree Thinning and Skidding Trails on Hydrological Connectivity in Two Japanese Forest Catchments. Geomorphology 2017, 292, 104–114. [Google Scholar] [CrossRef]
  10. Hamel, P.; Chaplin-Kramer, R.; Sim, S.; Mueller, C. A New Approach to Modeling the Sediment Retention Service (InVEST 3.0): Case Study of the Cape Fear Catchment, North Carolina, USA. Sci. Total Environ. 2015, 524, 166–177. [Google Scholar] [CrossRef]
  11. Liu, Y.; Fu, B. Assessing Sedimentological Connectivity Using WATEM/SEDEM Model in a Hilly and Gully Watershed of the Loess Plateau, China. Ecol. Indic. 2016, 66, 259–268. [Google Scholar] [CrossRef]
  12. Cavalli, M.; Trevisani, S.; Comiti, F.; Marchi, L. Geomorphometric Assessment of Spatial Sediment Connectivity in Small Alpine Catchments. Geomorphology 2013, 188, 31–41. [Google Scholar] [CrossRef]
  13. Kalantari, Z.; Cavalli, M.; Cantone, C.; Crema, S.; Destouni, G. Flood Probability Quantification for Road Infrastructure: Data-Driven Spatial-Statistical Approach and Case Study Applications. Sci. Total Environ. 2017, 581, 386–398. [Google Scholar] [CrossRef] [PubMed]
  14. Grauso, S.; Pasanisi, F.; Tebano, C. Assessment of a Simplified Connectivity Index and Specific Sediment Potential in River Basins by Means of Geomorphometric Tools. Geosciences 2018, 8, 48. [Google Scholar] [CrossRef]
  15. Zingaro, M.; Refice, A.; Giachetta, E.; D’Addabbo, A.; Lovergine, F.; De Pasquale, V.; Pepe, G.; Brandolini, P.; Cevasco, A.; Capolongo, D. Sediment Mobility and Connectivity in a Catchment: A New Mapping Approach. Sci. Total Environ. 2019, 672, 763–775. [Google Scholar] [CrossRef]
  16. Asadi, H.; Dastorani, M.T.; Sidle, R.C. Estimating Index of Sediment Connectivity Using a Smart Data-Driven Model. J. Hydrol. 2023, 620, 129467. [Google Scholar] [CrossRef]
  17. Asadi, H.; Dastorani, M.T.; Sidle, R.C.; Jahanshahi, A. A Comparative Assessment of Decision Tree Algorithms for Index of Sediment Connectivity Modelling. Water Resour. Manag. 2024, 38, 2293–2313. [Google Scholar] [CrossRef]
  18. Crema, S.; Cavalli, M. SedInConnect: A Stand-Alone, Free and Open Source Tool for the Assessment of Sediment Connectivity. Comput. Geosci. 2018, 111, 39–45. [Google Scholar] [CrossRef]
  19. Schopper, N.; Mergili, M.; Frigerio, S.; Cavalli, M.; Poeppl, R. Analysis of Lateral Sediment Connectivity and Its Connection to Debris Flow Intensity Patterns at Different Return Periods in the Fella River System in Northeastern Italy. Sci. Total Environ. 2019, 658, 1586–1600. [Google Scholar] [CrossRef]
  20. Nicoll, T.; Brierley, G. Within-Catchment Variability in Landscape Connectivity Measures in the Garang Catchment, Upper Yellow River. Geomorphology 2017, 277, 197–209. [Google Scholar] [CrossRef]
  21. Crema, S.; Bossi, G. Clustering Sediment Connectivity Maps to Distinguish Hillslope Processes. Rend. Online Della Soc. Geol. Ital. 2017, 42, 23–26. [Google Scholar] [CrossRef]
  22. Millares, A.; Moñino, A. Hydro-meteorological Drivers Influencing Suspended Sediment Transport and Yield in a Semi-arid Mountainous Basin. Earth Surf. Process. Landf. 2020, 45, 3791–3807. [Google Scholar] [CrossRef]
  23. Goldin, B.; Rudaz, B.; Bardou, E. Application of a Sediment Connectivity GIS-Based Index in a Basin Undergoing Glacier Retreat: The Case Study of the Navizence Catchment. Rend. Online Della Soc. Geol. Ital. 2016, 39, 35–38. [Google Scholar] [CrossRef]
  24. Najafi, S.; Sadeghi, S.H.R.; Heckmann, T. Temporospatial Variations of Structural Sediment Connectivity Patterns in Taham-Chi Watershed in Zanjan Province, Iran. J. Water Soil Conserv. 2017, 24, 131–147. [Google Scholar]
  25. Singh, M.; Tandon, S.K.; Sinha, R. Assessment of Connectivity in a Water-stressed Wetland (Kaabar Tal) of Kosi-Gandak Interfan, North Bihar Plains, India. Earth Surf. Process. Landf. 2017, 42, 1982–1996. [Google Scholar] [CrossRef]
  26. Kalantari, Z.; Ferreira, C.S.S.; Koutsouris, A.J.; Ahlmer, A.-K.; Cerdà, A.; Destouni, G. Assessing Flood Probability for Transportation Infrastructure Based on Catchment Characteristics, Sediment Connectivity and Remotely Sensed Soil Moisture. Sci. Total Environ. 2019, 661, 393–406. [Google Scholar] [CrossRef]
  27. Mishra, K.; Sinha, R.; Jain, V.; Nepal, S.; Uddin, K. Towards the Assessment of Sediment Connectivity in a Large Himalayan River Basin. Sci. Total Environ. 2019, 661, 251–265. [Google Scholar] [CrossRef]
  28. Llena, M.; Vericat, D.; Cavalli, M.; Crema, S.; Smith, M.W. The Effects of Land Use and Topographic Changes on Sediment Connectivity in Mountain Catchments. Sci. Total Environ. 2019, 660, 899–912. [Google Scholar] [CrossRef]
  29. López-Vicente, M.; Ben-Salem, N. Computing Structural and Functional Flow and Sediment Connectivity with a New Aggregated Index: A Case Study in a Large Mediterranean Catchment. Sci. Total Environ. 2019, 651, 179–191. [Google Scholar] [CrossRef]
  30. López-Vicente, M.; González-Romero, J.; Lucas-Borja, M.E. Forest Fire Effects on Sediment Connectivity in Headwater Sub-Catchments: Evaluation of Indices Performance. Sci. Total Environ. 2020, 732, 139206. [Google Scholar] [CrossRef]
  31. Liao, H.; He, Y. The Temporal Variation of Sediment Connectivity from 1982 to 2020 in the Wei River Basin, China. Hydrol. Process. 2023, 37, e15042. [Google Scholar] [CrossRef]
  32. Bertocco, T.; de Figueiredo, T.; Paz-González, A.; García-Tomillo, A.; López-Vicente, M. Deciphering Sediment Connectivity Dynamic in Traditional Water-Meadows (Lameiros). Geomorphology 2025, 480, 109750. [Google Scholar] [CrossRef]
  33. De Walque, B.; Degré, A.; Maugnard, A.; Bielders, C.L. Artificial Surfaces Characteristics and Sediment Connectivity Explain Muddy Flood Hazard in Wallonia. Catena 2017, 158, 89–101. [Google Scholar] [CrossRef]
  34. Martini, L.; Baggio, T.; Torresani, L.; Crema, S.; Cavalli, M. R_IC: A Novel and Versatile Implementation of the Index of Connectivity in R. Environ. Model. Softw. 2022, 155, 105446. [Google Scholar] [CrossRef]
  35. Zingaro, M.; Scicchitano, G.; Refice, A.; Marsico, A.; Kushabaha, A.; Elia, M.; Lafortezza, R.; Capolongo, D. Assessing the Impact of Vegetation Cover Changes and Post-Fire Effects through an Enhanced Sediment Flow Connectivity Index (SfCI). Catena 2024, 247, 108474. [Google Scholar] [CrossRef]
  36. Yu, C.-S.; Jeong, G.-S. Estimation of Area Average Rainfall Amount and Its Error. J. Korea Water Resour. Assoc. 2001, 34, 317–326. [Google Scholar]
  37. Limin, S.G.; Oue, H.; Takase, K. Estimation of Areal Average Rainfall in the Mountainous Kamo River Watershed, Japan. J. Agric. Meteorol. 2015, 71, 90–97. [Google Scholar] [CrossRef]
  38. Kang, B.-S.; Yang, S.-K.; Kang, M.-S. A Comparative Analysis of the Accuracy of Areal Precipitation According to the Rainfall Analysis Method of Mountainous Streams. J. Environ. Sci. Int. 2019, 28, 841–849. [Google Scholar] [CrossRef]
  39. Sidle, R.C.; Khan, A.A.; Caiserman, A.; Qadamov, A.; Khojazoda, Z. Food Security in High Mountains of Central Asia: A Broader Perspective. Bioscience 2023, 73, 347–363. [Google Scholar] [CrossRef]
  40. Navruzshoev, H.; Sagintayev, Z.; Kabutov, H.; Nekkadamova, N.; Vosidov, F.; Khalimov, A. Surface Area Dynamics of Gunt River Basin Mountain Lakes (the Pamirs, Tajikistan). Cent. Asian J. Water Res. 2022, 8, 141–152. [Google Scholar] [CrossRef]
  41. Barandun, M.; Pohl, E.; Naegeli, K.; McNabb, R.; Huss, M.; Berthier, E.; Saks, T.; Hoelzle, M. Hot Spots of Glacier Mass Balance Variability in Central Asia. Geophys. Res. Lett. 2021, 48, e2020GL092084. [Google Scholar] [CrossRef]
  42. Pohl, E.; Gloaguen, R.; Seiler, R. Remote Sensing-Based Assessment of the Variability of Winter and Summer Precipitation in the Pamirs and Their Effects on Hydrology and Hazards Using Harmonic Time Series Analysis. Remote Sens. 2015, 7, 9727–9752. [Google Scholar] [CrossRef]
  43. Pohl, E.; Knoche, M.; Gloaguen, R.; Andermann, C.; Krause, P. Sensitivity Analysis and Implications for Surface Processes from a Hydrological Modelling Approach in the Gunt Catchment, High Pamir Mountains. Earth Surf. Dyn. 2015, 3, 333–362. [Google Scholar] [CrossRef]
  44. Foerster, S.; Wilczok, C.; Brosinsky, A.; Segl, K. Assessment of Sediment Connectivity from Vegetation Cover and Topography Using Remotely Sensed Data in a Dryland Catchment in the Spanish Pyrenees. J. Soils Sediments 2014, 14, 1982–2000. [Google Scholar] [CrossRef]
  45. Destouni, G.; Verrot, L. Screening Long-Term Variability and Change of Soil Moisture in a Changing Climate. J. Hydrol. 2014, 516, 131–139. [Google Scholar] [CrossRef]
  46. Renard, K.G. Predicting Soil Erosion by Water: A Guide to Conservation Planning with the Revised Universal Soil Loss Equation (RUSLE); US Department of Agriculture, Agricultural Research Service: Washington, DC, USA, 1997; ISBN 0160489385. [Google Scholar]
  47. Wischmeier, W.H.; Smith, D.D. Predicting Rainfall Erosion Losses: A Guide to Conservation Planning; Department of Agriculture, Science and Education Administration: Washington, DC, USA, 1978. [Google Scholar]
  48. Durigon, V.L.; Carvalho, D.F.; Antunes, M.A.H.; Oliveira, P.T.S.; Fernandes, M.M. NDVI Time Series for Monitoring RUSLE Cover Management Factor in a Tropical Watershed. Int. J. Remote Sens. 2014, 35, 441–453. [Google Scholar] [CrossRef]
  49. Asadi, H.; Dastorani, M.T.; Khosravi, K.; Sidle, R.C. Applying the C-Factor of the RUSLE Model to Improve the Prediction of Suspended Sediment Concentration Using Smart Data-Driven Models. Water 2022, 14, 3011. [Google Scholar] [CrossRef]
  50. Hao, H.; Chen, Y.; Xu, J.; Li, Z.; Li, Y.; Kayumba, P.M. Water Deficit May Cause Vegetation Browning in Central Asia. Remote Sens. 2022, 14, 2574. [Google Scholar] [CrossRef]
  51. Normatov, I.; Normatov, P. Climate Change Impact on Hydrological Characteristics and Water Availability of the Mountain Pamir Rivers. Proc. Int. Assoc. Hydrol. Sci. 2020, 383, 31–41. [Google Scholar] [CrossRef]
  52. Gu, J.; Li, X.; Huang, C.; Okin, G.S. A Simplified Data Assimilation Method for Reconstructing Time-Series MODIS NDVI Data. Adv. Space Res. 2009, 44, 501–509. [Google Scholar] [CrossRef]
  53. Lemmetyinen, J.; Schwank, M.; Derksen, C.; Roy, A.; Colliander, A.; Rautiainen, K.; Pulliainen, J. Retrieval of Snow Parameters from L-Band Observations-Application for SMOS and SMAP. In Proceedings of the 2016 IEEE International Geoscience and Remote Sensing Symposium (IGARSS), Beijing, China, 10–15 July 2016; IEEE: New York, NY, USA, 2016; pp. 7067–7070. [Google Scholar]
  54. Najafi, S.; Sadeghi, S.H.; Heckmann, T. Analysis of Sediment Accessibility and Availability Concepts Based on Sediment Connectivity throughout a Watershed. Land Degrad. Dev. 2021, 32, 3023–3044. [Google Scholar] [CrossRef]
  55. Gay, A.; Cerdan, O.; Mardhel, V.; Desmet, M. Application of an Index of Sediment Connectivity in a Lowland Area. J. Soils Sediments 2016, 16, 280–293. [Google Scholar] [CrossRef]
  56. North, M.A. A Method for Implementing a Statistically Significant Number of Data Classes in the Jenks Algorithm. In Proceedings of the 2009 Sixth International Conference on Fuzzy Systems and Knowledge Discovery, Tianjin, China, 14–16 August 2009; IEEE: New York, NY, USA, 2009; Volume 1, pp. 35–38. [Google Scholar]
  57. Alozeer, A.; Abdaki, M.A.; Al-Iraqi, A.; Al-Samman, S.; Al-Hammadi, N. Estimation of Mean Areal Rainfall and Missing Data by Using Gis in Nineveh, Northern Iraq. Iraqi Geol. J. 2020, 53, 93–103. [Google Scholar] [CrossRef]
  58. Asadi, H.; Dastorani, M.T.; Sidle, R.C.; Shahedi, K. Improving Flow Discharge-Suspended Sediment Relations: Intelligent Algorithms versus Data Separation. Water 2021, 13, 3650. [Google Scholar] [CrossRef]
  59. Gonzalez-Ollauri, A.; Mickovski, S.B. Plant-Soil Reinforcement Response under Different Soil Hydrological Regimes. Geoderma 2017, 285, 141–150. [Google Scholar] [CrossRef]
  60. Garosi, Y.; Sheklabadi, M.; Conoscenti, C.; Pourghasemi, H.R.; Van Oost, K. Assessing the Performance of GIS-Based Machine Learning Models with Different Accuracy Measures for Determining Susceptibility to Gully Erosion. Sci. Total Environ. 2019, 664, 1117–1132. [Google Scholar] [CrossRef]
  61. Najafi, S.; Dragovich, D.; Heckmann, T.; Sadeghi, S.H. Sediment Connectivity Concepts and Approaches. Catena 2021, 196, 104880. [Google Scholar] [CrossRef]
  62. Asadi, H.; Shahedi, K.; Sidle, R.C.; Kalami, H.S.M. Prediction of Suspended Sediment Using Hydrologic and Hydrogeomorphic Data within Intelligence Models. Iran-Water Resour. Res. 2019, 15, 105–119. [Google Scholar]
  63. Asadi, H.; Shahedi, K.; Jarihani, B.; Sidle, R.C. Rainfall-Runoff Modelling Using Hydrological Connectivity Index and Artificial Neural Network Approach. Water 2019, 11, 212. [Google Scholar] [CrossRef]
  64. Lemenkova, P. Hyperspectral Vegetation Indices Calculated by Qgis Using Landsat Tm Image: A Case Study of Northern Iceland. Adv. Res. Life Sci. 2020, 4, 70–78. [Google Scholar] [CrossRef]
  65. Wang, C.; Zhang, G. Spatial Variation in Sediment Connectivity of Small Watershed along a Regional Transect on the Loess Plateau. Catena 2022, 217, 106473. [Google Scholar] [CrossRef]
  66. Ren, Z.; Ma, X.; Wang, K.; Li, Z. Effects of Extreme Precipitation on Runoff and Sediment Yield in the Middle Reaches of the Yellow River. Atmosphere 2023, 14, 1415. [Google Scholar] [CrossRef]
  67. Zanandrea, F.; Michel, G.P.; Kobiyama, M.; Censi, G.; Abatti, B.H. Spatial-Temporal Assessment of Water and Sediment Connectivity through a Modified Connectivity Index in a Subtropical Mountainous Catchment. Catena 2021, 204, 105380. [Google Scholar] [CrossRef]
  68. Ali, S.; Ullah, S.; Umar, H.; Usama Aslam, M.; Saghir, A.; Nasir, S.; Imran, S.; Zain, S.; Zain, R. Influence of Slope Variation on Northern Areas on Soil Physical Properties. Indian J. Pure Appl. Biosci. 2022, 10, 38–42. [Google Scholar] [CrossRef]
  69. Su, Y.; Chen, S.; Li, X.; Ma, S.; Xie, T.; Wang, J.; Yan, D.; Chen, J.; Feng, M.; Chen, F. Changes in Vegetation Greenness and Its Response to Precipitation Seasonality in Central Asia from 1982 to 2022. Environ. Res. Lett. 2023, 18, 104002. [Google Scholar] [CrossRef]
  70. Sidle, R.C.; Tsuboyama, Y.; Noguchi, S.; Hosoda, I.; Fujieda, M.; Shimizu, T. Stormflow Generation in Steep Forested Headwaters: A Linked Hydrogeomorphic Paradigm. Hydrol. Process. 2000, 14, 369–385. [Google Scholar] [CrossRef]
  71. Pohl, E.; Gloaguen, R.; Andermann, C.; Knoche, M. Glacier Melt Buffers River Runoff in the P Amir M Ountains. Water Resour. Res. 2017, 53, 2467–2489. [Google Scholar] [CrossRef]
  72. Weyhenmeyer, G.A.; Håkanson, L.; Meili, M. A Validated Model for Daily Variations in the Flux, Origin, and Distribution of Settling Particles within Lakes. Limnol. Oceanogr. 1997, 42, 1517–1529. [Google Scholar] [CrossRef]
  73. Bracken, L.J.; Turnbull, L.; Wainwright, J.; Bogaart, P. Sediment Connectivity: A Framework for Understanding Sediment Transfer at Multiple Scales. Earth Surf. Process. Landf. 2015, 40, 177–188. [Google Scholar] [CrossRef]
  74. Sidle, R.C.; Zaginaev, V.; Caiserman, A. Challenges and Opportunities for Implementing Nature-Based Solutions for Disaster Risk Reduction in Mountainous Central Asia. Nat.-Based Solut. 2025, 8, 100241. [Google Scholar] [CrossRef]
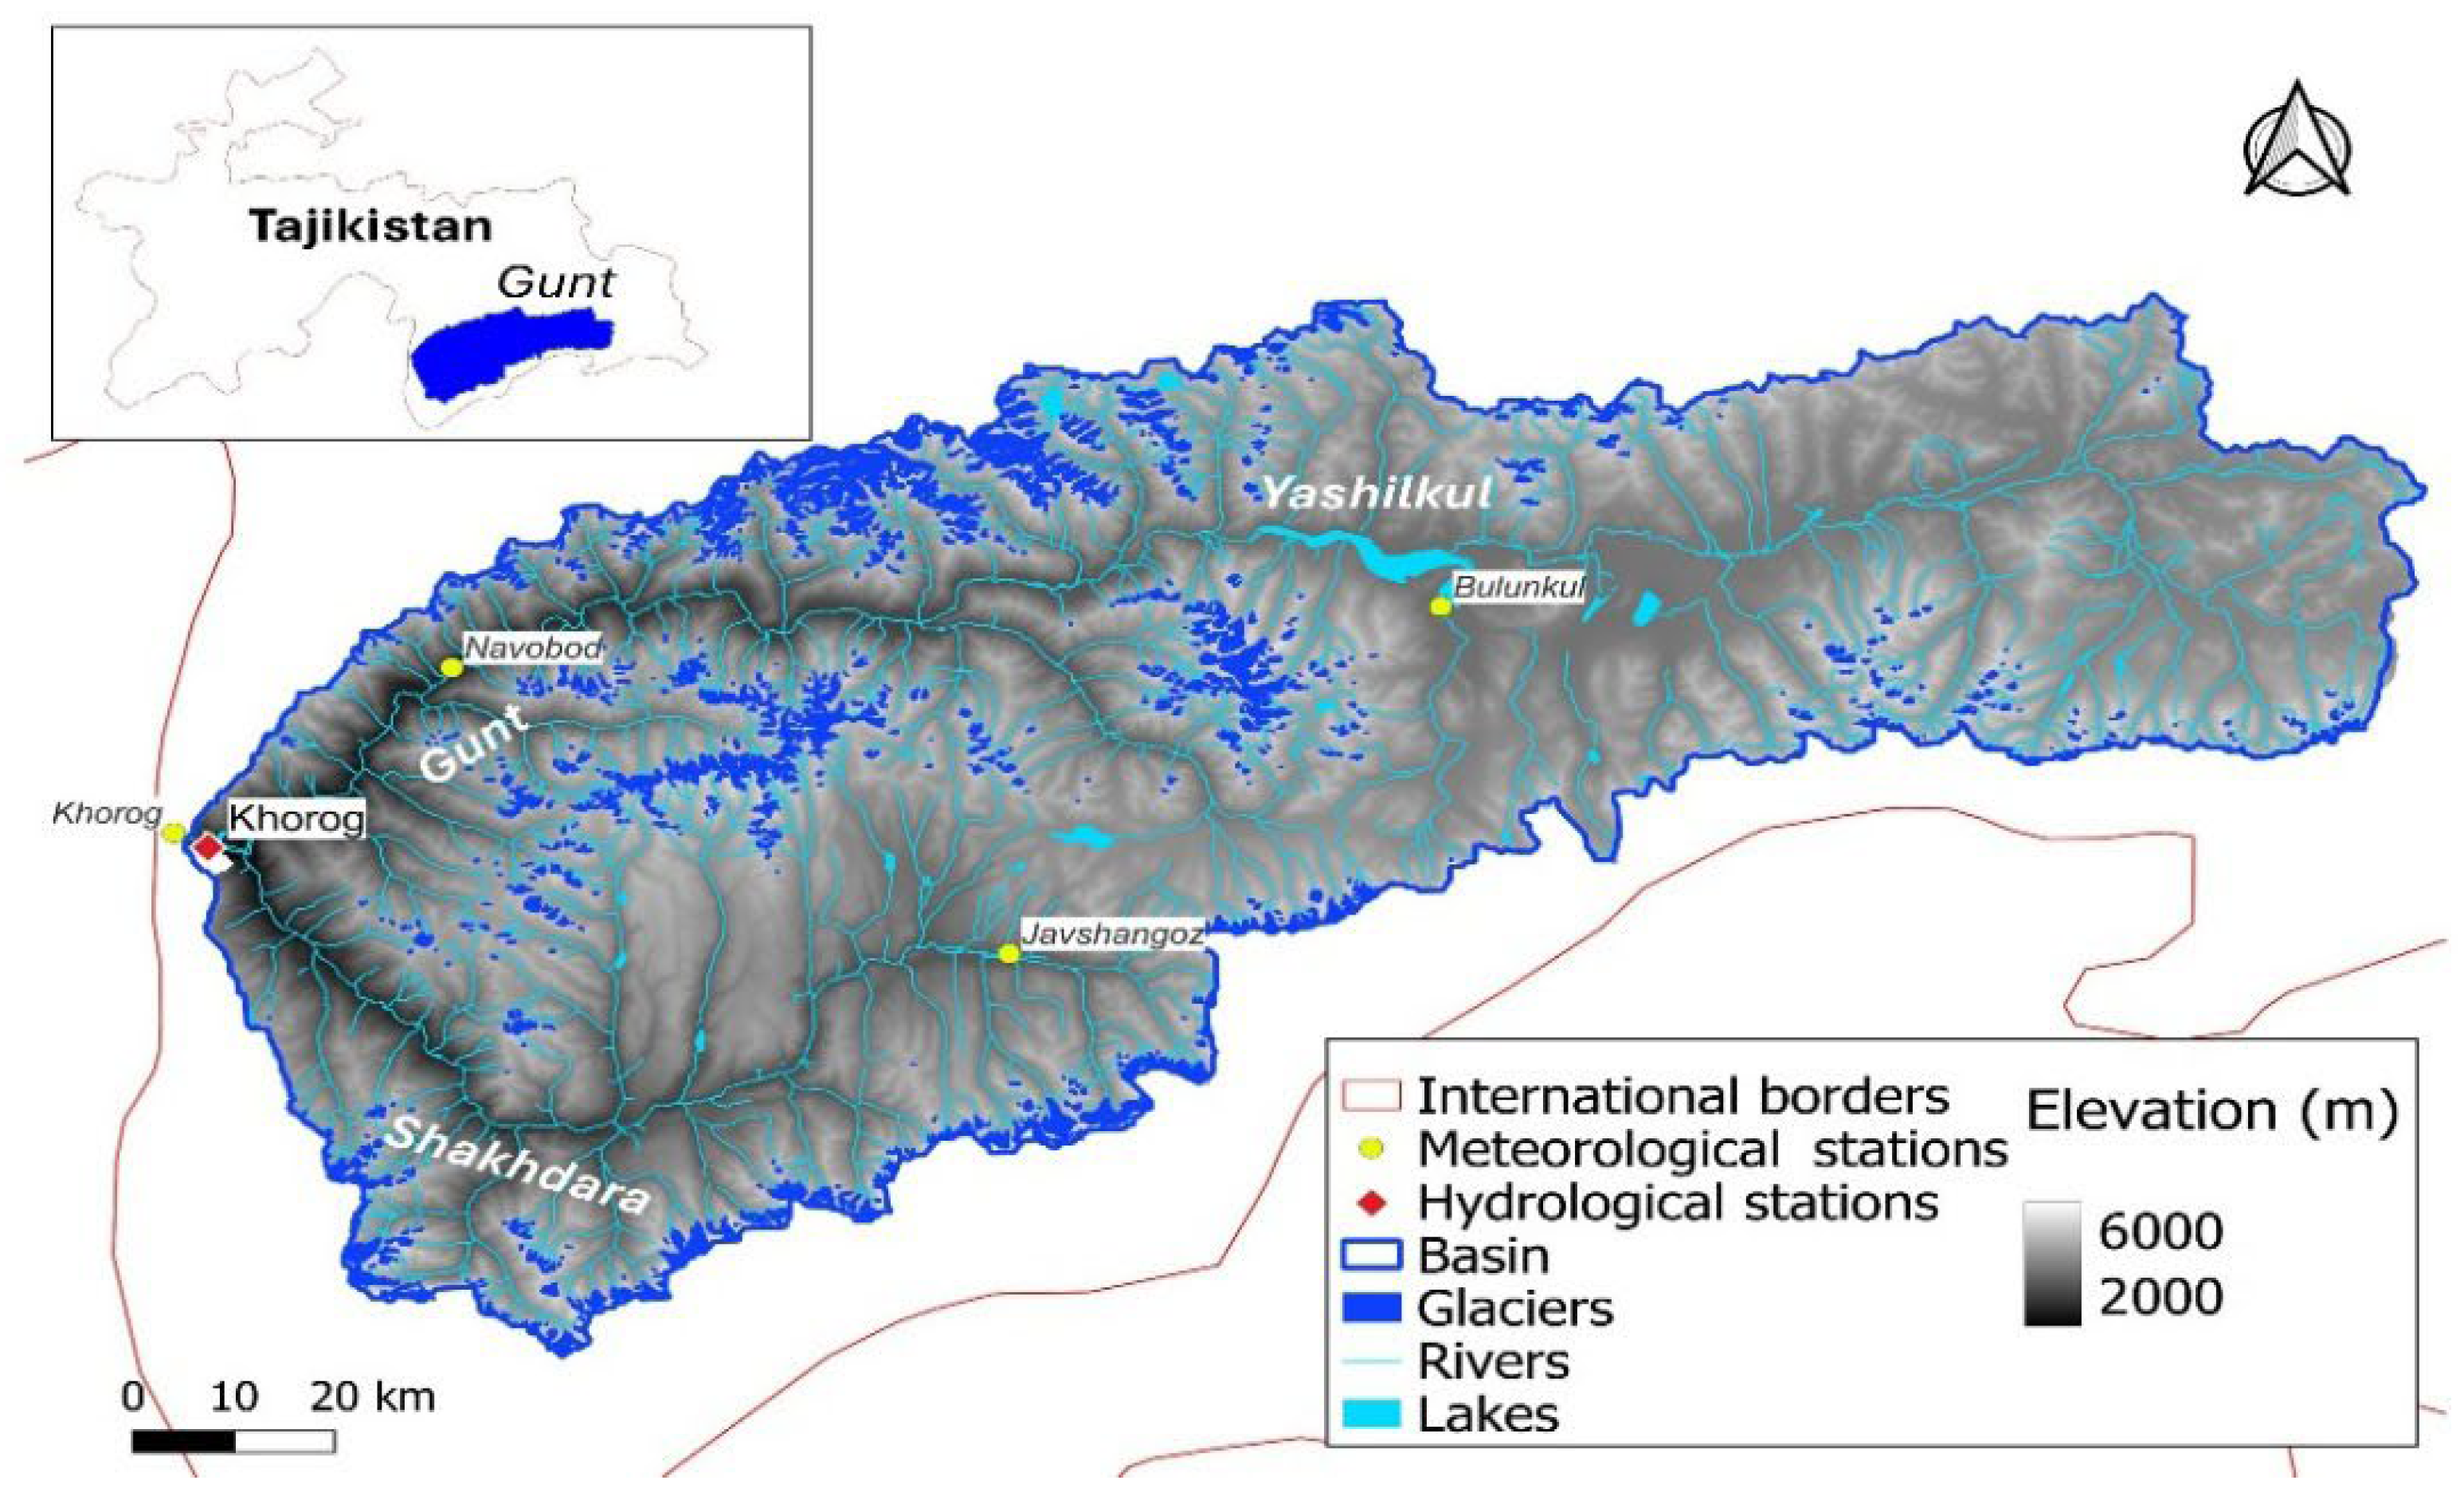
Figure 1. Gunt catchment in Central Pamir, Tajikistan.
Water 17 03302 g001
Figure 2. Elevation (a) and slope gradient (b) maps of Gunt catchment. Category values 1 to 4 for slope and elevation are defined in Table 3.
Water 17 03302 g002
Figure 3. NDVI and SSM maps of Gunt catchment. (a) NDVI in July 2015 and 2024; (b) SSM in July 2015 and 2024. Category values for NDVI and SSM are defined in Table 3.
Water 17 03302 g003
Figure 4. IC maps of the Gunt catchment: ICSSM*C in July 2015 and 2024. Category values for ICSSM*C are defined in Table 4.
Water 17 03302 g004
Figure 5. Spatial distribution of changes in ICSSM*C between July 2015 and 2024 for the Gunt catchment.
Water 17 03302 g005
Figure 6. Bar graphs showing the pixel frequency in zones of iso-IC lines maps (in July 2015 and July 2024).
Water 17 03302 g006
Table 1. Details of the papers that were surveyed.
AuthorsStudy Area and Time PeriodVariable for Temporal AssessmentObjectives
Goldin et al. [23]Navizence Catchment, Switzerland; 40-year periodHydraulic roughness coefficient (Manning’s n) and Digital Terrain Model from 2010 and post-glacial DTM from Slope Local Base Level (SLBL) techniqueAssessment of IC temporal changes related to topographic evolution due to glacier retreat and surface roughness variations
Najafi et al. [24]Taham-Chi watershed, Iran; 2 July 1990, 29 June 2001, and 25 May 2014RUSLE C-factor (NDVI from Landsat)Assessment of spatial and temporal variations in structural sediment connectivity
Singh et al. [25]Wetland (Kaabar Tal), Kosi-Gandak interfan, north Bihar Plains, India; pre- and post-monsoon, 2006RUSLE C-factor (NDVI from Landsat)Applied concept of connectivity response unit to understand the effects of changing land use/land cover on IC in relatively flat terrain for pre- and post-monsoon scenarios
Kalantari et al. [26]Västra Götaland and Värmland, Sweden; 19 August 2014 for Västra Götaland and 21 August 2014 for VärmlandSurface soil moisture (from ASCAT, 25 km resolution)Effects of soil moisture dynamics on sediment connectivity and flood hazards
Mishra et al. [27]Upper Kosi River basin, India; monthly scaleTotal Stream Power (TSP) and Specific Stream Power (SSP) (from SWAT model)Evaluation of monthly sediment connectivity values and stream power analysis of main river and its tributaries together with IC
Llena et al. [28]Aran, Soto, Pocinos and Fiscal sub-catchments, Spain; 1957, 1997, 2010Hydraulic roughness coefficient (Manning’s n) and DEM (LiDAR) in 2010 and DEM using SfM-MVS applied to historical aerial photos in 1977The effects of decadal-scale land use and topographic changes on sediment connectivity in mountain catchments
López-Vicente & Ben-Salem [29]Vero River Catchment, Spain; Sept 2009–Aug 2017Rainfall erosivity factor (rainfall intensity) and cover-management factor (RUSLE C-factor)Development of a new aggregated index based on topography, cover-management factor, rainfall erosivity, residual topography, and soil permeability to assess structural and functional flow and sediment connectivity
López-Vicente et al. [30]Palomar, Rayares#2 and Conejo#5 sub-catchments, Spain; Three periods: before fire (1 July 2011–30 June 2012), 1 yr after fire (1 July 2012–30 June 2013) and 2 yr after fire (1 July 2014–30 June 2015)C-RUSLE, Manning’s n roughness values (overland flow component), Rainfall erosivity (EI30), DEM (LiDAR) 2009 and 2016Evaluation of different connectivity indexes for assessing sediment connectivity in Mediterranean forest ecosystems affected by fires and with subsequent post-fire management strategies within temporal and spatial scales
Liao & He [31]Wei River Basin, China; 1982, 1990, 2000, 2010, 2020RUSLE C-factor (NDVI from Landsat) and land use data from Data Center for Resour. and Environ. Sci. Chinese Academy of SciencesEvacuation of IC temporal changes at watershed scales and analysis of the relationship between changes in vegetation cover or land use type and sediment connectivity
Bertocco et al. [32] Candanedos basin and Ribera or Sil basin, transboundary zone between Spanish province of Zamora and Portuguese district of Bragança; dry period (May–Sept), rainy period (Oct–Dec), and wet period (Jan–Apr) Rainfall erosivity factor (rainfall intensity) and cover-management factor (RUSLE C-factor)Examining the role of lameiros (as discontinuous elements) in the spatial pattern and temporal dynamics of sediment connectivity using the Aggregated Index of Connectivity.
Table 2. Correlations between IC and IC-influencing factors for the Gunt catchment.
ParameterrR2
IC (July 2015)IC (July 2024)IC (July 2015)IC (July 2024)
NDVI0.330.360.110.13
SSM0.880.930.770.86
Slope0.650.760.420.58
Elevation−0.64−0.680.410.46
Table 4. Qualitative and quantitative description of IC and extent in the Gunt catchment.
ICTimeDescription of ClassesClassIC ValueArea (km2)
ICSSM*CJuly 2015Low1−12.00–(−9.16)1883.28
Medium-low2−9.16–(−8.43)6094.77
Medium-high3−8.43–(−7.59)5043.54
High4−7.59–3.38643.80
ICSSM*CJuly 2024Low1−12.06–(−9.22)2048.15
Medium-low2−9.22–(−8.43)5625.79
Medium-high3−8.43–(−7.64)5108.37
High4−7.64–3.36883.08
Table 5. Statistical parameters of IC values in the Gunt catchment.
ICMinMaxMeanWeighted MeanMedianSTDKurtosisSkewness
ICSSM*C
July 2015
−12.003.38−8.55−9.30−10.000.6411.920.69
ICSSM*C
July 2024
−12.063.36−8.56−9.20−8.660.689.600.46
Table 6. Quantitative description of iso-IC lines and the areas between them in the Gunt catchment.
ICTimeZoneIC ValueArea (Km2)
ICSSM*CJuly 20151−12.00–(−8.00)11,296.6
2−8.00–(−4.00)2359.15
3−4.00–(0.00)4.82046
40.00–(3.38)0.113505
ICSSM*CJuly 20241−12.06–(−8.06)10,738.5
2−8.06–(−4.06)2917.17
3−4.06–(−0.06)4.86939
4−0.06–3.360.123654
Disclaimer/Publisher’s Note: The statements, opinions and data contained in all publications are solely those of the individual author(s) and contributor(s) and not of MDPI and/or the editor(s). MDPI and/or the editor(s) disclaim responsibility for any injury to people or property resulting from any ideas, methods, instructions or products referred to in the content.