Systematic Review

Phosphorus Removal in Constructed Treatment Wetlands: A Systematic Review

1
Conservation Evidence, Wildfowl & Wetlands Trust (WWT), Slimbridge, Gloucester GL2 7BT, UK
2
UK Programmes, Wildfowl & Wetlands Trust (WWT), Slimbridge, Gloucester GL2 7BT, UK
3
Natural England, Hafren House, Welshpool Road, Shelton, Shrewsbury SY3 8BB, UK
*
Author to whom correspondence should be addressed.
Water 2025, 17(22), 3301; https://doi.org/10.3390/w17223301
Submission received: 26 August 2025 / Revised: 31 October 2025 / Accepted: 6 November 2025 / Published: 18 November 2025
(This article belongs to the Section Wastewater Treatment and Reuse)

Abstract

Free water surface constructed wetlands are widely used for phosphorus removal from polluted waters, yet their effectiveness varies across wetland types, designs, and environmental conditions, creating uncertainty about their broader application. Building on prior reviews, this study applies stricter screening criteria and includes the literature until 2023 to deliver a more robust and updated global assessment of phosphorus retention performance. From 71 peer-reviewed studies, statistical analysis and models are applied to identify the principal design and loading parameters governing phosphorus retention. Notably, 90% of the wetlands included exhibited net retention, efficiencies ranged from −245% to 99% (median of 43.9%). Wetland area, hydraulic loading rate, hydraulic retention time, and phosphorus loading rate significantly influenced retention. Larger wetlands (>10 ha) and those with low hydraulic loadings (<10 m/year) displayed higher and more consistent efficiencies, whereas high phosphorus loads and short retention times reduced retention and increased variability. Models indicate wetland area and phosphorus loading as key predictors of efficiency, while hydraulic and phosphorus loading are critical in driving retention rates. By integrating an updated global evidence base with robust study selection and modelling, this review demonstrates the effectiveness of well-designed wetlands, supporting their role as valuable tools for water treatment and ecosystem management.

1. Introduction

Free water surface constructed wetlands (FWSCWs) have been used for decades as a nature-based solution to mitigate diffuse and point-source pollution by retaining nutrients and suspended solids, while simultaneously providing benefits such as habitat creation and flood management [1,2]. In this context, FWSCWs are defined as open water, surface flow wetlands where water flows above the substrate and through aquatic vegetation. These systems are engineered to optimise the nutrient retention process by harnessing the physical, chemical, and biological processes found in natural wetlands. However, the effectiveness of FWSCWs in retaining nutrients, particularly phosphorus, remains a topic of ongoing debate due to wide-ranging variations in their treatment efficacy [3,4,5].
Phosphorus retention in wetlands is particularly challenging due to the limited pathways for its permanent retention. Unlike nitrogen, which can be permanently removed through denitrification, phosphorus is retained within sediments and biomass [6,7,8]. Without proper management, these systems may act as temporary sinks for phosphorus, with the potential to release it back into the water column under certain conditions, such as sediment resuspension, redox changes, or hydraulic perturbations [9,10,11]. This creates a challenge wherein constructed wetlands, designed to mitigate phosphorus pollution, could inadvertently contribute to phosphorus export if not carefully designed, monitored, and maintained [12,13].
The uncertainty surrounding phosphorus retention has generated debate about the appropriateness of FWSCWs as a treatment solution. Some studies report high retention [14,15,16], while others highlight large variability, including phosphorus exports due to episodic hydrological events [17,18]. This variability stems from differences in nutrient loading, environmental conditions, wetland design, and management practices [7,19]. Consequently, investigations have emerged regarding the critical drivers of phosphorus retention and release, with many emphasising the role of hydraulic and nutrient loading parameters [16,20], while others highlight the importance of sediment characteristics and biogeochemical mechanisms to produce the process-level understanding necessary to recognise the challenge [9,21,22].
A key limitation in empirical field studies is monitoring quality. Incomplete capture of water fluxes or coarse sampling frequencies can bias load estimates and obscure episodic dynamics, providing unrepresentative retention figures and masking short-term variation in phosphorus fluxes over time [23,24]. Focusing on a single phosphorus fraction can mischaracterise system performance relative to the overall phosphorus pool [2,25]. Such methodological gaps obscure the true dynamics of phosphorus retention, leading to conflicting conclusions about the efficacy of FWSCWs as a phosphorus treatment solution.
Previous reviews have advanced our understanding of phosphorus retention in FWSCWs; however, they differ in scope, inclusion criteria, and analytical approach [1,11]. This review builds on that foundation by 1. using stricter screening and quality criteria, 2. updating the evidence base through to 2023, and 3. applying quantitative synthesis and statistical modelling to resolve how key parameters relate to total phosphorus (TP) retention efficiency and retention rates. By adopting rigorous selection criteria (Figure 1) and focusing the analysis on defined parameters, we aim to provide clearer, practice-relevant relationships for design optimisation and management.
This review seeks to 1. advance understanding of the key factors influencing phosphorus retention and release, thereby contributing to the optimisation of wetland design and management practices, 2. identify knowledge gaps and methodological inconsistencies in the field, providing recommendations for future research, and 3. provide urgently needed clarity to policymakers and practitioners when deciding whether to integrate FWSCWs into broader water management strategies to combat eutrophication and improve water quality in nutrient-impacted catchments.
This review seeks to address the following objectives:
  • Do FWSCWs capture and retain phosphorus for periods of one year or more?
  • What is the range of efficacy of total phosphorus reduction in FWSCWs over periods of one year or more?
  • What factors affect FWSCW efficacy (% retention) and total phosphorus retention rates (g/m2/year)?
  • What recommendations can be drawn on how FWSCWs should be designed and maintained to optimise total phosphorus retention?
  • Identify evidence gaps and methodological inconsistencies in current field studies.
  • Provide clarity for policymakers and practitioners on when and how FWSCWs should be integrated into water management.
To achieve these aims, this study undertakes a global systematic review of the published literature investigating TP retention in FWSCWs, focusing on the variability in TP retention efficiencies and retention rates, the factors driving this variability, and the implications for wetland design and management. Total phosphorus was selected as the focus because it represents the overall phosphorus pool, is a key contributor to water quality degradation and is well represented in the literature.

2. Materials and Methods

2.1. Search Strategy

A systematic review of phosphorus retention in FWSCWs was conducted following guidelines for the Preferred Reporting Items for Systematic Reviews and Meta-Analyses (PRISMA) [26]. An associated PRIMSA checklist (Table S1) and flow chart (Figure S1) are included as Supplementary Materials. Building on the work of Land et al. [1], with modifications to address the specific goals of this review and increase confidence in the findings. The literature search included three key steps. First, studies published before 2014 were identified from Land et al. [1], which were already screened for relevance. Second, studies published between 2014 and 14th September 2023 were retrieved through a Scopus search using the same targeted queries as Land et al. [1] but focusing on just phosphorus:
(TITLE-ABS-KEY (wetland* OR pond OR mire* OR marsh OR fen OR “wet meadow” OR riparian OR “flood plain” OR reed) AND TITLE-ABS-KEY (construct* OR creat* OR restor* OR man*made OR flooding OR inundation) AND TITLE-ABS-KEY(phosph*) AND TITLE-ABS-KEY (retention OR trap* OR denitrification OR uptake OR sedimentation OR remov* OR settling OR accretion OR precipitat* OR *sorption)).
Third, additional studies not identified from the previous searches were located from review articles by Dotro et al. [27] and Ury et al. [11]. This search strategy ensured broad coverage of the peer-reviewed articles available in the literature. This review was not pre-registered in any systematic review registry and no formal protocol was prepared prior to undertaking the review.

2.2. Selection Criteria and Data Extraction

For inclusion in the meta-analysis, studies were screened in three stages against relevance and quality criteria (Figure 1):
  • Title and abstract screening against essential criteria (1–7) to exclude out-of-scope studies or those at high risk of bias.
  • Methods screening to confirm that criteria 1–7 were met. Additionally, studies not available in English were excluded from progressing to the third stage.
  • Full-text review, with scoring against all criteria (1–10). Studies assigned to categories 2–4 were included in the meta-analysis.
This approach was used to limit bias and ensure high confidence in the findings and conclusions of each study with regard to meeting the objectives of this review. To avoid duplication, shared datasets used by multiple studies were removed, with the most complete sources retained. Data were extracted for phosphorus retention metrics (efficiency and rates), wetland characteristics (e.g., wetland area and depth), and contextual factors (e.g., vegetation and bed sediment characteristics) where available (Table S2). Because the screening criteria emphasised monitoring quality and reporting completeness, the dataset is biassed towards regions with greater research capacity. However, this trade-off was accepted to reduce information and selection bias and enable an objective review to be conducted. Study inclusion was limited to English language publications, which may reduce geographic representation and is considered in the interpretation of the results.

2.3. Data Analysis

All analyses were conducted using R version 4.4.1 [28]. To address whether FWSCWs retain phosphorus and the range of their TP retention, summary statistics were calculated for the extracted dataset. Two metrics for phosphorus retention were assessed, TP retention efficiency (% reduction) and TP retention rate (g/m2/year). Their relationships with wetland characteristics, including wetland area, hydraulic loading rate (HLR), hydraulic retention time (HRT), TP inflow concentration, phosphorus loading rate (PLR), and the source of water, were evaluated. Key parameter definitions are as follows: HLR is volumetric inflow divided by wetland area (m/year), HRT is nominal residence time, calculated as wetland volume divided by outflow (hours or days), and PLR is TP mass inflow per unit area (g/m2/year). These characteristics were selected as they were sufficiently reported across studies and repeatedly identified as influential for wetland phosphorus retention. Summary statistics (e.g., mean, median, and range) for both retention metrics were calculated and grouped by the predefined wetland characteristic.
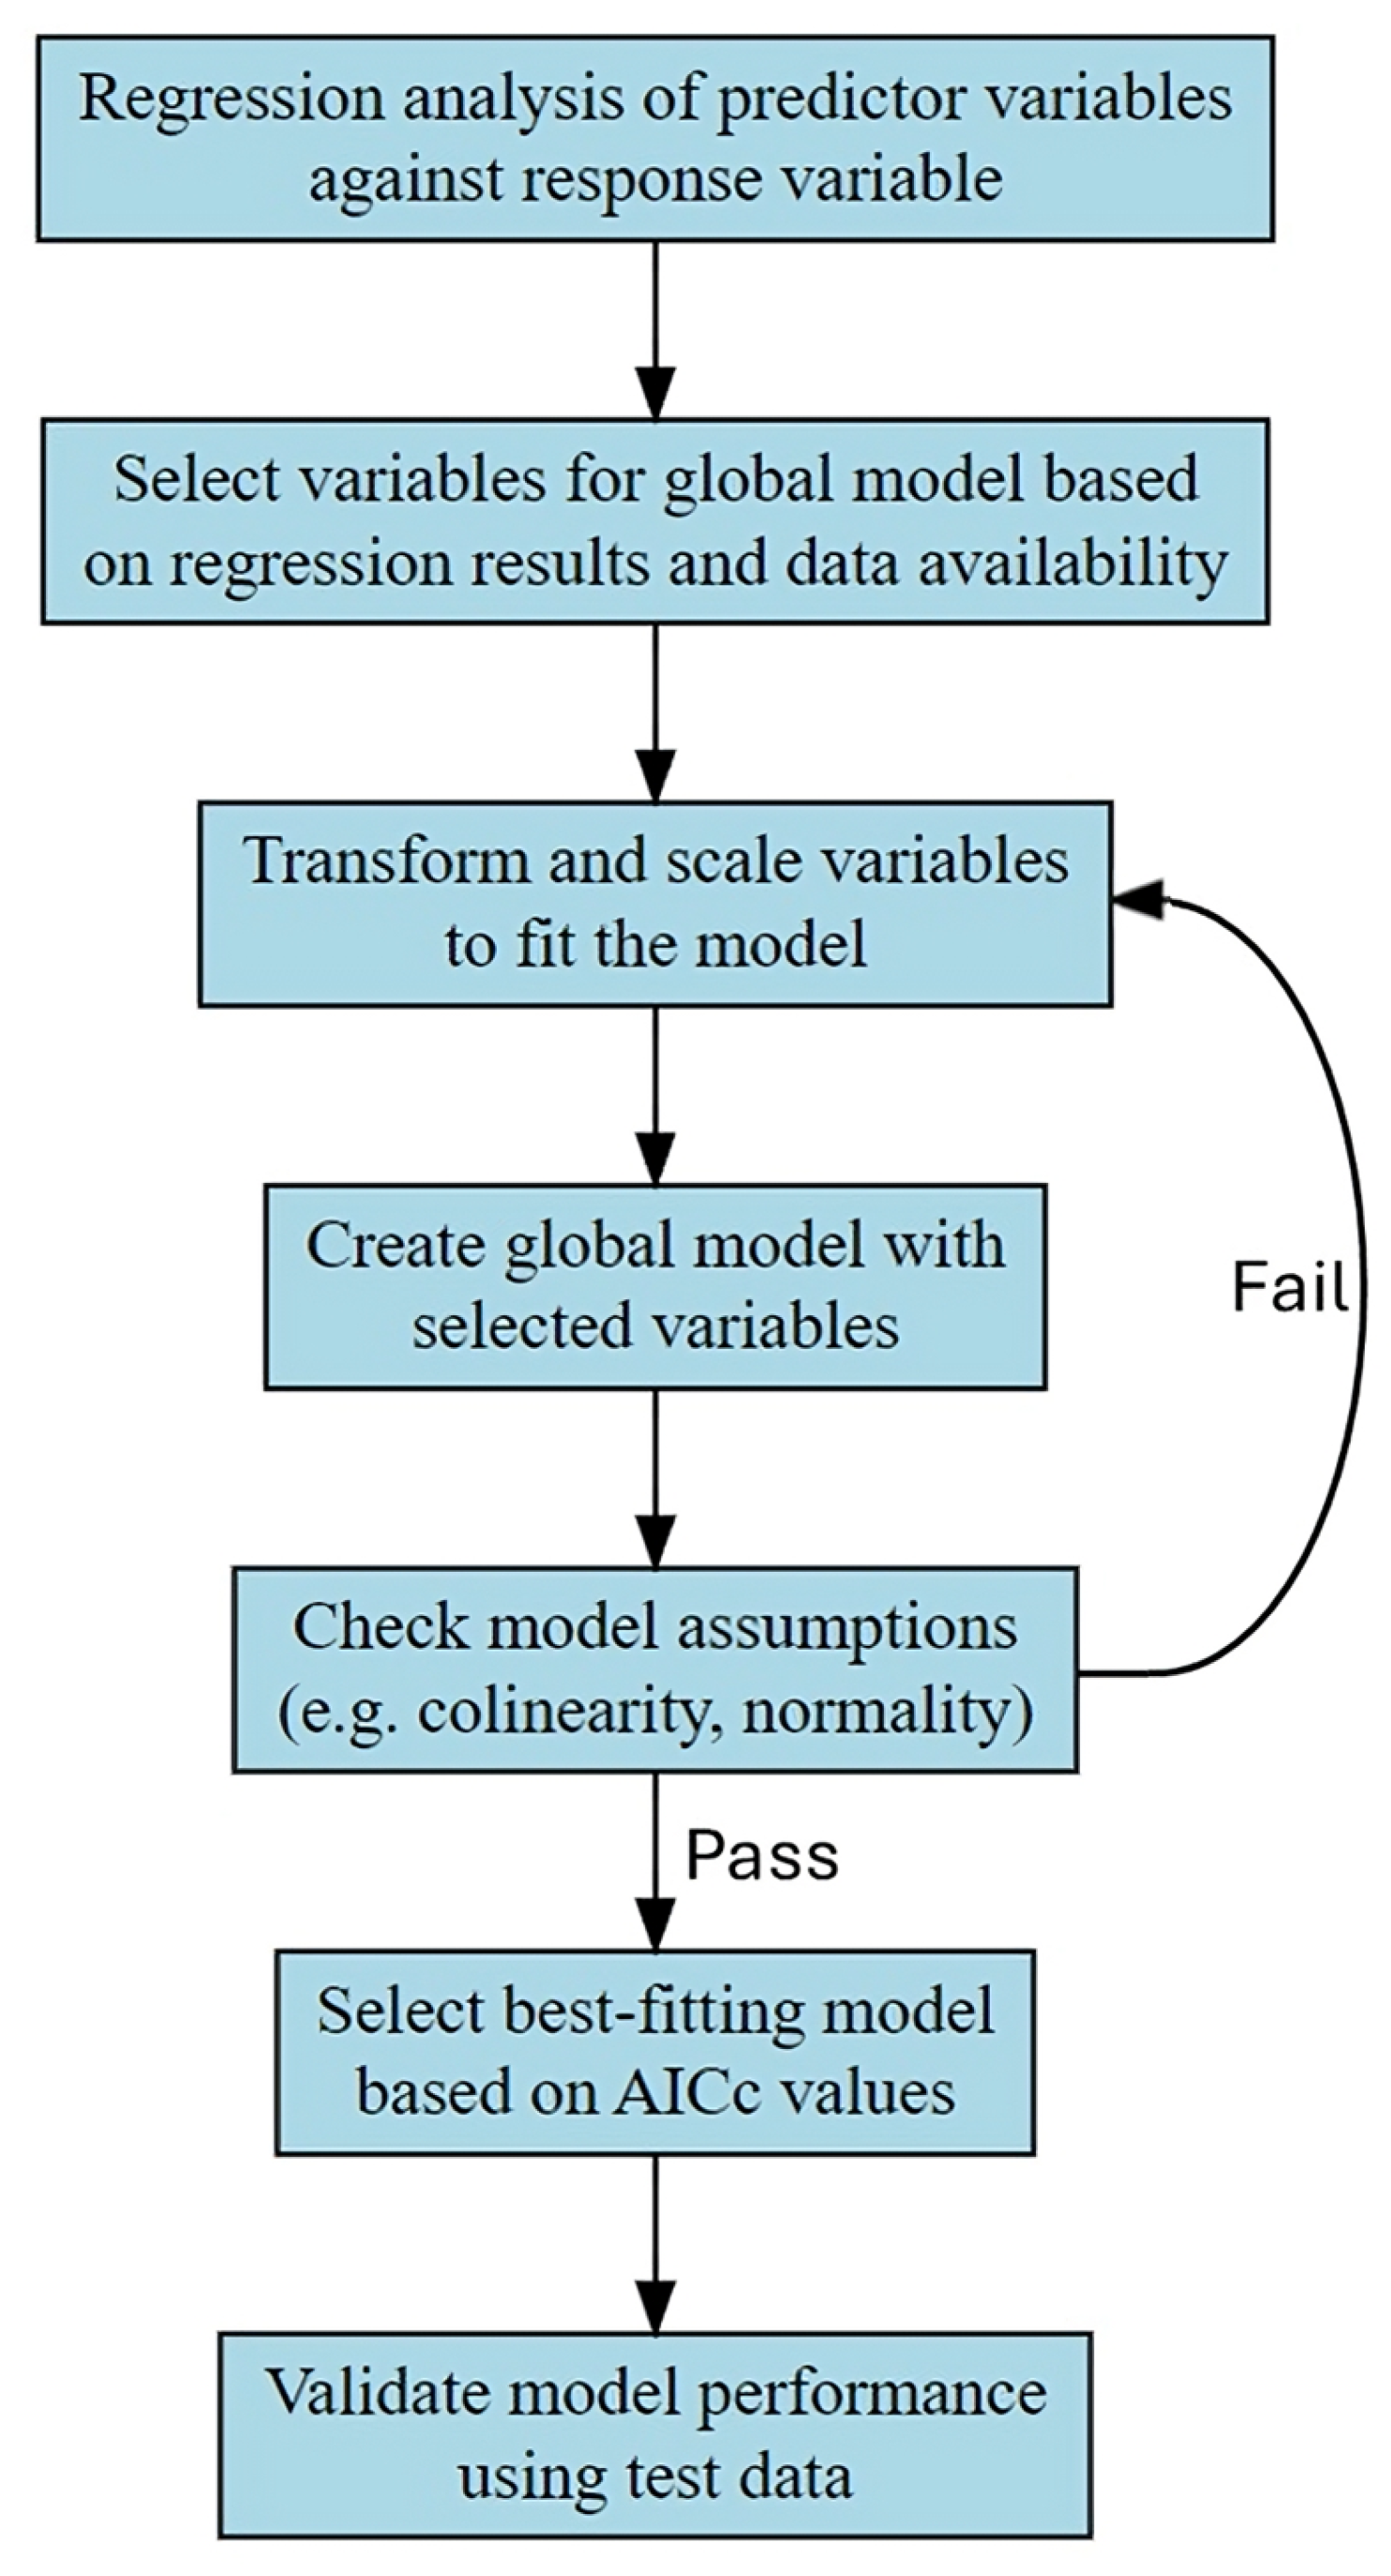
One-way ANOVA tests were performed for each phosphorus retention metric (efficiency and retention rate) to test the significance of wetland characteristics on retention [29,30]. Homogeneity and normality were assessed using Levene’s and Shapiro–Wilk tests, respectively [20,30]. If these assumptions were met, a post hoc Tukey test followed the ANOVA. If homogeneity was violated, Welch’s test with Games–Howell post hoc was used. When normality or both assumptions were violated, the Kruskal–Wallis test with Dunn’s test and Bonferroni correction was applied [20]. To investigate factors impacting the ability of FWSCWs to retain phosphorus and how they are affected, regression analysis using generalised linear mixed effect models was conducted for each response variable: 1. TP retention efficiency and 2. TP retention rate. The workflow as shown by Figure 2 comprised the following:
  • Regression analyses to explore the relationship between response and predictor variables and guide the selection of variables for the global model.
  • Informed selection of model variables balancing data cover and regression outputs (R2, p values).
  • Selected variables were rescaled to ensure they met model assumptions. Wetland area was transformed from m2 to ha, while TP retention efficiency was expressed as proportions.
  • Global models were constructed using the glmmTMB R package (version 1.1.10) [31], with fixed effects (predictors) and a random effect (wetland ID) to account for variability among the grouping factors.
  • Diagnostic checks for collinearity, normality of residuals, and R2 calculations using the performance R package (version 0.12.3) to evaluate whether the global models met the assumptions for analysis, with iterative refinement where needed.
  • Candidate model selection based on second-order Akaike’s Information Criterion (AICc) values using the MuMIn R package (version 1.48.4). The model with the lowest AICc was considered to have performed best, balancing model complexity, and fit to the used dataset.
  • Model validation using a randomly selected test dataset (20% of the overall dataset) to assess its generalisability in predictive performance and ensure outputs were robust and not overfitted to the training data (80% of the total dataset).

3. Results and Discussion

Across the synthesised literature, FWSCWs generally retained TP, though performance varied widely across sites and conditions. Out of the initial 2379 publications, 71 studies remained after the screening. This review reveals a bias toward wetlands in Europe and North America, which together represented 82% of studies, while comparatively fewer studies from other regions passed the quality control checks. This disparity likely reflects differences in research funding, monitoring intensity, and wetland management priorities across regions. Limiting the review to English language publications introduces regional bias, meaning that performance in regions with few studies written in English may be under-represented. This underscores the need for enhanced global monitoring efforts to generate comprehensive datasets representing the diversity of FWSCWs under different environmental conditions. Additionally, several studies used monthly grab sampling that while adequate for annual estimates, can miss short, event-driven pulses and lead to under-representation in TP exports [32]. The section below summarises overall patterns in TP retention efficiency and rate and presents model results linking performance to design and loading parameters.

3.1. Phosphorus Retention Efficiency

3.1.1. Retention Efficiency Statistics and Distribution

Retention efficiency, the proportional difference in phosphorus load at the outflow relative to the inflow, varied significantly across the wetlands studied, ranging from −245% to 99% (mean 40.6%, median 43.9%, and standard deviation 44.1%), and 90% showed net TP removal. These findings are consistent with previous meta-analyses, such as Land et al. [1] and Ury et al. [11], which reported positive retentions in 88 and 84% of wetlands, respectively, while median TP retention efficiencies were 46 and 32%, respectively. The review by Lyu et al. [2] which focused on surface flow wetlands treating domestic waste found a median retention efficiency of 28%. Variations between these studies stem from differences in scope and inclusion criteria. The underlying removal reflects a combination of adsorption, sedimentation, and biological uptake, with TP stored primarily in sediments and vegetation [33,34].
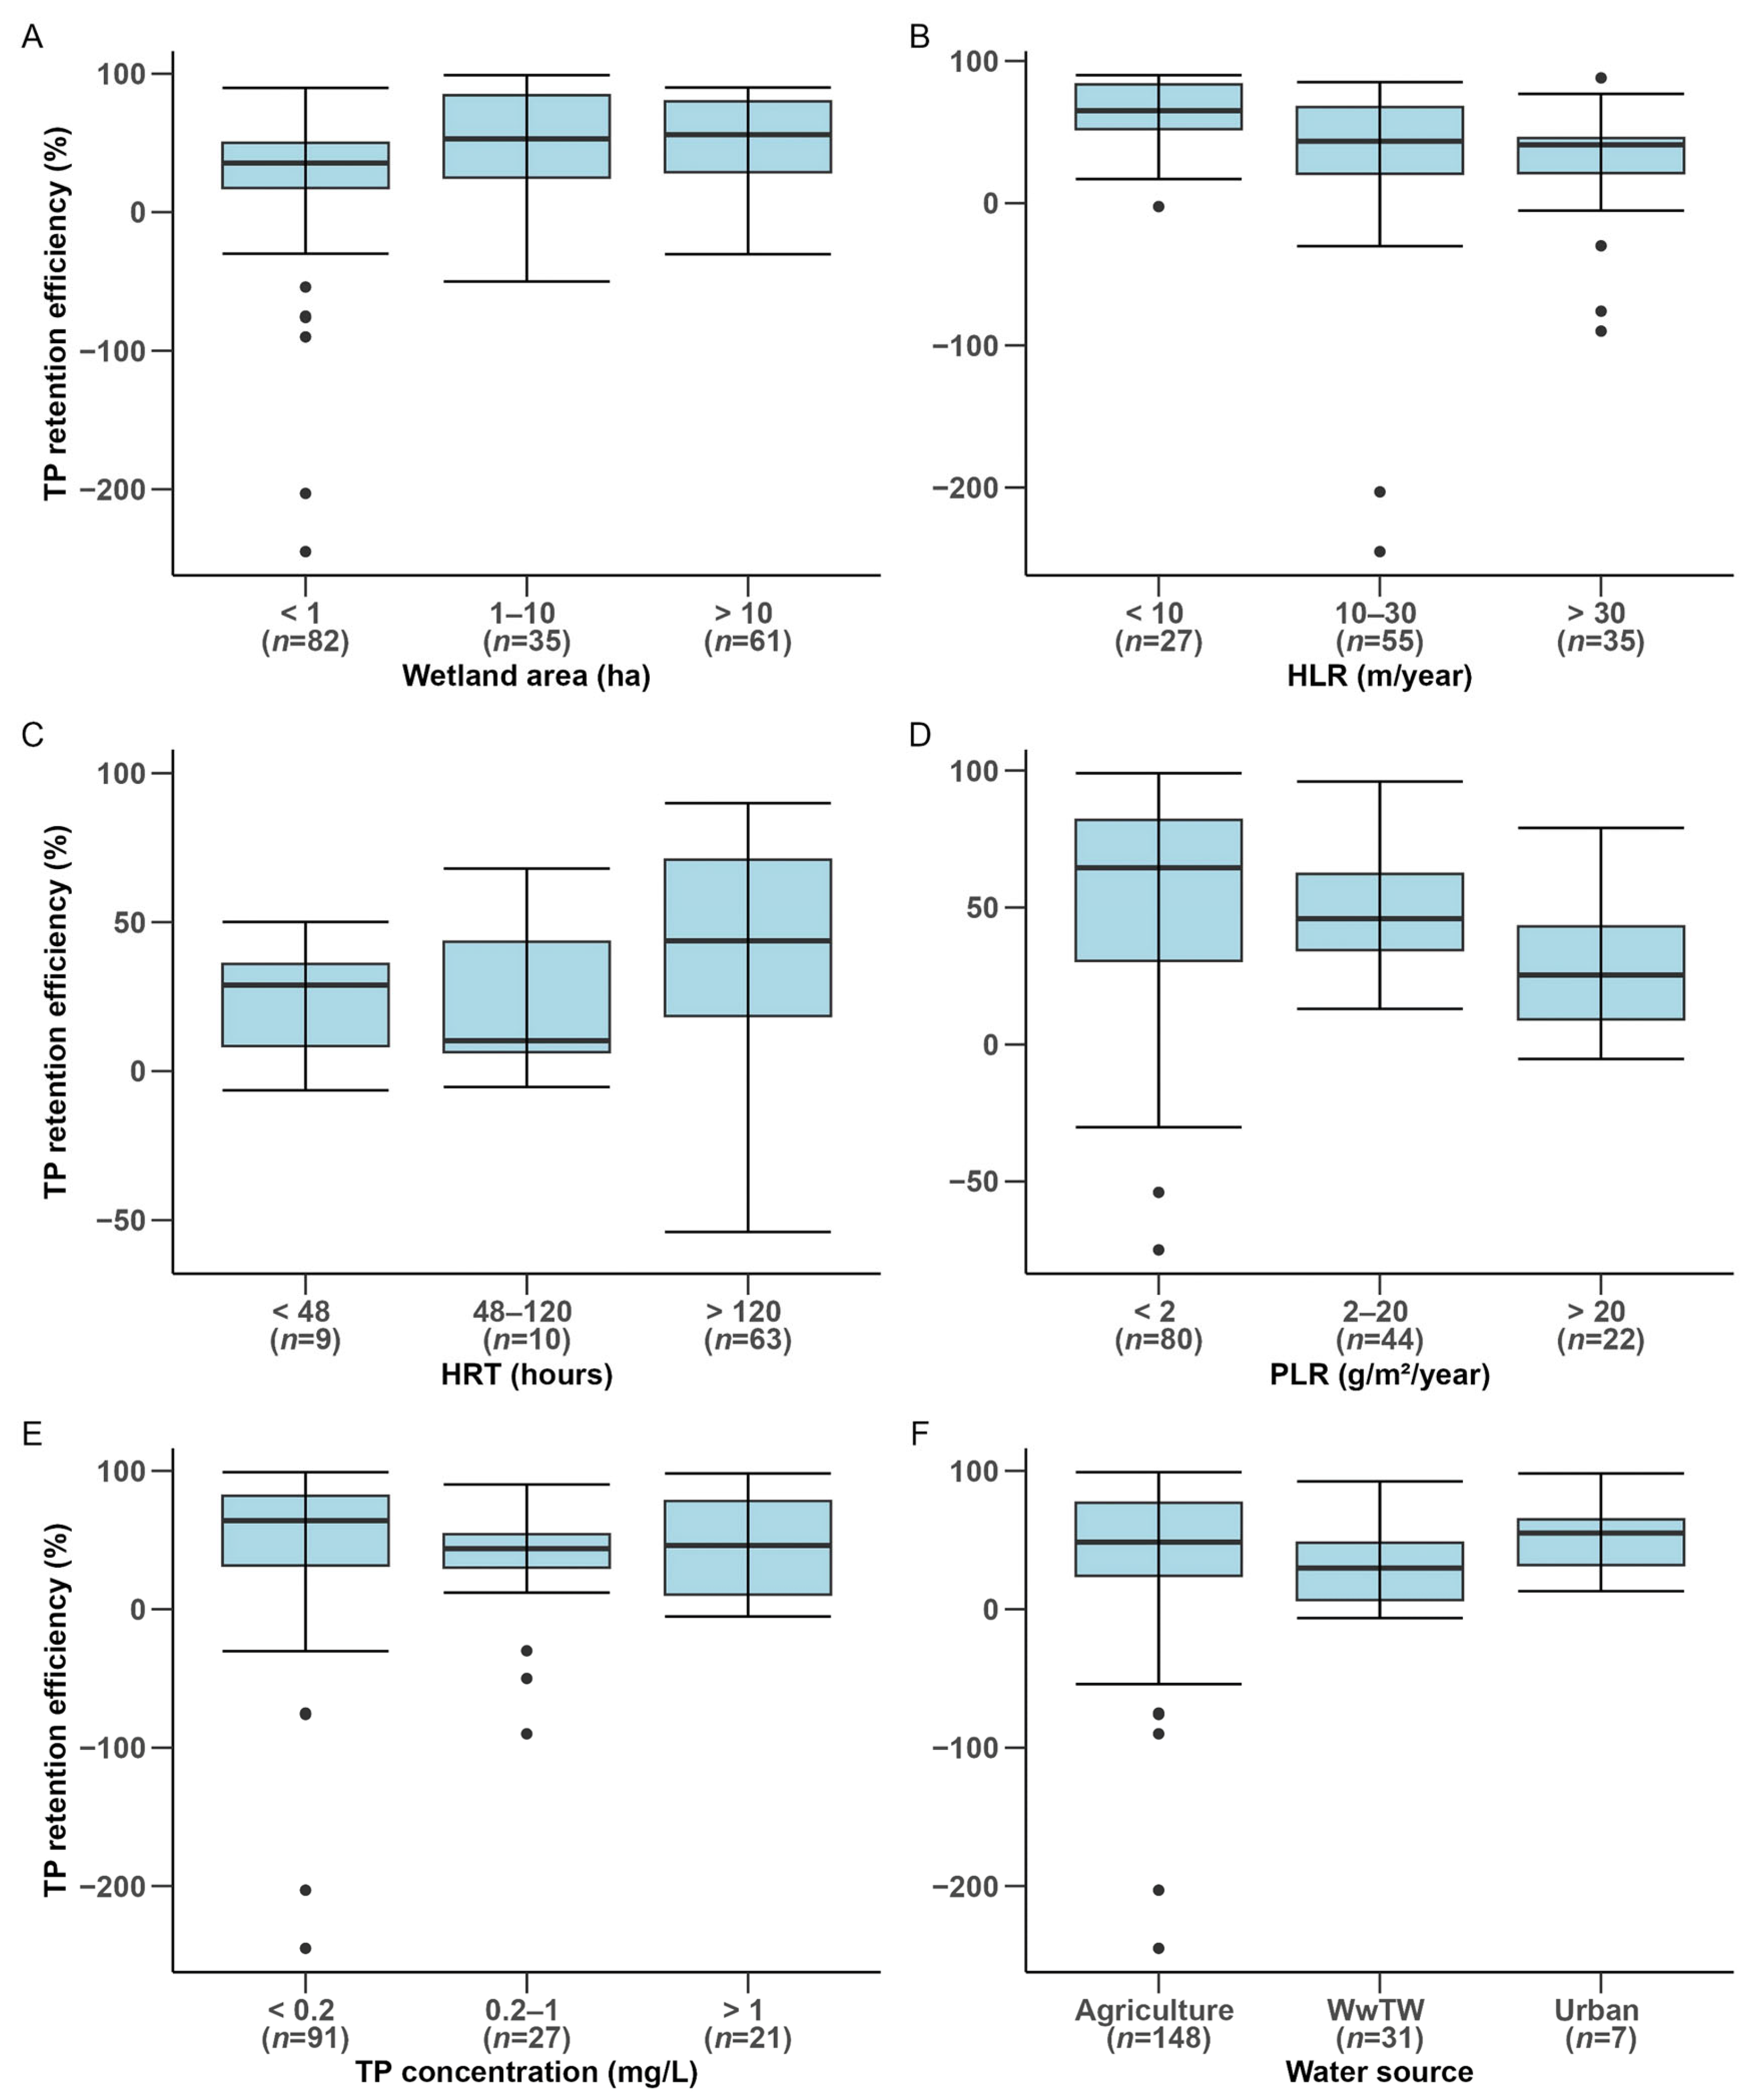
Further insights into retention efficiency variability were revealed when analysed by wetland area, HLR, HRT, PLR, TP inflow concentration, and water source (Figure 3). Efficiencies increased with wetland area, systems smaller than 1 ha had a median of 35% with a wide dispersion, while wetlands larger than 10 ha displayed a median of 56% and narrower ranges (Figure 3A). The greater variability in small wetlands likely reflects higher sensitivity to external perturbations, such as storm-driven runoff, leading to sediment saturation, redox-induced phosphorus desorption under anaerobic conditions or resuspension by physical processes [35,36]. Hydraulics showed the expected inverse relationship between HLR and HRT. Wetlands with low HLRs less than 10 m/year achieved a median of 65% while HLR bands had lower efficiencies (Figure 3B). Correspondingly, wetlands with HRTs above 120 h aligned with higher efficiencies and variability, whereas those under 48 h showed lower efficiencies and variability (Figure 3C). The higher efficiency with higher HRT probably reflects greater contact time between water containing phosphorus and sediments.
Phosphorus loading had a strong controlling effect on retention. Efficiencies declined as the PLR increased, with PLRs greater than 20 g/m2/year displaying the lowest median at 22%, compared to systems with loadings less than 2 g/m2/year which had substantially higher efficiencies, yet greater variance (Figure 3D). A similar pattern was observed for inflow TP, those receiving concentrations less than 0.2 mg/L coincided with higher, although variable efficiencies, while inflows above 1 mg/L shifted distributions downward (Figure 3E). Water source influenced reliability, with wetlands supplied by agricultural waters exhibiting the greatest variability including extreme phosphorus release, while urban and Wastewater Treatment Work (WwTW) sources were more consistent (Figure 3F). This is likely due to agricultural sources being strongly hydrologically driven, meaning phosphorus inputs are more variable in comparison to WwTW sources which are often more consistent over time. Collectively, these patterns are consistent with longer contact times under low HLRs and long HRTs promoting sedimentation, adsorption, and biological uptake [19,37,38], and with load-driven capacity limits reducing efficiencies at higher PLRs and inflow TP [6,39,40].
Table 1 highlights significant differences in phosphorus retention efficiency among wetland area, HLR, HRT, PLR, inflow TP concentration, and water source. Wetlands with low (group 1) and high (group 3) values for all parameters except water source exhibited significant differences in retention efficiency. However, intermediate values (group 2) showed overlapping results, possibly reflecting transitional behaviour. Water source also significantly influenced efficiency, with wetlands receiving agricultural or WwTW inputs showing distinct performances compared to urban-influenced wetlands. These findings underscore the significance of wetland size, hydrology, nutrient loading, and source characteristics in shaping phosphorus retention efficiency.
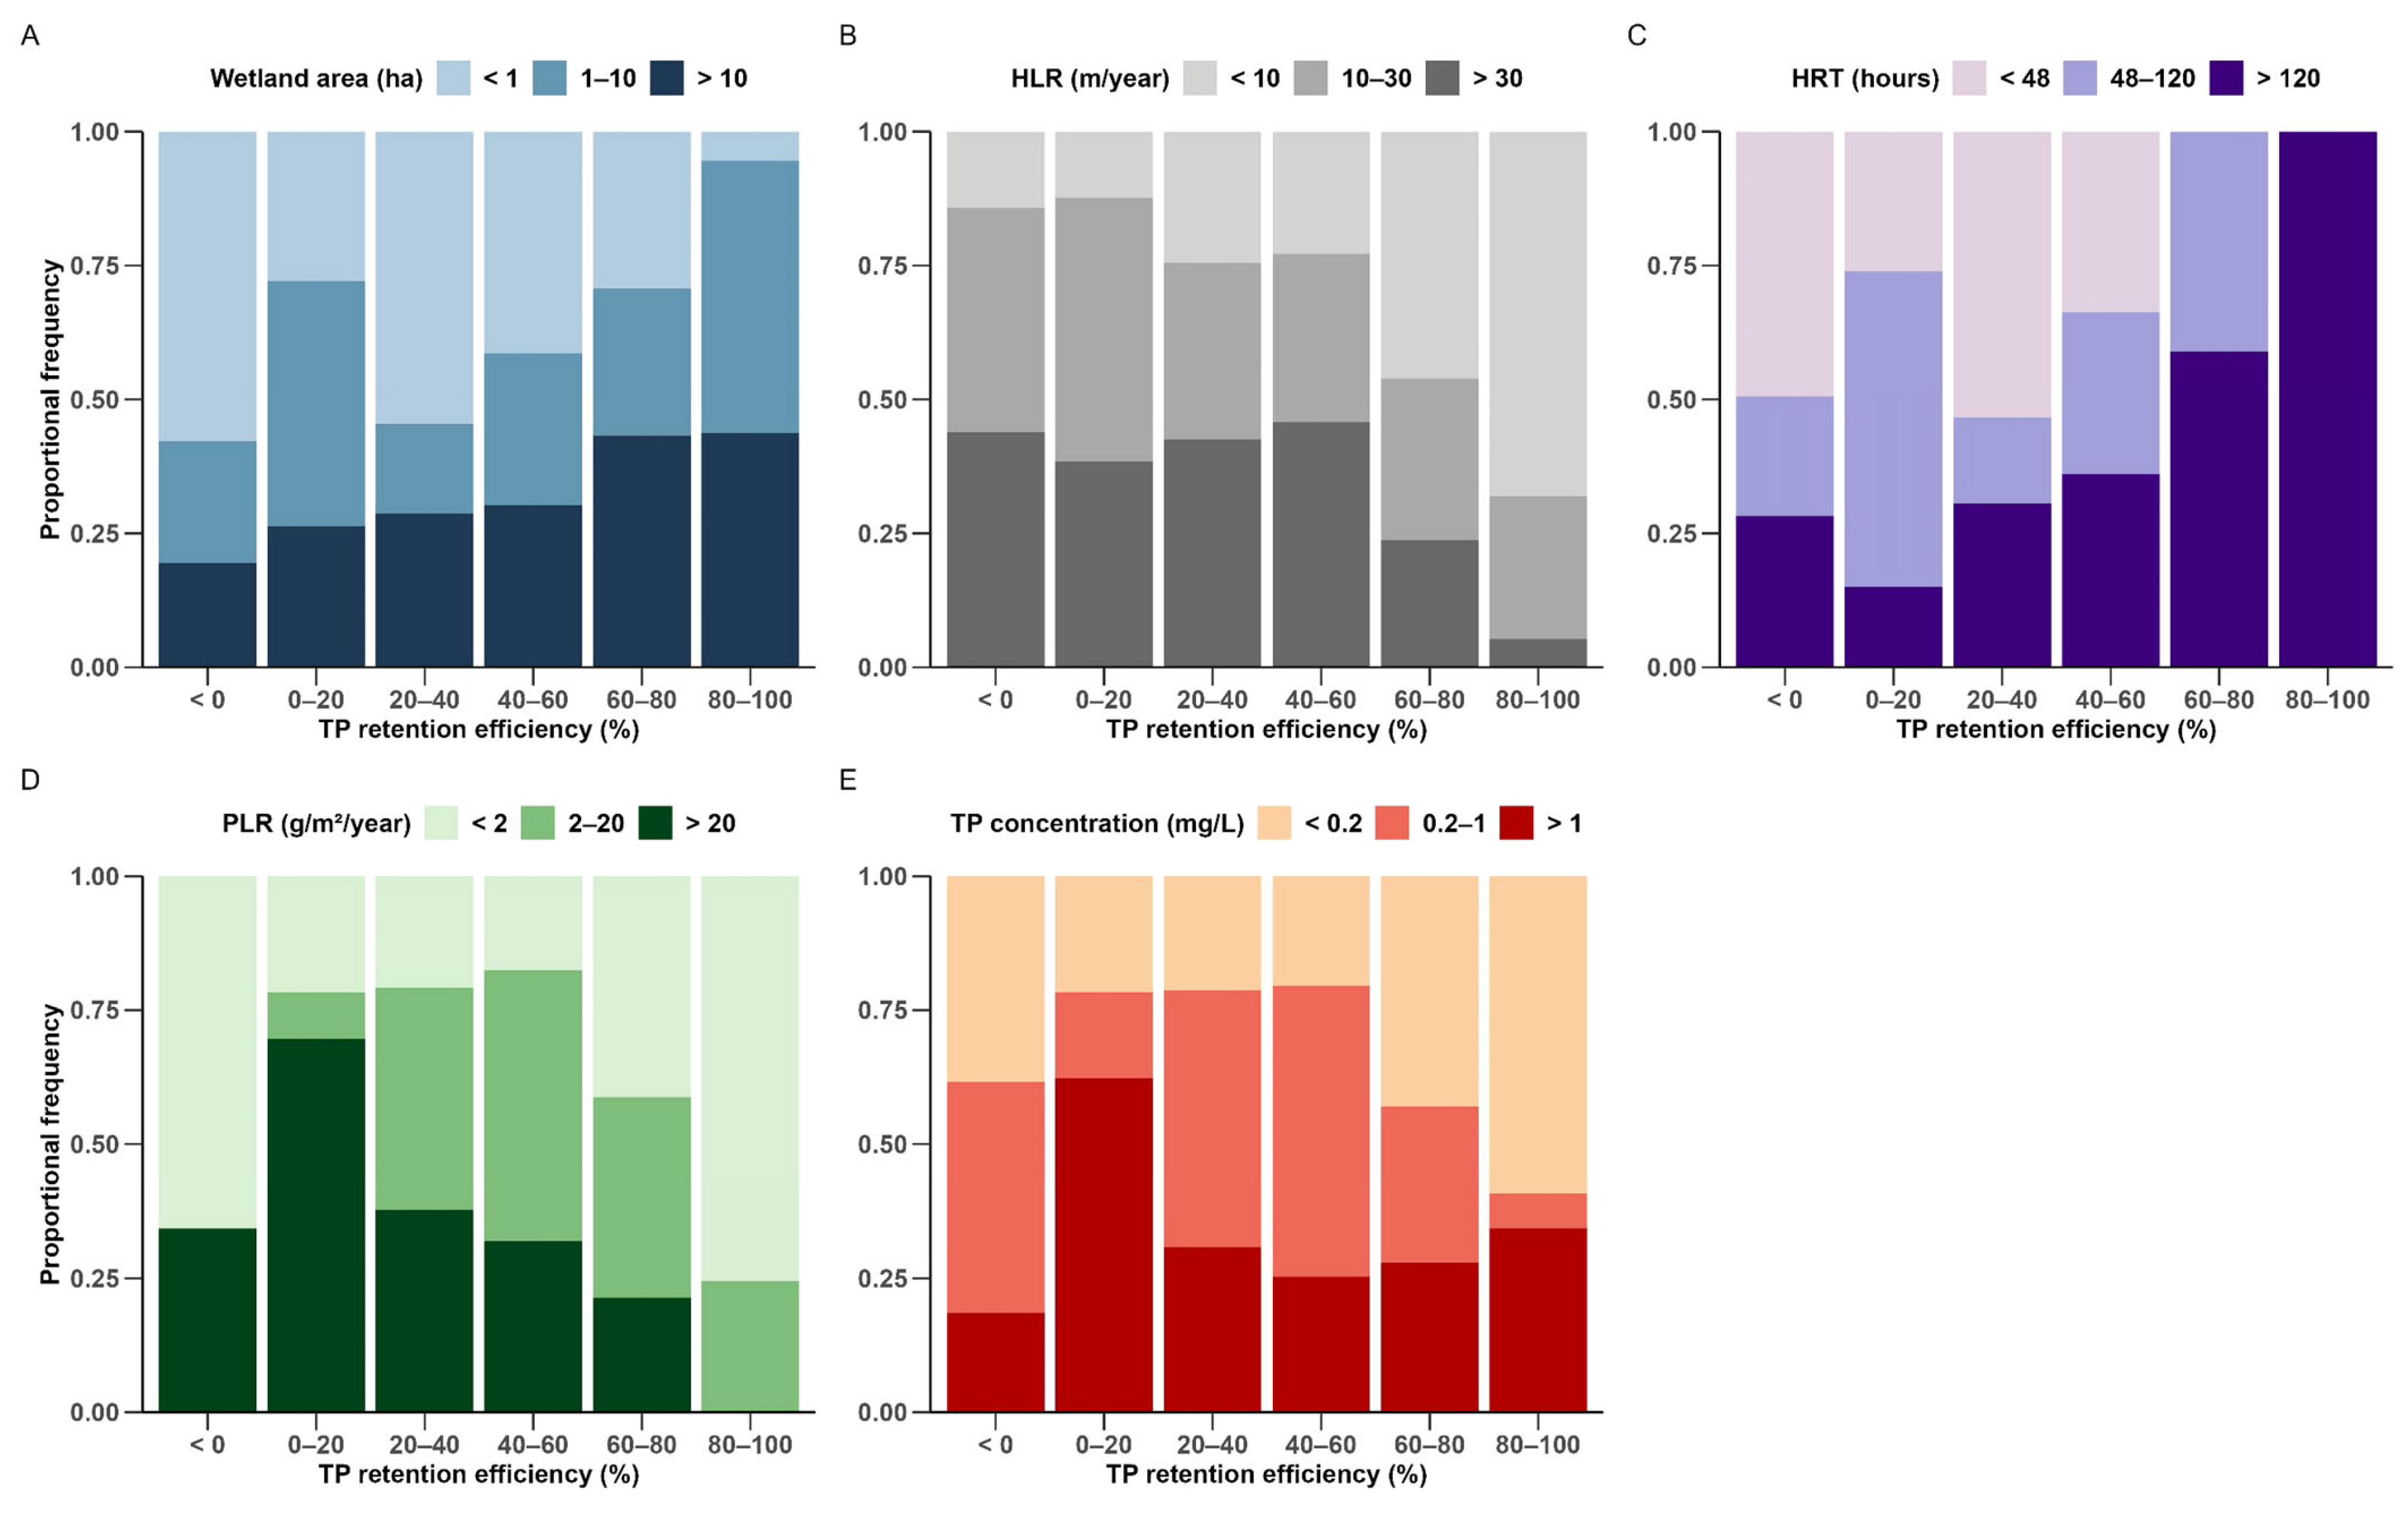
Proportional frequencies across efficiency bands reinforce the previously stated patterns (Figure 4). Wetlands larger than 10 ha are over-represented in the 60 to 100% range, in contrast, those smaller than 1 ha were disproportionally represented at 20 to 40% and negative efficiencies (Figure 4A). Hydraulic loadings less than 10 m/year supported higher efficiencies, notably in the 80 to 100% range, while higher HLRs are under-represented there (Figure 4B). Conversely, HRTs above 120 h align with 60 to 100% bands, while negative efficiencies occur more frequently in systems with HRTs under 48 h (Figure 4C). At PLRs less than 2 g/m2/year, frequencies shift towards the 60 to 100% range, whereas those above 20 g/m2/year accumulate in the 0 to 20% range (Figure 4D). Inflow TP concentration mirrors PLR, with concentrations under 0.2 mg/L aligning with higher efficiency bands (Figure 4E). Together, these distributions indicate that larger area, low HLR, high HRT, and managed phosphorus loading increase the likelihood that wetlands operate in a high-efficiency regime. This is consistent with expectations for retention processes due to sedimentation, adsorption, and biotic uptake [34,36,41,42].
Note that proportional frequencies indicate the likelihood of operating in a high-efficiency regime, rather than simply where the median lies. Bins with long lower tails (e.g., small areas) carry a greater risk of negative retention during events, even when medians look acceptable. Due to potential covariance between the studied parameters, these univariate frequencies should be interpreted alongside multivariate analysis, which account for collinearity. Lastly, parameter sample sizes are uneven across bands, so frequencies reflect both the performance and density of the evidence base. This may alter design choices that shift towards low HLRs, long HRTs, and manageable PLRs where high-efficiency operations would be more probable.

3.1.2. Retention Efficiency Model

Wetland phosphorus retention efficiency was evaluated using a set of candidate models incorporating fixed effects for PLR, HLR, or wetland area, along with a random effect for wetland identity (Table 2). Model selection using AICc values identified the best-fitting model as PLR plus wetland area and wetland ID, and assessed its relative performance compared to alternative candidate models. The best-fitting model represented 70.2% of the total Akaike weights. Fixed effects in the best mode explained 26.2% of the variation in TP retention efficiency. The inclusion of random effects explained 48.2% of the variability, indicating substantial between site heterogeneity captured by wetland ID.
Consistent with the best-fitting model (Table 3, Figure S2), the joint response shows that larger wetlands sustain higher efficiency across a wider PLR range, whereas small wetlands lose efficiency rapidly as the PLR increases. The fact that the HLR did not improve the model suggests that, for the dataset used, efficiency is captured primarily by the PLR and wetland area. Hydraulic loading influences may be partially colinear with these drivers or act through HRT. Although the fixed-effect signal is modest, the direction of effects is consistent with expectations of capacity limits under high PLRs and buffering with a larger area. For wetland designs targeting high retention efficiency, results support managing the PLR (e.g., pretreatment and flow control) and increasing the effective area to buffer episodic loads.

3.2. Phosphorus Retention Rate

3.2.1. Retention Rate Statistics and Distribution

The TP retention rates (g/m2/year) offer contrasting insights compared to efficiency, as the retention rate provides a measure of phosphorus removal relative to wetland size over time. Overall, TP retention rates ranged from −10.6 to 255.5 g/m2/year (mean 8.5, median 1.0, standard deviation 27.7 g/m2/year). The median retention rate is consistent with those found in reviews by Land et al. [1] and Ury et al. [11], which reported median rates of 1.2 and 1.4 g/m2/year, respectively. However, the review by Lyu et al. [2] determined median retentions of 5.1 g/m2/year, which is likely due to the focus on surface flow wetlands treating domestic wastewater, compared to Land et al. [1] and Ury et al. [11], which both included a more diverse range of wetland and water source types.
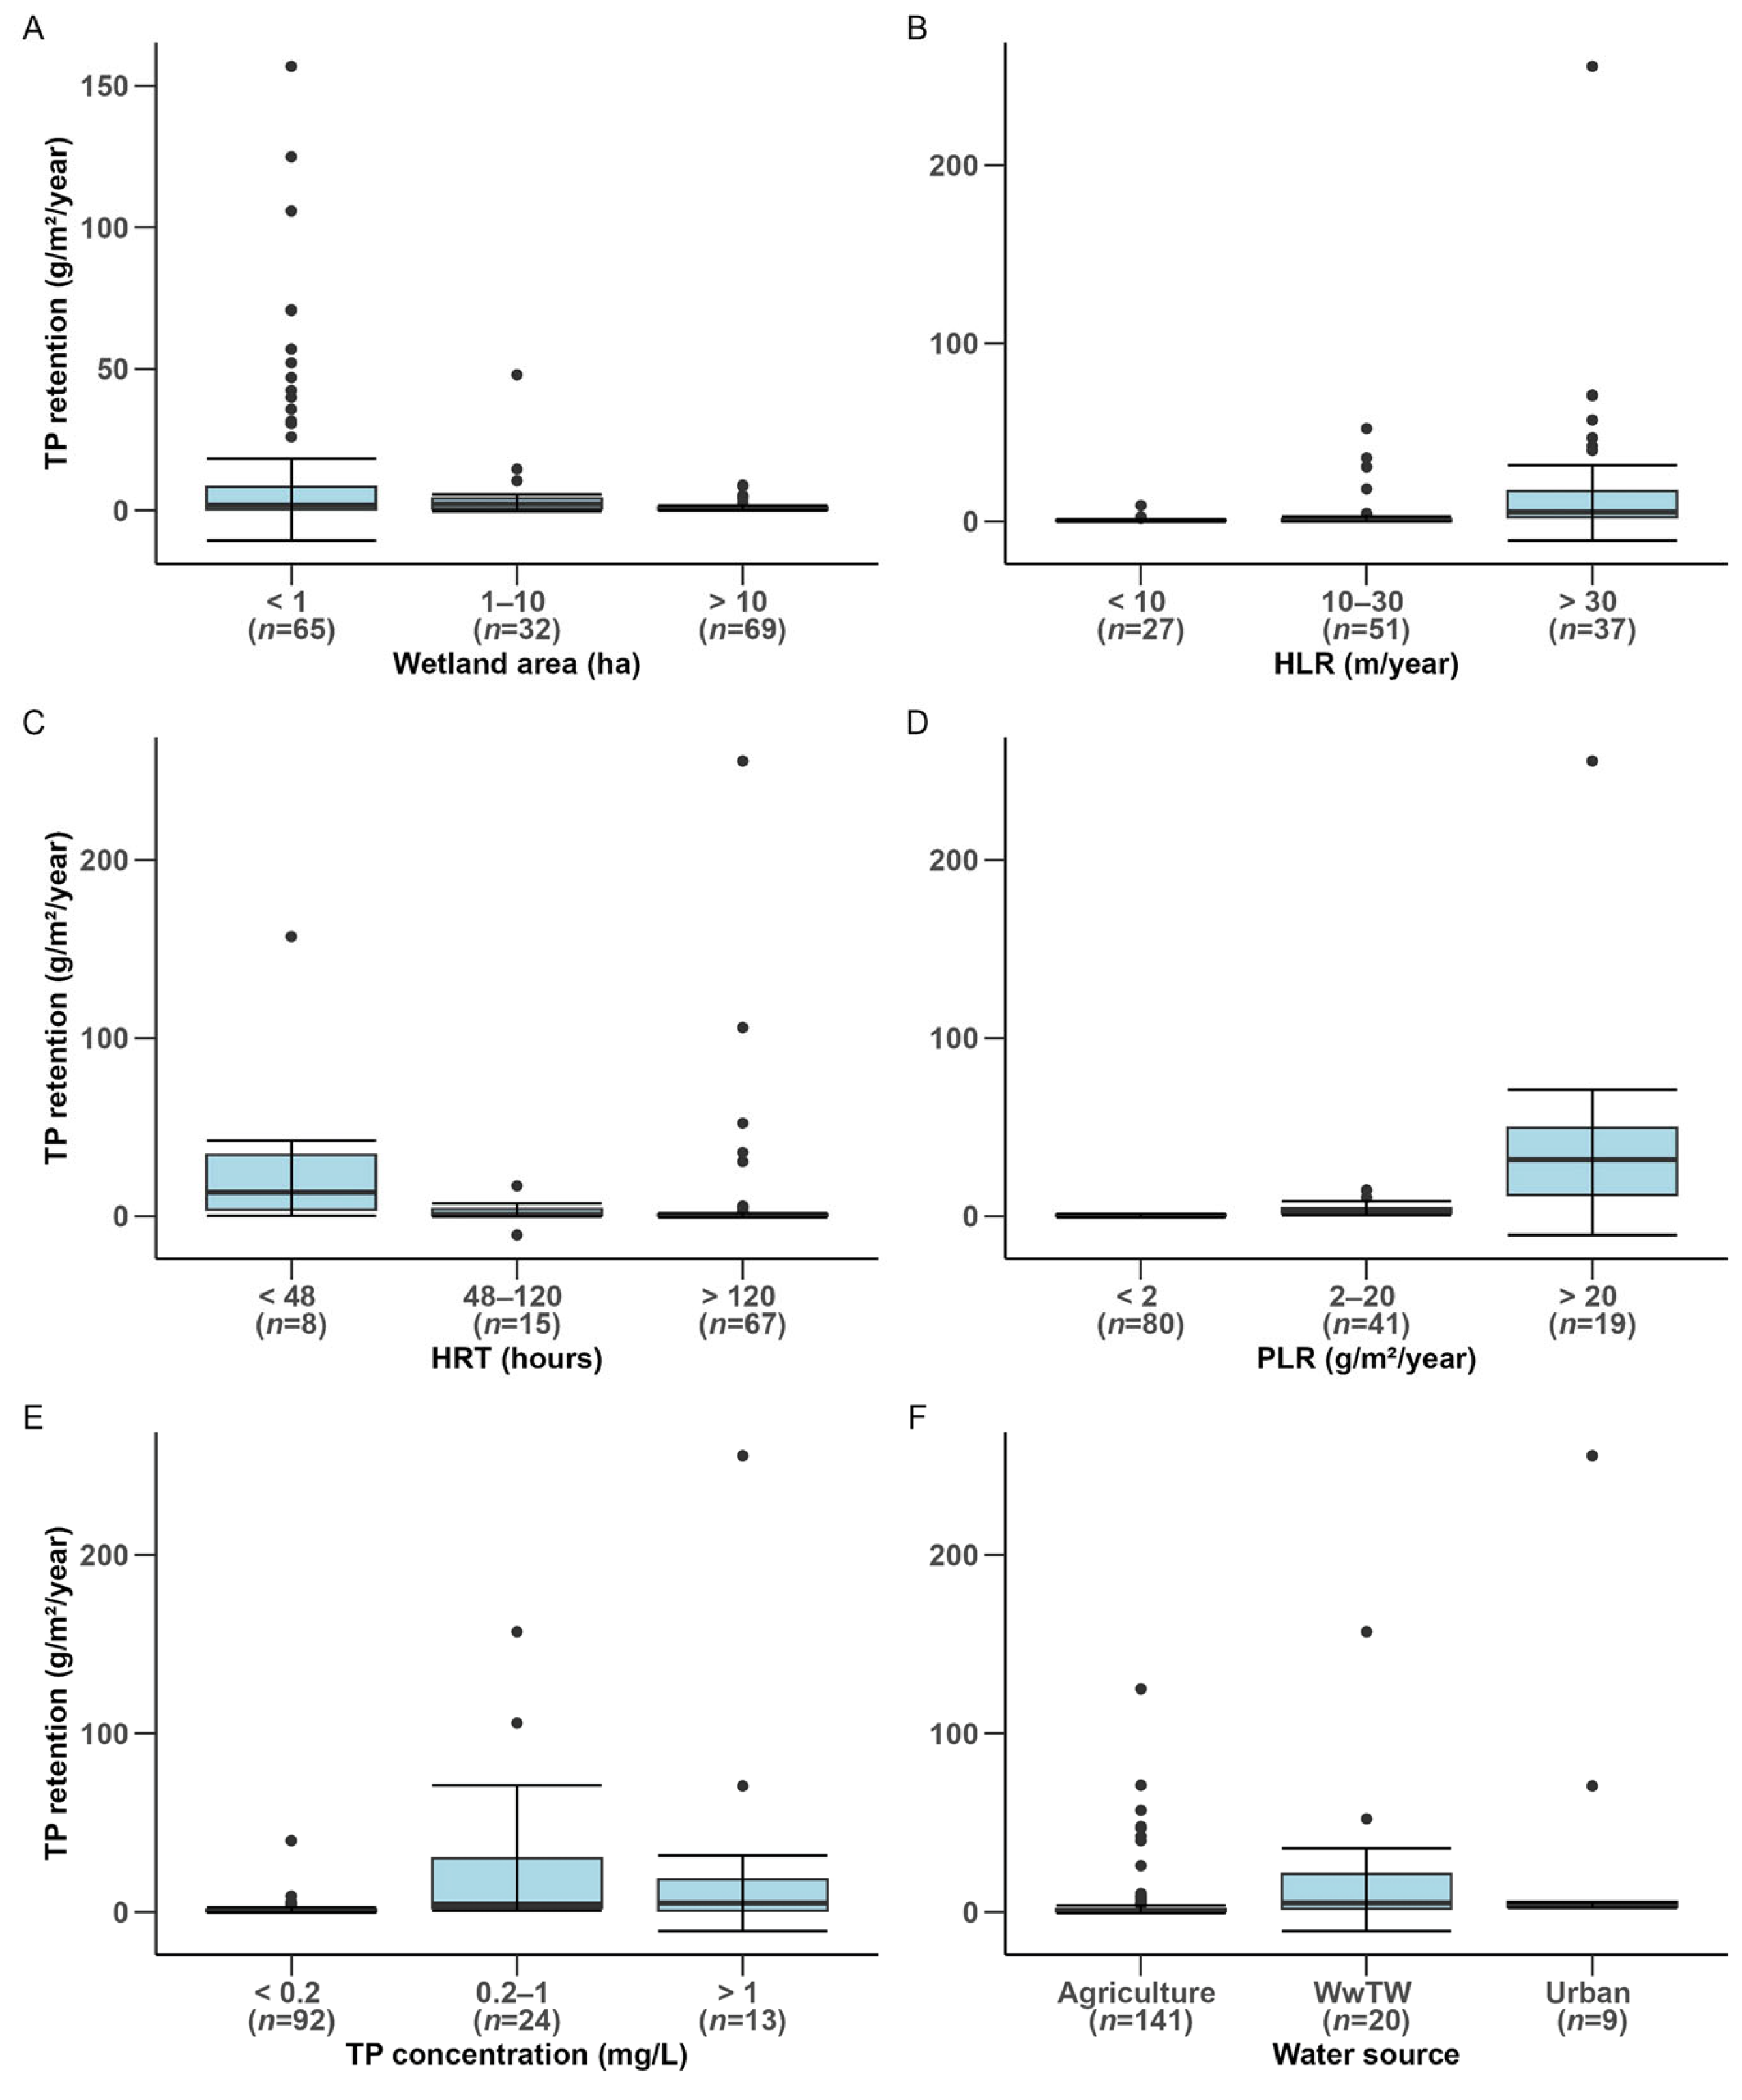
Patterns for the analysed characteristics against TP retention rate (Figure 5) contrast with efficiency. By area, wetlands smaller than 1 ha had the widest range of retention rates, including the most negative outcomes, while larger systems had lower but steadier rates that are consistent with a greater buffering capacity (Figure 5A). Systems under stronger hydraulic pressure tended to remove more TP, as wetlands with HLRs above 30 m/year displayed the highest median rate 5.25 g/m2/year; however, they had extremely large variability compared to lower HLR systems associated with lower and more consistent performance (Figure 5B). The expected HRT and HLR relation persisted as retention rates decreased with increasing HRT (Figure 5C). These rate patterns invert those for efficiency, with a short HRT and high HLR elevating mass removed per unit area but at the cost of stability, which highlights the need to balance hydraulics [43,44].
Phosphorus loading effects were most impactful. This is highlighted by systems receiving PLRs above 20 g/m2/year, yielding the highest median retentions at 31.6 g/m2/year, and having substantial variability (Figure 5D). At a high PLR, elevated supply drives high retention rates, but also pushes systems towards capacity limits, increasing variance and the likelihood of net export. Lower PLR systems resulted in lower median retention and minimal variability, while intermediate PLRs (2 to 20 g/m2/year) displayed a balance between moderate retention and consistency. These findings suggest that high PLRs support greater TP retention rates but increase variability, potentially overwhelming some wetlands by saturating sediments, where adsorption sites become filled, limiting further retention and increasing the risk of phosphorus release [19,36]. Inflow TP concentration behaved similarly, with concentrations above 1 mg/L enhancing rates, while also risking negative retentions (Figure 5E). Agricultural inflows produced the most outliers, likely due to event driven pulses, while WwTW-fed wetlands spanned a wide range of retention rates, reflecting design and influent diversity (Figure 5F). Overall, greater nutrient supply raises mass removal rates at the cost of inconsistent retention rates and export risk. By contrast, larger wetlands and lower hydraulics trade mass removal for greater stability.
Table 4 displays significant differences in phosphorus retention rates (g/m2/year) across various factors influencing wetland retention, identified using Dunn’s test with Bonferroni adjustment following Kruskal–Wallis analysis. Wetland area, HLR, HRT, PLR, inflow TP concentration, and water source all exhibited significant variability in retention rates among their groups. Similarly to the significance tests, for retention efficiency, low (group 1) and high (group 3) values for these variables showed distinct differences. Water source had a particularly distinct impact, with wetlands receiving water from agriculture, WwTW, or urban areas demonstrating statistically different retention rates. These results highlight the critical role of wetland characteristics and nutrient loading in shaping phosphorus retention rates, underscoring the importance of tailored wetland design and management strategies.
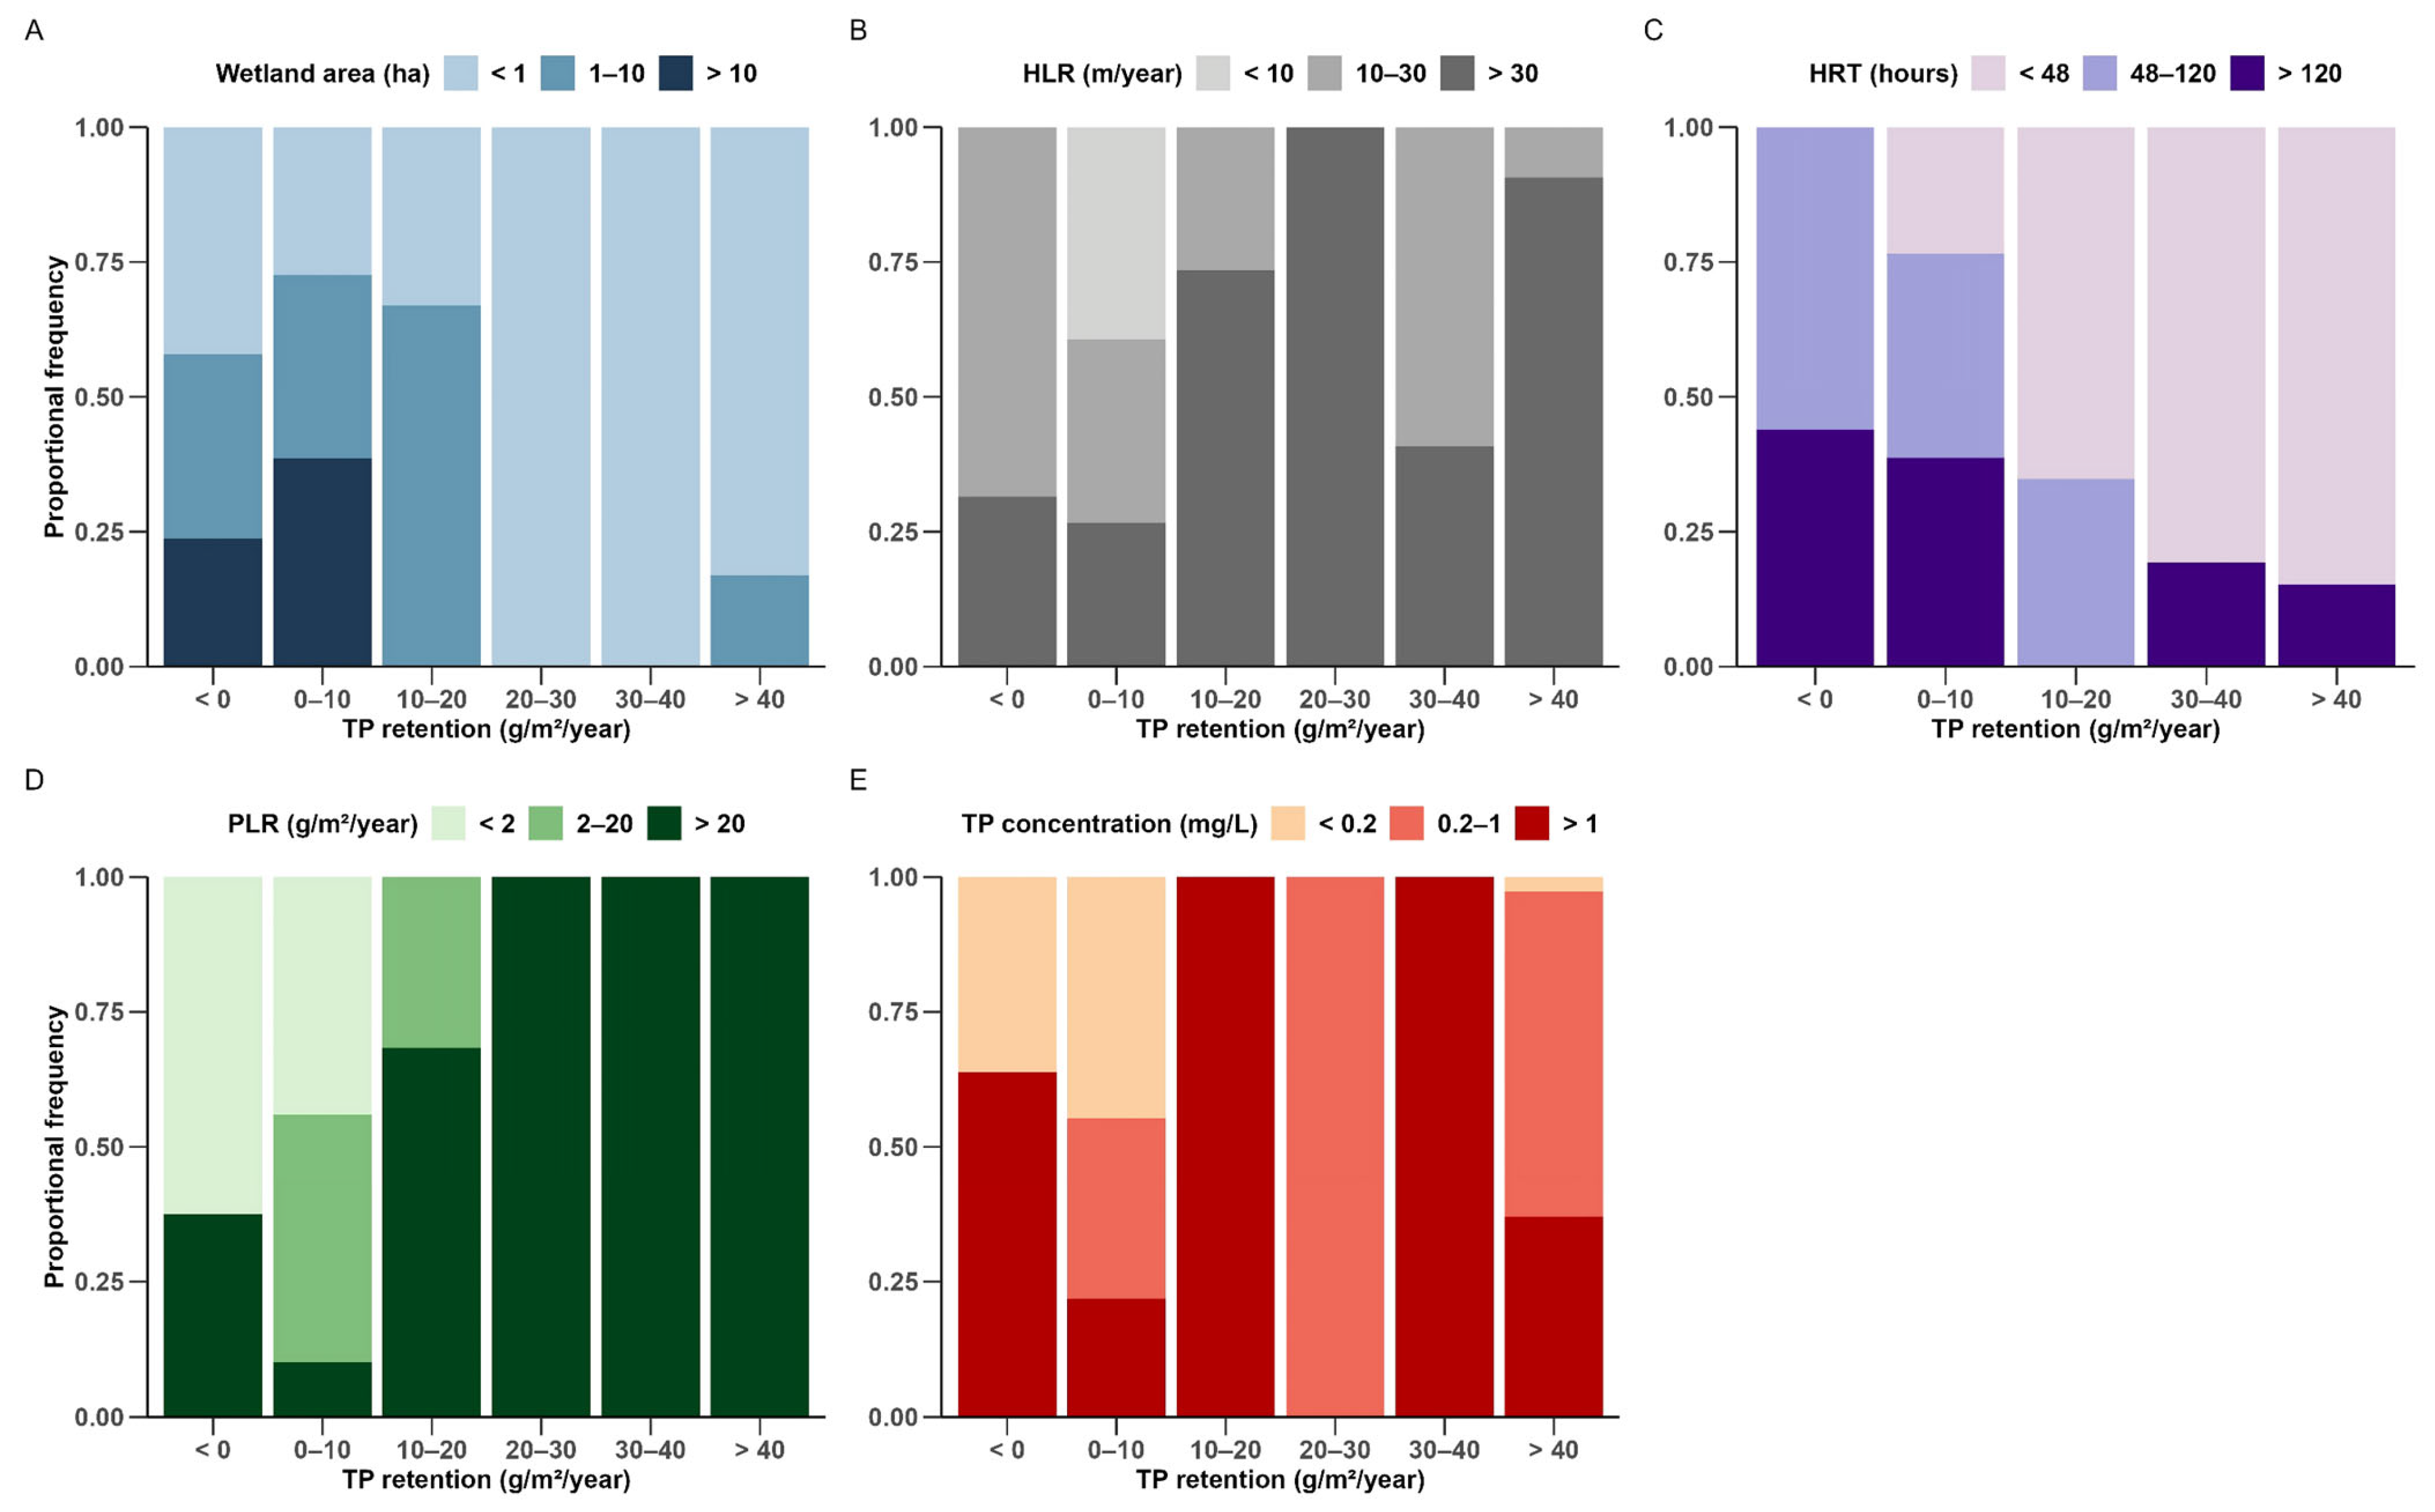
Figure 6 shows how often the evaluated wetlands operate within multiple TP retention rate bands across design and loading parameters. Systems smaller than 1 ha are strongly associated with retention rates exceeding 20 g/m2/year (Figure 6A). In contrast, larger wetlands were linked to lower retention bands. This reflects a scale effect consistent with area normalisation that contrasts with retention efficiency, where larger wetlands tend to perform more reliably. Hydraulic loading rate trends were less distinct with wetlands receiving flows below 10 m/year consistently falling in the 0 to 10 g/m2/year range, while higher HLRs more often appear in systems with retentions above 10 g/m2/year (Figure 6B). Retention times lower than 48 h were increasingly associated with higher retention rates, with longer HRTs shifting frequencies towards lower rates (Figure 6C). Phosphorus loading displays a strong gradient, with higher PLRs pushing frequencies into higher retention bands (Figure 6D). Conversely, inflow TP concentrations were more mixed as systems with less than 0.2 mg/L did not exceed 10 g/m2/year, and those exposed to higher concentrations exhibited highly variable retention rates, suggesting hydraulic co-control influencing retention outcomes (Figure 6E).
Understanding these efficiency-rate trade-offs is essential for optimising FWSCW design and management [45,46]. To maximise annual mass removal, operating towards higher HLRs, lower HRTs, and a manageably high PLR may increase the likelihood of high retention rates [1,47]. To prioritise a stable, high-efficiency system, designs should focus on lower HLRs and high HRTs. Event-driven conditions can still promote phosphorus export through sediment saturation, redox-induced desorption, and resuspension; however, suitable design or practices such as sediment management can help maintain performance [34,35,48].

3.2.2. Retention Rate Model

Similarly to the selection process for the efficiency model, the candidate models for the phosphorus retention rate included the same potential fixed effects (HLR, PLR, and wetland area) and random effect (Wetland identity) (Table 5). Model selection was also based on using the AICc to determine the best-fitting model. Comparisons among candidate models revealed that the TP retention rate in wetlands was best explained by HLR and PLR. This model narrowly outperformed another that also included wetland areas. The best-fitting model accounted for 71.2% of the total Akaike weights, with fixed effects explaining 48.6% and including the random effect yielded 95.5%. While one competing model had an AICc value less than 6.00, its higher evidence ratio and lower Akaike weight indicated weaker support.
The best-fitting model demonstrates a positive effect of HLR and PLR on TP retention rates (Table 6, Figure S3). Practically, wetlands with low HLRs and PLRs may struggle to achieve significant retention rates due to limited phosphorus availability for removal. Conversely, the highest retention rates were observed under high HLRs and PLRs, as increased flow rates enhance the availability of phosphorus into wetlands to stimulate removal processes [1,19,49]. Therefore, wetlands aiming to remove high quantities of phosphorus should prioritise features that accommodate elevated HLRs and PLRs, although these enhanced loading rates would negatively impact retention efficiency. The model’s parsimony leaves room for refinement as more high-quality datasets become available.

3.3. Synthesis and Implications

The efficacy of FWSCWs in retaining TP reflects interacting hydraulic, loading, geomorphic, chemical, and biological factors [41,50,51]. The variables influencing retention efficiency and retention rate show that no single factor dominates across contexts. Instead, trade-offs between efficiency and areal removal rate emerge as conditions shift. Below, the main drivers and their management implications are synthesised. Additionally, monitoring data gaps that currently limit predictive modelling and a comprehensive understanding of wetland design tailored towards phosphorus removal are highlighted (Table 7).
Wetland size emerged as a primary determinant of TP retention performance. Larger wetlands generally demonstrated greater stability and steadier rates by distributing loads, dampening short-term hydrological pulses, and lengthening contact time [38,52]. This is consistent with the positive effect in the efficiency model and expected removal processes (i.e., more surface area and volume for sedimentation, adsorption, and uptake) [3,53]. Lower HLRs and thus longer HRTs favour higher efficiency via improved settling and biotic uptake [37]. Conversely, higher HLRs elevate the mass removal rate but increase variance and export risk. Local conditions can regulate this, for example, aeration at high HLRs mitigates redox-induced phosphorus release [35,54].
The phosphorus loading rate is a primary control as more supply increases retention rates but pushes wetlands towards capacity limits and reducing efficiency. Inflow TP concentration tracks these dynamics as very low concentrations constrain retention rates, while high concentrations increase variability and the chance of episodic exports. This variability is consistent with the findings of Zhou et al. [36], who reported that sediment saturation limits phosphorus adsorption capacity, leading to an increased export risk under high-loading conditions. The management of phosphorus inflows through pre-treatment systems, such as sedimentation basins or buffer strips, may help regulate inflow TP concentrations to optimise retention efficiency and stability [55,56].
Agricultural inflows exhibited the greatest variability, consistent with event-driven pulses carrying nutrient-rich runoff. Mendes et al. [19] reported similar findings, noting that particulate phosphorus in agricultural runoff relies heavily on sedimentation for removal, making these systems vulnerable to hydrological fluctuations. Systems receiving WwTW inputs span a wide range of TP retentions, reflecting design and influent diversity. Source context should therefore guide front-end controls such as having a large sedimentation basin at the start of the wetland for sites with high levels of particulates flowing in.
Accordingly, partitioning TP into soluble reactive phosphorus (SRP) and particulate phosphorus is crucial, and if able, including dissolved organic phosphorus would give a detailed picture of the TP pool [57]. Agricultural catchments are typically particulate dominated, so removal is governed by settling and sediment management. However, WwTW effluent contains higher SRP and depends more on sorption and uptake mechanisms. Reporting these fractions allows practitioners to more easily diagnose dominant pathways for phosphorus control.
Although under-reported in the dataset, substrate chemistry and plant communities are first-order controls on the stability of phosphorus retention. Sediments rich in iron, aluminium, and clay enhance sorption and form more stable complexes that resist phosphorus release [22,58]. Vegetation contributes to phosphorus removal via assimilation into biomass, sediment stabilisation, and shading to inhibit algal growth [3,53]. The importance of diverse plant communities has been shown, including emergent aquatic vegetation (EAV), submerged aquatic vegetation (SAV), and periphyton, which enhance retention through multiple pathways, while contributing to species richness [59,60]. However, decomposing plant matter can release stored phosphorus, necessitating periodic harvesting to maintain retention capacity [61].
Phosphorus dynamics, however, ultimately operate at the molecular scale and are governed by complex biogeochemical interactions. While whole wetland metrics such as size, depth, and hydraulic loading are frequently used to explain phosphorus removal, these variables act only as proxies for the underlying mechanisms. Progress is limited less by sample size than by missing essentials in many field datasets. Studies should at minimum report flow and concentration essentials to derive the HLR, HRT, and PLR at event-to-annual scales. Mechanism contexts (sediment chemistry, vegetation, and phosphorus fractionation) should be added when testing capacity and redox and accretion metrics should be included for long-term mass balance. Table 7 provides a tiered scheme and methods of variables that shape TP retention performance. Improving the consistency and reporting of these factors in future studies would significantly enhance the collective evidence base from wetland research, supporting more informed and effective design and management decisions.

3.4. Recommendations for Wetland Design

Effective FWSCW design aligns external forcing (HLR and PLR), with internal mechanisms (sedimentation and uptake) to keep systems in a high-performance state. Wetland size is critical, as larger wetlands provide greater area for sedimentation and nutrient uptake, dampen pulses, and produce more stable efficiencies [38,52]. Hydraulics should be matched to the objective. If the goal of a wetland is rapid phosphorus removal, implementing high HLRs could be advantageous, while if a stable, a high-efficiency system is the priority, then configurations promoting extended HRTs and controls on phosphorus should be utilised [41,47].
Hydraulic engineering should minimise short-circuiting and stagnation to maximise contact between water, sediment, and vegetation [15,41,62]. Weirs, baffles, and high length-to-width ratio cells also enhance performance by improving flow distribution [63]. Improved hydraulic design stabilises performance by reducing sediment resuspension risk and promoting consistent treatment [64]. Multi-cell systems are particularly effective as they divide treatment zones into specially designed cells optimised for specific mechanisms, such as sedimentation and uptake by biota [60,65]. For example, shallow cells promote sedimentation through rapid sediment settling and enhance uptake as EAV grows [3,66]. Routine sediment management reduces resuspension risk and maintains sorption capacity, which is especially important for particulate-rich agricultural inflows. Targeted management, specifically scheduled sediment dredging and plant harvesting prior to senescence, should be incorporated into management plans as necessary to sustain wetland sorption capacity and avoid decomposition-driven phosphorus release.
While our analysis focused on specific factors due to limitations in data availability, there are additional design and management considerations that impact phosphorus retention. Although not directly assessed in this study, phosphorus-sorbing materials such as iron oxides and aluminium hydroxides incorporated into wetland sediments can enhance long-term phosphorus retention by forming stable complexes resistant to redox-induced release [23,36]. In higher-load systems, these benefits may fade over time and warrant replenishment, although this would incur additional materials and maintenance costs [56,67]. Some wetlands may naturally receive these sorbents via drainage waters to positively influence retention mechanisms [19]. Addressing initial topsoil saturation during wetland construction through testing and removal could prevent initial phosphorus release when a wetland becomes operational [38,68,69]. As sediments are the primary phosphorus storage reservoirs, periodic maintenance sustains retention capacity and with accumulation they may saturate and transition from sink to source [69,70]. Where groundwater infiltration is plausible, lining with clay or synthetic materials can prevent unintended phosphorus inputs [6,71].
Diverse plant communities, including EAV, SAV, and periphyton, provide complementary mechanisms such as root uptake, filtering, and co-precipitation [71,72]. Additionally, biomass harvesting before senescence limits decomposition-driven phosphorus release [59,73]. Wetland age since becoming operational was rarely reported and therefore could not be adequately assessed in this review. However, it is likely that wetland age also modulates performance with new systems, with unsaturated substrates and immature vegetation potentially causing elevated phosphorus retention that may decline as sorption sites fill and plants mature.
Monitoring is essential for detecting declines in wetland performance, identifying intervention needs, and informing adaptive management practices [25,74]. Routine water quality monitoring of inflow and outflow phosphorus loads highlights challenges such as sediment saturation, vegetation senescence, or insufficient HRT. Sediment sampling provides insights into phosphorus saturation and redox conditions, enabling proactive maintenance. High-frequency monitoring improves loading estimates and is particularly important under variable hydrological regimes, although it entails added costs [25]. Overall, frequent monitoring ensures that wetlands adapt dynamically to changing conditions and operate at peak efficiency.
Seasonal and climatic variations also influence performance. Warmer temperatures enhance microbial activity and plant growth, increasing phosphorus uptake but also promoting decomposition and oxygen depletion [75,76]. Aeration or water-column mixing may mitigate the effects of oxygen depletion and resulting redox-driven phosphorus release during warmer months [22,35,77]. Wetlands treating stormwater or agricultural runoff may benefit from overflow structures such as buffer zones to manage hydrological extremes [78].

3.5. Areas for Further Research

This review highlights knowledge gaps that, if addressed, would enhance FWSCW performance and resilience. Priorities include understanding mechanisms, interactions, thresholds, monitoring, and climate contexts. The contributions of vegetation and sediment in resilient TP storage remain under-quantified. Research should focus on the contributions of plant communities through uptake, sediment stabilisation, and shading effects, identifying regionally appropriate plant assemblages that maximise TP retention and trial harvest timing before senescence [4,79]. For instance, Phragmites australis has demonstrated effective phosphorus sequestration but faces ecological constraints in certain regions [80]. On the sediment side, it resolves how mineralogy, organic matter, and redox conditions control sorption capacity [22,36]. Additionally, it must be identified under what loading pressures phosphorus-sorbing amendments are necessary and how frequently they must be replenished to avoid sink-to-source transitions [70].
Beyond single factor effects, design hinges on interactions among wetland size, HLR, HRT, PLR, and source characteristics [54]. Future work should develop multivariate models that test interactions and identify operating thresholds. Event-scaled research is required to understand how the timing and magnitude of hydrological pulses and the form of phosphorus they carry drive deviations from long-term retention performance. Progress also depends on enhanced monitoring systems paired with standardised reporting to enable meta-analysis and model transferability [45,68]. Remote sensing for vegetation cover and cost-effective sensor networks may lower barriers to sustained datasets.
Lastly, the impact of climate variability, including droughts and storms, requires long-term evaluation to quantify how climate extremes alter biotic uptake, retention times, redox dynamics, and export risk across varying source regimes [1,2,11]. By addressing these priorities, future research can ensure FWSCWs remain effective and resilient under variable loads and a changing climate.

4. Conclusions

This review strengthens the evidence base for FWSCWs by enforcing stricter screening criteria and applying models that link wetland design characteristics to both phosphorus retention efficiency and retention rates. Across 71 high quality studies, 90% of systems show net TP retention (median efficiency 43.9% and median rate 1 g/m2/year), figures which are consistent with previous syntheses.
A clear efficiency-rate trade-off emerges. Stable and high-efficiency wetlands can be gained by having larger areas and longer HRTs, which are enabled by buffering against nutrient pulses and extended contact times. Annual mass removal rates can be increased with the HLR or PLR; however, it is at the cost of increased variability and risk of export, most notably during event-driven inflows. Therefore, system hydraulics should target an objective, whether it is improved efficiency or mass removal. For robust performance, cells should be used to maximise sedimentation and uptake, and schedule periodic sediment and vegetation management.
However, it is important to note that many of the reviewed studies were based on infrastructure that was not built to a design standard for the treatment of phosphorus. While these findings offer valuable insights, there remain significant knowledge gaps in our understanding of FWSCWs and phosphorus retention, due to variability in monitoring methods and study designs. As our understanding of wetland design and maintenance has evolved, future treatment of wetlands should prioritise the integration of these advancements. Adopting standardised monitoring, with many key variables highlighted in Table 7, will build the comprehensive datasets needed for stronger predictive models and adaptive operational control.
Well-designed FWSCWs are effective, versatile systems at the wetland scale, offering a sustainable nature-based solution to improve water quality in both urban and rural landscapes. These systems deliver co-benefits, including habitat, flood mitigation, carbon sequestration, and recreational opportunities, thereby enhancing both ecological and social well-being [81,82]. However, it is important to note that high nutrient loads and certain management practices impact these co-benefits. Embedding evidence-based design, adaptive monitoring, and proactive management will help FWSCWs reliably treat diffuse and point-source phosphorus pollution and support resilient water quality outcomes alongside other reduction measures under changing climates.

Supplementary Materials

The following supporting information can be downloaded at: https://www.mdpi.com/article/10.3390/w17223301/s1, Figure S1: PRISMA flow diagram; Figure S2: Visualised retention efficiency model; Figure S3: Visualised retention rate model; Table S1: PRISMA checklist. Table S2: Extracted data. Reference [83] is cited in Supplementary Materials.

Author Contributions

The roles of the authors were as follows: Conceptualisation, H.W.; methodology, H.W., C.J.W., and K.A.W.; software, C.J.W.; validation, O.v.B. and H.W.; formal analysis, C.J.W. and K.A.W., investigation, C.J.W.; resources, O.v.B.; data curation, C.J.W.; writing—original draft preparation, C.J.W.; writing—review and editing, C.J.W., H.W., and D.R.; visualisation, C.J.W.; supervision, O.v.B.; project administration, O.v.B.; funding acquisition, D.R., H.W., and O.v.B. All authors have read and agreed to the published version of the manuscript.

Funding

This research was funded by Natural England and the WWT.

Data Availability Statement

The original contributions presented in this study are included in the article and Supplementary Materials. Further inquiries can be directed to the corresponding author.

Acknowledgments

The authors would like to thank Mark Jones for securing the funding necessary to conduct this review and to Ruth Hall for constructive comments on our study.

Conflicts of Interest

All authors declare that the research was conducted in the absence of any commercial or financial relationships that could be construed as a potential conflict of interest.

References

  1. Land, M.; Granéli, W.; Grimvall, A.; Hoffmann, C.C.; Mitsch, W.J.; Tonderski, K.S.; Verhoeven, J.T.A. How effective are created or restored freshwater wetlands for nitrogen and phosphorus removal? A systematic review. Environ. Evid. 2016, 5, 9. [Google Scholar] [CrossRef]
  2. Lyu, T.; Headley, T.; Kadlec, R.H.; Jefferson, B.; Dotro, G. Phosphorus removal in surface flow treatment wetlands for domestic wastewater treatment: Global experiences, opportunities, and challenges. J. Environ. Manag. 2024, 369, 122392. [Google Scholar] [CrossRef] [PubMed]
  3. Braskerud, B.C. Factors affecting phosphorus retention in small constructed wetlands treating agricultural non-point source pollution. Ecol. Eng. 2002, 19, 41–61. [Google Scholar] [CrossRef]
  4. Dzakpasu, M.; Scholz, M.; McCarthy, V.; Jordan, S.N. Assessment of long-term phosphorus retention in an integrated constructed wetland treating domestic wastewater. Environ. Sci. Pollut. Res. 2015, 22, 305–313. [Google Scholar] [CrossRef]
  5. El Hanandeh, A.; Akrami, K. Assessment of Nutrient Removal in Surface Flow Constructed Wetland Treating Secondary Effluent with Low Organic, Nitrogen and Phosphorus Loads. Environments 2023, 10, 89. [Google Scholar] [CrossRef]
  6. Kadlec, R. Large Constructed Wetlands for Phosphorus Control: A Review. Water 2016, 8, 243. [Google Scholar] [CrossRef]
  7. Carstensen, M.V.; Hashemi, F.; Hoffmann, C.C.; Zak, D.; Audet, J.; Kronvang, B. Efficiency of mitigation measures targeting nutrient losses from agricultural drainage systems: A review. Ambio 2020, 49, 1820–1837. [Google Scholar] [CrossRef]
  8. Hoagland, C.R.; Gentry, L.E.; David, M.B.; Kovacic, D.A. Plant Nutrient Uptake and Biomass Accumulation in a Constructed Wetland. J. Freshw. Ecol. 2001, 16, 527–540. [Google Scholar] [CrossRef]
  9. Tanner, C.C.; Sukias, J.P.S. Multiyear Nutrient Removal Performance of Three Constructed Wetlands Intercepting Tile Drain Flows from Grazed Pastures. J. Environ. Qual. 2011, 40, 620–633. [Google Scholar] [CrossRef]
  10. Allen, D.J.; Farrell, M.; Huang, J.; Reynolds, C.; Rupasinghe, M.; Mosley, L.M. Long-term water quality response to increased hydraulic loadings in a field-scale free water surface constructed wetland treating domestic effluent. J. Environ. Manag. 2022, 311, 114858. [Google Scholar] [CrossRef]
  11. Ury, E.A.; Arrumugam, P.; Herbert, E.R.; Badiou, P.; Page, B.; Basu, N.B. Source or sink? Meta-analysis reveals diverging controls of phosphorus retention and release in restored and constructed wetlands. Environ. Res. Lett. 2023, 18, 083002. [Google Scholar] [CrossRef]
  12. Hickey, A.; Arnscheidt, J.; Joyce, E.; O’Toole, J.; Galvin, G.; Callaghan, M.O.; Conroy, K.; Killian, D.; Shryane, T.; Hughes, F.; et al. An assessment of the performance of municipal constructed wetlands in Ireland. J. Environ. Manag. 2018, 210, 263–272. [Google Scholar] [CrossRef] [PubMed]
  13. Wahlroos, O.; Valkama, P.; Mäkinen, E.; Ojala, A.; Vasander, H.; Väänänen, V.-M.; Halonen, A.; Lindén, L.; Nummi, P.; Ahponen, H.; et al. Urban wetland parks in Finland: Improving water quality and creating endangered habitats. Int. J. Biodivers. Sci. Ecosyst. Serv. Manag. 2015, 11, 46–60. [Google Scholar] [CrossRef]
  14. Mitsch, W.J.; Cronk, J.K.; Wu, X.; Nairn, R.W.; Hey, D.L. Phosphorus Retention in Constructed Freshwater Riparian Marshes. Ecol. Appl. 1995, 5, 830–845. [Google Scholar] [CrossRef]
  15. Abtew, W.; Piccone, T.; Pietro, K.C.; Xue, S.K. Hydrologic and Treatment Performance of Constructed Wetlands: The Everglades Stormwater Treatment Areas. In The Wetland Book; Finlayson, C.M., Everard, M., Irvine, K., McInnes, R.J., Middleton, B.A., Van Dam, A.A., Eds.; Springer: Dordrecht, The Netherlands, 2018; pp. 243–262. [Google Scholar]
  16. Andersson, J.; Bastviken, S.K.; Tonderski, K. Free water surface wetlands for wastewater treatment in Sweden: Nitrogen and phosphorus removal. Water Sci. Technol. 2005, 51, 39–46. [Google Scholar] [CrossRef]
  17. Kovacic, D.A.; David, M.B.; Gentry, L.E.; Starks, K.M.; Cooke, R.A. Effectiveness of Constructed Wetlands in Reducing Nitrogen and Phosphorus Export from Agricultural Tile Drainage. J. Environ. Qual. 2000, 29, 1262–1274. [Google Scholar] [CrossRef]
  18. Spieles, D.J.; Mitsch, W.J. The effects of season and hydrologic and chemical loading on nitrate retention in constructed wetlands: A comparison of low- and high-nutrient riverine systems. Ecol. Eng. 1999, 14, 77–91. [Google Scholar] [CrossRef]
  19. Mendes, L.R.D.; Tonderski, K.; Iversen, B.V.; Kjaergaard, C. Phosphorus retention in surface-flow constructed wetlands targeting agricultural drainage water. Ecol. Eng. 2018, 120, 94–103. [Google Scholar] [CrossRef]
  20. Oliver, N.; Martín, M.; Gargallo, S.; Hernández-Crespo, C. Influence of operational parameters on nutrient removal from eutrophic water in a constructed wetland. Hydrobiologia 2017, 792, 105–120. [Google Scholar] [CrossRef]
  21. Black, C.A.; Wise, W.R. Evaluation of past and potential phosphorus uptake at the Orlando Easterly Wetland. Ecol. Eng. 2003, 21, 277–290. [Google Scholar] [CrossRef]
  22. Mendes, L.R.D.; Tonderski, K.; Kjaergaard, C. Phosphorus accumulation and stability in sediments of surface-flow constructed wetlands. Geoderma 2018, 331, 109–120. [Google Scholar] [CrossRef]
  23. Anderson, K.J.; Adhikari, B.; Schloegel, O.F.; Mendonca, R.M.; Back, M.P.; Brocato, N.; Cianci-Gaskill, J.A.; McMurray, S.E.; Bahlai, C.; Costello, D.M.; et al. We know less about phosphorus retention in constructed wetlands than we think we do: A quantitative literature synthesis. Ecol. Indic. 2024, 169, 112969. [Google Scholar] [CrossRef]
  24. Bowes, M.J.; Smith, J.T.; Neal, C. The value of high-resolution nutrient monitoring: A case study of the River Frome, Dorset, UK. J. Hydrol. 2009, 378, 82–96. [Google Scholar] [CrossRef]
  25. Moustafa, M.Z.; Havensand, K.E. Identification of an optimal sampling strategy for a constructed wetland. JAWRA J. Am. Water Resour. Assoc. 2001, 37, 1015–1028. [Google Scholar] [CrossRef]
  26. Liberati, A.; Altman, D.G.; Tetzlaff, J.; Mulrow, C.; Gøtzsche, P.C.; Ioannidis, J.P.A.; Clarke, M.; Devereaux, P.J.; Kleijnen, J.; Moher, D. The PRISMA Statement for Reporting Systematic Reviews and Meta-Analyses of Studies That Evaluate Health Care Interventions: Explanation and Elaboration. PLoS Med. 2009, 6, e1000100. [Google Scholar] [CrossRef]
  27. Dotro, G.; Jefferson, B.; Lyu, T. Summarising the Evidence Base on the Use of Surface Flow Treatment Wetlands for Phosphorus Removal; Cranfield University: Cranfield, UK, 2021. [Google Scholar]
  28. R Core Team. R: A Language and Environment for Statistical Computing; R Foundation for Statistical Computing: Vienna, Austria, 2024. [Google Scholar]
  29. Kim, D.-G.; Park, J.; Lee, D.; Kang, H. Removal of Nitrogen and Phosphorus from Effluent of a Secondary Wastewater Treatment Plant Using a Pond–Marsh Wetland System. Water Air Soil Pollut. 2011, 214, 37–47. [Google Scholar] [CrossRef]
  30. Hernández-Crespo, C.; Gargallo, S.; Benedito-Durá, V.; Nácher-Rodríguez, B.; Rodrigo-Alacreu, M.; Martín, M. Performance of surface and subsurface flow constructed wetlands treating eutrophic waters. Sci. Total Environ. 2017, 595, 584–593. [Google Scholar] [CrossRef]
  31. Wood, K.A.; Newth, J.L.; Hilton, G.M.; Rees, E.C. Behavioural and energetic consequences of competition among three overwintering swan (Cygnus spp.) species. Avian Res. 2021, 12, 48. [Google Scholar] [CrossRef]
  32. Jarvie, H.P.; Pallett, D.W.; Schäfer, S.M.; Macrae, M.L.; Bowes, M.J.; Farrand, P.; Warwick, A.C.; King, S.M.; Williams, R.J.; Armstrong, L.; et al. Biogeochemical and climate drivers of wetland phosphorus and nitrogen release: Implications for nutrient legacies and eutrophication risk. J. Environ. Qual. 2020, 49, 1703–1716. [Google Scholar] [CrossRef]
  33. Abe, K.; Komada, M.; Ookuma, A. Efficiency of removal of nitrogen, phosphorus, and zinc from domestic wastewater by a constructed wetland system in rural areas: A case study. Water Sci. Technol. 2008, 58, 2427–2433. [Google Scholar] [CrossRef]
  34. Griffiths, L.N.; Mitsch, W.J. Nutrient retention via sedimentation in a created urban stormwater treatment wetland. Sci. Total Environ. 2020, 727, 138337. [Google Scholar] [CrossRef] [PubMed]
  35. Braskerud, B.; Hartnik, T.; Løvstad, Ø. The effect of the redox-potential on the retention of phosphorus in a small constructed wetland. Water Sci. Technol. 2005, 51, 127–134. [Google Scholar] [CrossRef] [PubMed]
  36. Zhou, J.; Luo, P.; Liu, F.; Gong, D.; Li, B.; Xiao, R.; Wu, J. Unveiling the role of sediments in phosphorus removal in pilot-scale constructed wetlands for swine wastewater treatment. Sci. Total Environ. 2022, 807, 150684. [Google Scholar] [CrossRef] [PubMed]
  37. Dantas Mendes, L.R. Edge-of-Field Technologies for Phosphorus Retention from Agricultural Drainage Discharge. Appl. Sci. 2020, 10, 634. [Google Scholar] [CrossRef]
  38. Koskiaho, J.; Puustinen, M.; Kotamäki, N. Retention performance of a constructed wetland as measured automatically with sensors. Prog. Environ. Sci. Technol. 2009, 2, 1–11. [Google Scholar]
  39. Griffiths, L.N.; Mitsch, W.J. Removal of nutrients from urban stormwater runoff by storm-pulsed and seasonally pulsed created wetlands in the subtropics. Ecol. Eng. 2017, 108, 414–424. [Google Scholar] [CrossRef]
  40. Nesbit, T.A.; Mitsch, W.J. Hurricane and seasonal effects on hydrology and water quality of a subtropical urban stormwater wetland. Ecol. Eng. 2018, 120, 134–145. [Google Scholar] [CrossRef]
  41. Toet, S.; Logtestijn, R.S.P.; Kampf, R.; Schreijer, M.; Verhoeven, J.T.A. The effect of hydraulic retention time on the removal of pollutants from sewage treatment plant effluent in a surface-flow wetland system. Wetlands 2005, 25, 375–391. [Google Scholar] [CrossRef]
  42. Toet, S.; Van Logtestijn, R.S.; Schreijer, M.; Kampf, R.; Verhoeven, J.T. The functioning of a wetland system used for polishing effluent from a sewage treatment plant. Ecol. Eng. 2005, 25, 101–124. [Google Scholar] [CrossRef]
  43. Martín, M.; Oliver, N.; Hernández-Crespo, C.; Gargallo, S.; Regidor, M. The use of free water surface constructed wetland to treat the eutrophicated waters of lake L’Albufera de Valencia (Spain). Ecol. Eng. 2013, 50, 52–61. [Google Scholar] [CrossRef]
  44. Kumwimba, M.N.; Dzakpasu, M.; Xinzhu, L.; Wang, W.; Jie, Z.; Bao, L.; Su, J.; Li, X. Sequential detention pond-biogeochemical barrier-free water surface wetland system for effluent purification and river eutrophication control. J. Water Process Eng. 2021, 41, 102075. [Google Scholar] [CrossRef]
  45. Li, J.; Zheng, B.; Chen, X.; Li, Z.; Xia, Q.; Wang, H.; Yang, Y.; Zhou, Y.; Yang, H. The Use of Constructed Wetland for Mitigating Nitrogen and Phosphorus from Agricultural Runoff: A Review. Water 2021, 13, 476. [Google Scholar] [CrossRef]
  46. Shukla, A.; Parde, D.; Gupta, V.; Vijay, R.; Kumar, R. A review on effective design processes of constructed wetlands. Int. J. Environ. Sci. Technol. 2022, 19, 12749–12774. [Google Scholar] [CrossRef]
  47. Dunne, E.J.; Coveney, M.F.; Marzolf, E.R.; Hoge, V.R.; Conrow, R.; Naleway, R.; Lowe, E.F.; Battoe, L.E. Efficacy of a large-scale constructed wetland to remove phosphorus and suspended solids from Lake Apopka, Florida. Ecol. Eng. 2012, 42, 90–100. [Google Scholar] [CrossRef]
  48. Zhao, H.; Piccone, T. Large scale constructed wetlands for phosphorus removal, an effective nonpoint source pollution treatment technology. Ecol. Eng. 2020, 145, 105711. [Google Scholar] [CrossRef]
  49. Kadlec, R.H. Phosphorus Removal in Emergent Free Surface Wetlands. J. Environ. Sci. Health Part A 2005, 40, 1293–1306. [Google Scholar] [CrossRef]
  50. Chen, H.; Ivanoff, D.; Pietro, K. Long-term phosphorus removal in the Everglades stormwater treatment areas of South Florida in the United States. Ecol. Eng. 2015, 79, 158–168. [Google Scholar] [CrossRef]
  51. Slak, A.S.; Bulc, T.; Vrhovsek, D. Comparison of nutrient cycling in a surface-flow constructed wetland and in a facultative pond treating secondary effluent. Water Sci. Technol. 2005, 51, 291–298. [Google Scholar] [CrossRef]
  52. Koskiaho, J.; Puustinen, M. Suspended solids and nutrient retention in two constructed wetlands as determined from continuous data recorded with sensors. Ecol. Eng. 2019, 137, 65–75. [Google Scholar] [CrossRef]
  53. Greenway, M. The role of constructed wetlands in secondary effluent treatment and water reuse in subtropical and arid Australia. Ecol. Eng. 2005, 25, 501–509. [Google Scholar] [CrossRef]
  54. Dalsgaard, J.; von Ahnen, M.; Pedersen, P. Nutrient removal in a slow-flowing constructed wetland treating aquaculture effluent. Aquac. Environ. Interact. 2021, 13, 363–376. [Google Scholar] [CrossRef]
  55. Nairn, R.W.; Mitsch, W.J. Phosphorus removal in created wetland ponds receiving river overflow. Ecol. Eng. 1999, 14, 107–126. [Google Scholar] [CrossRef]
  56. Tanner, C.; Nguyen, M.; Sukias, J. Nutrient removal by a constructed wetland treating subsurface drainage from grazed dairy pasture. Agric. Ecosyst. Environ. 2005, 105, 145–162. [Google Scholar] [CrossRef]
  57. Hussey, V.L. Investigating Nutrient Cycling, Retention and Bioavailability of Effluents Discharged from Constructed Wetlands: Optimising Wetland Management to Reduce Emerging Risks to Freshwaters; University of Bristol: Bristol, UK, 2025. [Google Scholar]
  58. Herskowitz, J. Listowel Artificial Marsh Project Report; Research Advisory Committee, Ontario Ministry of the Environment and Energy: Listowel, ON, Canada, 1986.
  59. Greenaway, M.; Woolley, A. Changes in plant biomass and nutrient removal over 3 years in a constructed wetland in Cairns, Australia. Water Sci. Technol. 2001, 44, 303–310. [Google Scholar] [CrossRef]
  60. Gu, B.; Dreschel, T. Effects of plant community and phosphorus loading rate on constructed wetland performance in Florida, USA. Wetlands 2008, 28, 81–91. [Google Scholar] [CrossRef]
  61. Song, S.; Liu, B.; Zhang, W.; Wang, P.; Qiao, Y.; Zhao, D.; Yang, T.; An, S.; Leng, X. Performance of a large-scale wetland treatment system in treating tailwater from a sewage treatment plant. Mar. Freshw. Res. 2018, 69, 833. [Google Scholar] [CrossRef]
  62. Knight, R.L.; Winchester, B.H.; Higman, J.C. Ecology, hydrology, and advanced wastewater treatment potential of an artificial wetland in North-central, Florida. Wetlands 1985, 5, 167–180. [Google Scholar] [CrossRef]
  63. Jia, J.; Gao, Y.; Zhou, F.; Shi, K.; Johnes, P.J.; Dungait, J.A.; Ma, M.; Lu, Y. Identifying the main drivers of change of phytoplankton community structure and gross primary productivity in a river-lake system. J. Hydrol. 2020, 583, 124633. [Google Scholar] [CrossRef]
  64. Kadlec, R.H. Detention and mixing in free water wetlands. Ecol. Eng. 1994, 3, 345–380. [Google Scholar] [CrossRef]
  65. Kynkäänniemi, P.; Ulén, B.; Torstensson, G.; Tonderski, K.S. Phosphorus Retention in a Newly Constructed Wetland Receiving Agricultural Tile Drainage Water. J. Environ. Qual. 2013, 42, 596–605. [Google Scholar] [CrossRef]
  66. Braskerud, B.C. The Influence of Vegetation on Sedimentation and Resuspension of Soil Particles in Small Constructed Wetlands. J. Environ. Qual. 2001, 30, 1447–1457. [Google Scholar] [CrossRef]
  67. Pietro, K. Synopsis of the Everglades Stormwater Treatment Areas, Water Year 1996–2012; South Florida Water Management District: West Palm Beach, FL, USA, 2012.
  68. Mitsch, W.J.; Zhang, L.; Waletzko, E.; Bernal, B. Validation of the ecosystem services of created wetlands: Two decades of plant succession, nutrient retention, and carbon sequestration in experimental riverine marshes. Ecol. Eng. 2014, 72, 11–24. [Google Scholar] [CrossRef]
  69. Johannesson, K.M.; Andersson, J.L.; Tonderski, K.S. Efficiency of a constructed wetland for retention of sediment-associated phosphorus. Hydrobiologia 2011, 674, 179–190. [Google Scholar] [CrossRef]
  70. Krzeminska, D.; Blankenberg, A.-G.B.; Bechmann, M.; Deelstra, J. The effectiveness of sediment and phosphorus removal by a small constructed wetland in Norway: 18 years of monitoring and perspectives for the future. CATENA 2023, 223, 106962. [Google Scholar] [CrossRef]
  71. Gu, B. Phosphorus removal in small constructed wetlands dominated by submersed aquatic vegetation in South Florida, USA. J. Plant Ecol. 2008, 1, 67–74. [Google Scholar] [CrossRef]
  72. Tunçsiper, B. Combined natural wastewater treatment systems for removal of organic matter and phosphorus from polluted streams. J. Clean. Prod. 2019, 228, 1368–1376. [Google Scholar] [CrossRef]
  73. Lu, S.Y.; Zhang, P.Y.; Cui, W.H. Impact of plant harvesting on nitrogen and phosphorus removal in constructed wetlands treating agricultural region wastewater. Int. J. Environ. Pollut. 2010, 43, 339. [Google Scholar] [CrossRef]
  74. Skinner, M. Wetland phosphorus dynamics and phosphorus removal potential. Water Environ. Res. 2022, 94, e10799. [Google Scholar] [CrossRef]
  75. Lu, S.Y.; Wu, F.C.; Lu, Y.F.; Xiang, C.S.; Zhang, P.Y.; Jin, C.X. Phosphorus removal from agricultural runoff by constructed wetland. Ecol. Eng. 2009, 35, 402–409. [Google Scholar] [CrossRef]
  76. Kill, K.; Pärn, J.; Lust, R.; Mander, Ü.; Kasak, K. Treatment Efficiency of Diffuse Agricultural Pollution in a Constructed Wetland Impacted by Groundwater Seepage. Water 2018, 10, 1601. [Google Scholar] [CrossRef]
  77. Altamira-Algarra, B.; Puigagut, J.; Day, J.W.; Mitsch, W.J.; Vymazal, J.; Hunter, R.G.; García, J. A review of technologies for closing the P loop in agriculture runoff: Contributing to the transition towards a circular economy. Ecol. Eng. 2022, 177, 106571. [Google Scholar] [CrossRef]
  78. Kumwimba, M.N.; Zhu, B.; Stefanakis, A.I.; Ajibade, F.O.; Dzakpasu, M.; Soana, E.; Wang, T.; Arif, M.; Muyembe, D.K.; Agboola, T.D. Advances in ecotechnological methods for diffuse nutrient pollution control: Wicked issues in agricultural and urban watersheds. Front. Environ. Sci. 2023, 11, 1199923. [Google Scholar] [CrossRef]
  79. Healy, M.; Cawley, A.M. Nutrient Processing Capacity of a Constructed Wetland in Western Ireland. J. Environ. Qual. 2002, 31, 1739–1747. [Google Scholar] [CrossRef]
  80. Zheng, Y.; Wang, X.; Dzakpasu, M.; Zhao, Y.; Ngo, H.H.; Guo, W.; Ge, Y.; Xiong, J. Effects of interspecific competition on the growth of macrophytes and nutrient removal in constructed wetlands: A comparative assessment of free water surface and horizontal subsurface flow systems. Bioresour. Technol. 2016, 207, 134–141. [Google Scholar] [CrossRef]
  81. Semeraro, T.; Giannuzzi, C.; Beccarisi, L.; Aretano, R.; De Marco, A.; Pasimeni, M.R.; Zurlini, G.; Petrosillo, I. A constructed treatment wetland as an opportunity to enhance biodiversity and ecosystem services. Ecol. Eng. 2015, 82, 517–526. [Google Scholar] [CrossRef]
  82. Wood, K.A.; Jupe, L.L.; Aguiar, F.C.; Collins, A.M.; Davidson, S.J.; Freeman, W.; Kirkpatrick, L.; Magalhães, T.L.-D.; McKinley, E.; Nuno, A.; et al. A global systematic review of the cultural ecosystem services provided by wetlands. Ecosyst. Serv. 2024, 70, 101673. [Google Scholar] [CrossRef]
  83. Page, M.J.; McKenzie, J.E.; Bossuyt, P.M.; Boutron, I.; Hoffmann, T.C.; Mulrow, C.D.; Shamseer, L.; Tetzlaff, J.M.; Akl, E.A.; Brennan, S.E.; et al. The PRISMA 2020 statement: An updated guideline for reporting systematic reviews. BMJ 2021, 372, n71. [Google Scholar] [CrossRef] [PubMed]
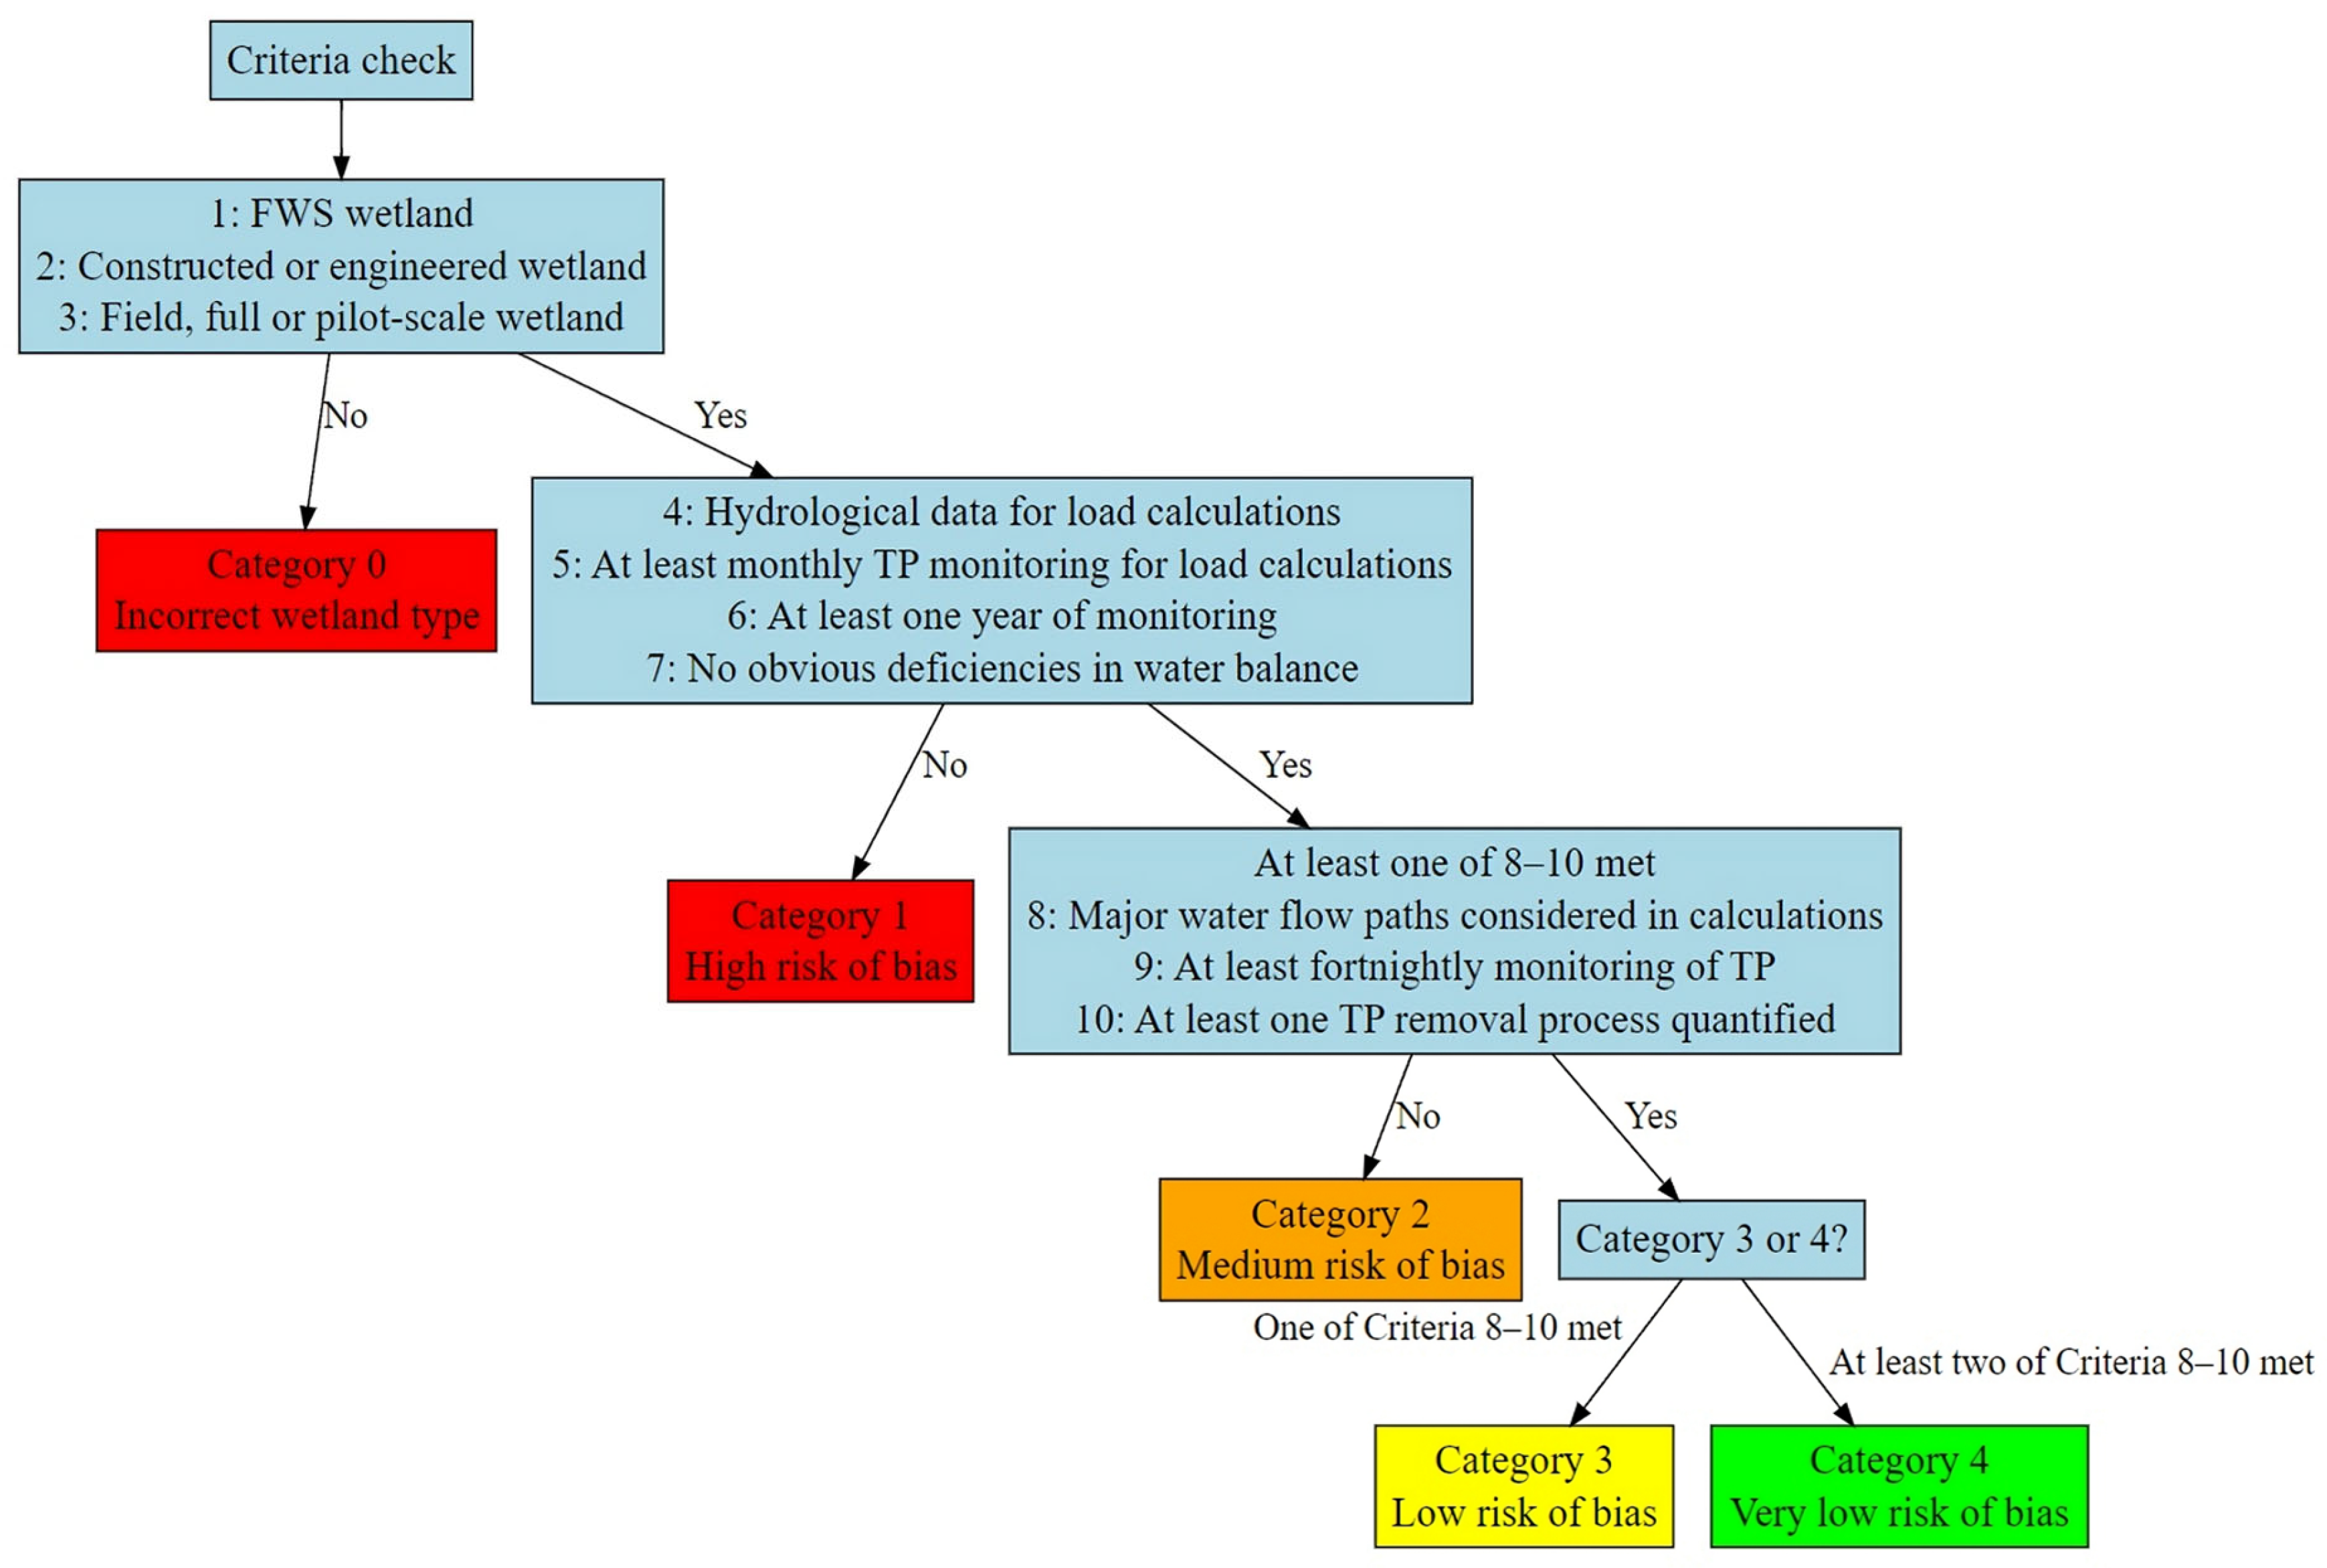
Figure 1. Screening assessment criteria for study inclusion in meta-analysis.
Water 17 03301 g001
Figure 2. Workflow of generalised linear mixed-effects model selection and development.
Water 17 03301 g002
Figure 3. Phosphorus retention efficiencies across wetlands of varying (A) area, (B) hydraulic loading rates, (C), hydraulic retention times, (D) phosphorus loading rates, (E) phosphorus inflow concentrations, and (F) water sources. Boxplots illustrate median retention efficiencies and interquartile range. Whiskers extend to 1.5 times the interquartile range and dots represent outliers beyond this range. The number of observations within each group is shown by n.
Water 17 03301 g003
Figure 4. Proportional distribution of total phosphorus retention efficiency across wetlands, influenced by (A) wetland area, (B) hydraulic loading rate, (C) hydraulic retention time, (D) phosphorus loading rate, and (E) phosphorus inflow concentration. The stacked bar plots represent the proportional frequency of wetlands achieving total phosphorus retention in various ranges.
Water 17 03301 g004
Figure 5. Phosphorus mass retention across wetlands of varying (A) area, (B) hydraulic loading rates, (C), hydraulic retention times, (D) phosphorus loading rates, (E) total phosphorus inflow concentrations, and (F) water sources. Boxplots illustrate median retention efficiencies and interquartile range. Whiskers extend to 1.5 times the interquartile range and dots represent outliers beyond this range. The number of observations within each group is shown by n.
Water 17 03301 g005
Figure 6. Proportional distribution of total phosphorus retention rates across wetlands, influenced by (A) wetland area, (B) hydraulic loading rate, (C) hydraulic retention time, (D) phosphorus loading rate, and (E) phosphorus inflow concentration. The stacked bar plots represent the proportional frequency of wetlands achieving total phosphorus retention in various ranges.
Water 17 03301 g006
Table 1. Dunn’s Test with Bonferroni adjustment following the Kruskal–Wallis test displaying statistical differences in TP retention efficiency (%) across groups for various factors. Vertical groups with different letters represent statistically significant differences (p < 0.05). Groups with the same letter are not statistically different.
FactorGroup 1Group 2Group 3
Wetland area (ha) <1 (a)1–10 (a, b)>10 (b)
HLR (m/year)<10 (a)10–30 (a, b)>30 (b)
HRT (hours)<48 (a)48–120 (a, b)>120 (b)
PLR (g/m2/year)<2 (a)2–20 (a, b)>20 (b)
TP concentration (mg/L)<0.2 (a)0.2–1 (a, b)>1 (b)
Water sourceAgriculture (a)WwTW (b)Urban (a, b)
Table 2. Summary of the best-fitting models (Delta < 6.00) and null model of wetland total phosphorus retention efficiency.
ModeldfAICcDeltaWeightRLERR2mR2c
1 + PLR + Wetland Area + Wetland ID5−12.330.000.7021.0001.000.2620.482
1 + PLR + HLR + Wetland Area + Wetland ID 6−10.292.040.2530.3612.770.2640.485
1 + Wetland ID 310.4422.770.0000.00088,123.340.0000.350
The best-fitting model identified through model selection is indicated in bold.
Table 3. Estimates for the best-fitting total phosphorus retention efficiency model with the lowest AICc value.
Effect TypeParameterVIFEstimateSEVarianceSD
Fixed Intercept-0.507360.026--
FixedPLR1.03−0.095400.024--
FixedWetland Area1.030.072720.024--
RandomWetland ID- --0.0140.119
RandomResidual---0.0330.182
Table 4. Dunn’s test with Bonferroni adjustment following the Kruskal–Wallis test displaying statistical differences in TP retention rates (g/m2/year) across groups for various factors. Vertical groups with different letters represent statistically significant differences (p < 0.05). Groups with the same letter are not statistically different.
FactorGroup 1Group 2Group 3
Wetland area (ha) <1 (a)1–10 (a, b)>10 (b)
HLR (m/year)<10 (a)10–30 (a, b)>30 (b)
HRT (hours)<48 (a)48–120 (a, b)>120 (b)
PLR (g/m2/year)<2 (a)2–20 (a, b)>20 (b)
TP concentration (mg/L)<0.2 (a)0.2–1 (a, b)>1 (b)
Water sourceAgriculture (a)WwTW (b)Urban (c)
Table 5. Summary of the best-fitting models (Delta < 6.00) and null models of wetland total phosphorus retention rate.
ModeldfAICcDeltaWeightRLERR2mR2c
1 + PLR + HLR + Wetland ID5131.790.000.7121.0001.000.4860.995
1 + PLR + HLR + Wetland Area + Wetland ID 6133.842.050.2550.3592.790.4870.995
1 + Wetland ID 3186.0054.210.0000.000589,809,500,000.000.0000.993
The best-fitting model identified through model selection is indicated in bold.
Table 6. Estimates for the best-fitting total phosphorus retention rate model with the lowest AICc value.
Effect TypeParameterVIFEstimateSEVarianceSD
Fixed Intercept-0.016900.093--
FixedPLR1.250.587440.090--
FixedHLR1.250.279310.093--
RandomWetland ID---0.5970.773
RandomResidual---0.0050.074
Table 7. Monitoring parameters for assessing phosphorus removal in FWSCWs, categorised by importance (essential, important, and optional). Suggested methods are provided to help guide data collection for the associated parameters. It is assumed that groundwater fluxes are not relevant because the wetland is hydrologically isolated from groundwater. If groundwater fluxes were potentially important, measurements of groundwater TP and measurements that would allow groundwater fluxes to be estimated would be essential.
Data TypeImportanceSuggested Monitoring Method
Total phosphorus concentration (mg/L)EssentialRegular inflow/outflow monitoring, including storm sampling
Flow monitoring (m3/s)EssentialFlow metres/calibrated weirs at inflow/outflow, monitored continuously
Phosphorus loading rate (g/m2/year)EssentialCalculate from total phosphorus concentrations with flow data
Hydraulic loading rate (m/year)EssentialCalculate using wetland flow and design parameters
Hydraulic retention time (hours or days)EssentialCalculate using wetland flow and design parameters
Wetland depth (m), treatment area (m2), and volume (m3)EssentialDetermined as part of wetland design
Baseline substrate phosphorus content (mg/kg)ImportantSubstrate analysed during wetland construction
Substrate iron and aluminium content (mg/kg)ImportantBed sediment sampling and analysis
Soluble reactive phosphorus, particulate phosphorus concentrations (mg/L), and loading (g/m2/year)ImportantRegular water sampling at inflow/outflow, combine with flow data to calculate loadings.
Total suspended solids (mg/L)ImportantWater sampling and analysis
Bed sediment phosphorus content (mg/kg)ImportantBed sediment sampling and analysis
Vegetation coverage (% coverage or biomass)ImportantRemote sensing or manual surveys to estimate percentage coverage
Sediment accretion rate (mm/year)OptionalSediment traps or marker horizons
Water temperature (°C)OptionalIn situ temperate probes
pHOptionalIn situ pH probes
Dissolved oxygen (mg/L)OptionalIn situ dissolved oxygen probes
Redox potential (mV)OptionalMeasure using redox electrodes
Vegetation species composition (%)OptionalManual surveys for species identification
Disclaimer/Publisher’s Note: The statements, opinions and data contained in all publications are solely those of the individual author(s) and contributor(s) and not of MDPI and/or the editor(s). MDPI and/or the editor(s) disclaim responsibility for any injury to people or property resulting from any ideas, methods, instructions or products referred to in the content.