Article

Application of Environmental DNA Technology in Fish Diversity Research in Dongting Lake, China

1
College of Life Science, Nanjing Normal University, Nanjing 210023, China
2
Hunan Fisheries Research Institute and Aquatic Products Seed Stock Station, Changsha 410153, China
3
Key Lab of Freshwater Biodiversity Conservation, Ministry of Agriculture and Rural Affairs of China, Yangtze River Fisheries Research Institute, CAFS, Wuhan 430223, China
*
Authors to whom correspondence should be addressed.
These authors contributed equally to this work.
Water 2025, 17(22), 3282; https://doi.org/10.3390/w17223282
Submission received: 7 October 2025 / Revised: 9 November 2025 / Accepted: 14 November 2025 / Published: 17 November 2025
(This article belongs to the Section Biodiversity and Functionality of Aquatic Ecosystems)

Abstract

To assess the applicability of environmental DNA (eDNA) technology in monitoring fish diversity in Dongting Lake, located in Hunan Province within the Yangtze River Basin, China, this study combined eDNA metabarcoding with traditional fishing gear to describe the diversity characteristics of the fish community in its habitat. Water samples were collected from 20 representative sites for eDNA analysis, followed by filtration, DNA extraction, and high-throughput sequencing targeting the 12S rDNA region. Concurrently, traditional fishing gear using gill nets and fish traps was conducted at the same locations. The results revealed 82 fish species detected by both methods combined, with eDNA alone identifying 21 species (including rare species encompassing Saurogobio gracilicaudatus and Glyptothorax sinense), while traditional fishing gear detected 27 species. Among the 82 fish species, a total of thirty-four species of fish could be observed in catches from both methods. In terms of α-diversity, eDNA showed higher Chao1, species richness, and ACE indices compared to traditional fishing gear, but lower Shannon and Simpson indices. eDNA was more sensitive to species richness, while traditional fishing gear was better at characterizing community evenness and diversity. β-Diversity analysis showed higher spatial similarity in the fish community structure detected by eDNA, while traditional fishing gear revealed significant differences between the upstream and downstream areas. In summary, eDNA technology has the advantages of non-invasiveness, high sensitivity and broad coverage, effectively serving as a valuable supplementary tool of traditional fishing gear, particularly in monitoring rare species. However, further improvements are needed in terms of species abundance quantification and database dependency. The combination of these two methods provides a more comprehensive scientific basis for fish resource conservation in Dongting Lake.

1. Introduction

Fish diversity is a key indicator for monitoring aquatic ecosystem health and is critical for assessing ecosystem changes [1]. Freshwater ecosystems provide vital resources for the development of human civilization. However, due to pressures from human activities such as habitat degradation, overfishing, water pollution, climate change, and invasive species, fish populations and fish biodiversity in global freshwater habitats are steadily declining. The threats they face are more severe than those in terrestrial and marine ecosystems [2], posing a serious danger to the functioning of aquatic ecosystems, the sustainable development of fisheries economies, and basic human livelihoods [3]. Given the accelerating loss of global biodiversity, there is an urgent need for more biodiversity assessments [4].
Traditional fish monitoring methods (e.g., electric fishing, net fishing, and trapping) have long been the cornerstone of fish resource surveys. However, these approaches have various disadvantages. For example, they are often costly, time-consuming, spatially, and temporally limited. Furthermore, some fish species, especially fast-swimming ones, may escape capture [5]. They may undersample small-bodied, rare, or elusive species [6], and their invasive nature can induce stress or mortality in captured organisms [7]. Moreover, due to selectivity in equipment [8] or the lack of distinguishing morphological features [9], some species may be excluded from surveys. These limitations are particularly magnified in the context of large-scale conservation actions, such as the decade-long fishing ban implemented since January 2020 in the Yangtze River Basin, China, to rehabilitate its depleted fishery resources [10]. This policy makes frequent, extensive traditional monitoring challenging. A more efficient, less invasive method for monitoring fish diversity is urgently needed [11].
Environmental DNA (eDNA) technology has emerged as an efficient, non-invasive detection method by extracting and analyzing genetic material from environmental samples such as soil, sediments, feces, air, and water [12,13]. By detecting DNA fragments shed by organisms, eDNA metabarcoding allows for comprehensive biodiversity assessment without physical capture, demonstrating high sensitivity for detecting rare and small species [14]. The rapid processing and decreasing cost of eDNA analysis further facilitate broader spatial and temporal coverage [14]. In recent years, environmental DNA technology has advanced rapidly due to the application of DNA barcoding and high-throughput sequencing techniques [15]. Environmental DNA technology is now widely used in species diversity monitoring and population studies [16]. In China, the application of eDNA in freshwater ecosystems is rapidly advancing. Studies have successfully deployed it in various water bodies from the middle and lower Yangtze River [17], Dongping Lake [18], and the Chishui River [19], demonstrating its capability to reveal fish community composition and spatial distribution patterns. However, the effectiveness of eDNA can be influenced by factors encompassing primer specificity, DNA persistence and transport, and the completeness of reference databases, which may lead to detection inaccuracies [20,21].
Dongting Lake, China’s second-largest freshwater lake, is a vital component of the Yangtze River ecosystem, playing a crucial role in flood regulation, drinking water supply, and biodiversity conservation [22]. The lake has rich fish diversity in history, but with the development of the economy around Dongting Lake, the construction of hydraulic structures, silt reclamation, and environmental pollution have changed its hydrological environment, and the habitat of fish has been destroyed. Overfishing has led to a serious decline in its fishery resources [23]. In order to protect the fishery resources and biodiversity of the Yangtze River system, the Ministry of Agriculture and Rural Affairs, the Ministry of Finance, and the Ministry of Human Resources and Social Security jointly issued the “Implementation Plan for the Prohibition of Capture and Establishment of Compensation System in Key Waters of the Yangtze River Basin”, which clearly stipulated that Dongting Lake will start a ten-year comprehensive arrest from 1 January 2020 [24]. Since then, the Dongting Lake water system ecosystem has entered a recovery period. Against the backdrop of fishing bans, effective monitoring is essential for evaluating the ban’s effectiveness and guiding future conservation efforts. Given that previous research in this region has primarily relied on traditional methods, systematic comparative studies between eDNA technology and standardized traditional fishing gear remain unexplored in the complex habitat of Dongting Lake. Several key questions remain unanswered: (1) Does eDNA technology demonstrate comparable species detection capability to traditional fishing gear in the complex aquatic environment of Dongting Lake? (2) Do the two methods differ significantly in characterizing α-diversity and β-diversity of fish communities? (3) Can eDNA technology reliably reveal spatial patterns of fish community composition? (4) Can their integration offer a more comprehensive and accurate scientific basis for fish resource conservation in Dongting Lake?
In response to these research gaps, a comparative survey integrating eDNA metabarcoding and traditional fishing gear was implemented across 20 sampling sites in Dongting Lake. The investigation aimed to critically evaluate the relative efficacy of each method for documenting fish species composition and characterizing community diversity. The findings are intended to assess the practical applicability of eDNA technology and contribute to the development of a refined, integrated monitoring strategy for the lake’s fishery resources.

2. Materials and Methods

2.1. Survey Area and Sampling Period

This study was conducted in Dongting Lake from 12 April to 8 May 2024 during the late spring to early summer period. This sampling timeframe was selected based on key ecological and hydrological considerations: the suitable water temperatures during this season coincide with the active growth and reproductive periods of most fish species, resulting in expanded activity ranges and increased occurrence frequencies, thereby enhancing the comprehensive detection of fish diversity. Additionally, relatively stable hydrological conditions during this period help minimize potential biases in eDNA distribution and traditional fishing gear catch rates caused by significant water level fluctuations.
A total of 20 sampling sites were systematically established across the lake area (Figure 1). At each site, we collected eDNA water samples while deploying gillnets, ensuring that both methods captured fish community information at the same moment. This sampling design was approved by the relevant fisheries management authorities and strictly complied with the Yangtze River “ten-year fishing ban” policy. According to geographic descriptions provided by the Institute of Geographic Sciences and Natural Resources Research, Chinese Academy of Sciences, Dongting Lake is a river-connected flush-type lake, exhibiting a typical hydrographic pattern of “four tributaries entering the lake, one outlet discharging into the Yangtze River”. Although the concept of “upstream, midstream, and downstream” is generally applied to river ecosystems, Dongting Lake exhibits a distinct longitudinal gradient in hydrological dynamics, sediment transport, and habitat types due to its close hydraulic connections with the Yangtze River and several inflowing rivers. To investigate spatial variation in fish communities along this gradient, the study area was divided into three functional zones based on hydrological connectivity, lacustrine geomorphology, and ecological function (Figure 1): the upstream zone (southwestern area, sites S1–S7), which is influenced by inputs from major tributaries; the midstream zone (central and eastern area, sites S8–S14), representing the main lentic water body of the lake; and the downstream zone (northeastern area, sites S15–S20), where lake water converges into the Yangtze River. These sampling sites were distributed along the main water body of the lake, spanning from upstream to downstream areas to cover major hydrological environmental gradients and typical fish habitats, including main channels and open waters. This spatial design ensures the representativeness of samples for capturing spatially heterogeneous fish communities and provides a robust framework for comparing the performance of eDNA technology and traditional fishing gear methods across different habitats and spatial scales.

2.2. Traditional Fishing Gear

Each sampling gear consisted of three trammel nets (each 80 m in length and 4 m in height, with mesh sizes of 3, 5, and 7 cm) and ten serial fish traps (each 18 m long, 0.3 m high, and 0.4 m wide). According to the actual situation, the relatively vertical and gentle position of the river bank was selected for sampling. The three trammel nets spanned the entire water section of the sampling point and could reach the river bottom directly from the water surface. The distance between adjacent units (including both trammel nets and fish traps) was set at 500 m. The use of this combination gear aimed to mitigate the inherent selectivity of single sampling methods, capturing a broader range of fish species with varying body sizes and behavioral characteristics. Among these, the three-layer gillnet with graduated mesh sizes targets small, medium, and large fish, respectively, thereby reducing sampling bias based on body size. The deployment of trap nets complements the gillnets by capturing benthic and structure-associated species that may evade gillnets due to cryptic habitats or active behavior. While this multi-gear approach provides a more comprehensive reflection of fish community structure than any single gear alone, we acknowledge that all fishing methods exhibit selectivity and capture only a subset of individuals within a population. Each net was set for 14 h, from 16:00 to 06:00 the next day. The captured fish samples were identified and classified by ichthyologists, primarily referencing the Fishes of China and the FishBase database. The species and quantities of fish were recorded, with all samples from each sampling site tallied on the same day. After completing species identification and measuring basic biological indicators—total length (cm), body length (cm), fork length (cm), and weight (g)—live fish were released back into the water.

2.3. eDNA Collection from Water

Water samples for eDNA analysis were collected from the same 20 sites and during the same period (12 April to 8 May 2024) as the traditional fishing gear survey, as shown in Figure 1. At each sampling site, we collected 5 L of surface water and 5 L of bottom water, mixed them together, then took 4.5 L and divided it into 3 parallel water samples (1.5 L each). That is, three parallel water samples were set for each sampling point. These parallel samples were used for DNA extraction and sequencing independently. When the data were summarized, the species detected by the parallel samples from the same sampling point were merged into a total species list to more fully represent the biodiversity of the sampling point. After collection, we collected eDNA on-site using the membrane filtration method with 0.45-micron glass fiber filters. Sampling and filtration equipment were sterilized by soaking them in a 10% disinfectant solution for 30 min. Additionally, 1 L of ultrapure water was set aside as a blank control. The filtered membranes were sealed in 5 mL amber centrifuge tubes and stored at −80 °C until eDNA extraction.

2.4. DNA Extraction and Amplification from Filters

In this study, genomic DNA was extracted from filters using the OMEGA E.Z.N.A.® Water DNA Kit (Omega Bio-tek, Norcross, GA, USA), following the manufacturer’s instructions. The extracted DNA was stored at –80 °C for subsequent analysis. After extraction, the quality of the DNA was assessed via 1% agarose gel electrophoresis to confirm its integrity and purity.
Polymerase chain reaction (PCR) was performed using the same overall reaction system and cycling conditions as described in [1], except that the annealing temperature was adjusted to 52.4 °C. The primers used for amplification were AcMDB07-F: 5′-GCCTATATACCGCCGTCG-3′ and AcMDB07-R: 5′-GTACACTTACCATGTTACGACTT-3′, targeting the 12S rRNA gene [25]. These primers exhibit both hypervariable and highly conserved regions, which enhance their capability to amplify fish environmental DNA (eDNA). PCR products were examined by 2% agarose gel electrophoresis for the presence of target bands. No amplification was observed in the PCR negative controls. The PCR products were purified using AMPure XP magnetic beads (Beckman Coulter, Brea, CA, USA).

2.5. High-Throughput Sequencing

Prior to sequencing, all libraries were quantified using a Qubit 4.0 Fluorometer (used with the Qubit™ dsDNA HS Assay Kit (Thermo Fisher Scientific, Waltham, MA, USA)) to ensure uniform cluster generation and high-quality sequencing output. Final sequencing was performed on the Illumina MiSeq ®™ platform (2 × 250 bp, paired-end sequencing) (San Diego, CA, USA) [26], with all libraries sequenced at equal concentrations. Sequences obtained from sequencing underwent preliminary screening using the DADA2 (version 1.28.0.) method for primer removal, quality filtering, denoising, pooling, and chimera removal. Operational Taxonomic Units (OTUs) were generated by clustering sequences at a threshold of ≥97% similarity. Representative sequences from each OTU were then taxonomically classified by performing sequence alignment against the NCBI database (https://www.ncbi.nlm.nih.gov/, accessed on 5 July 2024) [27]. Sequences with an alignment length of less than 90% were filtered out. Taxonomic assignments at the genus and species levels were assigned based on a sequence similarity threshold of ≥98%. The automated annotations were subsequently manually verified, and OTUs identified as non-fish were excluded from further analysis.

2.6. Cluster Analysis

The pheatmap package (version 1.0.12.) in R (version 4.3.2.) was used to generate a heatmap of species composition for each sampling site of both methods and to conduct Cluster analysis based on the Bray–Curtis distance to reveal differences in fish composition among sampling stations [27].

2.7. Alpha Diversity Analysis

Based on the OTU species count from eDNA technology and traditional fishing gear monitoring results, alpha diversity was analyzed using the vegan package (version 2.6.4.) in R [28]. This analysis included the Chao1 index ( S C h a o 1 ), Shannon–Wiener diversity index ( H ′), Simpson’s dominance index ( D ), species richness ( S ), ACE index, and Pielou index ( J ). Community diversity was assessed using the Shannon and Simpson indices. Species richness was estimated directly by the observed count and through the Chao1 and ACE estimators, and species abundance distribution evenness was quantified by the Pielou index. These indices were used to evaluate the species richness and diversity of fish at each site under both methods.
Alpha diversity analysis of the fish communities at each sampling site was conducted using the indices described above. To statistically quantify the differences in these diversity indices between eDNA technology and traditional fishing gear, we performed pairwise comparisons between the two groups for each index. Given that species abundance and diversity indices often violate the normality assumption required for parametric tests, the non-parametric Mann–Whitney U test (also known as the Wilcoxon rank-sum test) was employed. The significance level (α) for all statistical tests was set at 0.05. According to this criterion, a calculated p-value of less than 0.05 led to the rejection of the null hypothesis (which states that there is no significant difference in a given index between the two methods), allowing us to conclude that the observed inter-group difference was statistically significant.

2.8. Beta Diversity Analysis

Based on the Bray–Curtis distance, principal coordinate analysis (PCoA) and non-metric multidimensional scaling (NMDS) were performed using the vegan package in R to compare the community composition differences or similarities between the eDNA and traditional fishing gear monitoring results in the upstream, midstream, and downstream of Dongting Lake. To test for significant differences in community composition across locations, permutation multivariate analysis of variance (PERMANOVA) and analysis of similarities (ANOSIM) were employed [29].

3. Results

3.1. Comparison of Traditional Fishing Gear and eDNA Monitoring Results

3.1.1. Comparison of Fish Species Detected

A total of 82 fish species were identified using both eDNA and traditional fishing gear. Among them, 34 species were detected by both methods, while 21 species were exclusively detected by eDNA, including 10 rare fish species in Dongting Lake, such as Saurogobio gracilicaudatus, Glyptothorax sinense, Microphysogobio kiatingensis, Schistura incerta, and Hemibarbus labeo. Detailed species detections of the two methods at all 20 sampling sites are provided in Table S1.
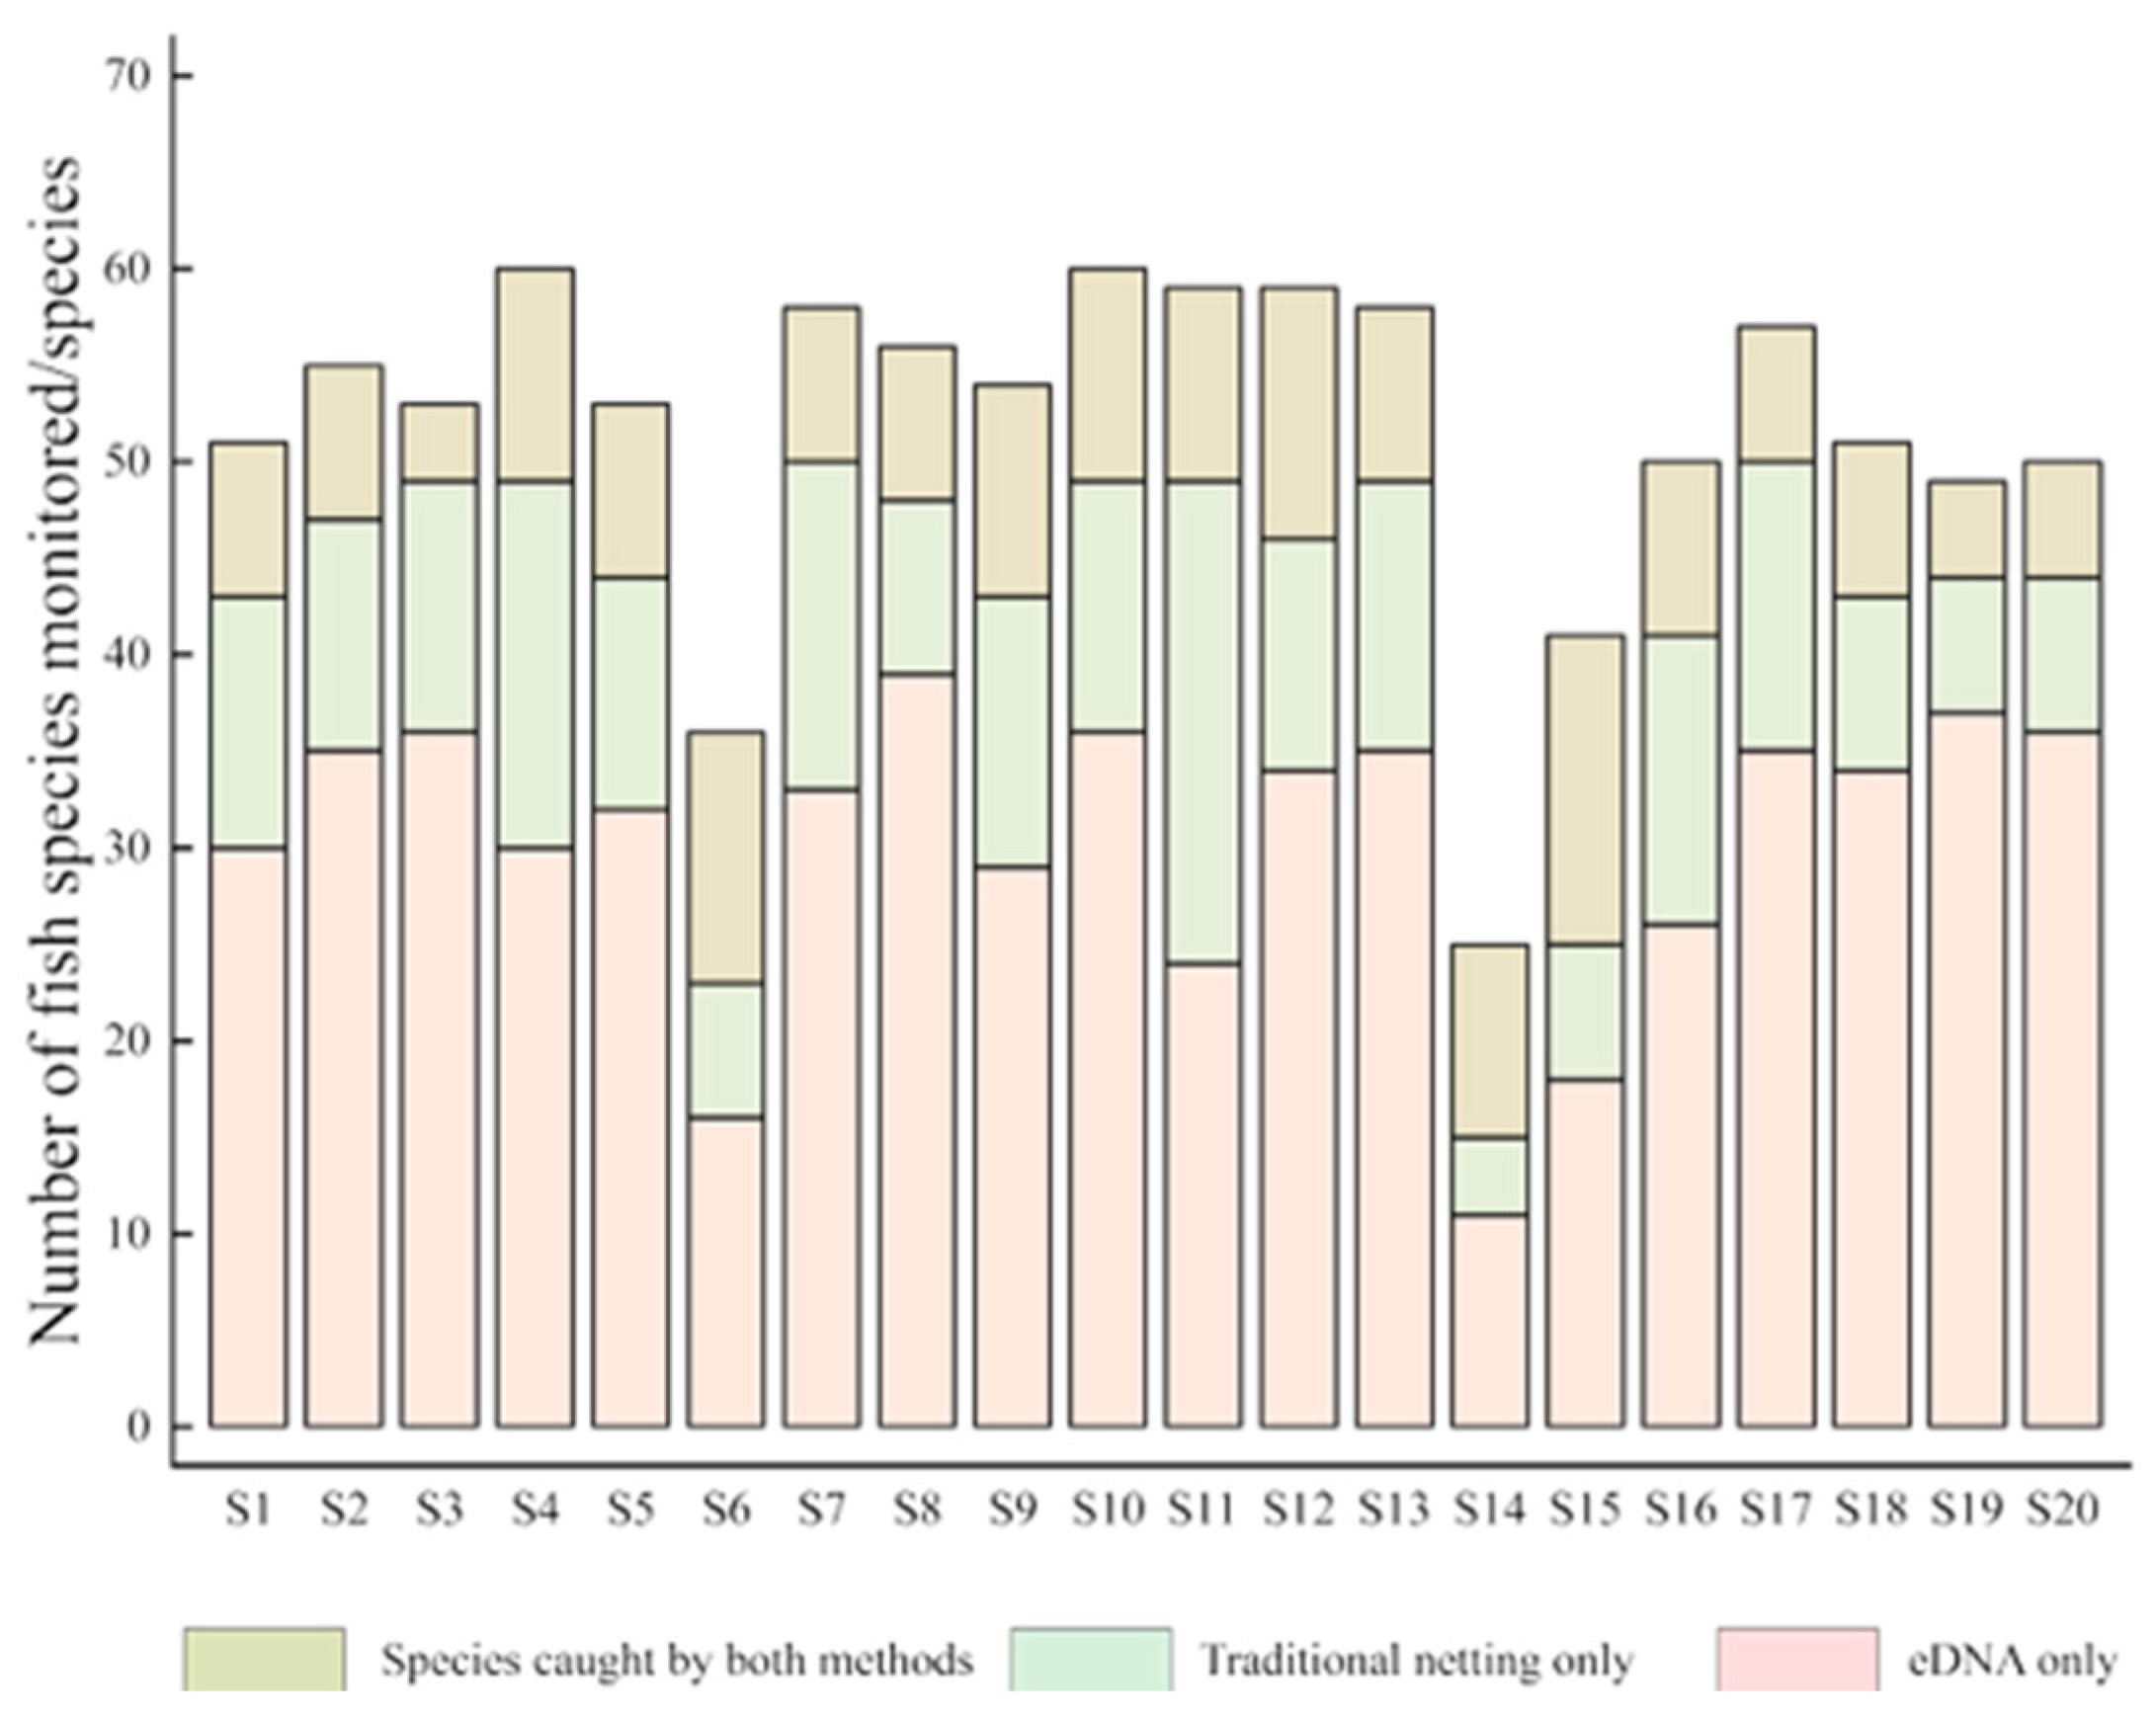
Based on the monitoring data of 20 sampling points, eDNA technology and traditional fishing gear showed significant differences in fish species detection (Figure 2). In terms of species number, eDNA technology detected more species at all sites (except site S14) (see Table S2). The eDNA monitoring detected an average of 42 fish species per site, which was much higher than the 21 species detected by the traditional fishing gear, showing the obvious advantages of eDNA technology in the number of species detected. From the perspective of spatial distribution pattern, the advantages of eDNA technology were particularly prominent in the middle and downstream sites. For example, in the downstream site S17, eDNA technology detected 51 species of fish, while traditional fishing gear detected only 22 species, and the difference was very obvious. At some upstream sites (e.g., S14), the number of species detected by the two methods was relatively close, indicating that there was a certain variation in the performance of the two methods in different water environments.
The in-depth analysis of the detected species composition further revealed the complementary characteristics of the two methods (Figure 2): At all sampling sites, the species detected only by eDNA constituted the main component of the total detected species, including Saurogobio gracilicaudatus and Glyptothorax sinense, which are not common in this water area and are difficult to capture by traditional fishing gear, reflecting the unique advantages of eDNA technology in detecting rare and hidden species. Species detected only by traditional fishing gear accounted for a considerable proportion in some specific sites (e.g., S11), reflecting that traditional methods still have irreplaceable monitoring value under specific environmental conditions. The species detected by the two methods were stable at all sites, forming a core species pool shared by the two monitoring methods, representing a widely distributed and large number of common species in the waters.
These results suggest that there are systematic differences in species detection ability and monitoring range between eDNA technology and the traditional fishing gear method. It is worth noting that the degree of this difference showed a regular change related to spatial location: from upstream to downstream, the advantage of eDNA technology in the number of species detected was gradually enhanced, which reflects the different response modes of the two monitoring methods to environmental heterogeneity.

3.1.2. Comparison of Species Composition of Sampled Fish

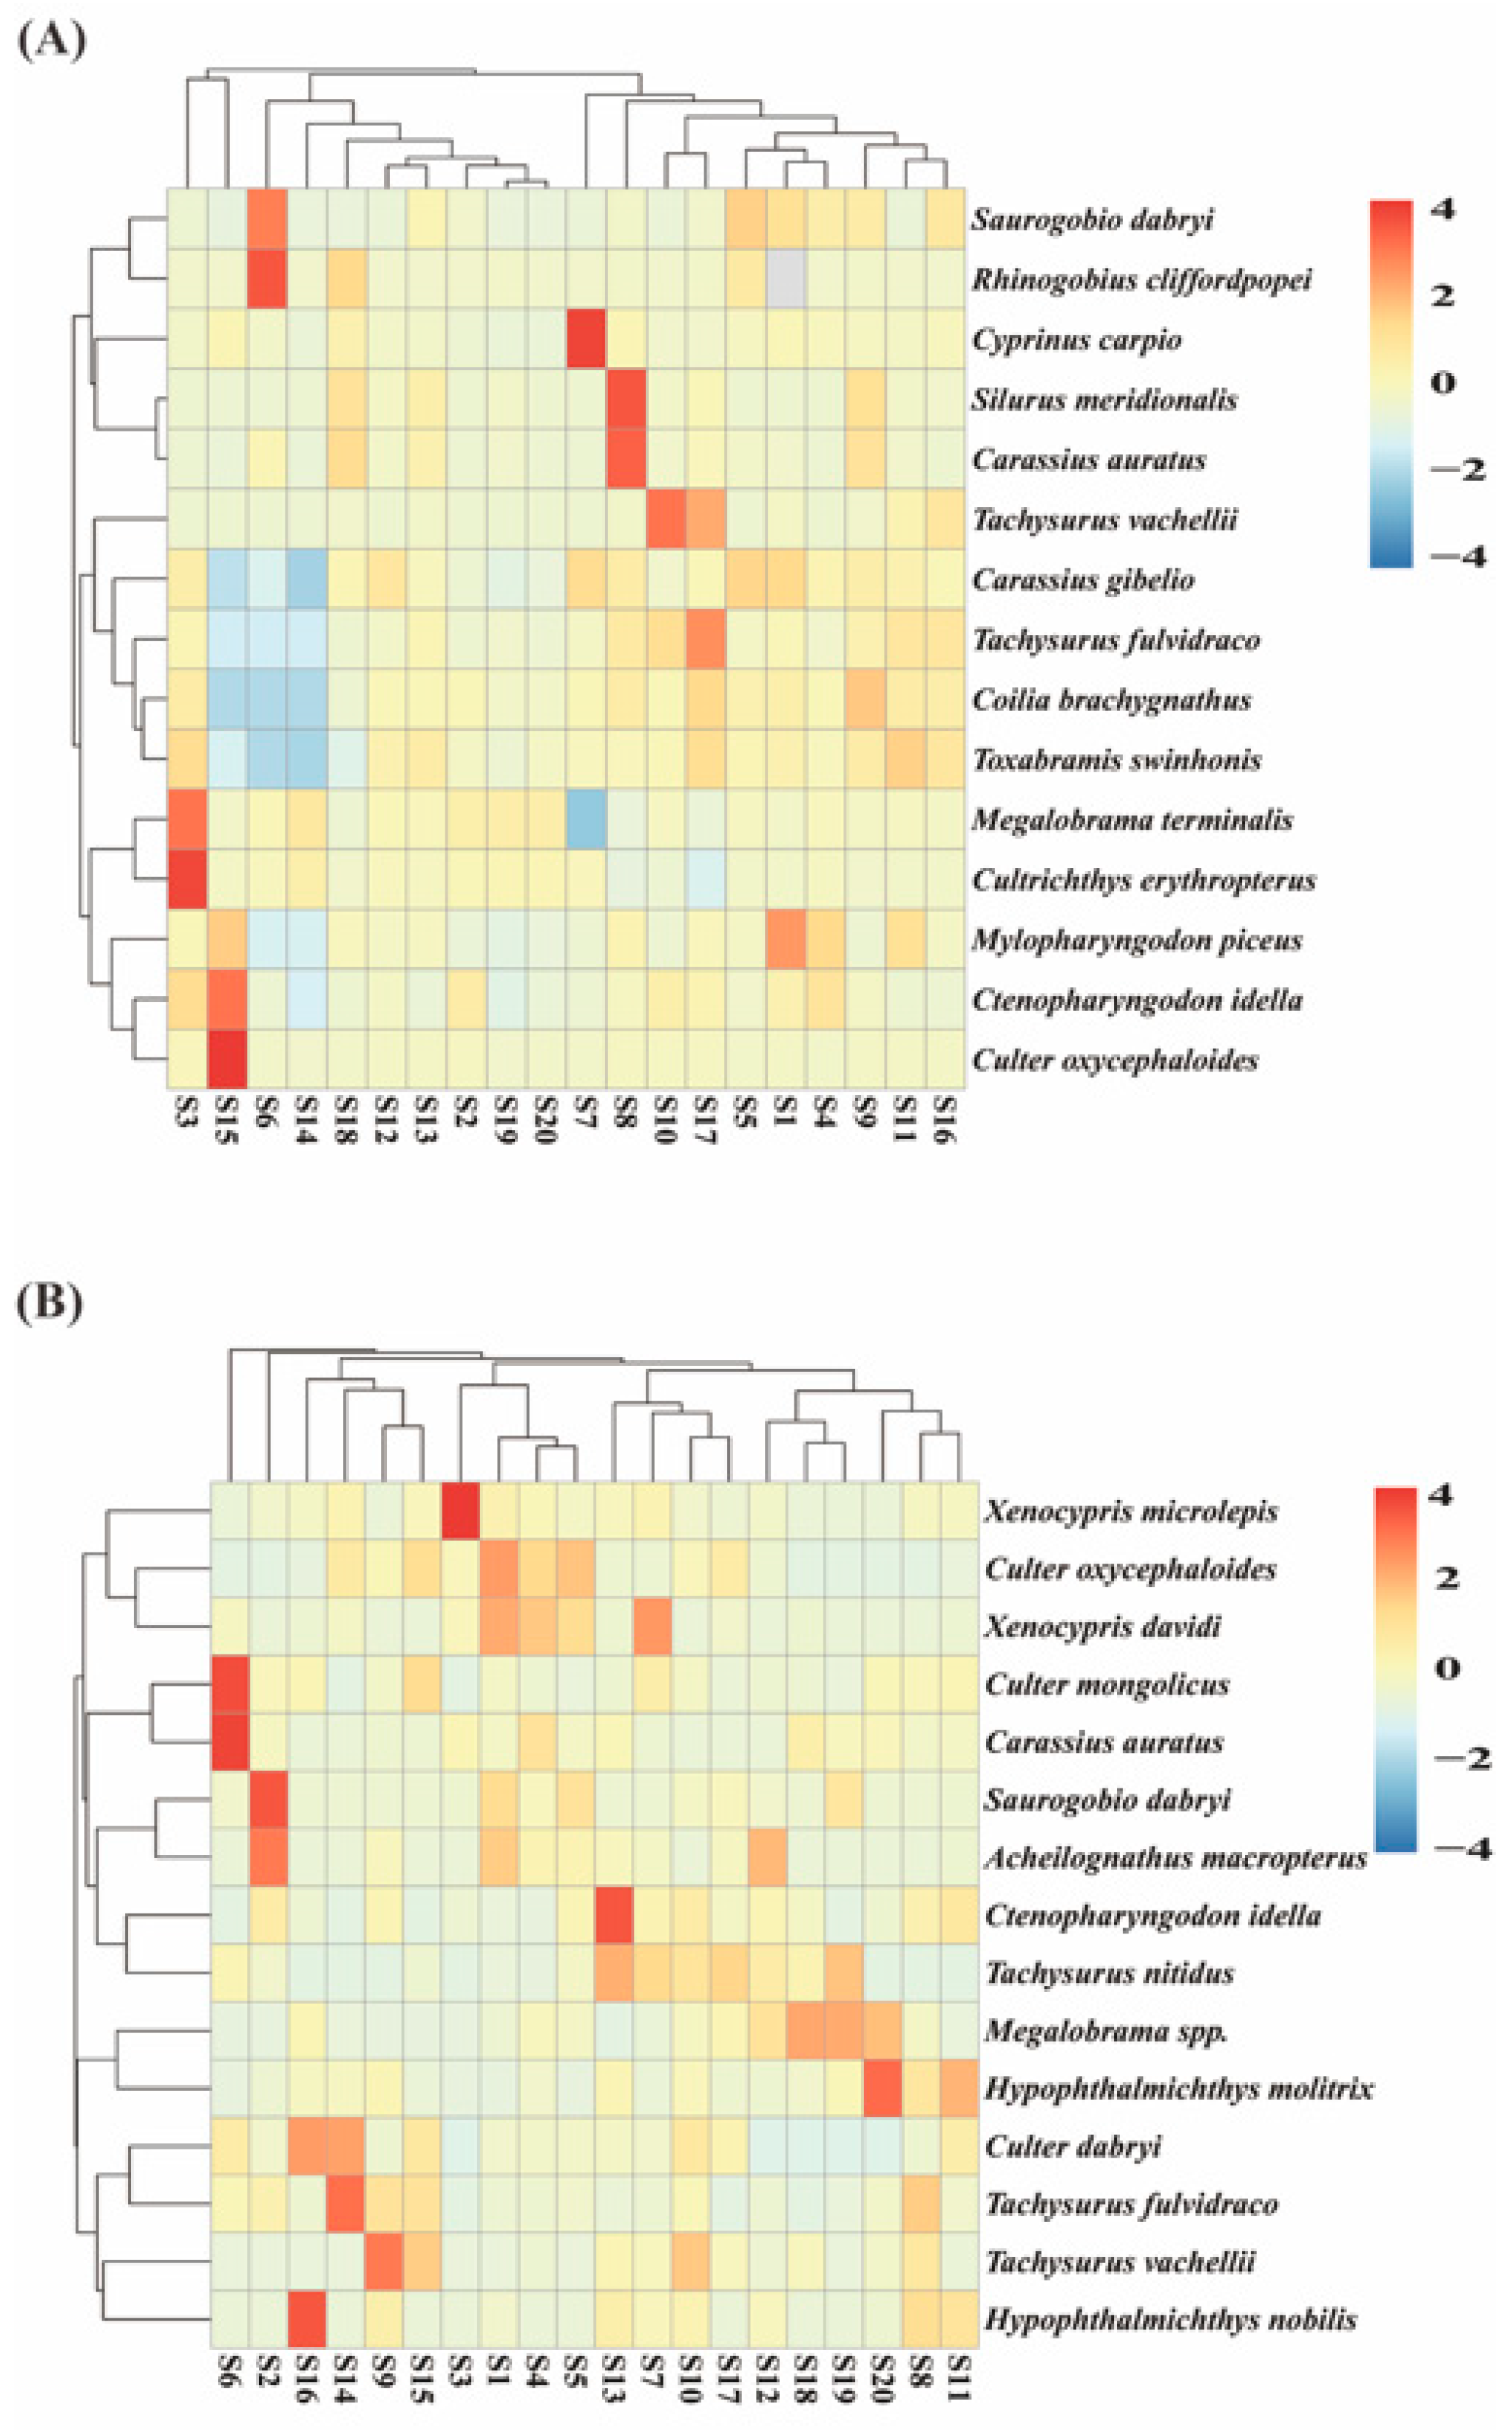
In order to explore the differences in the spatial distribution patterns of fish communities revealed by eDNA technology and traditional fishing gear, we performed cluster analysis on the community composition of 20 sites based on the Bray–Curtis distance and plotted heat maps. We aimed to investigate: (1) whether the spatial similarity patterns identified by the two methods were consistent; and (2) whether the combination and distribution of specific species could reflect their ecological habits. Interactive heatmaps were generated separately for fish composition obtained from eDNA technology and traditional fishing gear data. The clustering of eDNA results across the 20 sites (Figure 3A) showed that sites S19 and S20 shared the highest similarity. This indicates that the eDNA signal exhibited a high degree of spatial homogeneity in this region. From the species clustering perspective, Silurus meridionalis and Carassius auratuss were clustered together first and showed high relative abundance at site S8. This may imply that the two have a common preference for specific habitats (such as still water and eutrophic environment) at this site. In contrast, clustering results based on traditional fishing gear data (Figure 3B) indicated the greatest similarity between sites S4 and S5, showing that they had the most similar actual fish community composition. Species clustering showed that Saurogobio dabryi and Acheilognathus macropterus grouped closely together and showed high relative abundance at site S2. This may reflect that they have similar adaptability to the sediment habitats of water and sand.
The different clustering patterns between the two methods provide a preliminary visual indication for their different spatial resolutions and capture the complementary aspects of fish communities. The eDNA signal may integrate information on a wider spatial and temporal scale, while the traditional fishing gear capture more directly reflects the locally assembled community during sampling.

3.2. Analysis of Fish Species Diversity

3.2.1. Alpha Diversity Analysis Based on eDNA and Traditional Fishing Gear

Alpha diversity is commonly used by ecologists to quantify species diversity within communities and is vital for understanding the structure and function of local ecosystems. In this study, it was used to comprehensively assess the richness and diversity of fish species across different sampling sites. Boxplots were generated in R to compare the indices obtained from eDNA and traditional fishing gear. The average values of Chao1, Shannon index, Simpson index, species richness, ACE index, and Pielou index obtained via eDNA were 45.83, 1.13, 0.42, 44.7, 46.23, and 0.21, respectively (Figure 4). In comparison, traditional fishing gear yielded average values of 27.6, 2.42, 0.84, 21.45, 27.25, and 0.21 for the same indices (Figure 4). These data indicate that eDNA technology continued to show significantly higher values on the indices that mainly measure species richness (Chao1, species richness, ACE). This indicates that eDNA can detect more species at each sampling point, including those that are rare or difficult to capture. On the contrary, the traditional fishing gear produced significantly higher values on the Shannon index and the Simpson index. These indices are more complex than simple species counts; they are weighted measures that not only reflect how many species exist (richness), but also reflect the uniformity of individual distribution among these species (evenness). A community dominated by a few species has a lower Shannon index, while a community dominated by many species coexisting in similar numbers has a higher Shannon index [30]. Therefore, the higher Shannon and Simpson indices obtained by the traditional fishing gear indicate that the individual distribution among different species in the fish community was more balanced according to its data. The Pielou index, which measures the pure uniformity, was the same between the two methods, indicating that the fish data captured by the two methods had similar inhomogeneity. In summary, eDNA highlights more total species (richness), while traditional fishing gear data depict a community with higher overall diversity, which is driven by a more uniform distribution of individuals among the species it captures.

3.2.2. Beta Diversity Analysis Based on eDNA and Traditional Fishing Gear

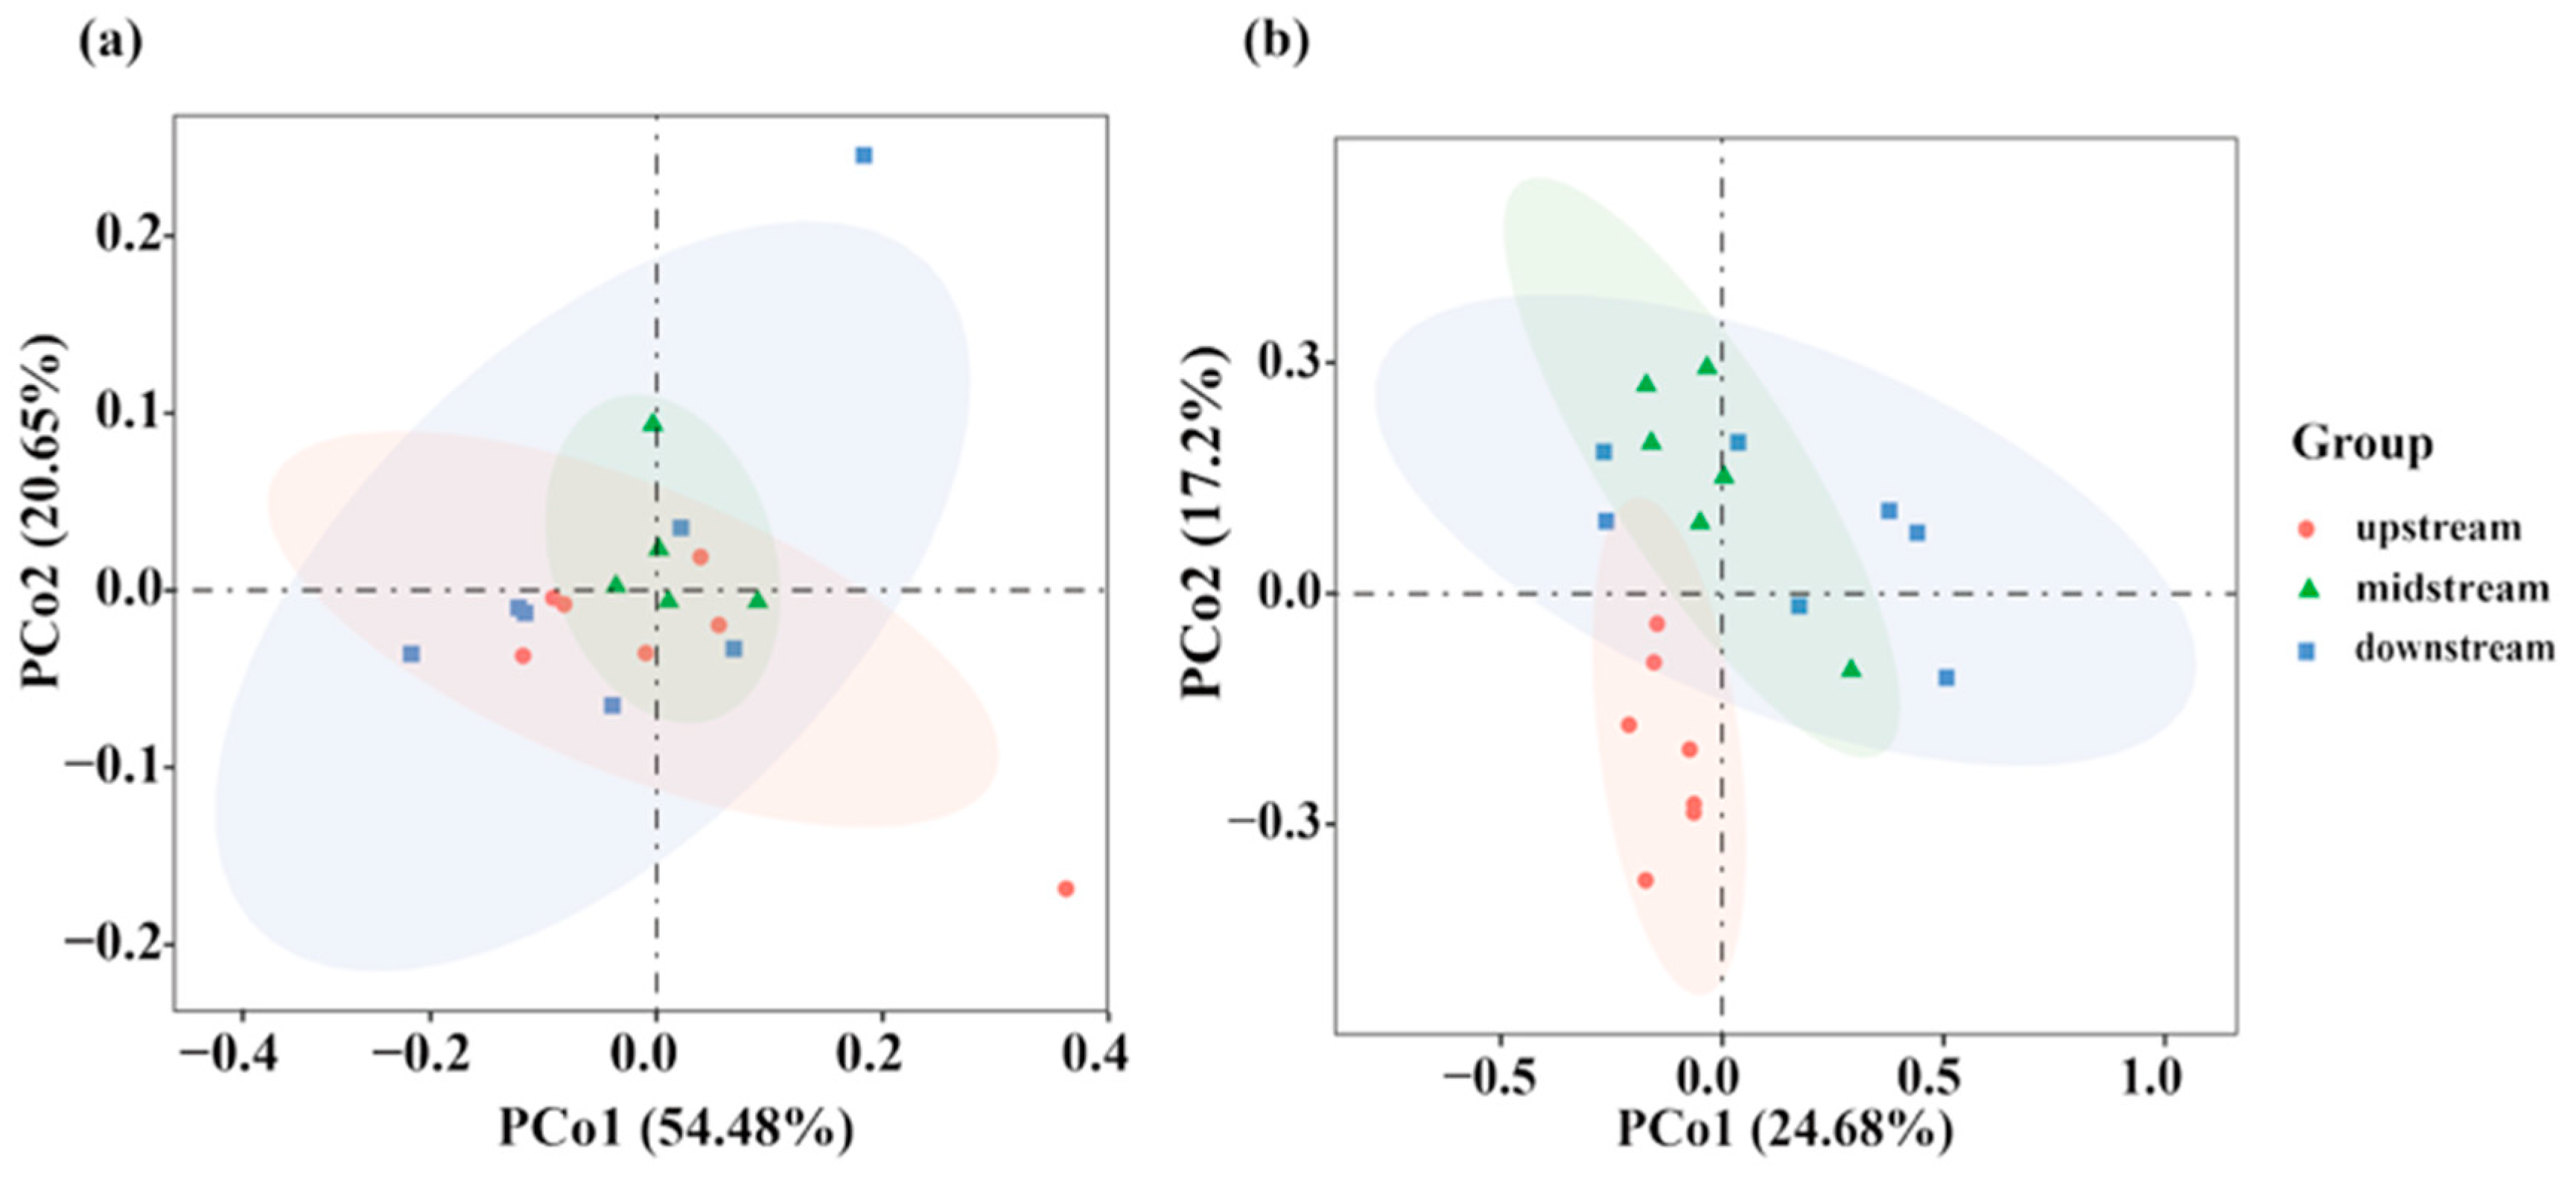
The PERMANOVA of variance of traditional fishing gear and eDNA technology showed that there were significant differences in the composition of fish caught by the two methods (R2 = 0.24, p = 0.001). The results of principal coordinate analysis (PCoA) showed that the fish community structure based on eDNA data was highly overlapped among the upper, middle, and lower reaches (Figure 5a). The first two principal coordinates (PCo1 and PCo2) together explained 75.02% of the total variance. This indicates that the fish community detected by e DNA technology showed a high degree of spatial homogeneity at the whole Dongting Lake area scale. The PERMANOVA test further confirmed this point, and the difference between the upstream and downstream regions was not significant (all p > 0.05), while the explanatory variance (R2) between the groups was low (Table 1). In sharp contrast, the PCoA results of traditional fishing gear data (Figure 5b) showed that the first two principal coordinates only explained 41.88% of the total variance, and the community in the upstream region showed a clear separation trend from the midstream and downstream regions. The PERMANOVA test showed that there were significant differences in community composition between upstream and midstream and upstream and downstream (p < 0.01), with higher inter-group explanatory variance (Table 2).
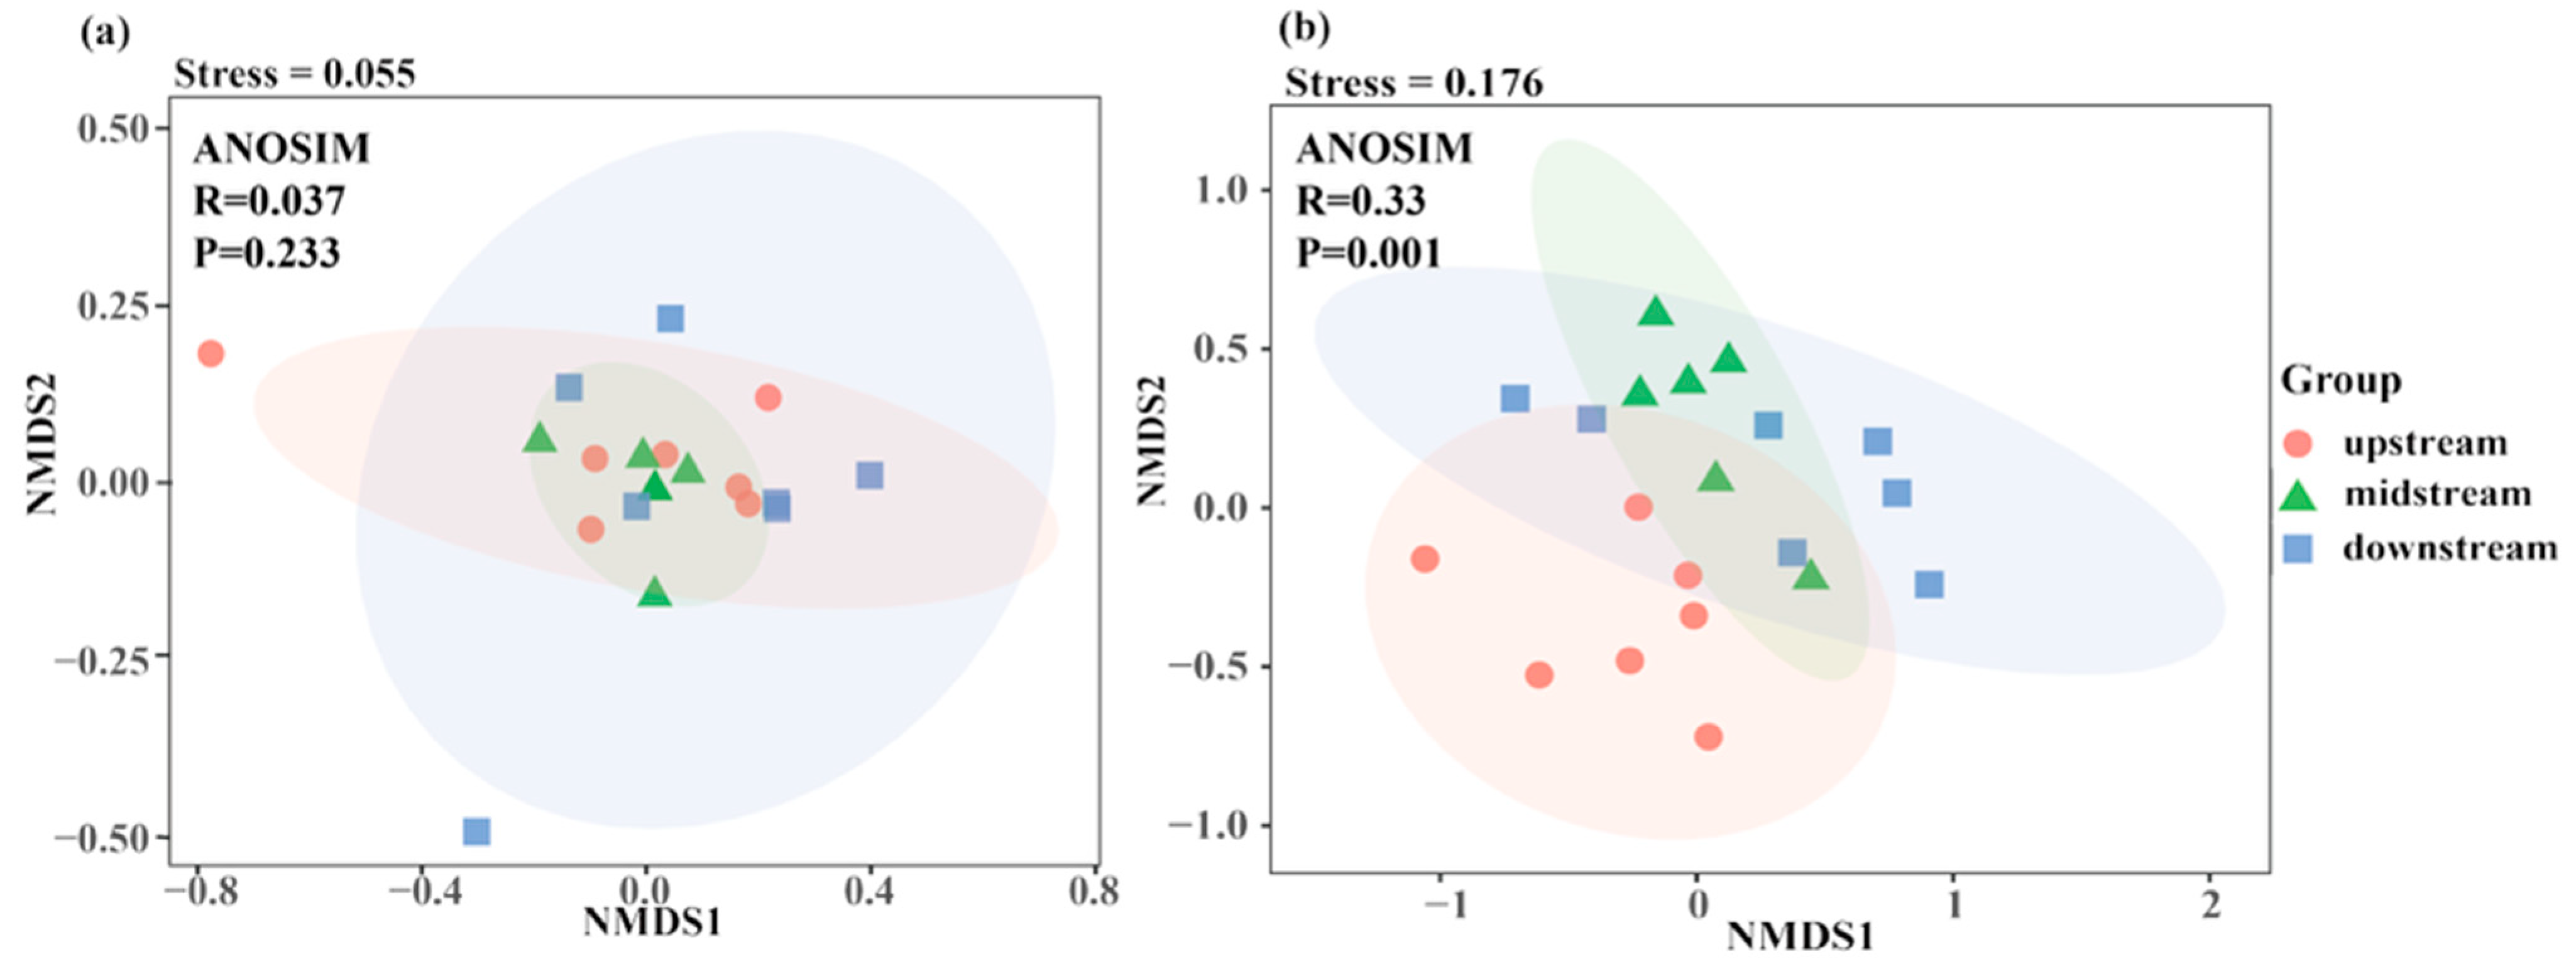
Non-metric multidimensional scaling (NMDS) based on the Bray–Curtis dissimilarity further validated the above spatial patterns. The NMDS plot of eDNA showed that the sample points in the three regions were highly clustered and overlapped (Figure 6a). ANOSIM analysis showed no significant difference between the groups (R = 0.037, p = 0.236). Its low stress value (Stress = 0.054) indicates that the sorting result is reliable (Figure 6a). On the contrary, the NMDS diagram of traditional fishing gear showed partial separation between groups (Figure 6b), and ANOSIM analysis confirmed that there were significant overall differences in upstream, midstream, and downstream communities (R = 0.33, p = 0.001). The Stress value of the analysis was 0.176, which is in the interpretable range (Figure 6b).
In summary, Beta diversity analysis showed that there was a significant difference in the spatial distribution pattern of the fish community in Dongting Lake revealed by eDNA technology and traditional fishing gear.

4. Discussion

4.1. Complementary Benefits of eDNA Metabarcoding and Traditional Fishing Gear in Species Detection

In order to put the results of this study into a broader ecological context, we compared the detected fish species list with the authoritative fish fauna records of Dongting Lake and the middle and lower reaches of the Yangtze River, especially with The Freshwater Fishes of Hunan Province [31] to verify the authenticity of the data. Our results demonstrate a marked complementarity between environmental DNA (eDNA) metabarcoding and traditional fishing gear in the fish diversity assessment of Dongting Lake. A key strength of eDNA metabarcoding lies in its capacity to detect rare or elusive species, or those species not selected by the fishing gear. In this study, ten uncommon species were missed by traditional fishing gear, including Saurogobio gracilicaudatus, Glyptothorax sinense, Microphysogobio tungtingensis, and Schistura incerta. This finding is consistent with a growing body of evidence highlighting the enhanced sensitivity of eDNA for detecting rare, small-bodied, or cryptically behaving organisms, attributable to its non-invasive nature and ability to capture trace genetic material in aquatic environments. However, among the 21 species detected exclusively by eDNA, Gobiobotia naktongensis and Gobiobotia pappenheimi are not historically recorded in Dongting Lake. Their extremely low read abundances suggest that these are likely false positives, potentially resulting from environmental or laboratory contamination or index hopping during sequencing [32], rather than true occurrences. In addition, insufficient resolution of the genetic marker for closely related species, or inaccuracies in reference sequence databases, could also contribute to misidentification [33]. Conversely, eDNA failed to detect 27 species captured by netting, underscoring current methodological constraints. These false negatives can be attributed to several factors: primer bias is a well-recognized limitation—although the 12S rRNA primers employed here provide broad taxonomic coverage, their amplification efficiency varies considerably across fish lineages, potentially failing to amplify certain taxa [34]. Furthermore, incomplete or inaccurate reference databases may lead to misassignment or a complete lack of classification, particularly for endemic species or those with unresolved taxonomic status [20]. Ecological processes governing eDNA dynamics—such as species-specific shedding rates, transport, and degradation in the water column—also play a critical role. Interspecific variation in eDNA release or rapid degradation under particular environmental conditions may further explain non-detections [21,35]. In order to further explore the potential factor of database integrity, we post-analyzed the sequence coverage of these undetected species in NCBI (https://www.ncbi.nlm.nih.gov/, accessed on 18 October 2024). The analysis showed that most species, such as Megalobrama amblycephala and Culter mongolicus, have reliable 12S rRNA gene reference sequences, and their missed detection is more likely to be attributed to technical limitations, such as primer preference, low release rate, or rapid degradation of eDNA in the environment, rather than the fundamental lack of reference data. However, we also found that a small number of native species or species with ambiguous taxonomic status had missing or poor-quality reference sequences. This finding is consistent with Miya [20] and Wang et al.’s [21] emphasis that the incompleteness of the reference database is a key bottleneck restricting the accuracy of eDNA technology. Therefore, future research should focus on the construction of local gene libraries for these specific groups and the submission of high-quality sequences to public databases. This initiative can not only improve the accuracy of eDNA in regional water monitoring, but also make an important contribution to the global biodiversity molecular monitoring network.
All in all, integrating the two approaches produces synergistic—rather than merely additive—benefits. Traditional fishing gear supplies crucial voucher specimens for ground-truthing eDNA signals, collecting vital biological data and improving local genetic databases. In turn, eDNA casts a broader and more sensitive “detection net”, substantially expanding our knowledge of aquatic biodiversity. This “traditional validation and eDNA exploration” paradigm offers a robust framework for efficient and minimally disruptive ecosystem monitoring, which holds particular relevance in the context of the fishing ban in the Yangtze River Basin.

4.2. Comparison of Fish Diversity Between Traditional Fishing Gear and eDNA Monitoring

Currently, many researchers are comparing eDNA monitoring results with traditional fishing gear to evaluate the potential of eDNA technology for monitoring biodiversity. The study of Wang Ruoxian et al. [36] in the Yangtze River Estuary showed that the Simpson index and Shannon index obtained by eDNA technology were significantly higher than those obtained by traditional fishing gear, and the results were in sharp contrast with the results of the Alpha diversity analysis in this study (Figure 4), which showed the opposite pattern. The difference in results may be attributed to the larger mesh size of the nets used in this study, which might have missed smaller fish species that were detected by eDNA. Additionally, the sampling points in this study were more concentrated. Furthermore, due to the limitations of mitochondrial sequences and incomplete reference databases, traditional fishing gear might be more effective than eDNA for certain fish species. In addition, the technical amplification process will affect the detectability of species: primer binding preference will cause false negatives [37]; the difference in the amplification efficiency of different sequences cannot truly reflect their biomass ratio in the environment [38]; random effects at low template concentrations [39], environmental PCR inhibitors [40], and an excessive number of amplification cycles [41] will further aggravate the uncertainty of the results. Some studies suggest that eDNA can persist in water for 72 h to 21 days [35], and its high sensitivity allows for the detection of extremely low DNA concentrations [42], reflecting fish diversity over time. In contrast, traditional fishing gear provides a snapshot of the fish community at a given moment and is less affected by molecular technical biases. Therefore, the difference between the two methods in species detection is not only on the time scale, but also fundamental, which is due to their very different working principles—one captures molecular traces and the other captures physical samples. Therefore, the fish community information provided by eDNA and traditional fishing gear is complementary rather than overlapping [43], and each method can detect the species missed by the other method.

4.3. Disparate Spatial Patterns of Fish Communities: A Methodological Perspective

In Dongting Lake, there was a significant difference between the spatial pattern of fish communities revealed by environmental DNA (eDNA) technology and traditional fishing gear, which highlights the far-reaching impact of methodological principles on the ecological structure. The eDNA data showed that fish communities in the upstream, midstream, and downstream regions showed a high degree of similarity. This is mainly due to the downstream transport and mixing effect of eDNA molecules in water [44]. The eDNA can spread over a considerable distance, which means that water samples collected from a specific site may integrate genetic signals from the upstream community. This process blurs the biological boundaries between different local habitats and presents a homogeneous view at the genetic data level, while the actual community may be heterogeneous [45]. In stark contrast, traditional fishing gear effectively captures significant community differences between upstream and midstream and downstream regions. This pattern is likely to reflect the real ecological structure driven by environmental filtering [46]. The upper reaches of the river have the characteristics of faster flow velocity, more rocky sediment, and a more dynamic hydrological situation, which screens out species (e.g., some loaches) that are more suitable for running water conditions. In contrast, stable, slow-flowing, sediment-rich habitats in the middle and lower reaches are more conducive to benthic or slow-water fish (e.g., crucian carp, carp) [47]. Traditional fishing gear provides a snapshot of the local instantaneous community collection by directly capturing individuals in specific habitats, thus sensitively revealing this environmentally driven spatial heterogeneity [48]. Therefore, the spatial information provided by these two methods is not contradictory, but complementary to each other, and they represent the ecological reality on different scales. eDNA provides an integrated watershed-scale perspective that reflects the potential distribution of species throughout the waters. Traditional fishing gear provides a high-resolution, local-habitat-scale empirical sample that records instantaneous species and their relative abundance. Combining the integrated watershed scale perspective of eDNA with the local validation data obtained by net fishing provides a powerful and multidimensional perspective for us to understand the multi-scale process of constructing fish communities [49].

4.4. Integrated Application of eDNA Technology and Traditional Fishing Gear

To more comprehensively and accurately assess fish diversity monitoring results, the combination of eDNA technology and traditional fishing gear method has been proven to be a more effective strategy. The two methods exhibit significant complementary strengths in species detection, spatial pattern exploration, and monitoring efficiency.
(1) Complementarity in species detection
eDNA technology, with its high sensitivity, is capable of effectively capturing rare species, small fish, or elusive species that are difficult to capture using traditional fishing gear [27]. For example, the detection rate of eDNA was significantly higher than that of the fyke net for low-abundance and hidden species such as Perca fluviatilis [50]. However, eDNA technology also has limitations, encompassing primer resolution, incomplete databases, or low DNA concentrations, which may lead to the failure to detect some species [51]. Traditional fishing gear can compensate for these shortcomings by providing the supplementary detection of species that may be missed by eDNA technology [7]. Furthermore, traditional fishing gear has advantages in estimating fish population abundance and health. By directly capturing fish specimens, it provides detailed information on species size, weight, and life stages, as well as allowing for the real-time monitoring of fish health—information that is difficult to obtain solely through eDNA technology [52].
(2) Synergy in spatial pattern analysis
In spatial pattern analysis, eDNA technology provides species distribution information across larger spatial scales and timeframes, while traditional fishing gear offers detailed data on species abundance and distribution patterns at specific sampling points [45]. For example, in the present study, eDNA technology showed overall community similarity, while traditional fishing gear detected significant community differences between the upstream and midstream to downstream areas. The combination of the two methods allows for the construction of a “global-local” dual-layer spatial analysis framework, providing a true representation of fish community spatial distribution patterns [53].
(3) Enhancement of monitoring efficiency and data integrity
The results of this study show that environmental DNA (eDNA) macrobarcoding technology has unique advantages in biodiversity survey due to its non-invasive, high sensitivity, and high efficiency. However, consistent with the current technical challenges documented in the literature, our study found that eDNA itself has limitations in generating reliable fish number indices and cannot be directly used for biomass estimation [54]. In addition, the species composition detected by eDNA is different from that detected by traditional fishing gear. Both methods can detect unique species that are not detected by each other, indicating that eDNA cannot yet be used as a comprehensive independent monitoring tool. Therefore, within an integrated monitoring framework, eDNA is a powerful tool for large-scale spatio-temporal monitoring [49], while traditional fishing gear remain crucial in field validation, obtaining biometric data, and detecting species that may not be adequately represented in eDNA surveys [55]. This synergy is particularly valuable in the context of the Yangtze River’s ten-year fishing ban, as such management policies emphasize low disturbance to ecosystems [56]. The combination of the two methods not only meets the key needs of low impact assessment, but also makes up for the inherent limitations of their respective methods, thus providing a more robust and comprehensive dataset. The integration strategy successfully promoted the fish diversity monitoring from the “single method” paradigm to the “multi-dimensional integration” paradigm. The transformation of this paradigm provides key theoretical and practical support for the realization of effective fish resource protection and ecological restoration.

5. Conclusions

This study revealed the complementarity of environmental DNA (eDNA) technology and traditional fishing gear in assessing fish diversity in Dongting Lake, and systematically answered the key issues raised in the early stage of the study: (1) eDNA technology showed higher sensitivity in the detection of rare species; (2) the two methods showed significant differences in α and β diversity: eDNA had higher species richness estimation, while traditional fishing gear could better reflect community uniformity and spatial heterogeneity between upstream and downstream regions; (3) eDNA effectively reflected the integrated community structure at the watershed scale while traditional fishing gear captured local habitat-specific groups; (4) combining the two methods, we can understand fish diversity and its distribution pattern more comprehensively, and integrate eDNA’s extensive and sensitive detection ability with the accurate and biologically informative sample data obtained by traditional fishing gear. In order to optimize future fish monitoring programs, we propose a collaborative monitoring framework: eDNA is suitable for large-scale, rapid biodiversity screening, especially for sensitive waters such as rare species detection and prohibited areas; traditional fishing gear is indispensable in verifying eDNA signals, obtaining morphological and health data, and assessing species abundance in key habitats. However, the existing methods still need to be optimized, including improving the reference database, establishing a standardized process for eDNA quantification, considering environmental factors affecting DNA persistence, and improving primer specificity to reduce false positives and false negatives. In summary, the integrated application of the two methods provides a reliable multi-dimensional solution for the monitoring and protection of fish resources in managed freshwater ecosystems such as Dongting Lake.

Supplementary Materials

The following supporting information can be downloaded at: https://www.mdpi.com/article/10.3390/w17223282/s1, Table S1: Presence–Absence of fish species across 20 sampling sites detected by eDNA metabarcoding and traditional fishing gear; Table S2: Comparison of fish species number detected by eDNA monitoring and traditional fishing gear at different sampling sites.

Author Contributions

Conceptualization, C.W. and Y.H.; formal analysis, Y.H.; investigation, C.W., X.L., W.S., D.L., Q.K., X.Y. (Xiping Yuan), X.Y. (Xin Yang) and Y.H.; resources, D.O. and G.Y.; data curation, Y.H.; funding acquisition, G.Y.; D.O. and H.Z.; writing—original draft preparation, Y.H.; writing—review and editing, C.W.; visualization, Y.H. All authors have read and agreed to the published version of the manuscript.

Funding

This research was funded by the Key Lab of Freshwater Biodiversity Conservation, Ministry of Agriculture and Rural Affairs of China (LFBC1005).

Data Availability Statement

The original contributions presented in this study are included in the article/Supplementary Materials. Further inquiries can be directed to the corresponding authors.

Acknowledgments

We appreciate the editors and the reviewers for their constructive suggestions and insightful comments, which helped to greatly improve this manuscript.

Conflicts of Interest

The authors declare no conflicts of interest.

References

  1. Zou, K.S.; Chen, J.W.; Ruan, H.T.; Li, Z.H.; Guo, W.J.; Li, M.; Liu, L. eDNA metabarcoding as a promising conservation tool for monitoring fish diversity in a coastal wetland of the Pearl River Estuary compared to bottom trawling. Sci. Total Environ. 2020, 702, 134704. [Google Scholar] [CrossRef]
  2. Turak, E.; Harrison, I.; Dudgeon, D.; Abell, R.; Bush, A.; Darwall, W.; Finlayson, C.M.; Ferrier, S.; Freyhof, J.; Hermoso, V.; et al. Essential Biodiversity Variables for measuring change in global freshwater biodiversity. Biol. Conserv. 2017, 213, 272–279. [Google Scholar] [CrossRef]
  3. Wang, J.M.; Tang, W.Q. Preliminary Investigation of Fish Diversity in Huayang River based on eDNA Technology. Int. J. Biol. Life Sci. 2024, 8, 22–27. [Google Scholar] [CrossRef]
  4. Deiner, K.; Bik, H.M.; Mächler, E.; Seymour, M.; Lacoursière-Roussel, A.; Altermatt, F.; Creer, S.; Bista, I.; Lodge, D.M.; de Vere, N.; et al. Environmental DNA metabarcoding: Transforming how we survey animal and plant communities. Mol. Ecol. 2017, 26, 5872–5895. [Google Scholar] [CrossRef] [PubMed]
  5. Hansen, B.K.; Bekkevold, D.; Clausen, L.W.; Nielsen, E.E. The sceptical optimist: Challenges and perspectives for the application of environmental DNA in marine fisheries. Fish Fish. 2018, 19, 751–768. [Google Scholar] [CrossRef]
  6. Thompson, L.R.; Thielen, P. Decoding dissolved information: Environmental DNA sequencing at global scale to monitor a changing ocean. Curr. Opin. Biotechnol. 2023, 81, 102936. [Google Scholar] [CrossRef]
  7. Shaw, J.L.A.; Clarke, L.J.; Wedderburn, S.D.; Barnes, T.C.; Weyrich, L.S.; Cooper, A. Comparison of environmental DNA metabarcoding and conventional fish survey methods in a river system. Biol. Conserv. 2016, 197, 131–138. [Google Scholar] [CrossRef]
  8. Padilla, D.K.; Williams, S.L. Beyond ballast water: Aquarium and ornamental trades as sources of invasive species in aquatic ecosystems. Front. Ecol. Environ. 2004, 2, 131–138. [Google Scholar] [CrossRef]
  9. Bertozzi, T.; Adams, M.A.; Walker, K.F. Species boundaries in carp gudgeons (Eleotrididae: Hypseleotris) from the River Murray, South Australia: Evidence for multiple species and extensive hybridization. Mar. Freshw. Res. 2000, 51, 805–815. [Google Scholar] [CrossRef]
  10. Shen, Y.J.; Zhou, X.X.; Zhang, Y.F.; Zhang, J.M.; Li, Q.H.; Chen, Q.L.; Liu, Z.H.; Li, Y.W.; Cheng, R.; Luo, Y. Important fish diversity maintenance status of the tributaries in a hotspot fish conservation area in the upper Yangtze River revealed by eDNA metabarcoding. Sci. Rep. 2024, 14, 24128. [Google Scholar] [CrossRef]
  11. Sigsgaard, E.E.; Nielsen, I.B.; Carl, H.; Krag, M.A.; Knudsen, S.W.; Xing, Y.C.; Holm Hansen, T.H.; Møller, P.R.; Thomsen, P.F. Seawater environmental DNA reflects seasonality of a coastal fish community. Mar. Biol. 2017, 164, 128. [Google Scholar] [CrossRef]
  12. Thomsen, P.F.; Willerslev, E. Environmental DNA–An emerging tool in conservation for monitoring past and present biodiversity. Biol. Conserv. 2015, 183, 4–18. [Google Scholar] [CrossRef]
  13. Ficetola, G.F.; Miaud, C.; Pompanon, F.; Taberlet, P. Species detection using environmental DNA from water samples. Biol. Lett. 2008, 4, 423–425. [Google Scholar] [CrossRef] [PubMed]
  14. Thomsen, P.F.; Kielgast, J.; Iversen, L.L.; Wiuf, C.; Rasmussen, M.; Gilbert, M.T.; Orlando, L.; Willerslev, E. Monitoring endangered freshwater biodiversity using environmental DNA. Mol. Ecol. 2012, 21, 2565–2573. [Google Scholar] [CrossRef]
  15. Munian, K.; Ramli, F.F.; Othman, N.; Mahyudin, N.A.A.; Sariyati, N.H.; Abdullah Fauzi, N.A.F.; Haris, H.; Ilham Norhakim, M.L.; Abdul Latiff, M.A.B. Environmental DNA metabarcoding of freshwater fish in Malaysian tropical rivers using short-read nanopore sequencing as a potential biomonitoring tool. Mol. Ecol. Resour. 2024, 24, e13936. [Google Scholar] [CrossRef]
  16. Cheng, R.L.; Luo, Y.; Li, Q.H.; Zhang, Y.F.; Liu, Z.H.; Chen, Q.L.; Li, Y.W.; Shen, Y.J. Application of eDNA metabarcoding for monitoring the fish diversity of the Jiangjin to Fuling section of the upper reaches of the Yangtze River. Hydrobiologia 2023, 850, 4067–4088. [Google Scholar] [CrossRef]
  17. Xu, N.; Chang, J. Preliminary Study on Fish Species Detection in the Middle and Lower Yangtze River Using Environmental DNA. J. Hydroecology 2016, 37, 49–55. [Google Scholar]
  18. Tong, Y.D.; Kuang, Z.; Liu, P.F.; Liang, Y.D.; Fan, Y.C.; Xu, D.P. Fish diversity in the Dongping Lake based on environmental DNA techniques. J. Fish. Sci. China 2023, 30, 1530–1542. [Google Scholar]
  19. Guo, N.; Shen, M.; Xiao, N.; Gao, X.; Guo, X.; Li, J. Distribution characteristics of autumn fish diversity in Chishui River based on environmental DNA metabarcoding technology. Acta Ecol. Sin. 2023, 43, 1676–1690. [Google Scholar] [CrossRef]
  20. Miya, M. Environmental DNA Metabarcoding: A Novel Method for Biodiversity Monitoring of Marine Fish Communities. Ann. Rev. Mar. Sci. 2022, 14, 161–185. [Google Scholar] [CrossRef]
  21. Wang, S.P.; Yan, Z.G.; Hänfling, B.; Zheng, X.; Wang, P.Y.; Fan, J.T.; Li, J.L. Methodology of fish eDNA and its applications in ecology and environment. Sci. Total Environ. 2021, 755, 142622. [Google Scholar] [CrossRef]
  22. Zhang, Y.Y.; Jin, S.G.; Wang, N.; Zhao, J.R.; Guo, H.W.; Pellikka, P. Total Phosphorus and Nitrogen Dynamics and Influencing Factors in Dongting Lake Using Landsat Data. Remote Sens. 2022, 14, 5648. [Google Scholar] [CrossRef]
  23. Fu, C.Z.; Wu, J.H.; Chen, J.K.; Wu, Q.H.; Lei, G.C. Freshwater fish biodiversity in the Yangtze River basin of China: Patterns, threats and conservation. Biodivers. Conserv. 2003, 12, 1649–1685. [Google Scholar] [CrossRef]
  24. Xu, N.; Xiong, M.H.; Shao, K.; Que, Y.F.; Li, J.Y. Preliminary Study on Environmental DNA Metabarcoding for Detecting Biodiversity in the Middle and Lower Reaches of the Yangtze River. Res. Environ. Sci. 2020, 33, 1187–1196. [Google Scholar]
  25. Bylemans, J.; Gleeson, D.M.; Hardy, C.M.; Furlan, E. Toward an ecoregion scale evaluation of eDNA metabarcoding primers: A case study for the freshwater fish biodiversity of the Murray–Darling Basin (Australia). Ecol. Evol. 2018, 8, 8697–8712. [Google Scholar] [CrossRef] [PubMed]
  26. Djurhuus, A.; Port, J.; Closek, C.J.; Yamahara, K.M.; Romero Maraccini, O.; Walz, K.R.; Goldsmith, D.B.; Michisaki, R.; Breitbart, M.; Boehm, A.B.; et al. Evaluation of Filtration and DNA Extraction Methods for Environmental DNA Biodiversity Assessments across Multiple Trophic Levels. Front. Mar. Sci. 2017, 4, 00314. [Google Scholar] [CrossRef]
  27. Lyu, S.; Tong, J.F.; Wu, J.H.; Wang, X.F.; Geng, X.Y.; Gao, C.X.; Wang, Y. Towards a comprehensive assessment of ichthyofaunal diversity in the Yangtze River estuary: Leveraging environmental DNA technology and bottom trawl surveys. Heliyon 2024, 10, e34761. [Google Scholar] [CrossRef]
  28. Stoeckle, M.Y.; Adolf, J.; Charlop Powers, Z.; Dunton, K.J.; Hinks, G.; VanMorter, S.M. Trawl and eDNA assessment of marine fish diversity, seasonality, and relative abundance in coastal New Jersey, USA. ICES J. Mar. Sci. 2020, 78, 293–304. [Google Scholar] [CrossRef]
  29. Somerfield, P.J.; Clarke, K.R.; Gorley, R.N. Analysis of similarities (ANOSIM) for 2-way layouts using a generalised ANOSIM statistic, with comparative notes on Permutational Multivariate Analysis of Variance (PERMANOVA). Austral Ecol. 2021, 46, 911–926. [Google Scholar] [CrossRef]
  30. Willis, A.D.; Martin, B.D. Estimating diversity in networked ecological communities. Biostatistics 2022, 23, 207–222. [Google Scholar] [CrossRef]
  31. Wu, Y.A.; Li, H.; Liao, F.; Yang, X.; Xie, Z.G. The Freshwater Fishes of Hunan Province; Science Press: Beijing, China, 2019; pp. 15–485. [Google Scholar]
  32. Macher, T.H.; Schütz, R.; Arle, J.; Beermann, A.J.; Koschorreck, J.; Leese, F. Beyond fish eDNA metabarcoding: Field replicates disproportionately improve the detection of stream associated vertebrate species. Metabarcoding Metagenom. 2021, 5. [Google Scholar] [CrossRef]
  33. Nakagawa, H.; Yamamoto, S.; Sato, Y.; Sado, T.; Minamoto, T.; Miya, M. Comparing local- and regional-scale estimations of the diversity of stream fish using eDNA metabarcoding and conventional observation methods. Freshw. Biol. 2018, 63, 569–580. [Google Scholar] [CrossRef]
  34. Charan Dixon, H.; Lamker, P.S.; Arvin-Blaauw, A.S.; Nokise, F.; Brons, J.K.; Ziebell, A.C.; Maathuis, M.A.M.; Tulp, I.; Eriksson, B.K. The molecularly and visually identified prey of fish in Dutch salt marshes. J. Sea Res. 2025, 208, 102634. [Google Scholar] [CrossRef]
  35. Troth, C.R.; Sweet, M.J.; Nightingale, J.; Burian, A. Seasonality, DNA degradation and spatial heterogeneity as drivers of eDNA detection dynamics. Sci. Total Environ. 2021, 768, 144466. [Google Scholar] [CrossRef] [PubMed]
  36. Wang, R.; Yang, G.; Geng, Z.; Zhao, F.; Feng, X.; Zhang, T. Application of environmental DNA technology in fish diversity analysis in the yangtze river estuary. Acta Hydrobiol. Sin. 2023, 47, 365–375. [Google Scholar]
  37. V. Wintzingerode, F.; Göbel, U.B.; Stackebrandt, E. Determination of microbial diversity in environmental samples: Pitfalls of PCR-based rRNA analysis. FEMS Microbiol. Rev. 1997, 21, 213–229. [Google Scholar] [CrossRef] [PubMed]
  38. Suzuki, M.T.; Giovannoni, S.J. Bias caused by template annealing in the amplification of mixtures of 16S rRNA genes by PCR. Appl. Environ. Microbiol. 1996, 62, 625–630. [Google Scholar] [CrossRef]
  39. Polz, M.F.; Cavanaugh, C.M. Bias in template-to-product ratios in multitemplate PCR. Appl. Environ. Microbiol. 1998, 64, 3724–3730. [Google Scholar] [CrossRef]
  40. Kontanis, E.J.; Reed, F.A. Evaluation of real-time PCR amplification efficiencies to detect PCR inhibitors. J. Forensic Sci. 2006, 51, 795–804. [Google Scholar] [CrossRef]
  41. Liu, W.H.; Saint, D.A. A New Quantitative Method of Real Time Reverse Transcription Polymerase Chain Reaction Assay Based on Simulation of Polymerase Chain Reaction Kinetics. Anal. Biochem. 2002, 302, 52–59. [Google Scholar] [CrossRef]
  42. Furlan, E.M.; Gleeson, D.; Hardy, C.M.; Duncan, R.P. A framework for estimating the sensitivity of eDNA surveys. Mol. Ecol. Resour. 2015, 16, 641–654. [Google Scholar] [CrossRef]
  43. Coble, A.A.; Flinders, C.A.; Homyack, J.A.; Penaluna, B.E.; Cronn, R.C.; Weitemier, K. eDNA as a tool for identifying freshwater species in sustainable forestry: A critical review and potential future applications. Sci. Total Environ. 2019, 649, 1157–1170. [Google Scholar] [CrossRef]
  44. Jeunen, G.J.; Knapp, M.; Spencer, H.G.; Lamare, M.D.; Taylor, H.R.; Stat, M.; Bunce, M.; Gemmell, N.J. Environmental DNA (eDNA) metabarcoding reveals strong discrimination among diverse marine habitats connected by water movement. Mol. Ecol. Resour. 2019, 19, 426–438. [Google Scholar] [CrossRef]
  45. Li, Z.Y.; Jiang, P.W.; Wang, L.X.; Liu, L.; Li, M.; Zou, K.S. A comparison of seasonal composition and structure of fish community between environmental DNA technology and gillnetting in the Pearl River Estuary, China. Ecol. Indic. 2023, 147, 109915. [Google Scholar] [CrossRef]
  46. Yuan, X.P.; Yang, X.; Ge, H.Z.; Li, H.; Deng, D.Q. Temporal Distribution of Fish Community Structure in Dongting Lake Estuary. Agric. Sci. 2019, 10, 294–301. [Google Scholar] [CrossRef]
  47. Cai, L.; Shi, L.L.; Guan, L.; Zhou, Y.; Jing, L.; Lei, G.C. Potential Impacts of Proposed Chenglingji Hydraulic Project on Wetlands in Dongting Lake. Wetl. Sci. 2018, 16, 377–392. [Google Scholar]
  48. Ji, F.F.; Shen, J.Z.; Zhang, W.Q.; Yan, S.H.; Shan, B.Q.; Zha, J.M. Discriminating spatiotemporal heterogeneity and environmental drivers of fish assemblages using environmental DNA metabarcoding in mosaic habitat ecosystems. Sci. Rep. 2025, 15, 15705. [Google Scholar] [CrossRef] [PubMed]
  49. Valentini, A.; Taberlet, P.; Miaud, C.; Civade, R.; Herder, J.; Thomsen, P.F.; Bellemain, E.; Besnard, A.; Coissac, E.; Boyer, F.; et al. Next-generation monitoring of aquatic biodiversity using environmental DNA metabarcoding. Mol. Ecol. 2016, 25, 929–942. [Google Scholar] [CrossRef]
  50. Hinlo, R.; Furlan, E.; Suitor, L.; Gleeson, D. Environmental DNA monitoring and management of invasive fish: Comparison of eDNA and fyke netting. Manag. Biol. Invasions 2017, 8, 89–100. [Google Scholar] [CrossRef]
  51. Naputo, C.F.P.; Isowa, Y.; Gerona-Daga, M.E.; Artigas, M.D.; Kajita, T.; Salmo Iii, S.G. Application of eDNA metabarcoding in the assessment of fish biodiversity in Philippine mangroves: Challenges and opportunities. Reg. Stud. Mar. Sci. 2024, 77, 103642. [Google Scholar] [CrossRef]
  52. Qin, C.X.; Zuo, T.; Yu, G.; Zhou, W.l.; Li, C.H. Advances in research of environmental DNA (eDNA) in biomass assessment of aquatic ecosystems. South China Fish. Sci. 2020, 16, 123–128. [Google Scholar]
  53. Yang, C. Fish Community Pattern and Influencing Factors of the Yangtse River Basin; Xi’an University of Technology: Xi’an, China, 2021. [Google Scholar]
  54. Lacoursière Roussel, A.; Rosabal, M.; Bernatchez, L. Estimating fish abundance and biomass from eDNA concentrations: Variability among capture methods and environmental conditions. Mol. Ecol. Resour. 2016, 16, 1401–1414. [Google Scholar] [CrossRef]
  55. Hänfling, B.; Lawson Handley, L.; Read, D.S.; Hahn, C.; Li, J.; Nichols, P.; Blackman, R.C.; Oliver, A.; Winfield, I.J. Environmental DNA metabarcoding of lake fish communities reflects long-term data from established survey methods. Mol. Ecol. 2016, 25, 3101–3119. [Google Scholar] [CrossRef]
  56. Wang, S.Y.; Xiong, Y.; Zhang, H.S.; Song, D.D.; Wang, Y.P.; Ge, H.; Zhang, C.B.; Liang, L.; Zhong, X.M. Recovery of Coilia nasus resources after implementation of the 10-year fishing ban in the Yangtze River: Implied from the Yangtze River Estuary and its adjacent sea areas. Front. Mar. Sci. 2024, 11, 1474996. [Google Scholar] [CrossRef]
Figure 1. eDNA and traditional fishing gear sampling sites in Dongting Lake and its adjacent waters.
Water 17 03282 g001
Figure 2. Comparison of fish species number detected by eDNA monitoring and traditional fishing gear at different sampling sites (S1–S20: 20 different sampling sites).
Water 17 03282 g002
Figure 3. Interactive heatmap of fish community composition in Dongting Lake detected using eDNA technology (A) and traditional fishing gear (B). Horizontal axis: Sampling site codes; Vertical axis: Taxonomic units; Color gradient from blue to red indicates increasing abundance of each genus in the corresponding sample.
Water 17 03282 g003
Figure 4. Alpha diversity analysis of fish communities in Dongting Lake based on (a) Chao1 index; (b) Shannon index; (c) Simpson index; (d) species richness; (e) ACE index, and (f) Pielou index. *** p < 0.001.
Water 17 03282 g004
Figure 5. Principal coordinate analysis (PCoA) of fish community composition based on (a) eDNA and (b) traditional fishing gear data. The ellipse represents the 95% confidence region of each geographical group (upstream, midstream, and downstream) to show the multivariate dispersion and overlap of community composition among samples in the group.
Water 17 03282 g005
Figure 6. NMDS analysis of fish community differences among upstream, midstream, and downstream regions in Dongting Lake based on eDNA (a) and traditional fishing gear (b). The ellipse represents the 95% confidence region of each group, showing the distribution variability and grouping of each group of samples. The stress value represents the goodness of fit of the ranking results; the lower the value, the more reliable the representation of multidimensional data in two-dimensional space.
Water 17 03282 g006
Table 1. PERMANOVA test results for the upstream, midstream, and downstream groups based on eDNA data.
Statistical Values
R2p
Upstream-midstream0.09180.313
Upstream-downstream0.05790.568
Upstream-downstream0.06030.595
Table 2. PERMANOVA test results for upstream, midstream, and downstream groups based on traditional fishing gear data.
Statistical Values
R2p
Upstream-midstream0.21870.005
Upstream-downstream0.20140.001
Upstream-downstream0.13730.109
Disclaimer/Publisher’s Note: The statements, opinions and data contained in all publications are solely those of the individual author(s) and contributor(s) and not of MDPI and/or the editor(s). MDPI and/or the editor(s) disclaim responsibility for any injury to people or property resulting from any ideas, methods, instructions or products referred to in the content.