Article

Hydrogeochemical Characterization, Processes, and Water Quality Assessment of Groundwater in an Agricultural Reclamation Area of the Sanjiang Plain, China

1
School of Nursing, Zhoukou Vocational and Technical College, Zhoukou 466000, China
2
Center for Hydrogeology and Environmental Geology Survey, China Geological Survey, Tianjin 300309, China
*
Author to whom correspondence should be addressed.
Water 2025, 17(22), 3257; https://doi.org/10.3390/w17223257
Submission received: 21 July 2025 / Revised: 10 November 2025 / Accepted: 12 November 2025 / Published: 14 November 2025

Abstract

Understanding groundwater quality and its controlling mechanisms is vital for the sustainable use of water resources in agriculturally intensive regions. This study evaluates the hydrochemical characteristics, controlling geochemical processes, and overall water quality of 226 groundwater samples collected from a typical agricultural reclamation area in the Sanjiang Plain, northeastern China. Major ion compositions indicate that groundwater is predominantly of the Ca–HCO3 type, with bicarbonate, calcium, and magnesium as the dominant constituents. Spatial and statistical analyses reveal that rock weathering—particularly the dissolution of carbonates and silicates—is the primary natural process influencing groundwater chemistry, while cation exchange contributes moderately. Anthropogenic inputs, especially from fertilizers, livestock waste, and wastewater discharge, were found to elevate concentrations of NO3, Cl, and SO42− in localized zones. The entropy-weighted water quality index (EWQI) was applied to assess overall groundwater suitability. Results show that 89.8% of samples fall into “excellent” or “good” categories, though 6.6% of samples indicate poor to very poor water quality. This study identified the hydrochemical characteristics, sources of substances, and water quality of groundwater in the reclamation area, providing a basis for scientific prevention and control, rational utilization, and protection of groundwater resources.

1. Introduction

Groundwater, as the largest reservoir of freshwater on Earth, serves as a critical resource supporting human survival, agricultural productivity, economic development, and ecosystem stability globally [1,2,3,4,5]. With accelerating population growth and intensified industrial and agricultural activities worldwide, groundwater resources have increasingly faced severe environmental pressures, manifesting as declining water quality and heightened contamination risks. Consequently, the effective assessment, protection, and sustainable management of groundwater resources have become critical issues drawing considerable global attention [6,7,8].
Groundwater quality degradation primarily arises from both natural processes, including geochemical interactions between water and geological formations, and anthropogenic activities, notably excessive application of fertilizers, domestic sewage discharge, and livestock farming practices [9,10,11]. These activities contribute significantly to elevated concentrations of nitrates, ammonium, and other contaminants in groundwater systems, posing potential health hazards to human populations [12,13]. Previous studies indicate nitrate and ammonium contamination as prominent water quality concerns, with significant adverse health effects reported in various populations, especially vulnerable groups like infants and children [11,14,15].
The Sanjiang Plain, located in northeastern China, is an ecologically sensitive region and a crucial grain production base. This region has experienced significant environmental impacts associated with intensive agricultural practices, which potentially affect groundwater quality through fertilizer overuse and livestock farming activities. Previous research conducted in portions of the Sanjiang Plain indicated substantial nitrate and ammonium contamination, resulting in groundwater quality frequently falling within Classes IV and V, representing significant degradation and potential health risks [16].
However, despite its strategic ecological and agricultural significance, the detailed linkage between groundwater quality variations and agricultural practices in the Sanjiang Plain remains inadequately explored. Specifically, comprehensive spatial assessments and robust evaluations of health risks associated with groundwater contamination are lacking [17,18,19,20,21]. Addressing these research gaps, this study systematically examines groundwater chemical characteristics and spatial variations within a representative agricultural reclamation area in the Sanjiang Plain. By employing integrated analytical approaches—including ion ratio analysis, correlation analysis, principal component analysis, geographic information systems (GIS), and entropy-weighted water quality indexing (EWQI)—this research aims to clearly identify primary contamination sources, characterize the spatial distribution of groundwater quality, and evaluate associated human health risks. The research results provide data support for the prevention and control of groundwater pollution in agricultural reclamation areas.

2. Materials and Methods

2.1. Study Area

The Sanjiang Plain, located in northeastern Heilongjiang Province, China (Figure 1a), is formed by the alluvial and diluvial deposits of the Heilongjiang, Ussuri, and Songhua rivers. It represents China’s largest marshland ecosystem, covering approximately 10.89 × 10⁴ km2. Renowned for its fertile soils, the region yields an annual grain production of about 15 million tons, making it a critical grain-producing base in China. The specific research area of this study is situated in the eastern Sanjiang Plain (Figure 1b). Covering an area of approximately 7800 km2 and with a population of around 70,000, this region is predominantly agricultural, focusing heavily on grain cultivation. Land-use patterns are primarily composed of paddy fields (over 60%), supplemented by dryland farming, forestry, and grasslands [22]. Livestock farming of cattle, sheep, and pigs also occurs near wetland and forest areas, with animal waste commonly disposed of around these localities [23]. The region has a humid to semi-humid continental monsoon climate, with annual precipitation of 500–550 mm and a mean annual temperature of 1.3–3.9 °C—values at the cold limit of the temperate zone. Ground freezing typically lasts around 190 days per year, with freeze depths ranging from 1.4 to 2.0 m [24]. Recharge of groundwater predominantly originates from atmospheric precipitation infiltration, supplemented by irrigation seepage and lateral recharge [25,26]. The primary discharge pathways are anthropogenic extraction, lateral runoff, and minor evaporative losses. During flood seasons, localized recharge from river surface water can occur, while groundwater discharges into rivers during dry periods [27,28].
Topographically, the area inclines gradually from west to east, featuring alluvial plains, river terraces, and expansive marshlands along river floodplains. Bedrock outcrops, primarily sandstone, limestone, basalt, and granite, are exposed in the eastern and northwestern upland regions. In the study area, no salt rock and sulfide ore spots are exposed. Groundwater from Quaternary aquifers serves as the primary source of drinking and irrigation water (Figure 1c). The aquifer systems are mainly characterized by pre-Quaternary bedrock single-layer structures and clay-dominated dual-layer porous structures of the low plains. The Quaternary strata predominantly comprise fluvial alluvium overlain extensively by silty clay, cohesive soil, and gravelly soils. The porous groundwater in unconsolidated sediments represents the most extensive groundwater type within the region, while bedrock fissure water distribution is limited and typically less productive. The abundant groundwater resources, hosted predominantly in silty sands and fine sands with aquifer thicknesses ranging from 50 to 250 m, provide favorable natural conditions for sustainable groundwater extraction and utilization (Figure 1c).

2.2. Sample Collection and Analysis

A total of 226 groundwater samples were collected during three sampling campaigns conducted in September 2022, July 2023, and July 2024. The spatial distribution of sampling points is illustrated in Figure 1. Groundwater samples were obtained from depths ranging between 2.1 and 27.8 m, predominantly sourced from Quaternary unconsolidated porous aquifers. Prior to sampling, groundwater was pumped for at least 10 min to ensure representative samples. In situ measurements, including pH, Eh, and total dissolved solids (TDSs), were performed using a portable multiparameter water quality analyzer (HQ2200, HACH Company, Loveland, CO, USA). Samples intended for cation analysis were acidified using nitric acid to achieve a pH below 2. All groundwater samples were strictly collected, preserved, and transported in accordance with the Technical Specifications for Groundwater Environmental Monitoring (HJ164—2020) [29] and analyzed following the Standard Examination Methods for Drinking Water (GB5750—2006) [30]. The water chemistry tests were performed by the Hydrogeology and Environmental Geology Detection Center of Ministry of Natural Resources. Cation concentrations (Na+, K+, Ca2+, Mg2+) were measured using a flame atomic absorption spectrometer (ContrAA300, Analytik Jena AG, Jena, Germany). Anions including Cl, NO3, and SO42− were determined using ion chromatography (883i, Metrohm AG, Herisau, Swiss). Concentrations of HCO3 and CO32− were obtained through titration with hydrochloric acid. NH3-N was quantified using colorimetry (TU/1901 Beijing Purkinje General Instrument Co., Ltd., Beijing, China). Total hardness (TH) was calculated via titration using disodium ethylenediaminetetraacetic acid (EDTA). All measurements maintained a relative standard deviation of less than 10%, ensuring data reliability and precision.

2.3. Entropy-Weighted Water Quality Index (EWQI)

The entropy-weighted water quality index (EWQI) is an improved evaluation method that objectively assesses water quality by reducing subjective bias in determining the significance of individual water quality parameters. Unlike traditional indices, EWQI uses information entropy to quantify the disorder or uncertainty inherent in parameter distributions, thereby assigning unbiased weights [31,32]. The WQI was calculated using the following Equation (1). There, wi is the weight of each parameter, while Ci and Si denote the measured concentration and the standard reference value of each parameter, respectively. The estimated EWQI values were used to categorize groundwater quality into five levels: ‘Excellent’ for values under 50, ‘Good’ between 50 and 100, ‘Moderate’ from 100 to 150, ‘Poor’ between 150 and 200, and ‘Extremely Poor’ for values exceeding 200. Groundwater samples categorized as “Excellent” or “Good” are deemed suitable for drinking purposes.
W Q I = i = 1 n w i i n w i   ×   C i S i   ×   100

3. Results and Discussion

3.1. General Hydrogeochemical Characteristics

3.1.1. Chemical Composition Characteristics of Groundwater

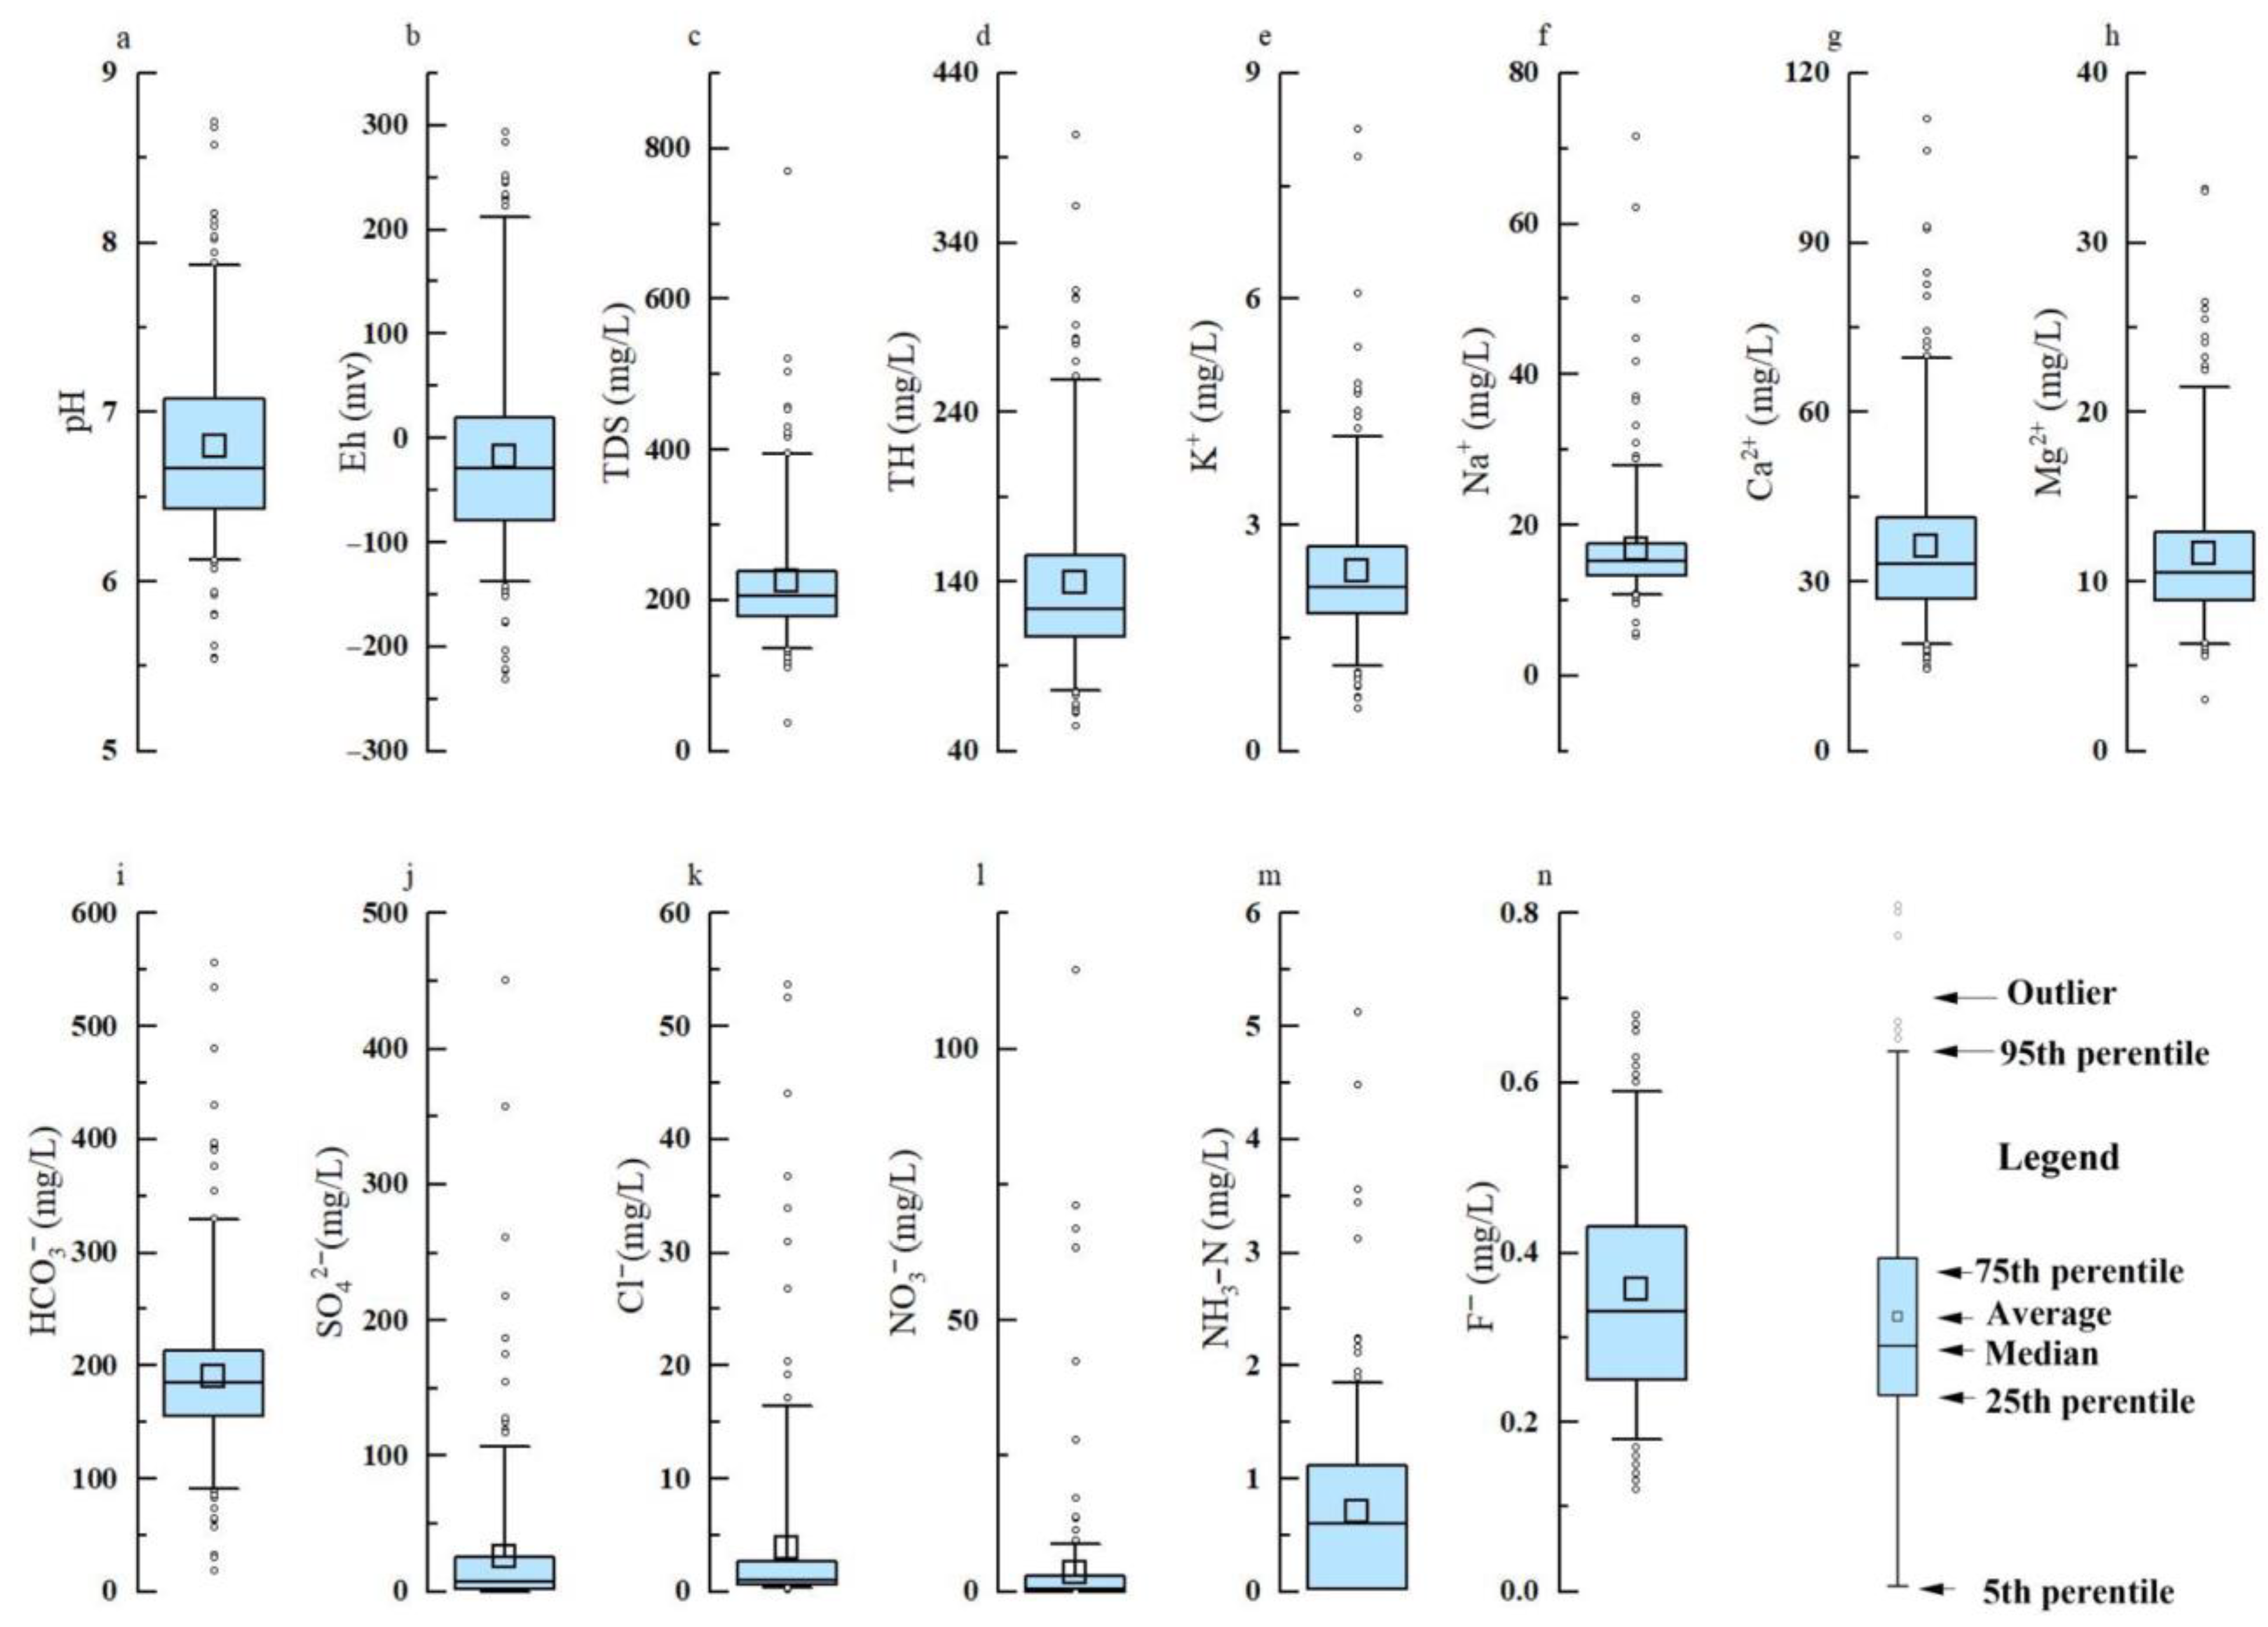
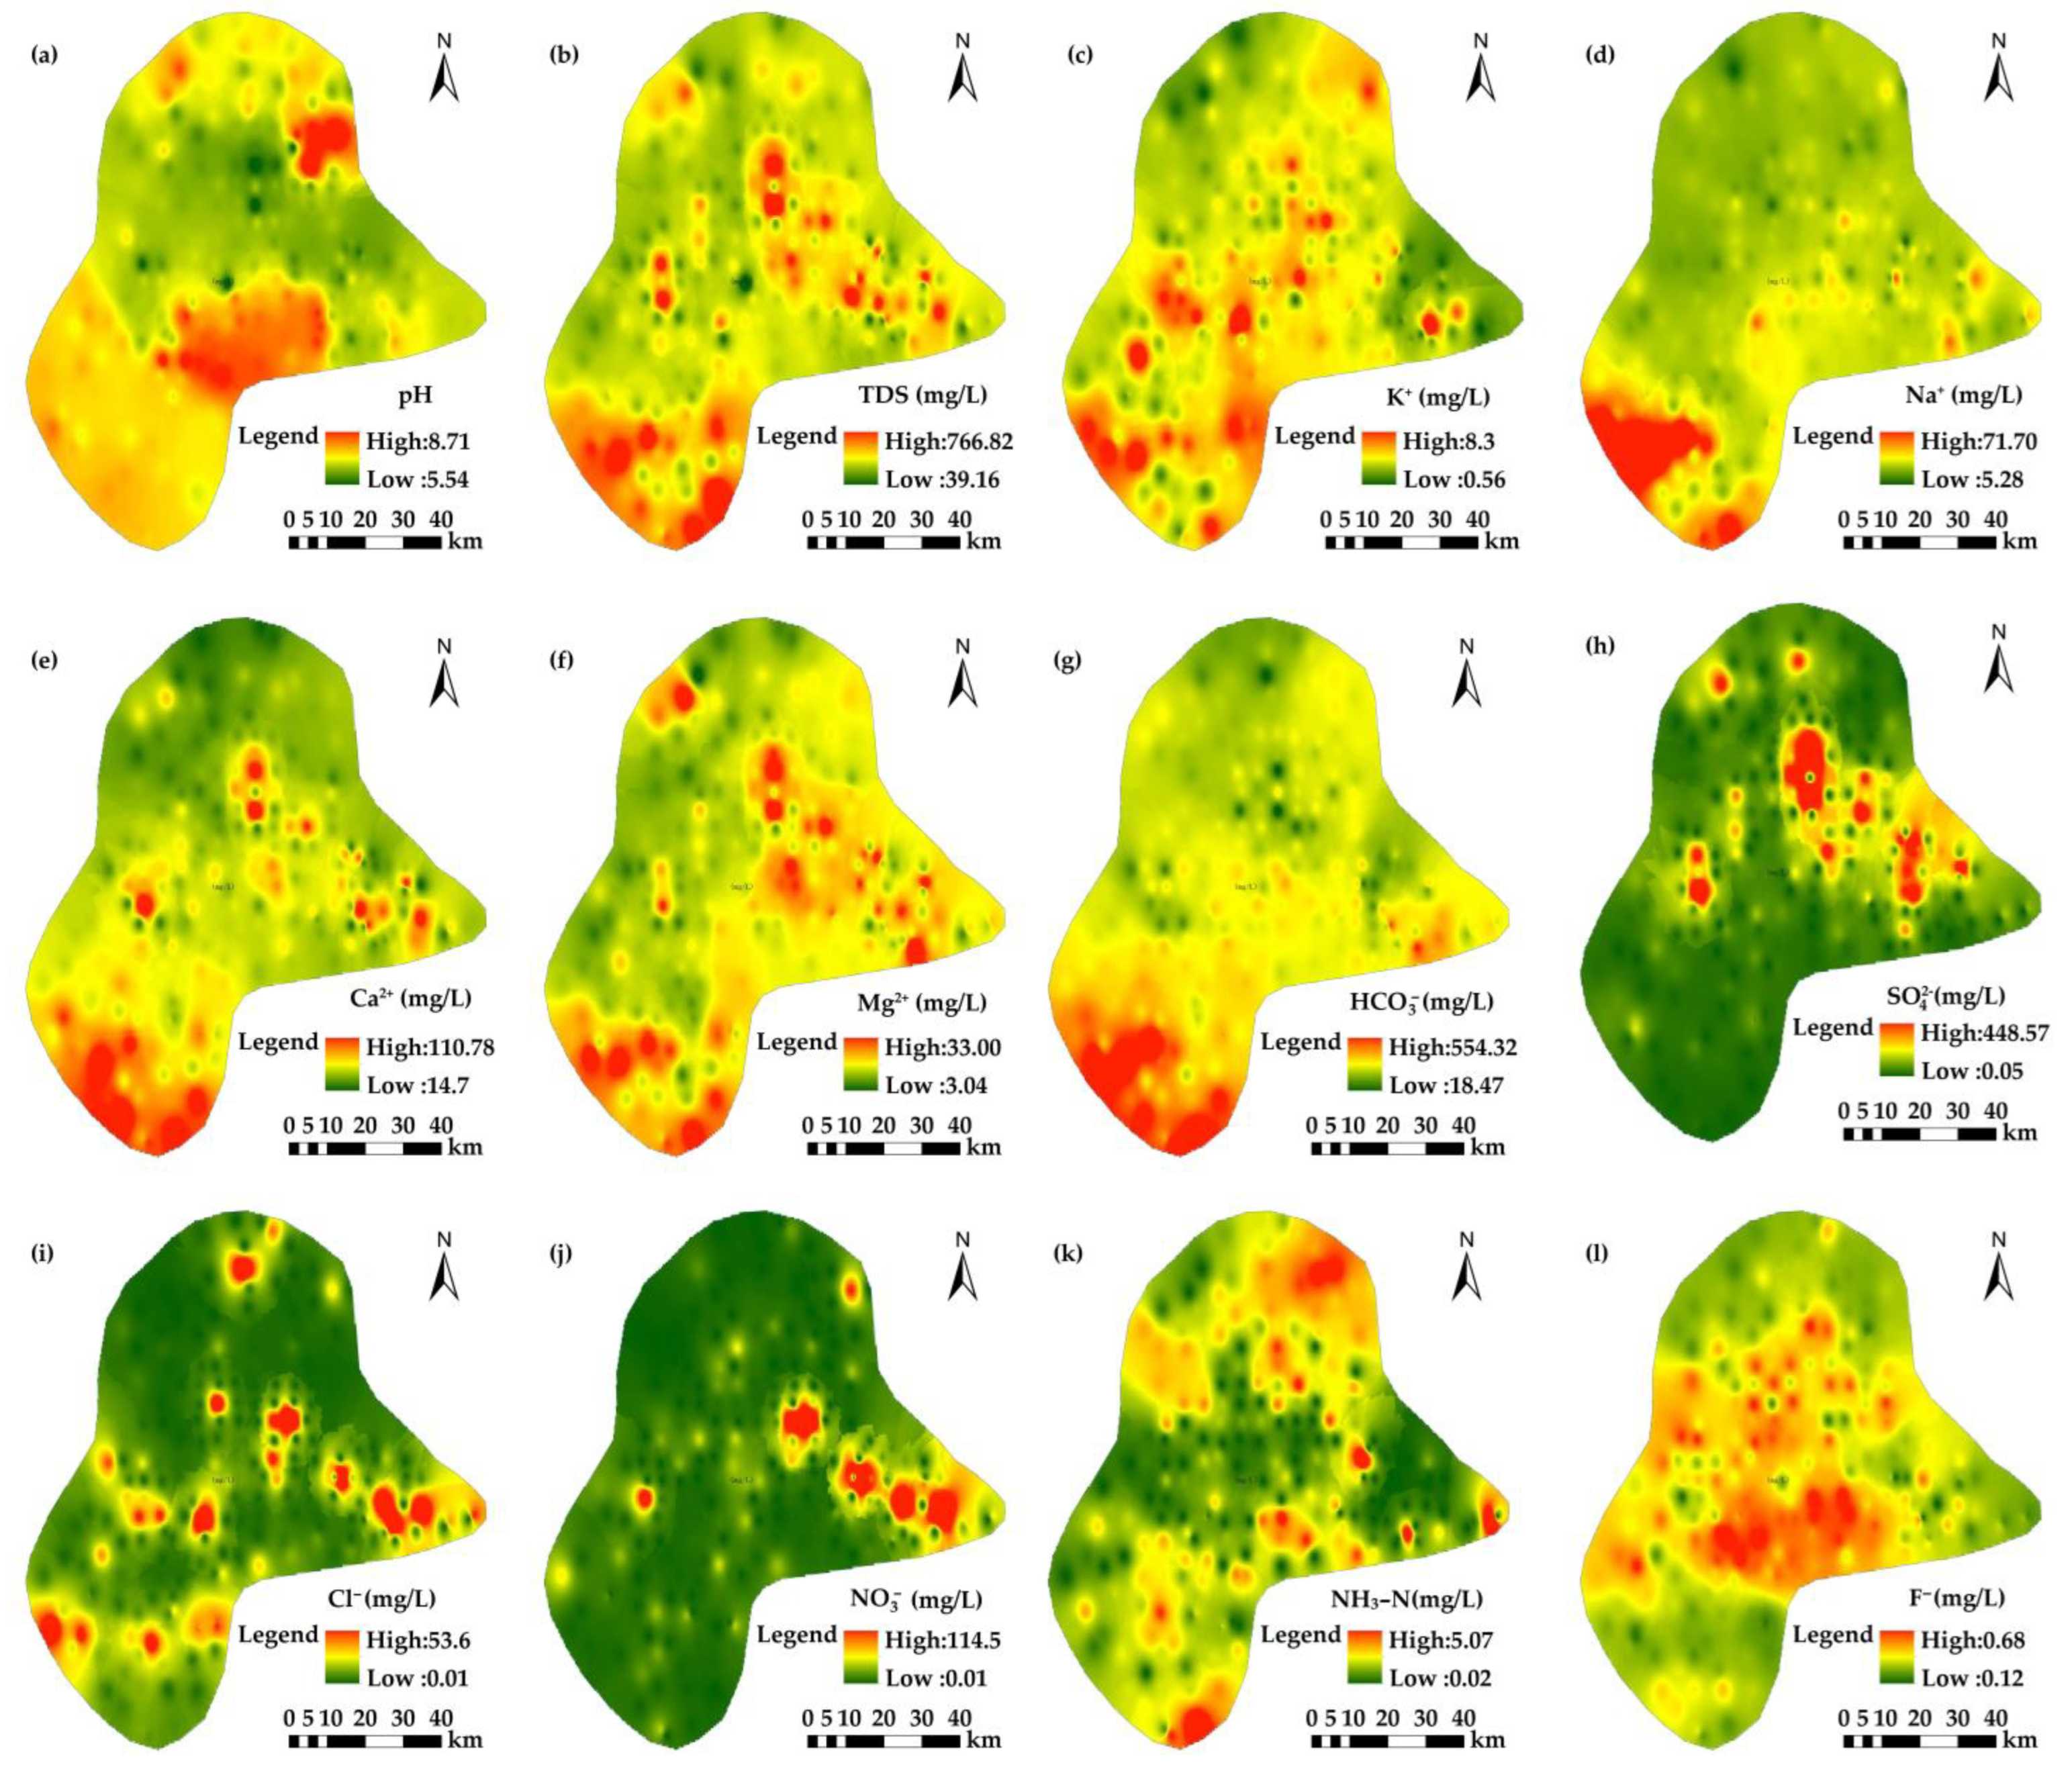
A total of 226 groundwater samples were analyzed to assess the hydrogeochemical characteristics of the Sanjiang Plain. The groundwater pH ranged from 5.54 to 8.71 (mean: 6.80), indicating mildly acidic to weakly alkaline conditions (Table 1 and Figure 2). The redox potential (Eh) values varied from −231.9 mV to 292.8 mV, with an average of −17.8 mV, indicating predominantly reducing to mildly oxidizing environments. Total dissolved solids (TDSs) ranged between 37.3 and 770.0 mg/L, with a mean of 224.1 mg/L. While none of the samples exceeded the WHO guideline of 1000 mg/L, relatively elevated TDS levels were noted in the central and southern parts of the study area (Figure 3). Total hardness (TH) ranged from 55.2 to 403.2 mg/L (mean: 139.0 mg/L). Among the samples, 12 fell into the soft category (0–75 mg/L), 148 were classified as moderate (75–150 mg/L), 61 were hard (150–300 mg/L), and 5 were very hard (>300 mg/L) [33], classifying most samples as “moderate” to “hard” water.
The average concentration sequence of major cations was Ca2+ > Na+ > Mg2+ > K+, and for anions, it was HCO3 > SO42− > Cl > NO3. Calcium ranged from 14.6 to 112.0 mg/L and magnesium from 3.0 to 33.1 mg/L, with high values observed in the central–eastern and southern regions. These patterns align well with those of SO42− and HCO3, suggesting consistent geochemical processes. Based on the geological background of the research area, there are no exposed strata rich in gypsum or other sulfur-containing minerals, and sulfate ions should mainly come from the application of pesticides and fertilizers. Sodium concentrations (5.3–71.7 mg/L) showed enrichment in the southwestern region, while potassium (0.6–8.3 mg/L) was locally elevated in the eastern and central zones (Figure 3).
Bicarbonate (HCO3) was the dominant anion (17.7–555.9 mg/L), with the highest values recorded in the southern part of the study area. Sulfate (SO42−) showed substantial variation (0.05–450.9 mg/L), with its highest concentrations found in the central–eastern areas. Chloride (Cl) concentrations ranged from 0.2 to 53.7 mg/L, with elevated values localized in the eastern and central regions. Nitrate (NO3) concentrations spanned from 0.01 to 114.6 mg/L (mean: 3.3 mg/L), with five samples exceeding the WHO limit of 45 mg/L. High NO3 levels were mainly concentrated in the eastern and central zones, suggesting a strong link to agricultural and human activities [35]. Ammonia nitrogen (NH3-N) concentrations ranged from 0.02 to 5.1 mg/L (mean: 0.7 mg/L), with 127 samples (56%) surpassing the 0.5 mg/L threshold. The highest NH3-N values were observed in the northern region, with a distinct arc-shaped distribution in the south. These patterns likely reflect contamination from livestock and fertilizer inputs. These ions, particularly SO42−, Cl, and NO3, exhibited high coefficients of variation (204% to 340%), indicating significant spatial heterogeneity and potential anthropogenic influence.

3.1.2. Hydrochemical Type

To further understand the groundwater chemistry, according to the content of anions and cations in water, ions with a percentage greater than 25% milligram equivalent were classified and named [36,37]. The results showed that the hydrochemical types in the study area were mainly Ca·Mg-HCO3, Ca-HCO3, and Ca·Mg·Na-HCO3, with sample sizes of 107, 47, and 17, respectively, accounting for approximately 46.90%, 20.80%, and 7.52% of the total sample size, respectively. Other types were only sporadically visible, and the hydrochemical types and distribution are shown in Figure 4. Points with sulfate ions, chloride ions, and nitrate ions as the main components of anions, with quantities of 39, 6, and 1, respectively, were mainly located in the central and northern parts of the working area, and the surrounding areas of the well points were mainly paddy fields. There is no exposure to gypsum or salt rock in the research area, and its sulfate ions, chloride ions, and nitrate ions may come from excessive use of pesticides and fertilizers or leaching and infiltration of feces, organic fertilizers, or domestic pollution.
The dominance of Ca2+, Mg2+, HCO3, and SO42− in the groundwater reflects the dissolution of carbonate and gypsum-bearing formations that are widely distributed in the study area [38]. However, the observed spatial heterogeneity and exceedance of nitrate and ammonia in specific areas underscore the influence of anthropogenic sources, particularly agricultural practices and livestock activities.

3.1.3. Relationship Between Chemical Indexes

Correlation analysis was used to identify the origins and interactions of ions in groundwater. Components originating from the same source tend to show strong correlations, whereas those from different sources usually correlate poorly [39]. In this study, significant positive correlations were observed between TDS and Ca2+ (r = 0.820), Mg2+ (r = 0.81), and SO42− (r = 0.71) (Figure 5), indicating that these three ions are the primary contributors to total dissolved solids in the groundwater of the Sanjiang Plain. Additionally, F, NO3, and K+ exhibited significant mutual correlations, suggesting a shared origin. This common source is likely associated with the dissolution of evaporite minerals such as halite or potentially anthropogenic inputs such as fertilizers. Given that there is no exposed salt rock in the research area, their source may be human activities. These correlation patterns support the hypothesis that both geogenic and anthropogenic factors are influencing the chemical composition of groundwater in the study area.

3.2. Control Factors of Groundwater Hydrochemistry

3.2.1. Natural Factors

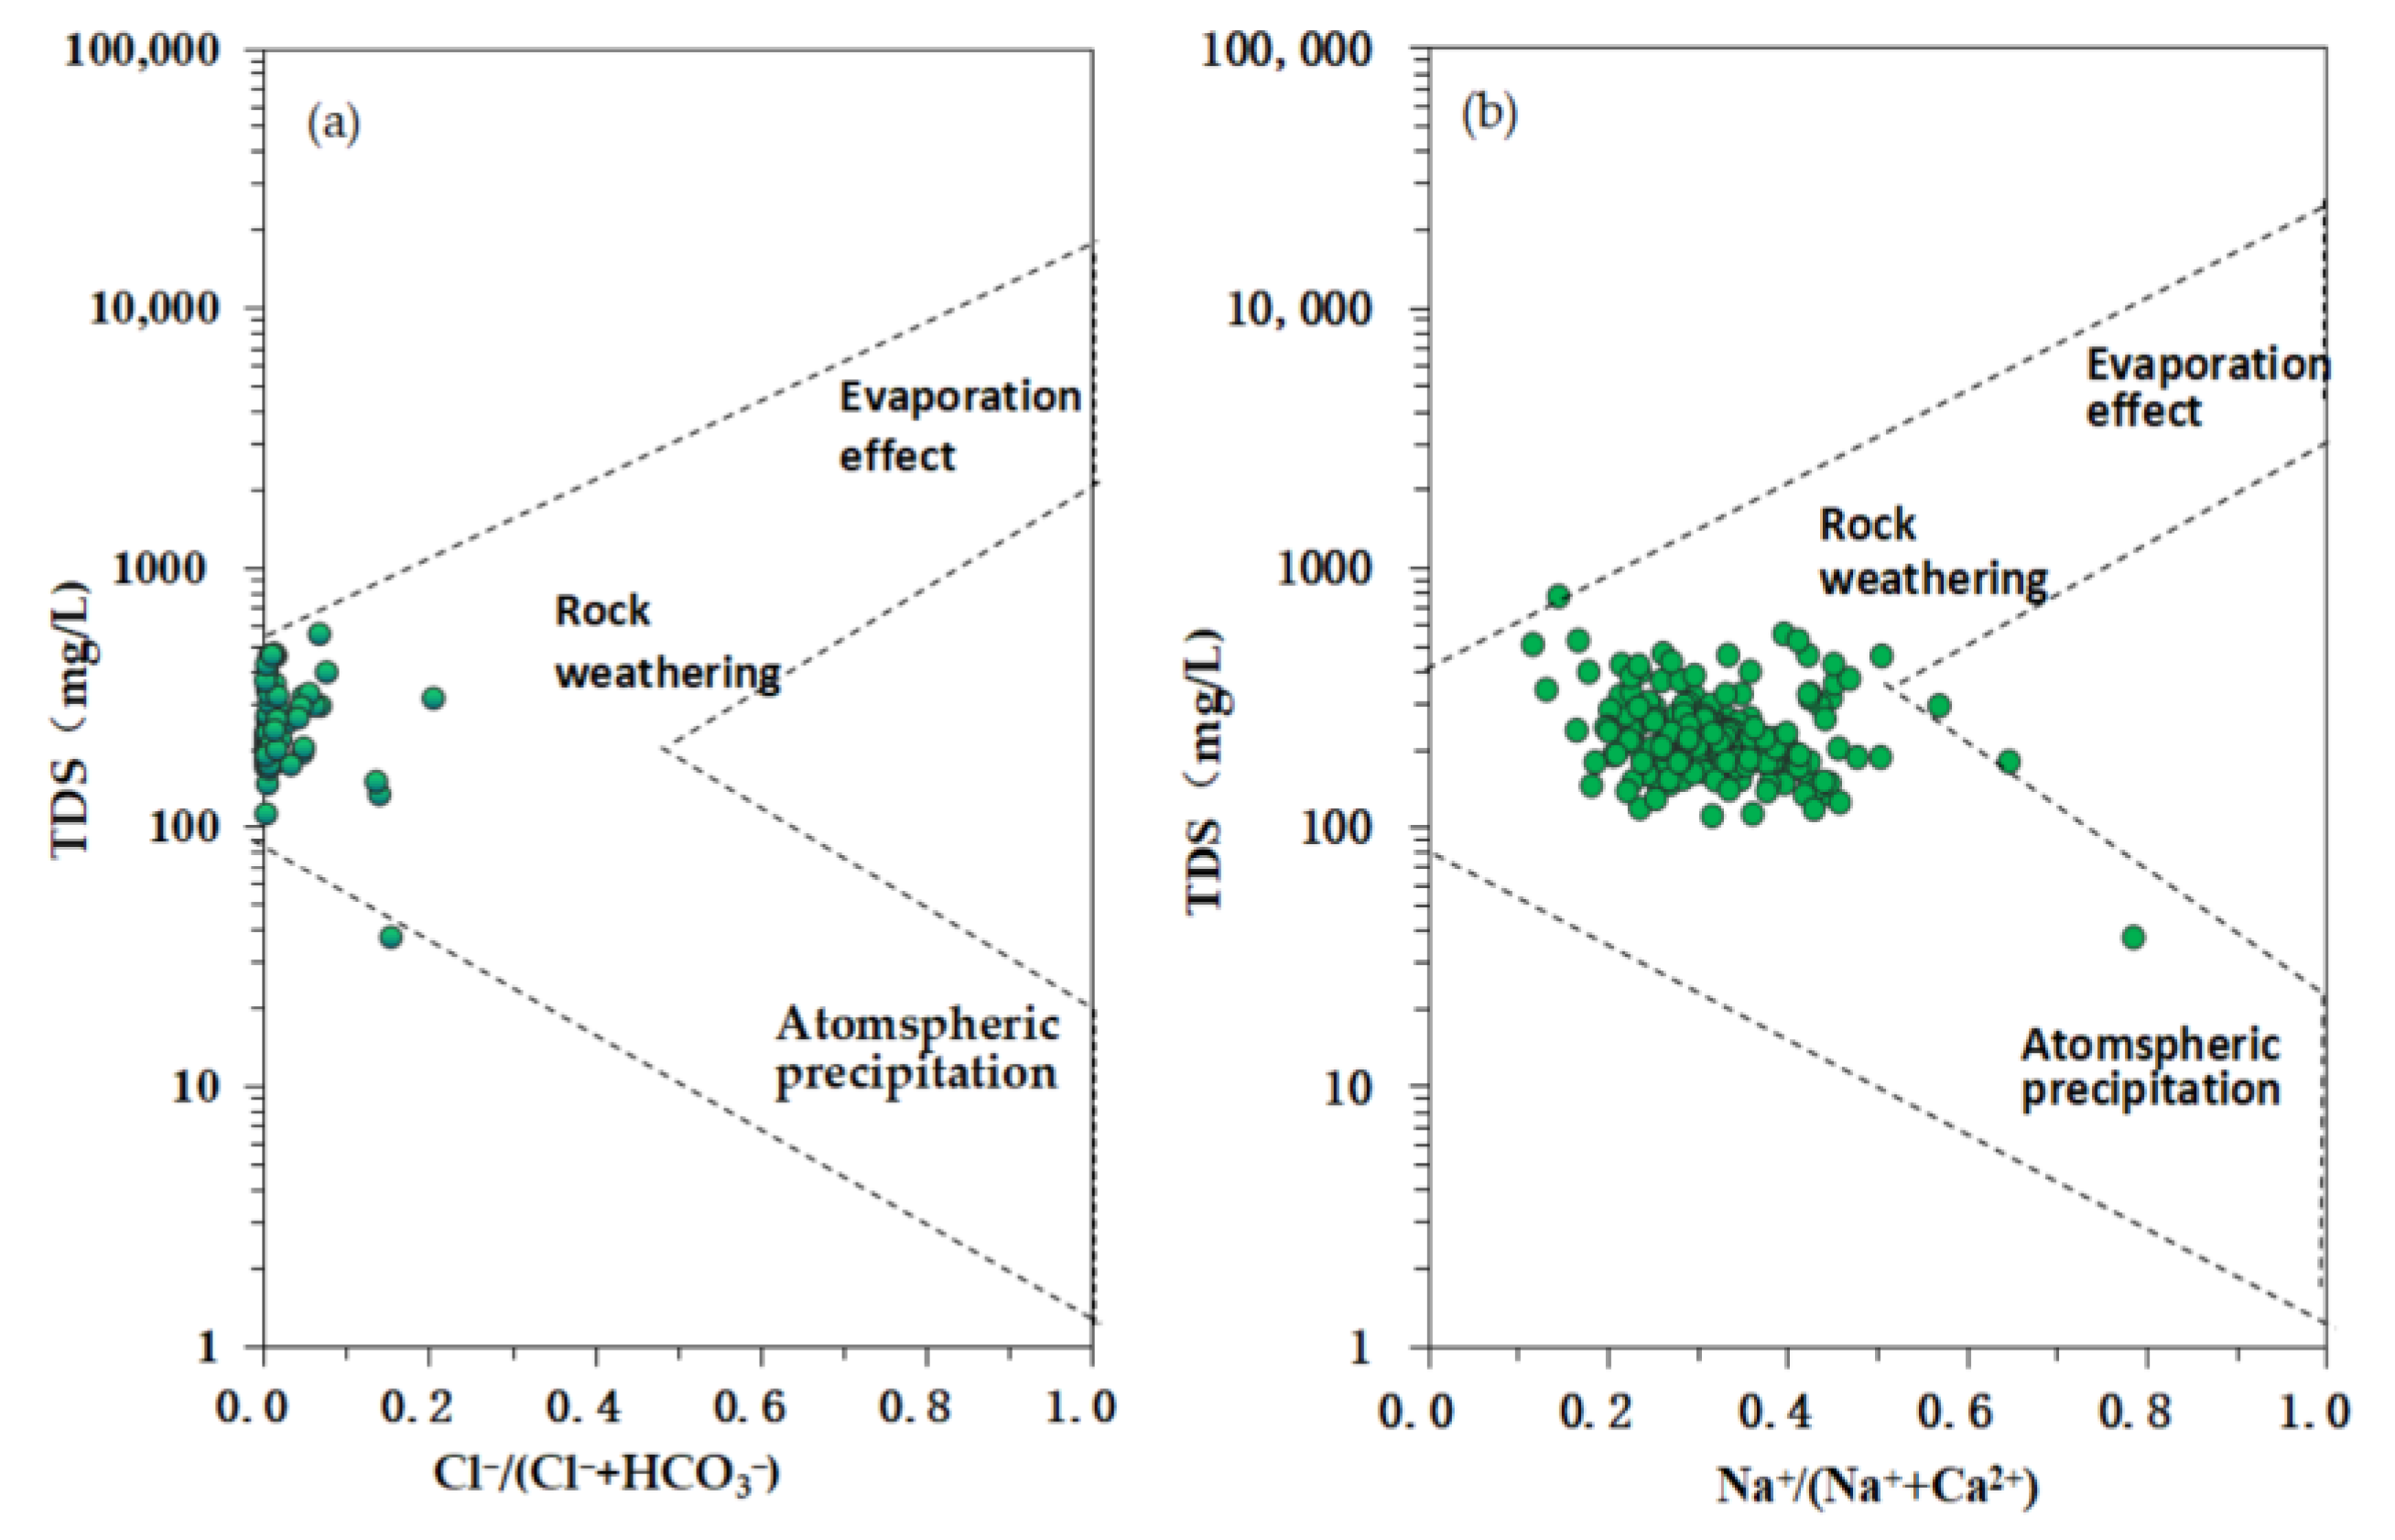
To investigate the geochemical processes influencing groundwater composition, Gibbs diagrams were employed to determine the primary mechanisms governing solute concentrations [15,40,41,42]. These diagrams distinguish between three end-member processes: atmospheric precipitation, rock weathering, and evaporation–crystallization. As shown in Figure 6, most groundwater samples in the Sanjiang Plain plot within the rock-weathering dominance zone, characterized by TDS values ranging from 70 to 300 mg/L, Cl/(Cl + HCO3) and Na+/(Na+ + Ca2+) ratios below 0.5. The mean values of Na+/(Na+ + Ca2+) and Cl/(Cl + HCO3) were 0.325 and 0.025, respectively, indicating that groundwater chemistry is primarily controlled by water–rock interactions, with minimal influence from precipitation or evaporation processes. These results are consistent with the Piper diagram findings.
Further insights into mineral weathering processes were derived using ionic ratio plots (Figure 6) [43,44]. The relationships between Ca2+/Na+ vs. Mg2+/Na+ and Ca2+/Na+ vs. HCO3/Na+ reveal that most groundwater samples plot between the carbonate and silicate weathering domains (Figure 7), suggesting that both types of rocks contribute to groundwater chemistry, with silicate weathering being more dominant. This agrees with the regional lithological setting, where sandstones and granites prevail, and carbonates are locally distributed.
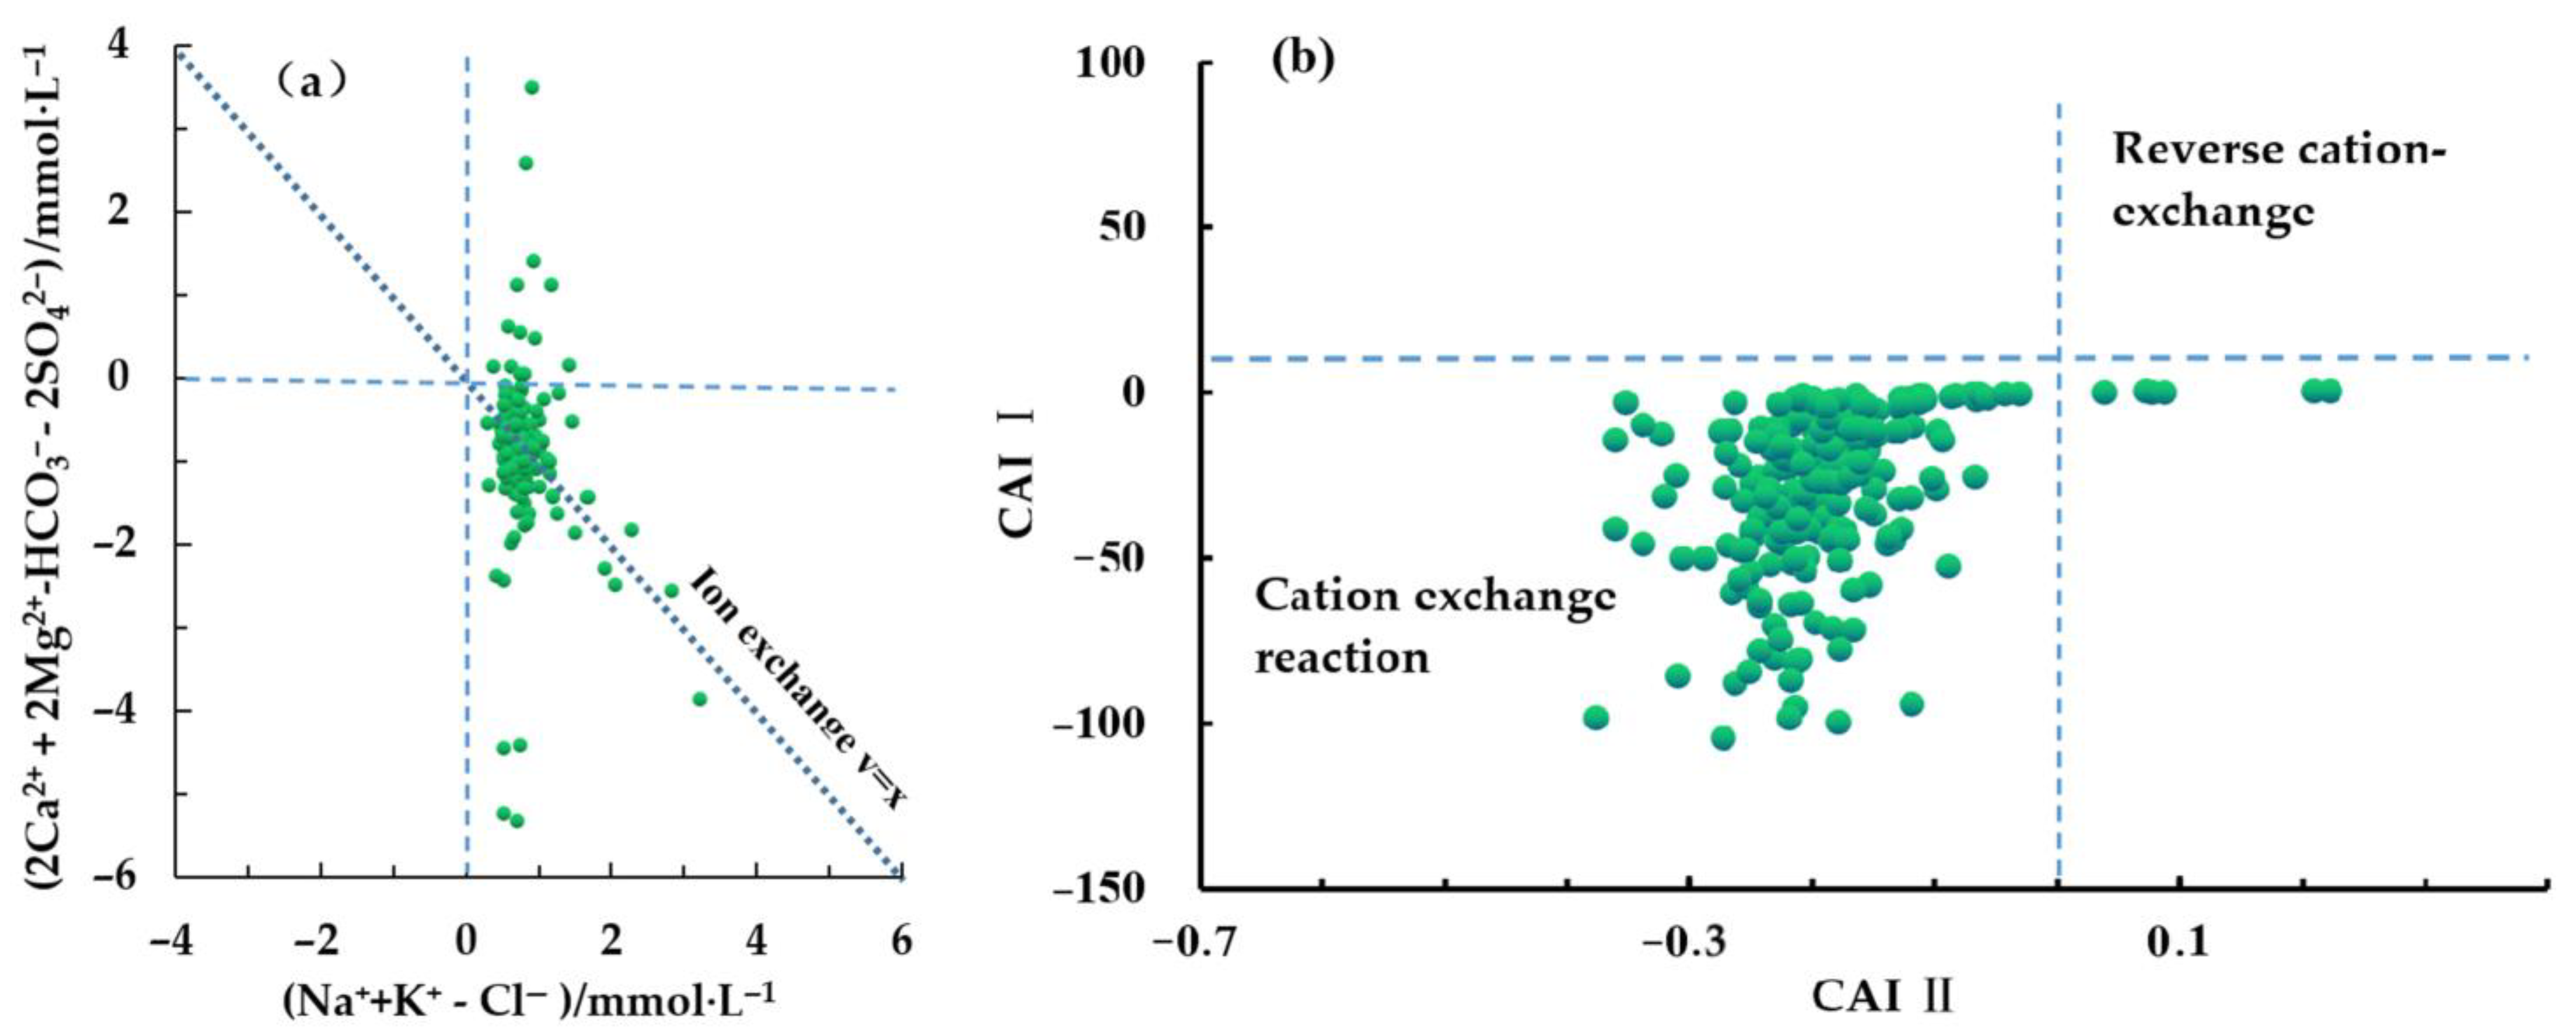
Cation exchange processes were assessed using the diagram of (Na+ + K+ − Cl) vs. [(2SO42− + HCO3) − 2(Ca2+ + Mg2+)] (Figure 8a). The majority of groundwater samples deviate from the 1:1 line, indicating that cation exchange plays only a minor role in the area. The Schoeller indices CAI-I (=(Cl − (Na+ + K+))/Cl) and CAI-II (=(Cl − (Na+ + K+))/(HCO3 + SO42− + CO32− + NO3)) are commonly used to identify cation exchange processes [45,46]. CAI1 values ranged from −104.12 to 0.58 (mean: −29.06 ± 24.22), and CAI2 values ranged from −0.38 to 0.22 (mean: −0.19 ± 0.08). Both indices were predominantly negative, suggesting weak reverse cation exchange, where Na+ and K+ in groundwater are substituted by Ca2+ and Mg2+ from the aquifer matrix (Figure 8b).
Additional ion ratio analyses support the above conclusions. In Figure 9a, most Cl vs. Na+ plots fall below the 1:1 line, ruling out halite dissolution as a major Na+ source. Excess Na+ likely originates from silicate weathering or ion exchange. The SO42− vs. Ca2+ relationship (Figure 9b) shows that most samples lie above the 1:1 line, indicating SO42− levels exceed those expected from gypsum dissolution alone. The HCO3 vs. Ca2+ plot (Figure 9c) displays most samples above both the y = x and y = 2x lines, suggesting that calcite and dolomite dissolution contribute significantly to groundwater chemistry [47,48]. Additionally, in the (HCO3 + SO42−) vs. (Ca2+ + Mg2+) plot (Figure 9d), data cluster near the 1:1 line, supporting the occurrence of mineral dissolution with partial influence from cation exchange. Saturation indices (SI), calculated using PHREEQC 3.0, provide insight into mineral equilibrium conditions [49,50]. The SI values for calcite, dolomite, gypsum, and halite are shown in Figure 9e,f. Most samples have SI values below zero, indicating undersaturation and potential for mineral dissolution. A few samples exhibit supersaturation (SI > 0) for calcite and dolomite, suggesting localized precipitation or limited dissolution equilibrium.
Therefore, the research area is mainly dominated by the weathering and dissolution of carbonates (limestone and dolomite), followed by silicates, and the main processes are as follows:
CaCO3 (calcite) → Ca2+ + CO32−,
CaMg(CO3)2 (dolomite) → Ca2+ + Mg2+ + 2CO32+.
CaAl2Si2O8 (anorthite) → Ca2+ + 2AlO2 + 2SiO2
NaAlSi3O8 (albite) → 2Na+ +AlO2 + 3SiO2

3.2.2. Human Activity Input

Anthropogenic activities significantly alter groundwater recharge conditions and influence chemical composition. Among common indicators, Cl and NO3 are less affected by geochemical reactions and more reflective of human impacts such as fertilizer application, wastewater discharge, and livestock waste [51,52,53]. The ratios of Cl/Na+ and NO3/Na+ are commonly used to identify such influences. As shown in Figure 10, groundwater samples in the Sanjiang Plain exhibit elevated Cl/Na+ and NO3/Na+ ratios, indicating substantial anthropogenic input. These elevated levels are consistent with the region’s intensive agricultural practices and urban wastewater discharge. This is consistent with the high level of sulfate ions in the research area, confirming that human activities play a critical role in shaping groundwater chemistry in certain areas of the study region.

3.3. Groundwater Quality

The EWQI was adopted to assess the overall groundwater quality in the Sanjiang Plain, as it effectively integrates the relative significance of various hydrochemical parameters [21,54]. As shown in Figure 11a, EWQI values across 226 groundwater samples ranged from 1.31 to 298.32, with an average of 33.21, indicating that most samples exhibit excellent water quality. Specifically, 180 samples (approximately 79.6%) were classified as “excellent,” while 23 samples (10.2%) fell into the “good” category. These two classes collectively account for 89.8% of the total samples, suggesting that the majority of the groundwater is suitable for various uses, including drinking and irrigation. A smaller subset, consisting of 8 samples (3.5%), was categorized as “moderate,” which is still within acceptable limits for drinking water. However, 2 samples (0.9%) and 13 samples (5.7%) were categorized as “poor” and “very poor,” respectively, indicating localized areas of concern.
Further analysis revealed that groundwater samples with higher concentrations of Cl, NO3, and SO42− tended to have elevated EWQI values, identifying these anions as the primary contributors to water quality deterioration. Spatial distribution mapping of EWQI (Figure 11b) showed that samples with poorer water quality were predominantly located near densely populated residential areas and livestock farms, particularly those adjacent to wetlands. These locations are associated with anthropogenic activities such as intensive agriculture, fertilizer and pesticide use, and livestock waste discharge. The observed spatial patterns suggest that NO3, Cl, and SO42− pollution is largely attributable to agricultural runoff and livestock operations. Therefore, future efforts to safeguard groundwater quality in this region should prioritize improved nutrient management practices and effective treatment and disposal of animal waste in agricultural settings.

4. Conclusions

This study provides a comprehensive assessment of groundwater hydrochemistry, controlling mechanisms, and overall quality in a typical agricultural reclamation area of the Sanjiang Plain. Based on the analysis of 226 groundwater samples, the results highlight the following key findings: (1) Groundwater in the study area is primarily characterized by a Ca–HCO3 type with soft to moderately hard water. Bicarbonate, calcium, magnesium, and sulfate dominate the ion composition, reflecting influence from carbonate and silicate mineral dissolution. (2) The Gibbs and ion ratio diagrams demonstrate that rock weathering—particularly silicate and carbonate dissolution—is the dominant geochemical process shaping groundwater chemistry. Cation exchange plays a secondary but detectable role, as confirmed by ion balance diagrams and chlor-alkali indices. (3) Elevated levels of NO3, Cl, and SO42− in certain areas—especially near residential zones and livestock farms—point to significant human impacts. These contaminants are largely attributed to fertilizer application, pesticide usage, and manure discharge from agricultural and livestock activities. (4) According to the entropy-weighted water quality index (EWQI), approximately 90% of groundwater samples fall within the “excellent” to “good” quality range, suggesting broad suitability for drinking and irrigation. However, localized zones of poor and very poor water quality necessitate attention and remediation.
Overall, this research underscores the dual influence of natural weathering and anthropogenic activities on groundwater chemistry in the Sanjiang Plain. To maintain and improve groundwater quality, future management should emphasize integrated land-use planning, sustainable agricultural practices, and enhanced wastewater treatment, particularly in areas with intensive human activity.

Author Contributions

M.W. (Min Wang): writing—original draft and visualization; M.W. (Mingguo Wang): writing—review and editing, supervision and funding acquisition. All authors have read and agreed to the published version of the manuscript.

Funding

This work was funded by the Geological Survey Project (DD20230456 and DD20221754) of the China Geological Survey.

Data Availability Statement

Data are contained within the article.

Conflicts of Interest

The authors declare no conflicts of interest.

References

  1. Dass, B.; Rao, M.S.; Sen, S. Hydrogeochemical characterization and water quality assessment of mountain springs: Insights for strategizing water management in the lesser Indian Himalayas. J. Hydrol. Reg. Stud. 2025, 57, 102126. [Google Scholar] [CrossRef]
  2. Sun, X.; Du, Y.; Xu, J.; Tian, H.; Deng, Y.; Gan, Y.; Wang, Y. Control of groundwater-lake interaction zone structure on spatial variability of lacustrine groundwater discharge in oxbow lake. Water Resour. Res. 2025, 61, e2024WR039334. [Google Scholar] [CrossRef]
  3. Alley, W.M.; Healy, R.W.; LaBaugh, J.W.; Reilly, T.E. Hydrology—Flow and storage in groundwater systems. Science 2002, 296, 1985–1990. [Google Scholar] [CrossRef]
  4. Scanlon, B.R.; Fakhreddine, S.; Rateb, A.; de Graaf, I.; Famiglietti, J.; Gleeson, T.; Grafton, R.Q.; Jobbagy, E.; Kebede, S.; Kolusu, S.R.; et al. Global water resources and the role of groundwater in a resilient water future. Nat. Rev. Earth Environ. 2023, 4, 87–101. [Google Scholar] [CrossRef]
  5. Dolan, F.; Lamontagne, J.; Link, R.; Hejazi, M.; Reed, P.; Edmonds, J. Evaluating the economic impact of water scarcity in a changing world. Nat. Commun. 2021, 12, 1915. [Google Scholar] [CrossRef]
  6. Khan, S.; Paul, S.K. Groundwater quality assessment and health issues in coastal zone of Bangladesh. J. Hazard. Mater. Adv. 2023, 10, 100278. [Google Scholar] [CrossRef]
  7. Liu, Y.; Jin, M.; Wang, J. Insights into groundwater salinization from hydrogeochemical and isotopic evidence in an arid inland basin. Hydrol. Process. 2018, 32, 3108–3127. [Google Scholar] [CrossRef]
  8. Panday, D.P.; Kumari, A.; Kumar, M. Alkalinity-salinity-sustainability: Decadal groundwater trends and its impact on agricultural water quality in the Indian Peninsula. Sci. Total Environ. 2025, 978, 179459. [Google Scholar] [CrossRef]
  9. Li, Z.; Lu, C.; Zhang, Y.; Wu, C.; Liu, B.; Shu, L. Mechanisms of evolution and pollution source identification in groundwater quality of the Fen River Basin driven by precipitation. Sci. Total Environ. 2024, 952, 175893. [Google Scholar] [CrossRef]
  10. Biswas, S.; Chattopadhyay, A.; Shaw, S.; Hoffmann, R. Assessing groundwater quality and its association with child undernutrition in India. Sci. Total Environ. 2024, 943, 25. [Google Scholar] [CrossRef] [PubMed]
  11. Liu, J.; Peng, Y.; Li, C.; Gao, Z.; Chen, S. Characterization of the hydrochemistry of water resources of the Weibei Plain, Northern China, as well as an assessment of the risk of high groundwater nitrate levels to human health. Environ. Pollut. 2021, 268, 115947. [Google Scholar] [CrossRef]
  12. Hossain, M.S.; Rahman, A.; Asefa, E.M.; Parveen, M.; Uddin, M.R. Assessing spatial distribution of heavy metal contamination in groundwater and associated human health risk in the Chittagong industrial area, Bangladesh. J. Hazard. Mater. Adv. 2025, 18, 100728. [Google Scholar] [CrossRef]
  13. Wang, S.; Chen, J.; Zhang, S.; Zhang, X.; Chen, D.; Zhou, J. Hydrochemical evolution characteristics, controlling factors, and high nitrate hazards of shallow groundwater in a typical agricultural area of Nansi lake basin, north China. Environ. Res. 2023, 223, 115430. [Google Scholar] [CrossRef] [PubMed]
  14. Gugulothu, S.; Rao, N.S.; Das, R.; Duvva, L.K.; Dhakate, R. Judging the sources of inferior groundwater quality and health risk problems through intake of groundwater nitrate and fluoride from a rural part of Telangana, India. Environ. Sci. Pollut. Res. 2022, 32, 29. [Google Scholar] [CrossRef] [PubMed]
  15. Zhang, Y.; Dai, Y.; Wang, Y.; Huang, X.; Pei, Q. Groundwater chemistry, quality and potential health risk appraisal of nitrate enriched groundwater in the Nanchong area, southwestern China. Sci. Total Environ. 2021, 784, 147186. [Google Scholar] [CrossRef] [PubMed]
  16. Ma, H.; Li, X.; Cui, J.; Yang, Z. A Preliminary Study on The Organic and Inorganic Pollution of Groundwater of Jiansanjiang Farm of Sanjiang Plain. Geol. Resour. 2014, 23, 38–41. (In Chinese) [Google Scholar]
  17. Yu, Z.-Q.; Nakagawa, K.; Berndtsson, R.; Hiraoka, T.; Suzuki, Y. Groundwater nitrogen response to regional land-use management in South Japan. Environ. Earth Sci. 2021, 80, 634. [Google Scholar] [CrossRef]
  18. Cao, Y.; Tang, C.; Song, X.; Liu, C.; Zhang, Y. Identifying the hydrochemical characteristics of rivers and groundwater by multivariate statistical analysis in the Sanjiang Plain, China. Appl. Water Sci. 2016, 6, 169–178. [Google Scholar] [CrossRef]
  19. Wang, M.; Wang, M.; Yang, L.; Yang, T.; Li, J.; Chen, Y. Distribution Characteristics and Genesis of Iron and Manganese Ions in Groundwater of Eastern Sanjiang Plain, China. Water 2023, 15, 2068. [Google Scholar] [CrossRef]
  20. Zhang, T.; Wang, P.; He, J.; Liu, D.; Wang, M.; Wang, M.; Xia, S. Hydrochemical Characteristics, Water Quality, and Evolution of Groundwater in Northeast China. Water 2023, 15, 2669. [Google Scholar] [CrossRef]
  21. Yang, X.; Dai, C.; Jing, J.; Liu, G.; Ru, Q.; Li, J.; LIU, P. Study on the relationship between surface water and groundwater transformation in the middle and lower reaches of songhua river basin. Sci. Rep. 2025, 15, 8088. [Google Scholar] [CrossRef]
  22. Wang, X.; Zhang, G.; Xu, Y.J. Spatiotemporal groundwater recharge estimation for the largest rice production region in Sanjiang Plain, Northeast China. J. Water Supply Res. Technol. Aqua. 2014, 63, 630–641. [Google Scholar] [CrossRef]
  23. Wang, X.; Zhang, G.; Xu, Y.J.; Sun, G. Identifying the regional-scale groundwater-surface water interaction on the Sanjiang Plain, Northeast China. Environ. Sci. Pollut. Res. 2015, 22, 16951–16961. [Google Scholar] [CrossRef]
  24. Fu, Q.; Li, T.; Li, T.; Li, H. Temporal-spatial evolution patterns of the annual precipitation considering the climate change conditions in the Sanjiang Plain. J. Water Clim. Chang. 2016, 7, jwc2015012. [Google Scholar] [CrossRef]
  25. Ye, X.; Zhou, Y.; Lu, Y.; Du, X. Hydrochemical Evolution and Quality Assessment of Groundwater in the Sanjiang Plain, China. Water 2022, 14, 1265. [Google Scholar] [CrossRef]
  26. Bin, Y.; Shao-Min, D.U.; Wei-Qing, Y.; Wei, Z.; Shu-You, S.; Yang, G. Status Overdraft of Groundwater on Sanjiang Plain (2). J. Heilongjiang Hydraul. Eng. Coll. 2008, 35, 18–21. (In Chinese) [Google Scholar]
  27. Ling, Z.; Shu, L.; Wang, D.; Lu, C.; Liu, B. Assessment and projection of the groundwater drought vulnerability under different climate scenarios and land use changes in the Sanjiang Plain, China. J. Hydrol. Reg. Stud. 2023, 49, 101498. [Google Scholar] [CrossRef]
  28. Zhang, B.; Song, X.; Zhang, Y.; Han, D.; Tang, C.; Yang, L.; WANG, Z.; LIU, T. A study of the interrelation between surface water and groundwater using isotopes and chlorofluorocarbons in Sanjiang plain, Northeast China. Environ. Earth Sci. 2014, 72, 3901–3913. [Google Scholar] [CrossRef]
  29. HJ164-2020; Ministry of Ecology and Environment of the People’s Republic of China. Technical Specifications for Environmental Monitoring of Groundwater. China Environment Publishing Group: Beijing, China, 2020. (In Chinese)
  30. GB5750-2006; Ministry of Health of the People’s Republic of China. China National Standardization Administration. Sanitary Standard Test Method for Drinking Water. Standard Press of China: Beijing, China, 2007. (In Chinese)
  31. Adimalla, N. Application of the Entropy Weighted Water Quality Index (EWQI) and the Pollution Index of Groundwater (PIG) to Assess Groundwater Quality for Drinking Purposes: A Case Study in a Rural Area of Telangana State, India. Arch. Environ. Contam. Toxicol. 2021, 80, 31–40. [Google Scholar] [CrossRef]
  32. Liu, J.T.; Gao, Z.J.; Zhang, Y.Q.; Sun, Z.B.; Sun, T.Z.; Fan, H.B.; Wu, B.; Li, M.B.; Qian, L.L. Hydrochemical evaluation of groundwater quality and human health risk assessment of nitrate in the largest peninsula of China based on high-density sampling: A case study of Weifang. J. Clean. Prod. 2021, 322, 129164. [Google Scholar] [CrossRef]
  33. Maskooni, E.K.; Naseri-Rad, M.; Berndtsson, R.; Nakagawa, K. Use of Heavy Metal Content and Modified Water Quality Index to Assess Groundwater Quality in a Semiarid Area. Water 2020, 12, 1115. [Google Scholar] [CrossRef]
  34. World Health Organization. Guidelines for Drinking-water Quality, 4th ed.; WHO Press: Geneva, Switzerland, 2011; ISBN 978-92-4-154815-1. [Google Scholar]
  35. Lahjouj, A.; Hmaidi, A.E.; Achtak, H.; Nakhcha, C.; Bouhafa, K. Hydrogeochemical characterization and human health risks associated with groundwater nitrate concentrations in the Saiss basin, Morocco. HydroResearch 2025, 8, 223–236. [Google Scholar] [CrossRef]
  36. Shiklomanov, I.A. Ground-Water Classification Based on Chemical Composition and Total Dissolved Solids. In Hydrology and Water Resources: A Global Perspective; Gordon & Breach Publishers: Amsterdam, The Netherlands, 1996; pp. 67–82. [Google Scholar]
  37. Malov, A.I. The Conditions for the Formation of Strontium in the Water of Ancient Silicate Deposits Near the Arctic Coast of Russia. Water 2024, 16, 2369. [Google Scholar] [CrossRef]
  38. Heilongjiang Geological Survey Institute. Geological Map of Heilongjiang Province. Scale 1:500,000.; Heilongjiang Geological Survey Institute: Harbin, China, 2018. (In Chinese) [Google Scholar]
  39. Zhao, G.; Li, W.; Li, F.; Zhang, F.; Liu, G. Hydrochemistry of waters in snowpacks, lakes and streams of Mt. Dagu, eastern of Tibet Plateau. Sci. Total. Environ. 2018, 610–611, 641–650. [Google Scholar] [CrossRef]
  40. Gibbs, R.J. Mechanisms controlling world water chemistry. Science 1970, 170, 1088–1090. [Google Scholar] [CrossRef] [PubMed]
  41. Ke, X.; Li, Y.; Wang, W.; Niu, F.; Gao, Z. Hydrogeochemical characteristics and processes of thermokarst lake and groundwater during the melting of the active layer in a permafrost region of the Qinghai–Tibet Plateau, China. Sci. Total Environ. 2022, 851, 158183. [Google Scholar] [CrossRef] [PubMed]
  42. Faraji, H.; Shahryari, A. Assessment of groundwater quality for drinking, irrigation, and industrial purposes using water quality indices and GIS technique in Gorgan aquifer. Desalination Water Treat. 2024, 320, 100821. [Google Scholar] [CrossRef]
  43. Gao, Y.Y.; Qian, H.; Zhou, Y.H.; Chen, J.; Wang, H.K.; Ren, W.H.; Qu, W.G. Cumulative health risk assessment of multiple chemicals in groundwater based on deterministic and Monte Carlo models in a large semiarid basin. J. Clean. Prod. 2022, 352, 131567. [Google Scholar] [CrossRef]
  44. Gaillardet, J.; Dupre, B.; Louvat, P.; Allegre, C.J. Global silicate weathering and CO2 consumption rates deduced from the chemistry of large rivers. Chem. Geol. 1999, 159, 3–30. [Google Scholar] [CrossRef]
  45. Shen, B.B.; Wu, J.L.; Zhan, S.E.; Jin, M.; Saparov, A.S.; Abuduwaili, J. Spatial variations and controls on the hydrochemistry of surface waters across the Ili-Balkhash Basin, arid Central Asia. J. Hydrol. 2021, 600, 126565. [Google Scholar] [CrossRef]
  46. Adimalla, N.; Qian, H.; Nandan, M.J. Groundwater chemistry integrating the pollution index of groundwater and evaluation of potential human health risk: A case study from hard rock terrain of South India. Ecotoxicol. Environ. Saf. 2020, 206, 111217. [Google Scholar] [CrossRef]
  47. Zhang, X.; Miao, J.; Hu, B.X.; Liu, H.; Zhang, H.; Ma, Z. Hydrogeochemical characterization and groundwater quality assessment in intruded coastal brine aquifers (Laizhou Bay, China). Environ. Sci. Pollut. Res. 2017, 24, 21073–21090. [Google Scholar] [CrossRef] [PubMed]
  48. Argamasilla, M.; Barbera, J.A.; Andreo, B. Factors controlling groundwater salinization and hydrogeochemical processes in coastal aquifers from southern Spain. Sci. Total Environ. 2017, 580, 50–68. [Google Scholar] [CrossRef] [PubMed]
  49. Yang, J.; Ye, M.; Tang, Z.; Jiao, T.; Liu, H. Using cluster analysis for understanding spatial and temporal patterns and controlling factors of groundwater geochemistry in a regional aquifer. J. Hydrol. 2020, 583, 124594. [Google Scholar] [CrossRef]
  50. Parkhurst, D.L.; Appelo, C.A.J. Description of input and examples for PHREEQC version 3: A computer program for speciation, batch-reaction, one-dimensional transport, and inverse geochemical calculations. In Techniques and Methods; U.S. Geological Survey: Reston, VA, USA, 2013. [Google Scholar] [CrossRef]
  51. Wang, Y.; Peng, J.; Cao, X.; Xu, Y.; Yu, H.; Duan, G.; Qu, J. Isotopic and chemical evidence for nitrate sources and transformation processes in a plateau lake basin in Southwest China. Sci. Total Environ. 2020, 711, 134856. [Google Scholar] [CrossRef]
  52. Shen, S.; Ma, T.; Du, Y.; Han, Z.; Zhang, J.; Liu, W.; LUO, K. Contrastive mechanisms of groundwater ammonium enrichment in different hydrogeologic settings. Sci. Total Environ. 2023, 875, 162542. [Google Scholar] [CrossRef]
  53. Jolaosho, T.L.; Mustapha, A.A.; Hundeyin, S.T. Hydrogeochemical evolution and heavy metal characterization of groundwater from southwestern, Nigeria: An integrated assessment using spatial, indexical, irrigation, chemometric, and health risk models. Heliyon 2024, 10, 19. [Google Scholar] [CrossRef]
  54. Li, C.; Gao, Z.; Chen, H.; Wang, J.; Liu, J.; Li, C.; Teng, Y.; Liu, C.; Xu, C. Hydrochemical analysis and quality assessment of groundwater in southeast North China plain using hydrochemical, entropy-weight water quality index, and GIS technique. Environ. Earth Sci. 2021, 80, 16. [Google Scholar] [CrossRef]
Figure 1. (a) Location of Sanjiang Plain in China. (b) Location of the research area in Sanjiang Plain. (c) General hydrogeology and shaded relief map of the research area with groundwater sampling locations.
Water 17 03257 g001
Figure 2. Box and whisker plot of hydrochemical parameters of groundwater in Sanjiang Plain. (a) pH; (b) Eh; (c) TDS; (d) TH; (e) k+; (f) Na+; (g) Ca2+; (h) Mg2+; (i) HCO3; (j) SO42−; (k) Cl; (l) NO3; (m) NH3N; (n) F.
Water 17 03257 g002
Figure 3. Spatial variation in pH (a), TDS (b), and major ion concentrations (cl) of the groundwater in Sanjiang Plain.
Water 17 03257 g003
Figure 4. Groundwater type map of the groundwater in Sanjiang Plain.
Water 17 03257 g004
Figure 5. Correlation coefficients between major ions in the groundwater from Sanjiang Plain. The right y-axis indicates the R values. ** Significant at the 0.01 level. * Significant at the 0.05 level.
Water 17 03257 g005
Figure 6. Gibbs diagrams demonstrating the mechanisms governing groundwater chemistry for groundwater in Sanjiang Plain. (a) TDS vs. Cl−/(Cl + HCO3). (b) TDS vs. Na+/(Na+ + Ca2+).
Water 17 03257 g006
Figure 7. Plots of (Mg2+/Na+) vs. (Ca2+/Na+) (a) and (HCO3/Na+) vs. (Ca2+/Na+) (b) for groundwater in Sanjiang Plain.
Water 17 03257 g007
Figure 8. Plots of (a) (Na+ − Cl) vs. [(2SO42− + HCO3) − 2(Ca2+ + Mg2+)], (b) chlor-alkali indices CAI-I vs. CAI-II.
Water 17 03257 g008
Figure 9. Correlation diagrams of (a) Cl vs. Na+, (b) SO42− vs. Ca2+, (c) HCO3 vs. Ca2+, (d) (HCO3 + SO42−) vs. (Ca2+ + Mg2+), (e) saturation index (S.I.) of Calcite vs. Gypsum, and (f) S.I. of Dolomite vs. Halite.
Water 17 03257 g009
Figure 10. Plots showing variations in (Cl/Na+) vs. (NO3/Na+) for groundwater in Sanjiang Plain.
Water 17 03257 g010
Figure 11. (a) The relationship between the entropy-weighted water quality index (EWQI) and Cl. (b) The spatial distribution of groundwater quality based on the EWQI ranks.
Water 17 03257 g011
Table 1. Statistical analysis of hydrochemical parameters of groundwater samples (units of all parameters are mg/L, except pH).
EhpHTDSTHK+Na+Ca2+Mg2+HCO3SO42−ClNO3NH3-NF
Average−17.86.80224.1139.02.416.736.311.6190.525.63.83.30.70.4
Median−29.16.67206.5123.82.215.233.010.5184.37.41.00.40.60.3
SD96.30.5482.154.61.07.315.64.672.352.17.911.30.80.1
Min−231.95.5437.355.20.65.314.63.017.70.050.20.010.020.1
Max292.88.71770.0403.28.371.7112.033.1555.9450.953.7114.65.10.7
CV−5.420.080.370.390.430.440.430.390.382.042.073.401.100.37
WHO (2011) [34] 6.5–8.51000450-200200150-250250450.51.5
Disclaimer/Publisher’s Note: The statements, opinions and data contained in all publications are solely those of the individual author(s) and contributor(s) and not of MDPI and/or the editor(s). MDPI and/or the editor(s) disclaim responsibility for any injury to people or property resulting from any ideas, methods, instructions or products referred to in the content.