Abstract
The widespread and excessive use of plastic in our daily life has led to serious microplastic pollution in the atmosphere, water, and soil. These microplastics can enter freshwater systems and pose significant risks to the ecosystem and human health via the food chain. This environmental problem deserves proper investigation and mitigation strategies. In this study, the abundance, morphology, color, size and polymer composition of microplastics in surface water of Feiyun River Basin were systematically studied by means of field sampling, microscopy and laser micro-Raman spectroscopy. The result showed that microplastic abundance ranged from 3.7 to 36.4 items/L, with an average of 11.0 ± 2.39 items/L. These microplastics were mainly particles, followed by fragments and fibers, with white, black, and blue being the most common colors. Most of the particles were smaller than 0.1 mm (57%), and a laser micro-Raman spectrometer was used to identify the polymer types of the microplastics. The results showed that the main polymer types identified were PET, PP, and PS. Risk assessment based on PLI, PHI, and PERI indices indicated a low ecological risk of microplastics in the study area. These findings provide further insight into the sources and distribution of microplastics in local watersheds and support future assessments of riverine transport of microplastics to estuarine and marine environments.
1. Introduction
Microplastics are defined as plastic particles smaller than 5 mm in length [1]. These particles represent a pervasive pollutant and have attracted global attention. Due to their stable chemical properties and environmental durability, microplastics persist and accumulate in the environment. A large number of studies have shown that microplastics exist in surface seawater [2], deep-sea sediments [3], freshwater ecosystems [4], soil [5], and even the atmosphere [6]. Microplastics have also been found in polar glaciers [7]. In aquatic environments, microplastics are easily ingested by aquatic organisms because of their small size and wide distribution. Ingestion of microplastics can lead to pseudo-saturated intestinal obstruction, resulting in energy loss, immune stress, growth inhibition, and even death [8]. Moreover, microplastics can act as vectors for hydrophobic pollutants and pathogens, exacerbating their ecological impacts [9]. The impact of microplastics on aquatic organisms is further compounded by the leaching of various toxic additives incorporated during the production process [10]. Rivers are considered a major pathway for transporting microplastics from land to the sea. It is estimated that between 11,500 and 20,000 tons of plastic waste enter the ocean from rivers every year [11]. Rivers are also the most prevalent site for studying microplastic-contaminated water bodies, such as the British Thames [12], the German Mulde [13], the European Arctic Northern Dvina River [14], and the Russian OB in western Siberia [15]. In China, the Yangtze River [16] and the Yellow River [17] all have different degrees of micro-plastic pollution.
In order to effectively assess the ecological risks of these understudied systems, standardized assessment methods are essential. However, by accurately identifying the types of microplastic polymers, the accuracy and ecological relevance of these assessments have been greatly improved. Technologies such as laser micro-Raman spectroscopy provide these key data, enabling the application of polymer-specific risk indices. To this end, a variety of models have been developed, including pollution load index (PLI), polymer hazard index (PHI), and potential ecological risk index (PERI), which integrate abundance, polymer distribution, and toxicity information. The integration of spectroscopic identification and risk index is increasingly being used. For example, the comprehensive assessment of the Yangtze Estuary combines micro-Raman identification with PLI and PERI models to delineate pollution hotspots and attribute risks to specific polymers [18]. Similarly, in the study of urban rivers in South China, PET and PS were identified as the main polymers by Raman spectroscopy, which directly provided information for the PHI-based assessment, which revealed the significant contribution of these components to the risk [19]. Globally, a recent review of freshwater systems emphasizes that studies that combine spectral validation (e.g., Raman or FTIR) with quantitative indicators such as PHI and PERI provide a more robust and chemically informed framework for prioritizing risk comparison and mitigation efforts [20]. However, this focus on large rivers overlooks the critical role of their tributaries. There is growing evidence that a significant portion of microplastics in large rivers and lakes originates from the smaller river basins that feed them [21]. Moreover, these small-scale freshwater systems are often distributed intensively within hinterlands and are closely intertwined with human activities [22], making them potential hotspots for microplastic generation and initial transport. Despite their suspected significance, small river basins remain critically understudied compared to their larger counterparts.
In this study, the microplastic pollution in the Feiyun River Basin was systematically evaluated by integrated analysis and risk assessment methods. Our objectives are: (1) to quantify abundance and physical characteristics by microscopic examination; (2) to identify polymer types by laser micro-Raman spectroscopy; (3) and to use the standardized index (PLI, PHI, PERI) for ecological risk assessment. The results of this study are expected to clarify the pollution patterns in the region and support targeted risk mitigation.
2. Materials and Methods
2.1. Introduction of Study Area
The Feiyun River is the second largest river in Wenzhou, Zhejiang Province, China. It flows through Jingning, Taishun County, Wencheng County, and Ruian before making its way into the East China Sea. It is 203 km long and covers an area of 3713.9 km2. The rivers and streams of Ruian City belong to the Feiyun River system. The development of the Feiyun River is restricted by the geological structure. It flows along the Cathaysian Fault line to the west and east, and because of the influence of the longitudinal and transverse faults, the tributaries mostly form the pinnate river system. Generally, the tributaries in the south bank are short and small, and most of the tributaries are developed in the north bank. The Feiyun River Basin supports a substantial and economically dynamic population. It flows through areas with a combined population of several million inhabitants, with particularly high population densities in the lower alluvial plains and the estuary area within Rui’an City, which is a key part of the Wenzhou metropolitan area. This intense human presence is coupled with diverse and developed socio-economic activities, making the basin a significant receptor for anthropogenic pollutants, including microplastics. The upper and middle reaches of the basin are characterized by agricultural activities and scattered residential areas. In contrast, the middle-lower reaches and the tributaries are dominated by intensive industrial and urban development. Wenzhou is a significant base for the textile and apparel industry. These industries are potential continuous emission sources of microplastic particles and fibers, particularly polyester (PET) from textile manufacturing. Furthermore, the widespread consumption of plastic products, such as packaging materials, beverage bottles, and disposable items, associated with the high urbanization rate and living standards of the population, contributes substantially to plastic waste generation. While the region has modern waste management systems, surface runoff from urban and industrial areas, combined with potential inefficiencies in wastewater treatment and solid waste collection, likely serves as key pathways for microplastics to enter the aquatic system. Therefore, the Feiyun River Basin presents a compelling case study for investigating microplastic pollution in a typical subtropical river system under strong anthropogenic pressure, encompassing gradients from mountainous headwaters to densely populated and industrialized estuaries.
2.2. Sample Collection
2.2.1. Layout of Sampling Points
The distribution of sampling points in the Feiyun River basin is shown in Figure 1. Between October and December 2022, 15 sampling sites were set up in the Feiyun River basin, including the mainstream S1–S5 and tributaries S6–S11, of which S1 and S6 are state-controlled sections, S3, S4, and S9 are provincial control sections, S6 and S15 are county control sections, and the other sampling points are municipal control sections.
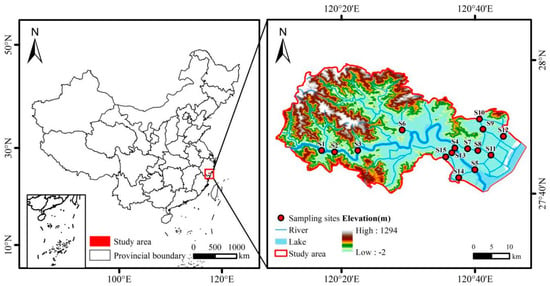
Figure 1.
Distribution of sampling points in the Feiyun River basin.
2.2.2. Water Sample Collection
Surface water samples were directly collected into 5 L stainless steel barrels and then filtered through a 38-μm stainless steel sieve. The residue on the sieve was immediately rinsed with Milli-Q water (Millipore SA.67120, Millipore, Molsheim, France) inside a 50 mL brown glass bottle and transported under cryogenic conditions to the laboratory for further analysis, three replicates were collected for each sample point. In addition, several physicochemical parameters of the surface water were measured to assess water quality and explore their potential correlations with microplastic abundance. Water temperature and dissolved oxygen (DO) were measured in situ using a portable multi-parameter water quality meter (CD650, Thermo Fisher Scientific, Waltham, MA, USA), pH meter (PHS-25, Shanghai Leici Instrument, Shanghai, China), conductivity and Turbidity was measured on-site with a portable turbidimeter (2100Q, Hach, Loveland, CO, USA). For laboratory analysis, 500 mL of surface water was collected and transported for the determination of chemical oxygen demand (COD), ammonia nitrogen (NH3+-N), total nitrogen (TN), and total phosphorus (TP) in accordance with standard Chinese national methods. Sample weighing during pretreatment was performed using an electronic balance (PR124ZH, OHAUS, Shanghai, China). Specifically, COD was determined using the dichromate method HJ 828-2017 [23]. The concentrations of NH3+-N, TN, and TP were all measured by spectrophotometric methods, following the standards HJ 535-2009 [24], HJ 636-2012 [25], and GB/T 11893-1989 [26], respectively.
2.3. Sample Analysis
2.3.1. Surface Water Microplastic Pretreatment
To each water sample was added an appropriate amount of 30% H2O2 solution. The sample was covered with tinfoil paper to prevent airborne microplastic contamination. The sample was then placed in a constant-temperature oscillating chamber (Model ZHWY-2102, Shanghai Zhicheng Analytical Instruments, Shanghai, China) at 60 °C and agitated at 100 rpm for 24 h. After incubation, the microplastics were separated by flotation using saturated NaCl solution (density: 1.20 g/cm3). This solution was selected due to its cost-effectiveness, safety, and ability to effectively separate low-density polymers such as polyethylene (PE, density: 0.92–0.97 g/cm3) and polypropylene (PP, density: 0.90–0.91 g/cm3), which are common components of environmental microplastics [27]. It is acknowledged that NaCl solution has a limited separation efficiency for higher-density polymers like polyethylene terephthalate (PET, density: 1.38 g/cm3) and polyvinyl chloride (PVC, density: 1.38 g/cm3). However, due to factors that may reduce its apparent density, including their small particle size (<0.5 mm), irregular shape, surface biofouling, or the presence of voids and additives [28]. Repeat the flotation process to maximize the recovery rate and acknowledge this potential limitation. The sample was allowed to stand at room temperature for 24 h, after which the supernatant was collected. The flotation process was repeated three times. The collected supernatant was filtered using a circulating water vacuum pump (Model CSHB-DIII, Henan Zihua Instruments, Zhengzhou, China) and a 0.45-μm glass fiber membrane filter (GF/F, 47 mm, Whatman, Maidstone, UK). The filter membrane was then carefully removed with a tweezer and placed in a labeled and clean, dry Petri dish and air-dried in the dark. The dried filters were stored for subsequent microplastics counting and analysis.
2.3.2. Analysis and Identification of Microplastic Characteristics
The filter membrane was examined under a microscope (Model AX880, OLYMPUS, Hachioji, Japan) using a “Z” shape scanning pattern to ensure comprehensive observation. Suspected microplastic particles were initially identified, photographed, and recorded in a laboratory notebook. Recorded information included particle shape, color, and size, with particle size defined as the length of the longest side. Based on established morphological classification schemes, the microplastics identified in this study were categorized into four primary types: fibers, films, fragments, and particles [28]. The distribution of these shapes is shown in Figure 2. Throughout the observation process, the light source was adjusted as needed to accurately reveal the true shape and color of the particles, minimizing misjudging the color and shape of the suspected particles due to lighting or viewing angle.
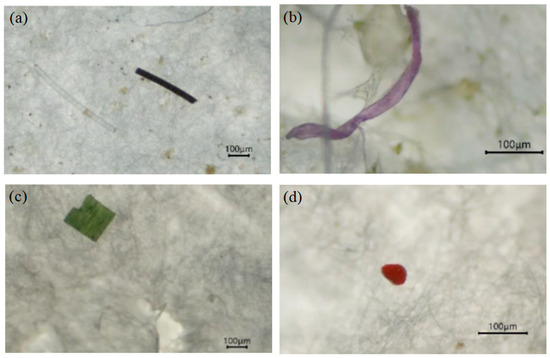
Figure 2.
Morphological Characteristics of Microplastics in the Surface Water of the Feiyun River Basin, (a): Fiber, (b): Film, (c): Fragment, (d): Particle.
The polymer types of microplastics were identified by laser micro-Raman spectrometer (INVIA, Renishaw, UK), and the spectra of 10–15% of the suspected particles were measured by laser micro-Raman spectrometer, the Raman spectra ranged from 50 to 3500 cm−1 with an incident laser wavelength of 532 nm and were then compared with the peak positions of different polymers in other studies to determine the polymer type.
2.3.3. Quality Control
To prevent contamination during sampling and testing, all procedures were conducted while wearing nitrile gloves and a cotton laboratory coat. All equipment used in the experiment was thoroughly cleaned multiple times with ultrapure water prior to use. For each experiment, three blank samples were prepared and subjected to the same procedures as the experimental group. During data processing, the average number of microplastics detected in the blank samples was subtracted from the experimental result to account for background contamination.
2.3.4. Data Processing and Analysis
The distribution of sampling sites was mapped using Arcgis 10.8 software. Spearman correlation analysis was performed using SPSS 26.0, with all results tested at a significant level of 0.05. Data visualization and related charts were generated using Origin 2021 and Excel 2019. Microplastic abundance in water samples was expressed in units of “items/L”.
2.4. Ecological Risk Assessment Methods for Microplastics
2.4.1. Composite Pollution Load Index
To assess the extent of microplastic contamination in river surface waters, a composite Pollution Load Index (PLI) was applied, following the method developed by Tomlinson [29]. The PLI was calculated using the following formula:
In the formulae, Ci represents microplastic concentration at each sampling point, and C0i represents the lowest microplastic concentration observed in this field study, as no reference value for uncontaminated conditions is available. PLIzone indicates the overall microplastic pollution level for the study area. The PLI is divided into four levels [30]: Level I: Low (0–10); Level II: Moderate (11–20); and Level III: High (21–30); and Level IV: Very high (>30).
2.4.2. Polymer Risk Index
At present, there is no standardized and systematic method for assessing the potential ecological risk of microplastic pollution in river systems.
Therefore, an ecological risk assessment model based on polymer type and hazard score, as proposed by Lithner et al. [31] and Li [32], was adopted to assess the ecological risk of microplastic pollution in river systems in this study. The model is defined by the following formulas:
In these formulas, Pn is the proportion of polymer in each sample, and Sn is the hazard score for the microplastic polymer type. The most common polymer types encountered were polypropylene (PP), polyethylene (PE), polyethylene terephthalate (PET), and polystyrene (PS) with corresponding hazard scores of 1, 11, 4, and 30, respectively. The PHI values are divided into five levels: Level I (Low, PHI = 0–1); Level II (Moderate, PHI = 1–10); Level III (High, PHI = 10–100); Level Ⅳ (Moderately High, PHI = 100–1000); and Level V (Very High, PHI > 1000).
2.4.3. Index of Potential Ecological Harm
The PERI is a potential ecological risk factor for each polymer in each sample, and the model is defined by the following formulas:
In these formulas, Ei is the indicator of the potential ecological risk of a single microplastic polymer, Ti represents the toxic factor for each polymer. The Ti values were assigned as follows: 10 for polypropylene (PP), 1 for polyethylene (PE), 100 for polyethylene terephthalate (PET), and 1000 for polystyrene (PS), according to the hazard ranking of plastic polymers based on their chemical composition. [31,32]. which is the product of the percentage and hazard fraction of a single plastic polymer. PERI is divided into five levels: Level I (low, PERI < 150); Level II (Moderate, PERI = 150–300); Level III (high, PERI = 300–600); Level IV (Moderately High, PERI = 600–1200); and Level V (Very high, PERI > 1200).
3. Results
3.1. Occurrence Characteristics of Microplastics
3.1.1. Distribution of Microplastics
The abundance distribution of microplastics in the surface water of the Feiyun River basin is shown in Figure 3. Microplastics were detected at all 15 sampling sites. The abundance of microplastics in the surface water ranged from 3.7 to 36.4 items/L, with an average of 11.0 ± 2.39 items/L. Microplastic concentrations typically range from a few to several hundred items per liter. Since the increase in microplastics research in 2016, scientists have systematically investigated microplastic pollution in China’s aquatic environments. The average abundance of microplastics in freshwater environments was reported to be 10.62 ± 36.99 items/L [20]. Jin [19] examined canal water in southern Jiangsu and found microplastic abundances ranging from 3.41 to 19.07 items/L, with an average of 9.59 ± 3.95 items/L. The microplastic abundance observed in the Feiyun River basin in this study is comparable to the levels reported for major urban agglomerations worldwide.
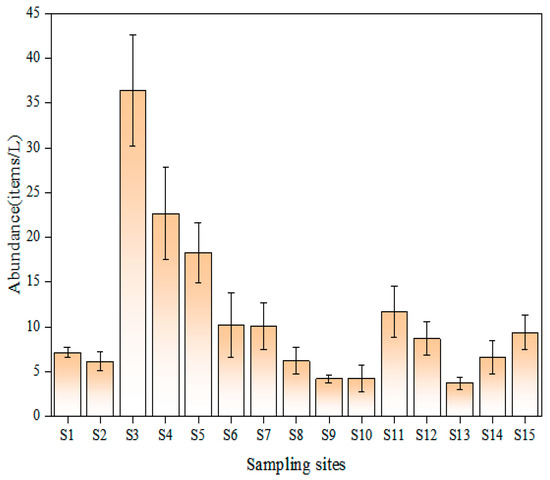
Figure 3.
Abundance distribution of microplastics in surface water of the Feiyun River basin.
3.1.2. Characterization of Microplastics
The color of microplastics can provide information about potential sources and the extent of weathering processes [33]. Identifying the color of microplastics is also important for understanding their bioavailability, as aquatic organisms may accidentally ingest colored microplastics during feeding because they resemble prey [34]. Previous studies have shown that light-colored (e.g., white, transparent, and blue) microplastics are easily mistaken for food and ingested by fish in the surface water of the Feiyun River basin. The color distribution of microplastics in surface water of the Feiyun River basin is shown in Figure 4, the colors of microplastics were mainly transparent and black, accounting for 72% of all particles. Most of these were in debris or particle form. Blue microplastics made up 11% and were mostly fibrous in shape. Previous studies have shown that white, transparent, and colored microplastics dominate in China’s inland water systems [35,36]. Liu [37] reported that transparent microplastics were the most common in the Qilian Mountains River, making up 37.3% of the total. Similarly, a study of microplastic distribution in the surface water of the Elgin River found that the majority of particles in the water samples were black (49%) and blue (25%) [38]. White and transparent microplastics are often associated with plastic bags and food packaging materials. Moreover, the color of microplastics can fade upon exposure to environmental factors such as UV radiation and mechanical abrasion, resulting in the formation of light-colored microplastic particles [39,40].
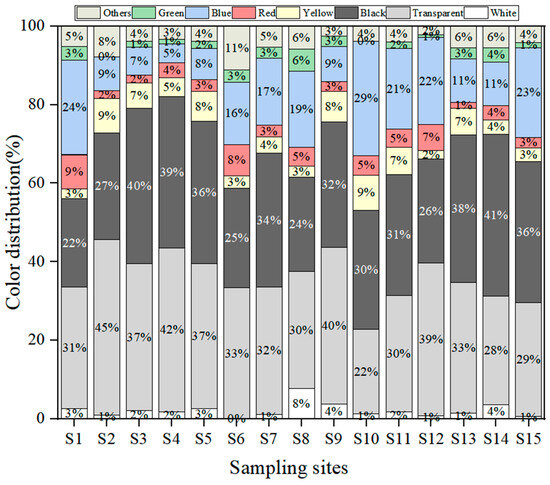
Figure 4.
Color distribution of microplastics in surface water of the Feiyun River basin.
The morphology distribution of microplastics in the surface water of Feiyun River basin is shown in Figure 5. The predominant shape of microplastics was particles (41%), followed by debris (29%), most of which were black and transparent. Fibrous microplastics accounted for 23%, while film microplastics were the least common, making up only 7%. Although fibers are the dominant form of microplastics in many studies, this study observed a higher proportion of particles and fragments, including a different pattern. Similar morphological distributions have been reported previously. For instance, Jin et al. [19]. investigated the morphology and composition of microplastic particles in the canal water of southern Jiangsu province and found that particles accounted for 68.47%. Fan [35] studied microplastic morphology in typical urban river networks in eastern China and reported that debris accounted for 52.4%. Falling films were noted to produce plastic fragments that disperse into the water. The large amount of particles and debris found in the surface water of the Feiyun River basin suggests a significant industrial source of microplastics. This may reflect the developed economy and society of the region, where most modern communities have centralized water supply and drainage systems. Sewage treatment plants can effectively intercept fibrous microplastics from the wastewater, thereby reducing their discharge into natural water bodies. At the same time, the study found that the proportion of granular microplastics in the main stream of the Feiyun River basin is greater than that in the tributaries, while the proportion of fibrous microplastics in the tributaries is slightly greater than that in the main stream. The tributary sampling points are located in areas with relatively concentrated population density, and most of the fibrous microplastics may come from clothing. The shape of microplastics varies depending on river reach and pollution sources and is influenced by human activities. These variations result in significant differences in microplastic morphology between urban and rural areas within the same watershed.
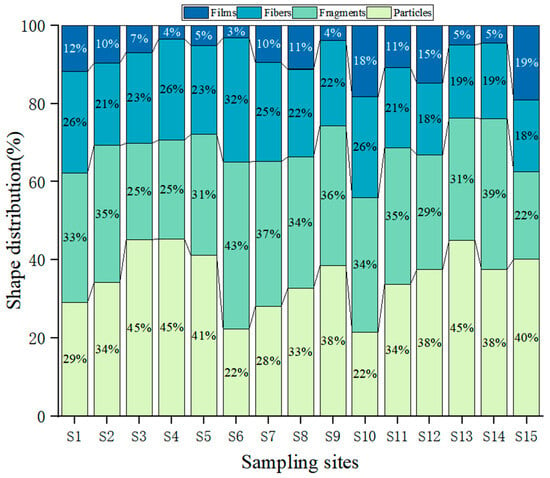
Figure 5.
Morphology distribution of microplastics in surface water of the Feiyun River basin.
The size distribution of microplastics in the surface water of the Feiyun River basin is shown in Figure 6. A total of 15% of the microplastics were in the size range of 0.0380–1 mm, while 15% ranged from 0.2–0.5 mm. Overall, 79% of the microplastics were smaller than 0.5 mm, and their abundance decreased with increasing particle size. In the Liangfeng River basin of Guilin, Guangxi Province, 57.89–95.12% microplastics were found to be small in size (0.05–0.33 mm) [41]. In Wenzhou, Zhejiang Province, it was found that MP less than 200 μm in water and sediment accounted for 79.3% and 69.1%, respectively in the range of 100–200 μm of microplastics in Sanyang wetland [42]. Similarly, in the Qiantang River section of Hangzhou, microplastics that are smaller than 1 mm account for 60% of the microplastics in the surface water [43]. Still, in the Renhuai watershed of the Chishui River, 63.9% of the microplastics were found to be within the 0.5–1.0 mm range [44], comparable to our findings for the Feiyun River.
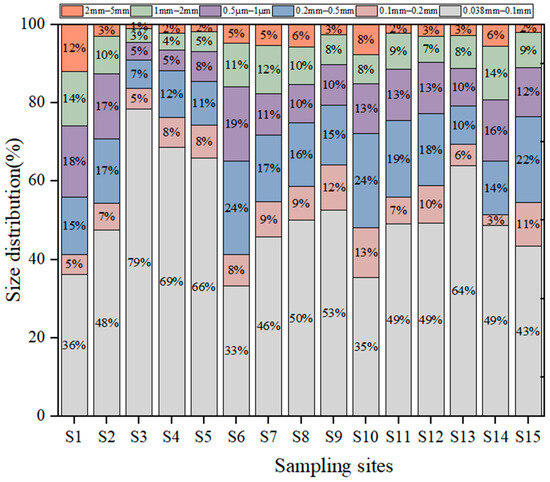
Figure 6.
Particle size distribution of microplastics in surface water of Feiyun River basin.
From the lower reaches of the Jinsha River to the Yangtze River estuary, the proportion of small particles (<1 mm) in the water samples collected by the filtration method was higher than that by the trawl method (74.9% vs. 69.6%). This suggests that the filtration method is more effective at capturing smaller microplastics compared with trawling. At the same time, the presence of large quantities of microplastics in the water samples also indicates that using a large-aperture sieve may lead to an underestimation of microplastic abundance [18].
The polymer composition of microplastics in the surface water of the Feiyun River Basin was identified using laser micro-Raman spectroscopy shown in Figure 7. The results revealed that the microplastics were predominantly composed of polyethylene terephthalate (PET, 41.07%), polypropylene (PP, 21.55%), polyethylene (PE, 17.50%), and polystyrene (PS, 12.38%). Other polymers, including polyamide (PA), polyvinyl chloride (PVC), and rayon, collectively constituted 7.50% of the total, with each individually accounting for less than 3%. PET, PE, PP, PS, and PVC are widely used plastics in daily life. Polyethylene terephthalate (PET) is an aliphatic polyester commonly used in the production of household goods such as clothing, carpets, home textiles, beverage bottles, and packaging bags. It dominates the production of synthetic fibers. Polyethylene (PE) is widely used in storage containers and is a common material for plastic bags and plastic wrap. Polypropylene (PP) is commonly used in the manufacture of plastic products such as buckets, baskets, agricultural woven bags, plastic film, packaging films, packaging materials, and fishing nets, and has been identified in numerous experimental studies as a major component of environmental microplastics [45]. Polystyrene (PS) is commonly used to produce disposable tableware. It is worth noting that although the theoretical density of PET is higher than that of saturated NaCl solution for flotation separation, PET is still identified as the main polymer.
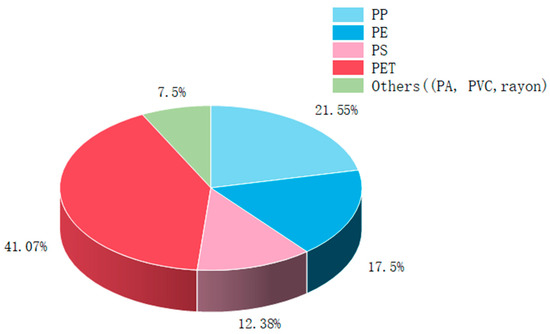
Figure 7.
Polymer composition of microplastic in surface water of Feiyun River Basin.
3.2. Effects of Environmental Factors on Distribution Characteristics of Micro-Plastics
The correlation analysis showed that the abundance of microplastics was positively correlated with both pH and Chla, including pH (r = 0.73, p < 0.05) and Chla (r = 0.83, p < 0.05). Previous studies have demonstrated that microalgae are susceptible to microplastic exposure, which can inhibit algal growth and photosynthesis, thereby reducing chlorophyll content [46]. Most studies have shown that nutrients such as nitrate, nitrite, and phosphate have a significant impact on primary productivity in aquatic systems [47]. These nutrients are considered key indicators of water pollution, often resulting from industrial, agricultural, and urban-related activities. The significant correlation between microplastic abundance and nutrient concentrations may suggest that they share similar distribution patterns and pollution sources. Figure 8 showed that there was a negative correlation between the abundance of microplastics and BOD5 (r =−0.64, p < 0.05). Buwono [48] investigated microplastics in the Brantas River and found that BOD5 had a significant impact on microplastic concentrations. BOD5 concentration reflects the amount of oxygen required by microorganisms to decompose organic molecules in water. High BOD5 values indicate severe organic pollution, suggesting that the river is severely impacted by waste discharge. Furthermore, BOD5 can reflect the presence of plastic-degrading bacteria, often referred to as aerobic binding bacteria, which, like all living organisms, require oxygen to survive.
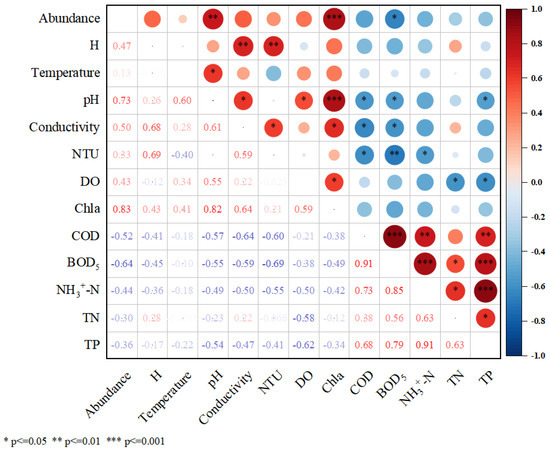
Figure 8.
Correlation between microplastics abundance and physicochemical parameters in the Feiyun River basin.
3.3. Ecological Risk Assessment of Microplastics
In combination with the PLI, PHI, and PERI indices, the ecological risks associated with microplastic pollution in the surface water of the Feiyun River basin were assessed. The risk assessment values for each sampling point are shown in Figure 9. PLI results indicated that all sampling sites in the study area fell within Grade I, and the overall PLIzone value was 1.5, suggesting that the ecological risk of microplastics in the surface water is low. The PHI results showed that most sampling sites were classified as Grade II, except for S7, S9, and S14, where the PHI values were 10.17, 12.25, and 13.33, respectively. The PHI zone value was 7.3, indicating an intermediate ecological risk level for microplastics in the surface water. As for the PERI results, all sites were classified as Grade I, with a PERIzone value of 11.3, suggesting that there was a low ecological risk posed by microplastics in surface water. Qiu [20] used the Pollution Load Index to assess the ecological risks posed by microplastics in China and found that 47% aquatic environments were exposed to moderate or higher levels of pollution. Li [49] risk assessment results showed that the Pollution Risk Index value of the water was 201.79, while the sediment had a value of 184.98, indicating a moderate potential ecological risk.
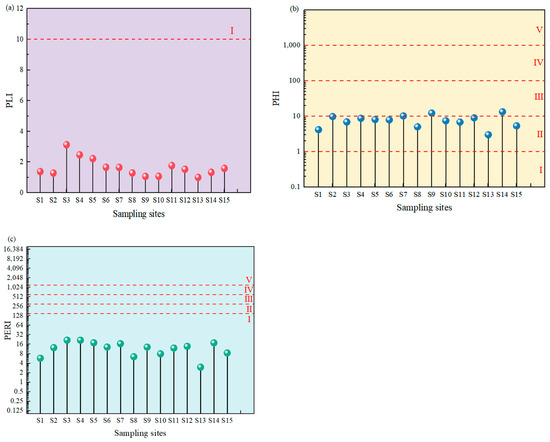
Figure 9.
Ecological Risk Assessment Index chart. (a): PLI, (b): PHI, (c): PERI. Note: The classification criteria for risk levels (I–V) for each index are provided in Section 2.4.
4. Discussion
4.1. Dominance of PET and Methodological Considerations
Despite the relatively high intrinsic density of pristine polyethylene terephthalate (PET, 1.38 g/cm3) compared to the saturated NaCl solution used for flotation (density: 1.20 g/cm3), PET was identified as the predominant polymer type in the surface water of the Feiyun River basin. This apparent contradiction has also been observed in other studies using NaCl for separation. For example, Lin [50] found that even when using a NaCl solution with a density of 1.2 g/cm3 for flotation separation, PET still accounted for 28.6% of the identified microplastics in the Guangzhou. This obvious contradiction may be explained by changes in the physical properties of microplastics in the environment. Research indicates that photo-oxidative aging and mechanical abrasion can generate micro-cracks and pores on the plastic surface. It is plausible that the entrapment of air within these voids could significantly reduce the apparent density of the particles, enabling even high-density polymers like PET to float [51]. Furthermore, the small size and irregular, fibrous morphology of environmental microplastics increase fluid drag, substantially slowing their settling velocity [28], which may also contribute to their recovery in the supernatant. Therefore, within the limited time frame of the flotation process, a substantial portion of PET particles remain suspended and are recovered. While NaCl is recognized for its cost-effectiveness and safety in separating prevalent low-density polymers like PE and PP [27], our results demonstrate that it can also recover a significant fraction of aged and fragmented high-density polymers, a fact corroborated by Raman spectroscopic confirmation.
4.2. Potential Sources and Ecological Implications
The high abundance of PET is consistent with the industrial and socioeconomic profile of the Feiyun River basin. Wenzhou City, through which the river flows, is a major hub for the textile and apparel industry [52], which is a known source of polyester (PET) fibers. Concurrently, high population density and urbanization drive the consumption and disposal of PET products, such as beverage bottles and food packaging [53]. These findings suggest that urban wastewater discharge and surface runoff are likely key pathways for microplastics entering the river. A recent study conducted in the Taihu Lake Basin, another industrialized region in eastern China, showed that textile industrial wastewater can release up to 2.5 × 10⁵ ultrafine fibers, mainly PET, into the aquatic environment every day [54]. At the same time, high population density and urbanization have promoted the consumption and disposal of disposable plastic consumer goods such as beverage bottles and food packaging, further promoting the abundance of PET, PP and PS. A study of urban rivers in the Pearl River Delta confirms that population density and plastic consumption patterns are key determinants of the distribution of microplastic polymers [55]. Our results show that particulate and fragmented microplastics are more common in mainstream industries (such as S3, S4), which corresponds to the release of particles during plastic raw material processing and product manufacturing. In contrast, the proportion of fiber microplastics in densely populated tributary areas (such as S7, S9) is relatively high, confirming that domestic wastewater, especially laundry wastewater, is an important way for fiber input. A comprehensive study of sewage treatment plants in China shows that although these facilities can remove up to 98% of microplastics, a large amount of wastewater after treatment is still an important source of receiving water-fibrous microplastics [56]. The universality and physical properties of these polymers have caused obvious ecological problems. Studies have shown that PET and PS microplastics can effectively adsorb heavy metals such as lead and cadmium, and the adsorption capacity increases with the decrease in particle size [57]. In addition, the dominance of small-sized microplastics (<0.5 mm, 79% in this study) significantly increased their bioavailability to a variety of aquatic organisms. Studies on freshwater fish have shown that 0.5 mm <microplastics are more easily ingested and can be transferred from the gastrointestinal tract to other tissues [58].
Although the results show that the overall ecological risk of PLI and PERI is low, the PHI is at a medium risk level and the PHI values of S7, S9 and S14 sites are higher, and the cumulative risk of polymers in the local environment may be high. A recent study using a similar multi-indicator approach in the Yangtze Estuary found that although the overall risk level is low, it poses a significant ecological threat at specific sites [59]. In the future, it is necessary to integrate ecotoxicological studies to better elucidate the long-term ecological effects of this microplastic compound pollution.
5. Conclusions
The abundance of microplastics in the surface water of the Feiyun River basin ranged from 3.7 to 36.4 items/L, with an average of 11.0 ± 2.39 items/L, which is comparable to the levels observed in major urban rivers worldwide. The predominant shapes of microplastics were particles, followed by fragments and fibers. The main colors were white, black, and blue. Most microplastics were smaller than 0.1 mm (57%) in size. The main polymer types were PET, PP, and PS. A risk assessment of microplastics in the surface water of the Feiyun River basin was carried out. The PLI and Peri results indicated a low ecological risk, while the PHT result suggested a moderate ecological risk. Correlation analysis showed that the microplastic abundance was positively correlated with pH (r = 0.73, p < 0.05) and Chla (r = 0.83, p < 0.05) and negatively correlated with BOD5 (r =−0.64, p < 0.05). These findings suggest a relationship between microplastic distribution and water quality parameters, indicating that monitoring water quality may help us to analyze future microplastic pollution trends. Further research is needed in the following areas. (1) Monitor the spatial–temporal dynamics of microplastics and identify the predictive indicators of pollution trends. (2) Investigate the spatial–temporal factors influencing microplastics pollution to understand the sources and pathways so as to facilitate the development of effective management policies to reduce ecological risk. Understanding the sources and approaches that facilitate the development of management policies to reduce environmental risks. (3) Study the distribution of microplastics across major river basins, develop accurate models to evaluate their migration mechanism, and explore their transport pathways from land-based sources to inland waters. (4) Examine the interrelations between microplastics and other pollutants, including heavy metals and persistent organic pollutants.
Author Contributions
Conceptualization, T.T. and A.L.; methodology, T.T.; formal analysis, A.L.; investigation, Y.Y.; resources, R.Y. and N.L.; data curation, Y.Y.; writing—original draft preparation, T.T. and A.L.; writing—review and editing, Q.K.; supervision, Y.Y.; project administration, Q.W.; funding acquisition, Q.W. All authors have read and agreed to the published version of the manuscript.
Funding
This research was funded by the Wenzhou Science and Technology Major Program, China, Grant Number ZS2022005.
Data Availability Statement
The original contributions presented in this study are included in the article. Further inquiries can be directed to the corresponding author.
Acknowledgments
We thank Alan K. Chang from the College of Life and Environmental Sciences at Wenzhou University for kindly revising the language of the manuscript.
Conflicts of Interest
Author Ruizhang Yu was employed by the company Rui’an Environmental Monitoring Station. Author Nansheng Lin was employed by the company Rui’an Environmental Monitoring Station. Author Aqiu Liu was employed by the company Inner Mongolia Xingyuan New Material Technology Company Ltd. The remaining authors declare that the research was conducted in the absence of any commercial or financial relationships that could be construed as a potential conflict of interest.
Abbreviations
The following abbreviations are used in this manuscript:
| PP | Polypropylene |
| PE | Polyethylene |
| PET | Polyethylene Terephthalate |
| PS | Polystyrene |
| PA | Polyamide |
| PVC | Polyvinyl Chloride |
References
- Thompson, R.C.; Courtene-Jones, W.; Boucher, J.; Pahl, S.; Raubenheimer, K.; Koelmans, A.A. Twenty years of microplastic pollution research—What have we learned? Science 2024, 386, eadl2746. [Google Scholar] [CrossRef]
- Janakiram, R.; Keerthivasan, R.; Janani, R.; Ramasundaram, S.; Martin, M.; Venkatesan, R.; Murthy, M.R.; Sudhakar, T. Seasonal distribution of microplastics in surface waters of the Northern Indian Ocean. Mar. Pollut. Bull. 2023, 190, 114838. [Google Scholar] [CrossRef]
- Akkan, T.; Gedik, K.; Mutlu, T. Protracted dynamicity of microplastics in the coastal sediment of the Southeast Black Sea. Mar. Pollut. Bull. 2023, 188, 114722. [Google Scholar] [CrossRef]
- Talukdar, A.; Bhattacharya, S.; Bandyopadhyay, A.; Dey, A. Microplastic pollution in the Himalayas: Occurrence, distribution, accumulation and environmental impacts. Sci. Total Environ. 2023, 874, 162495. [Google Scholar] [CrossRef]
- Fan, W.; Qiu, C.; Qu, Q.; Hu, X.; Mu, L.; Gao, Z.; Tang, X. Sources and identification of microplastics in soils. Soil Environ. Health 2023, 1, 100019. [Google Scholar] [CrossRef]
- O’Brien, S.; Rauert, C.; Ribeiro, F.; Okoffo, E.D.; Burrows, S.D.; O’Brien, J.W.; Wang, X.; Wright, S.L.; Thomas, K.V. There’s something in the air: A review of sources, prevalence and behaviour of microplastics in the atmosphere. Sci. Total Environ. 2023, 874, 162193. [Google Scholar] [CrossRef] [PubMed]
- Huang, L.; Zhang, S.; Li, L.; Zhang, S.; Wang, J.; Liu, X.; Zhang, W. Research progress on microplastics pollution in polar oceans. Polar Sci. 2023, 36, 100946. [Google Scholar] [CrossRef]
- Mariani, F.; Di Lernia, D.; Venditti, I.; Pelella, E.; Muzzi, M.; Di Giulio, A.; Ceschin, S. Trophic transfer of microplastics from producer (Lemna minuta) to primary consumer (Cataclysta lemnata) in a freshwater food chain. Sci. Total Environ. 2023, 891, 164459. [Google Scholar] [CrossRef] [PubMed]
- Zhao, H.; Hong, X.; Chai, J.; Wan, B.; Zhao, K.; Han, C.; Zhang, W.; Huan, H. Interaction between microplastics and pathogens in subsurface system: What we know so far. Water 2024, 16, 499. [Google Scholar] [CrossRef]
- Do, A.T.N.; Ha, Y.; Kwon, J.-H. Leaching of microplastic-associated additives in aquatic environments: A critical review. Environ. Pollut. 2022, 305, 119258. [Google Scholar] [CrossRef]
- Lebreton, L.C.; Van Der Zwet, J.; Damsteeg, J.-W.; Slat, B.; Andrady, A.; Reisser, J. River plastic emissions to the world’s oceans. Nat. Commun. 2017, 8, 15611. [Google Scholar] [CrossRef] [PubMed]
- Devereux, R.; Westhead, E.K.; Jayaratne, R.; Newport, D. Microplastic abundance in the Thames River during the New Year period. Mar. Pollut. Bull. 2022, 177, 113534. [Google Scholar] [CrossRef]
- Laermanns, H.; Reifferscheid, G.; Kruse, J.; Földi, C.; Dierkes, G.; Schaefer, D.; Scherer, C.; Bogner, C.; Stock, F. Microplastic in water and sediments at the confluence of the Elbe and Mulde Rivers in Germany. Front. Environ. Sci. 2021, 9, 794895. [Google Scholar] [CrossRef]
- Zhdanov, I.; Lokhov, A.; Belesov, A.; Kozhevnikov, A.; Pakhomova, S.; Berezina, A.; Frolova, N.; Kotova, E.; Leshchev, A.; Wang, X. Assessment of seasonal variability of input of microplastics from the Northern Dvina River to the Arctic Ocean. Mar. Pollut. Bull. 2022, 175, 113370. [Google Scholar] [CrossRef]
- Frank, Y.A.; Vorobiev, E.D.; Vorobiev, D.S.; Trifonov, A.A.; Antsiferov, D.V.; Soliman Hunter, T.; Wilson, S.P.; Strezov, V. Preliminary screening for microplastic concentrations in the surface water of the Ob and Tom Rivers in Siberia, Russia. Sustainability 2020, 13, 80. [Google Scholar] [CrossRef]
- Li, Y.; Zhang, Y.; Chen, G.; Xu, K.; Gong, H.; Huang, K.; Yan, M.; Wang, J. Microplastics in surface waters and sediments from Guangdong coastal areas, South China. Sustainability 2021, 13, 2691. [Google Scholar] [CrossRef]
- Han, M.; Niu, X.; Tang, M.; Zhang, B.-T.; Wang, G.; Yue, W.; Kong, X.; Zhu, J. Distribution of microplastics in surface water of the lower Yellow River near estuary. Sci. Total Environ. 2020, 707, 135601. [Google Scholar] [CrossRef] [PubMed]
- He, D.; Chen, X.; Zhao, W.; Zhu, Z.; Qi, X.; Zhou, L.; Chen, W.; Wan, C.; Li, D.; Zou, X. Microplastics contamination in the surface water of the Yangtze River from upstream to estuary based on different sampling methods. Environ. Res. 2021, 196, 110908. [Google Scholar] [CrossRef]
- Jin, X.; Fu, X.; Lu, W.; Wang, H. The effects of riverside cities on microplastics in river water: A case study on the Southern Jiangsu Canal, China. Sci. Total Environ. 2023, 858, 159783. [Google Scholar] [CrossRef] [PubMed]
- Qiu, Y.; Zhou, S.; Zhang, C.; Qin, W.; Lv, C. A framework for systematic microplastic ecological risk assessment at a national scale. Environ. Pollut. 2023, 327, 121631. [Google Scholar] [CrossRef]
- Wang, G.; Lu, J.; Li, W.; Ning, J.; Zhou, L.; Tong, Y.; Liu, Z.; Zhou, H.; Xiayihazi, N. Seasonal variation and risk assessment of microplastics in surface water of the Manas River Basin, China. Ecotoxicol. Environ. Saf. 2021, 208, 111477. [Google Scholar] [CrossRef]
- Kabir, A.E.; Sekine, M.; Imai, T.; Yamamoto, K.; Kanno, A.; Higuchi, T. Assessing small-scale freshwater microplastics pollution, land-use, source-to-sink conduits, and pollution risks: Perspectives from Japanese rivers polluted with microplastics. Sci. Total Environ. 2021, 768, 144655. [Google Scholar] [CrossRef] [PubMed]
- HJ 828-2017; Water Quality-Determination of the Chemical Oxygen Demand-Dichromate Method. China Environmental Science Press: Beijing, China, 2017.
- HJ 535-2009; Water Quality-Determination of Ammonia Nitrogen-Nessler’s Reagent Spectrophotometry. China Environmental Science Press: Beijing, China, 2009.
- HJ 636-2012; Water Quality-Determination of Total Nitrogen-Alkaline Potassium Persulfate Digestion UV Spectrophotometric Method. China Environmental Science Press: Beijing, China, 2012.
- GB/T 11893-1989; Water Quality-Determination of Total Phosphorus-Ammonium Molybdate Spectrophotometric Method. China Environmental Science Press: Beijing, China, 1989.
- Cole, M.; Webb, H.; Lindeque, P.K.; Fileman, E.S.; Halsband, C.; Galloway, T.S. Isolation of microplastics in biota-rich seawater samples and marine organisms. Sci. Rep. 2014, 4, 4528. [Google Scholar] [CrossRef]
- Kowalski, N.; Reichardt, A.M.; Waniek, J.J. Sinking rates of microplastics and potential implications of their alteration by physical, biological, and chemical factors. Mar. Pollut. Bull. 2016, 109, 310–319. [Google Scholar] [CrossRef]
- Tomlinson, D.L.; Wilson, J.G.; Harris, C.; Jeffrey, D. Problems in the assessment of heavy-metal levels in estuaries and the formation of a pollution index. Helgoländer Meeresunters. 1980, 33, 566–575. [Google Scholar] [CrossRef]
- Stolte, A.; Forster, S.; Gerdts, G.; Schubert, H. Microplastic concentrations in beach sediments along the German Baltic coast. Mar. Pollut. Bull. 2015, 99, 216–229. [Google Scholar] [CrossRef]
- Lithner, D.; Larsson, Å.; Dave, G. Environmental and health hazard ranking and assessment of plastic polymers based on chemical composition. Sci. Total Environ. 2011, 409, 3309–3324. [Google Scholar] [CrossRef] [PubMed]
- Li, R.; Yu, L.; Chai, M.; Wu, H.; Zhu, X. The distribution, characteristics and ecological risks of microplastics in the mangroves of Southern China. Sci. Total Environ. 2020, 708, 135025. [Google Scholar] [CrossRef]
- Wicaksono, E.A.; Werorilangi, S.; Galloway, T.S.; Tahir, A. Distribution and seasonal variation of microplastics in Tallo River, Makassar, Eastern Indonesia. Toxics 2021, 9, 129. [Google Scholar] [CrossRef]
- Zhang, R.; Guo, Z.; Lin, L.; Pan, X.; Gao, Y.; Liu, Y. Occurrence Characteristics and Ecological Risk Assessment of Microplastics in Aquatic Environments of Cascade Reservoirs Along the Middle-Lower Han River. Water 2025, 17, 2793. [Google Scholar] [CrossRef]
- Fan, J.; Zou, L.; Duan, T.; Qin, L.; Qi, Z.; Sun, J. Occurrence and distribution of microplastics in surface water and sediments in China’s inland water systems: A critical review. J. Clean. Prod. 2022, 331, 129968. [Google Scholar] [CrossRef]
- Deng, C.; Huang, Y.; Hu, Y.; Zhang, Q.; Zhao, H. Factors Influencing the Spatial Distribution of Microplastics in Lakes with the Example of Dianchi Lake. Water 2025, 17, 2377. [Google Scholar] [CrossRef]
- Liu, Q.; Xiong, X.; Wang, K.; Wang, H.; Ling, Y.; Li, Q.; Xu, F.; Wu, C. Homogenization of microplastics in alpine rivers: Analysis of microplastic abundance and characteristics in rivers of Qilian Mountain, China. J. Environ. Manag. 2023, 340, 118011. [Google Scholar] [CrossRef] [PubMed]
- Akdogan, Z.; Guven, B.; Kideys, A.E. Microplastic distribution in the surface water and sediment of the Ergene River. Environ. Res. 2023, 234, 116500. [Google Scholar] [CrossRef] [PubMed]
- Song, Y.K.; Hong, S.H.; Jang, M.; Han, G.M.; Jung, S.W.; Shim, W.J. Combined effects of UV exposure duration and mechanical abrasion on microplastic fragmentation by polymer type. Environ. Sci. Technol. 2017, 51, 4368–4376. [Google Scholar] [CrossRef]
- Brandon, J.; Goldstein, M.; Ohman, M.D. Long-term aging and degradation of microplastic particles: Comparing in situ oceanic and experimental weathering patterns. Mar. Pollut. Bull. 2016, 110, 299–308. [Google Scholar] [CrossRef]
- Xia, F.; Wang, Y.; Wang, D.; Cai, Y.; Zhang, J. Seasonal pulse effect of microplastics in the river catchment-From tributary catchment to mainstream. J. Environ. Manag. 2023, 342, 118316. [Google Scholar] [CrossRef]
- Zhang, H.; Pu, M.; Zheng, M.; Xu, B.; Magnuson, J.T.; Chen, Q.; Xu, X.; Zheng, X.; Zhao, M.; Qiu, W. Abundance of microplastics in a typical urban wetland in China: Association with occurrence and carbon storage. J. Hazard. Mater. 2025, 488, 137451. [Google Scholar] [CrossRef] [PubMed]
- Dai, L.; Wang, Z.; Guo, T.; Hu, L.; Chen, Y.; Chen, C.; Yu, G.; Ma, L.Q.; Chen, J. Pollution characteristics and source analysis of microplastics in the Qiantang River in southeastern China. Chemosphere 2022, 293, 133576. [Google Scholar] [CrossRef]
- Li, J.; Ouyang, Z.; Liu, P.; Zhao, X.; Wu, R.; Zhang, C.; Lin, C.; Li, Y.; Guo, X. Distribution and characteristics of microplastics in the basin of Chishui River in Renhuai, China. Sci. Total Environ. 2021, 773, 145591. [Google Scholar] [CrossRef]
- Ma, J.; Niu, X.; Zhang, D.; Lu, L.; Ye, X.; Deng, W.; Li, Y.; Lin, Z. High levels of microplastic pollution in aquaculture water of fish ponds in the Pearl River Estuary of Guangzhou, China. Sci. Total Environ. 2020, 744, 140679. [Google Scholar] [CrossRef]
- Guschina, I.A.; Hayes, A.J.; Ormerod, S.J. Polystyrene microplastics decrease accumulation of essential fatty acids in common freshwater algae. Environ. Pollut. 2020, 263, 114425. [Google Scholar] [CrossRef]
- Yang, T.; Zeng, Y.; Kang, Z.; Cai, M.; Chen, K.; Zhao, Q.; Lin, J.; Liu, R.; Xu, G. Enrichment and ecological risks of microplastics in mangroves of southern Hainan Island, China. Sci. Total Environ. 2023, 889, 164160. [Google Scholar] [CrossRef]
- Buwono, N.R.; Risjani, Y.; Soegianto, A. Distribution of microplastic in relation to water quality parameters in the Brantas River, East Java, Indonesia. Environ. Technol. Innov. 2021, 24, 101915. [Google Scholar] [CrossRef]
- Li, Y.; Qin, L.; Dou, Y.; Shen, M.; Chen, X.; Liang, X.; Ao, T.; Jin, K.; Duan, X. Occurrence and Risk Assessment of Microplastics in a Source Water Reservoir in Middle Reaches of Yellow River. Water 2024, 16, 2478. [Google Scholar] [CrossRef]
- Lin, L.; Zuo, L.-Z.; Peng, J.-P.; Cai, L.-Q.; Fok, L.; Yan, Y.; Li, H.-X.; Xu, X.-R. Occurrence and distribution of microplastics in an urban river: A case study in the Pearl River along Guangzhou City, China. Sci. Total Environ. 2018, 644, 375–381. [Google Scholar] [CrossRef]
- Cooper, D.A.; Corcoran, P.L. Effects of mechanical and chemical processes on the degradation of plastic beach debris on the island of Kauai, Hawaii. Mar. Pollut. Bull. 2010, 60, 650–654. [Google Scholar] [CrossRef]
- Šaravanja, A.; Pušić, T.; Dekanić, T. Microplastics in wastewater by washing polyester fabrics. Materials 2022, 15, 2683. [Google Scholar] [CrossRef] [PubMed]
- Aslani, H.; Pashmtab, P.; Shaghaghi, A.; Mohammadpoorasl, A.; Taghipour, H.; Zarei, M. Tendencies towards bottled drinking water consumption: Challenges ahead of polyethylene terephthalate (PET) waste management. Health Promot. Perspect. 2021, 11, 60. [Google Scholar] [CrossRef]
- Li, F.; Guo, Z.; Mao, L.; Feng, J.; Huang, J.; Tao, H. Impact of textile industries on surface water contamination by Sb and other potential toxic elements: A case study in Taihu lake basin, China. Int. J. Environ. Res. Public Health 2023, 20, 3600. [Google Scholar] [CrossRef]
- Wang, H.; Zhu, T.; Wang, J.; Liu, Y. Microplastic pollution in Pearl River networks: Characteristic, potential sources, and migration pathways. Water Res. 2025, 276, 123261. [Google Scholar] [CrossRef]
- Acarer, S. Microplastics in wastewater treatment plants: Sources, properties, removal efficiency, removal mechanisms, and interactions with pollutants. Water Sci. Technol. 2023, 87, 685–710. [Google Scholar] [CrossRef]
- Muthuraja, R.; Ou, B.; Thangavelu, M.; Narhayanan, T.N.; Chittamart, N.; Janjaroen, D. Effects of particle size and aging on heavy metal adsorption by polypropylene and polystyrene microplastics under varying environmental conditions. Chemosphere 2024, 369, 143843. [Google Scholar] [CrossRef] [PubMed]
- Li, W.; Zeng, J.; Zheng, N.; Ge, C.; Li, Y.; Yao, H. Polyvinyl chloride microplastics in the aquatic environment enrich potential pathogenic bacteria and spread antibiotic resistance genes in the fish gut. J. Hazard. Mater. 2024, 475, 134817. [Google Scholar] [CrossRef] [PubMed]
- Zhang, F.; Peng, G.; Xu, P.; Zhu, L.; Li, C.; Wei, N.; Li, D. Ecological risk assessment of marine microplastics using the analytic hierarchy process: A case study in the Yangtze River Estuary and adjacent marine areas. J. Hazard. Mater. 2022, 425, 127960. [Google Scholar] [CrossRef] [PubMed]
Disclaimer/Publisher’s Note: The statements, opinions and data contained in all publications are solely those of the individual author(s) and contributor(s) and not of MDPI and/or the editor(s). MDPI and/or the editor(s) disclaim responsibility for any injury to people or property resulting from any ideas, methods, instructions or products referred to in the content. |
© 2025 by the authors. Licensee MDPI, Basel, Switzerland. This article is an open access article distributed under the terms and conditions of the Creative Commons Attribution (CC BY) license (https://creativecommons.org/licenses/by/4.0/).