Article

Temporal and Spatial Distribution Characteristics and Source Analysis of Antibiotic Resistance Gene Pollution in Dongliao River Basin, China

Key Laboratory of Songliao Aquatic Environment, Ministry of Education, Jilin Jianzhu University, Changchun 130118, China
*
Author to whom correspondence should be addressed.
Water 2025, 17(21), 3168; https://doi.org/10.3390/w17213168
Submission received: 29 September 2025 / Revised: 29 October 2025 / Accepted: 3 November 2025 / Published: 5 November 2025
(This article belongs to the Section Water Quality and Contamination)

Abstract

Antibiotic resistance genes (ARGs) are regarded as a major threat to public health and ecological security globally. The Dongliao River Basin is a typical farming–pastoral ecotone in the northeast of China. It is of great practical significance to explore the pollution characteristics and sources of ARGs in the Dongliao River. In this study, the Dongliao River Basin was taken as the research object, and water samples were collected at five points in the wet season, the normal season and the dry season, and the qPCR technology was used to detect the ARGs, revealing its spatial and temporal distribution characteristics. The results show that the temporal difference in ARGs was mainly in the wet season, and the contribution rates of sulfonamides (SAs) and aminoglycosides (AMs)ARGs were the largest, with relative abundance reaching 13–27% and 7–37%. In the normal season, the contribution rate of AMs ARGs further increased to 26–37%, while the contribution rate of SAs and tetracyclines (TCs) ARGs also showed a high level, accounting for 12–20% and 11–16%. In dry season, the ARGs of AMs and TCs reached 29–43% and 16–22%. As far as the spatial distribution characteristics were concerned, the absolute abundance of ARGs reached the maximum value of 3.79 × 10⁶ copies/mL in the sampling section of Chengzishang during the wet season. In the normal season, the absolute abundance of ARGs was the largest at the sampling section of Heqing River, which was 2.62 × 10⁶ copies/mL; While in the dry season, the absolute abundance of ARGs reached the maximum at the sampling section of Sishuang Bridge, which was 5.30 × 10⁶ copies/mL. Furthermore, using principal component analysis–multiple linear regression (PCA–MLR) model, sul1, sul2, aadA2–03, aadA–01 genes with high absolute abundance was selected for source analysis, so as to reveal the source of ARGs pollution in Dongliao River. The results indicated that sulfonamide resistance genes (sul1, sul2) were primarily driven by nutrient salt contamination; aminoglycoside resistance genes (aadA2–03, aadA–01) exhibit sensitivity to temperature gradients, with significant proliferation during high–temperature seasons. This study provided a scientific basis for the prevention and control strategy of ARGs pollution in the Dongliao River Basin.

1. Introduction

The extensive use of antibiotics leads to the emergence of resistant bacteria and even superbugs in almost all antibiotics [1,2]. Antibiotic resistance genes (ARGs) were induced by residual antibiotics in the environment. As a new type of pollutants, ARGs are different from traditional pollutants, and can be transferred vertically and horizontally through bacterial reproduction. Then they spread among different bacteria, further inducing antibiotic resistance, so it is often difficult to remove it effectively [3,4,5,6]. At present, antibiotic resistance is one of the important public health challenges facing human beings. The rapid development of global urbanization has expanded the scope of human activities, but at the same time, it has also aggravated the global human health risks caused by ARGs [7]. According to the estimation of research institutions, the number of people who die of antibiotic resistance every year in the world is as high as 700 thousand [8].
ARGs pollution in the aquatic environment has become an increasingly prominent environmental problem. Researchers all over the world have detected the existence of ARGs in various environments such as rivers, oceans, lakes, and groundwater [9,10,11]. For example, fourteen different ARGs were detected in living bacterial cells from 30 river basins in Iowa, USA [12]. Thirty-nine species of ARGs were also detected in the Huangpu River basin of China [13]. Moreover, ARGs exhibit significant distribution differences and diversity characteristics across different aquatic environments. Studies have shown that the abundance of ARGs in effluent from municipal wastewater treatment plants, hospital wastewater, and livestock and poultry farming wastewater is significantly higher than in natural rivers and lakes. Among these, sulfonamide, tetracycline, and β–lactam resistance genes are the most prevalent [14,15,16]. The primary sources of these resistance genes include human and animal feces, medical wastewater discharges, agricultural runoff, and aquaculture activities [17]. Meanwhile, spatial distribution patterns indicated that ARG concentrations increase during the rainy season due to surface runoff. Detection rates rose significantly in densely populated and industrialized areas, showing a trend of spreading downstream from point sources of pollution [18]. The widespread presence of ARGs in aquatic environments poses a potential threat to human health and ecosystems [19]. ARGs in aquatic environments can spread between different bacterial populations through horizontal gene transfer mechanisms, enabling pathogens to acquire multidrug resistance. This increases the difficulty of clinical treatment and heightens the risk of infection [20]. Contamination of drinking water sources with ARGs may expose populations to drug–resistant bacteria through direct contact or ingestion, leading to infectious diseases that are difficult to treat [21]. Furthermore, the accumulation of ARGs in aquatic ecosystems alters microbial community structure, impacts biogeochemical cycling processes, and may be transmitted through the food chain to organisms at higher trophic levels [22]. Therefore, it is of great significance for local people’s life and economic development to carry out research on the pollution situation of ARGs in freshwater basins [23].
The Dongliao River, an important tributary of the Liaohe River in China, originates from the Hadaling Mountains in Dongliao County, Jilin Province. It has a total length of about 360 km and a drainage area of 11,306 square kilometers, which is the main freshwater resource for local people. The intensive farming and animal husbandry activities in the Dongliao River Basin and the intensified urbanization process have increased the pressure on its water environment. The investigation results of water environment quality in Dongliao River Basin show that the water pollution situation is severe, and the main pollutants come from urban and rural domestic sewage, agricultural planting non–point source pollution, livestock and poultry breeding non–point source pollution, and industrial pollution [24,25]. However, at present, the research on ARG pollution in the Dongliao River is scarce, and there are some problems, such as a lack of seasonal characteristics of pollution sources [26]. Therefore, the research on the spatial and temporal distribution characteristics of ARGs in the Dongliao River Basin and the analysis of the sources of ARGs can provide a scientific basis for environmental management and risk assessment of the Dongliao River and can also provide a reference for pollution prevention and control and ecological protection of urban rivers in northern China.

2. Sampling Point Setting and Sampling Method

2.1. Sampling Point Setting

In this study, in order to evaluate the pollution status of ARGs in the basin, five representative sampling points were selected in the wet season (June 2024), the normal season (September 2024), and the dry season (December 2024), which were named as L1, L2, L3, L4, and L5. The above sampling points are located in the middle and upper reaches of the Dongliao River. Among them, L1 (Dashou Village) is located in the upper reaches of the Dongliao River, where a tributary flows into the main river after passing through a small town, and the surrounding environment is affected by urban activities to some extent. L2 (Heqing) is located in the upper reaches of the Dongliao River, which is characterized by a tributary flowing through vast farmland and finally flowing into the Dongliao River, where the impact of agricultural production activities on the water environment is more prominent. L3 (Chengzishang) is located in the middle reaches, surrounded by large areas of farmland and small villages. Various pollutants produced by agricultural planting and rural life will have a potential impact on river water quality. L4 (Zhoujiahekou) is located near small towns and wasteland, and the water environment in this area may be invaded by different types of pollution sources due to the complex and diverse land use types. L5 (Sishuang Bridge) is located in the middle reaches of the Dongliao River, and a tributary of its upstream passes through the town, carrying various pollutants such as urban domestic sewage into the Dongliao River, which can reflect the direct impact of urban development on the water environment.
The above sampling points reflected the comprehensive situation of the water environment in the Dongliao River Basin under the influence of multiple activities, such as towns and agriculture. Specific information on sampling points is shown in Table 1. A schematic diagram of the sampling point distribution is shown in Figure 1.

2.2. Sample Collection Method

The sample type collected in this study was a surface water sample. In the process of sampling, the operation steps followed the relevant requirements of Technical specifications for surface water environmental quality monitoring (HJ 91.2–2022) [27]. According to the characteristics of the five sampling sections, one sampling vertical line was set in each section. The sampling position was 0.5 m below the water surface, and 3 L water samples were collected at each point for routine physical and chemical indicators detection. The samples were stored in the dark at 4 °C for further treatment. At the same time, another 500 mL water sample was taken from each sampling point and put in a sterile water sample collection bag, which was specially used for ARGs detection and analysis. It was stored at 4 °C and detected as soon as possible.

2.3. Detection of Routine Physical and Chemical Indicators of the Samples

According to Technical specification for offshore environmental monitoring (HJ 442.4–2020) and Technical specifications requirements for monitoring of surface water and waste water (HJ/T 91–2002) [28,29], the collected samples were tested for routine physical and chemical indexes. The detection indexes included temperature, pH, dissolved oxygen (DO), ammonia nitrogen (NH4+–N), total nitrogen (TN), total phosphorus (TP), chemical oxygen demand (COD), aluminum ion, lead ion, fluoride ion, and chloride ion, and each sample was repeatedly detected three times. The water temperature, pH, and DO were measured at the sampling site with a portable measuring instrument (Reitz, JPB–607A, Shanghai, China). NH4+–N was determined by Nessler’s reagent spectrophotometry. TN was determined by alkaline potassium persulfate digestion and ultraviolet spectrophotometry. Ammonium molybdate spectrophotometry was used for TP detection. COD was determined by rapid digestion spectrophotometry. Aluminum ions and lead ions were detected by inductively coupled plasma mass spectrometry. Fluorine ion and chloride ion were detected by ion chromatography.

2.4. ARGs Detection in Samples

The detection of ARGs in water samples was entrusted to Shanghai Qiyin Biotechnology Co., Ltd. (Shanghai, China). Two filter membranes were collected for each sample and stored in a 5 mL centrifuge tube in a −20 °C refrigerator for subsequent sample testing. The water sample was filtered through a 0.22 μm membrane until it could no longer be filtered out. The volume of the filtered water was recorded by collecting two filter membranes for each sample, storing them in a 5 mL centrifuge tube, and a refrigerator at –20 °C for subsequent sample testing. TIANNAMP Soil DNA Kit (DP336, Tiangen Biochemical Technology, Beijing, China) was used to extract DNA.
The extracted DNA was detected by Quawell Q3000 ultra–micro spectrophotometer (Quawell, Beijing, China). The purity and concentration of DNA were detected by qPCR on StepOnePlus™ real–time fluorescence quantitative PCR (Thermo Fisher Scientific, Shanghai, China) with TB Green Premix ex Taq II (TLI RNase Plus) kit (Takara, Code RR820A, Beijing, China).
In the qPCR experiment, the upstream primer sequence of 16S rRNA was GGGTTGCGCTCGTTGC, and the downstream primer was ATGGYTGTCGTCAGCTCGTG. The efficiency measured in this experiment was 111% (slope = −0.324, R2 = 0.997), with a correlation coefficient R2 ≥ 0.99, indicating that the amplification reaction was within the ideal linear range.

2.5. ARGs Pollution Source Analysis Method

In this study, based on the previous detection results of ARGs subtypes in surface water, a principal component analysis–multiple linear regression (PCA–MLR) model was used to predict and analyze the main sources of ARGs in the water environment of the Dongliao River. PCA–MLR model is an iterative estimation method combining principal component analysis and multiple regression. Based on the variance analysis of the partial least squares method, it can effectively identify and quantify the main influencing factors in complex environmental data. Through this method, we can better understand the causes of ARG pollution in the Dongliao River Basin and provide a scientific basis for subsequent pollution control and management in the river basin.

3. Results and Discussion

3.1. Physical and Chemical Indexes of Surface Water

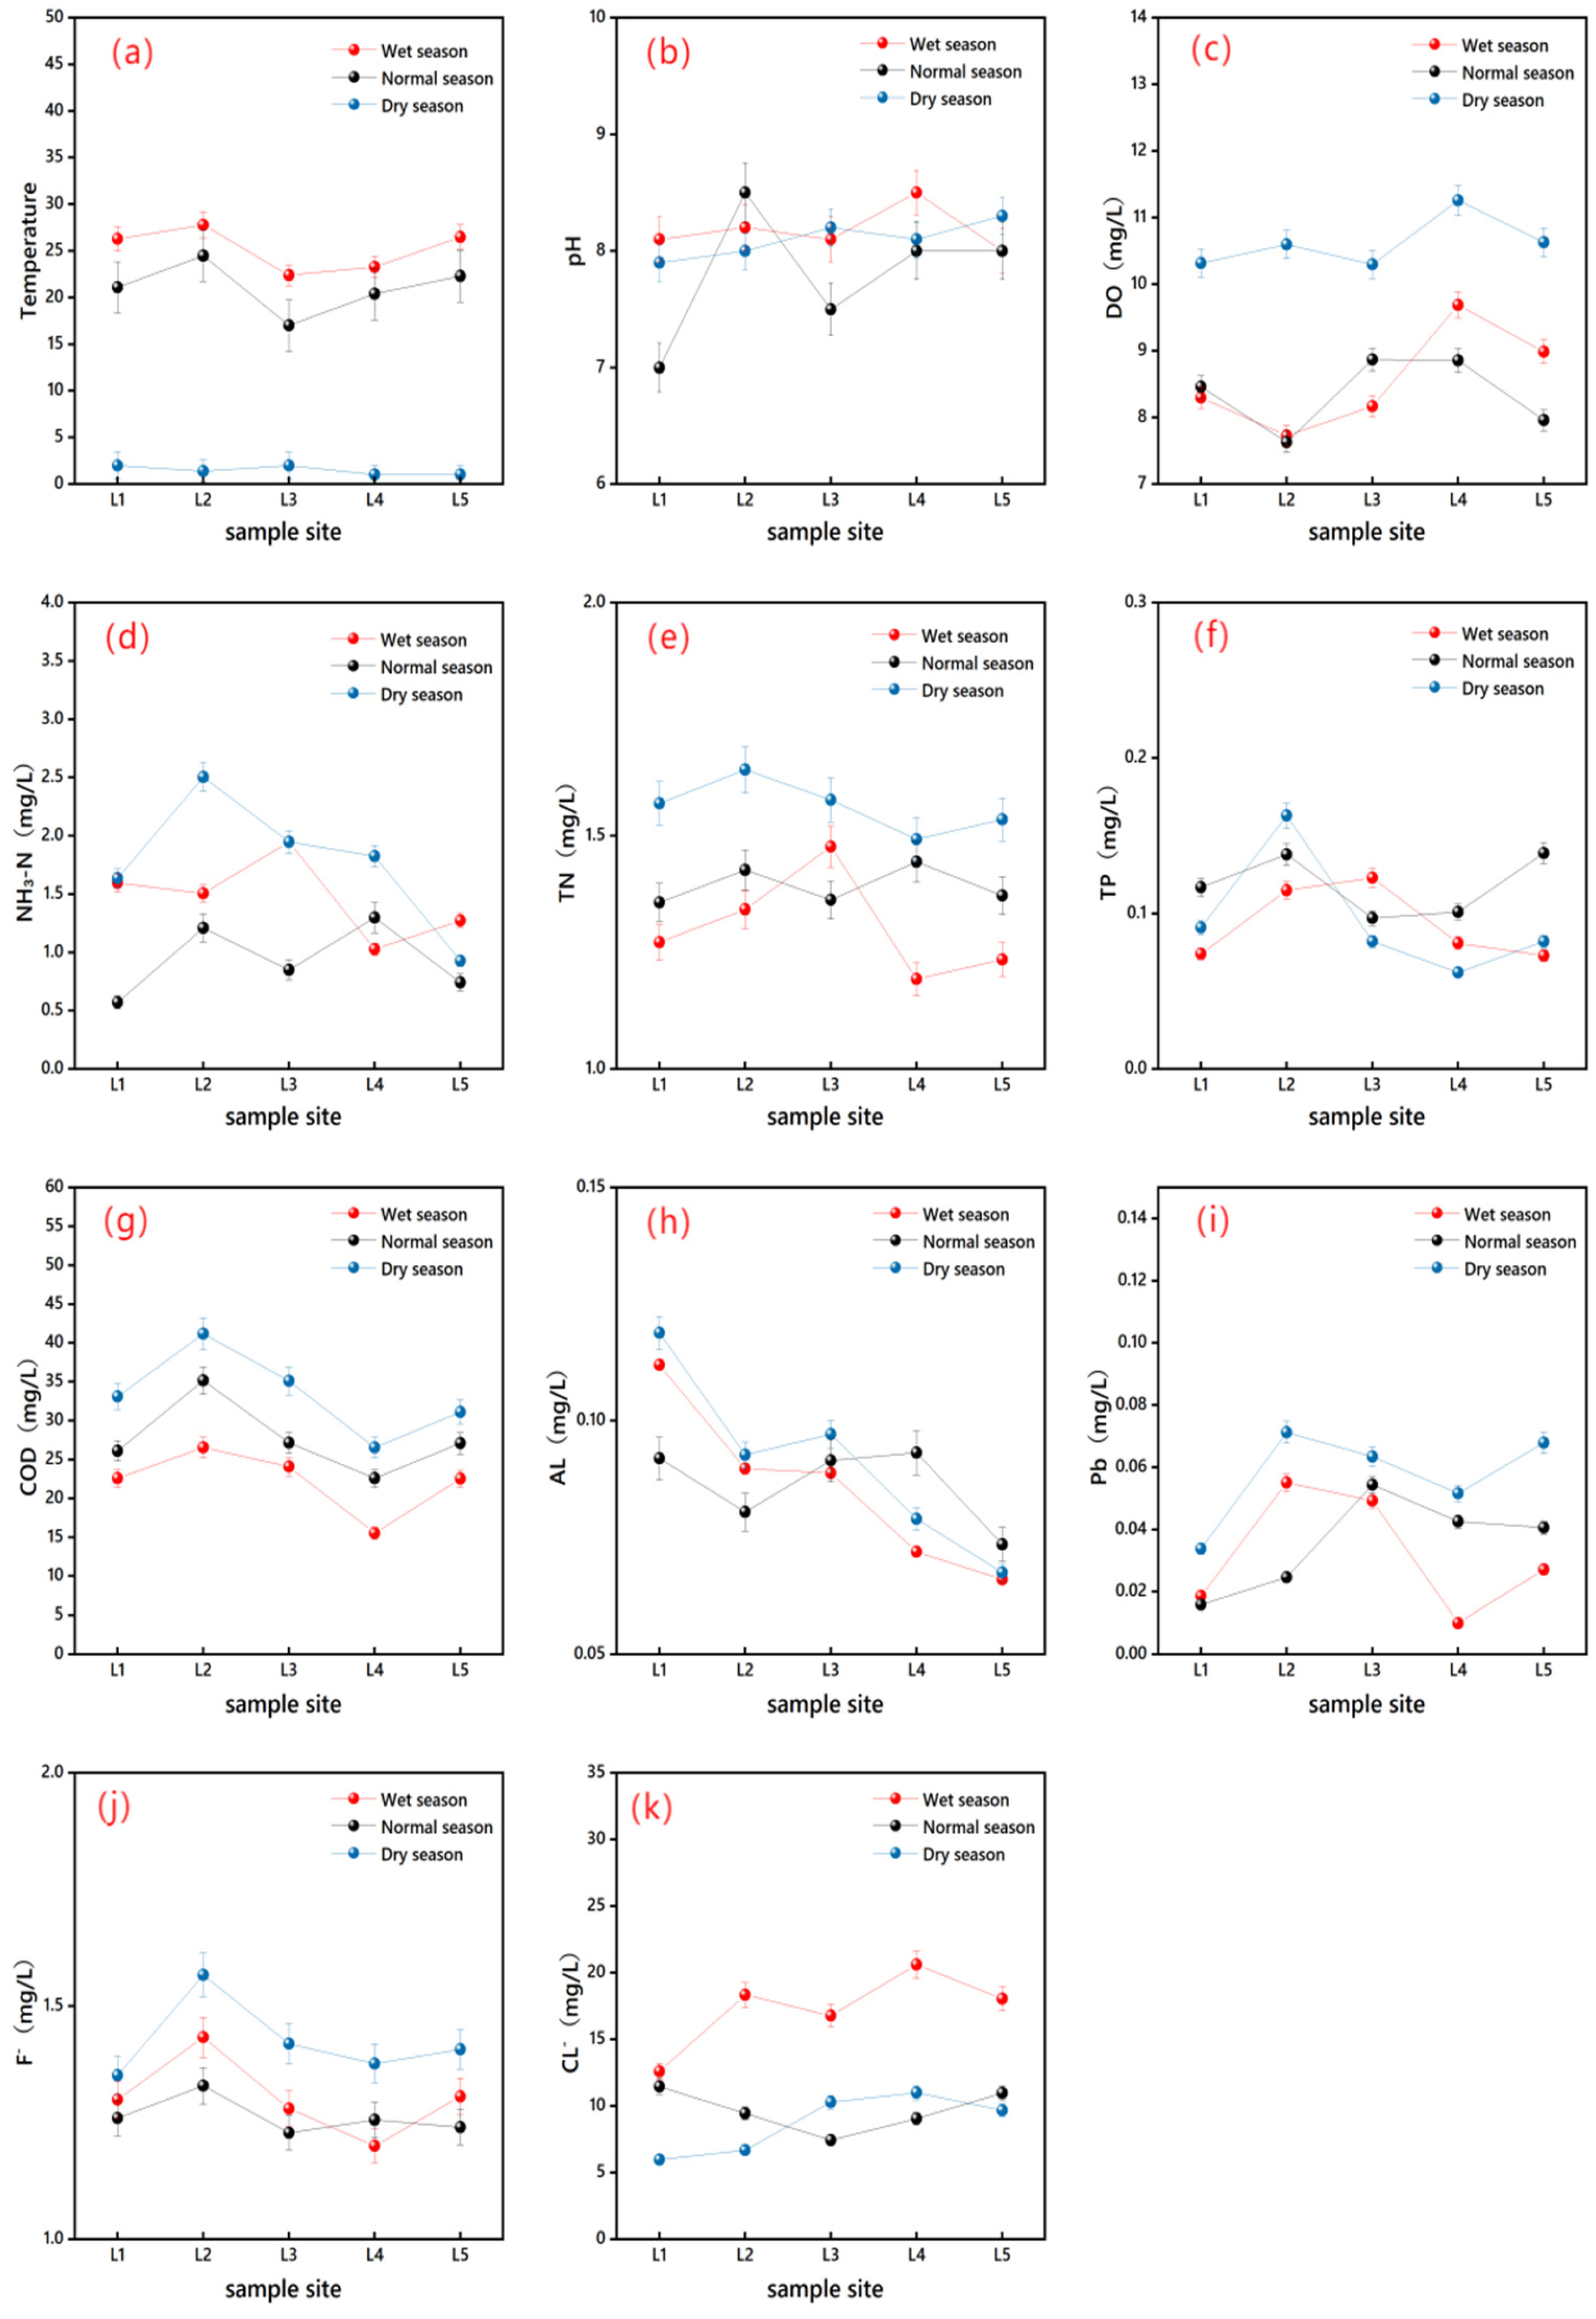
Physical and chemical indices of surface water in the Dongliao River are shown in Figure 2. Figure 2a shows that during the sampling period, the temperature of each sampling point was maintained at a normal level, and the temperature changed little. Figure 2b shows that the pH value of the Dongliao River varied from 7.0 to 8.5, which was weakly alkaline compared with the normal level of 6.5–8.0, and was stable within the water quality standard specified in Environmental quality standards for surface water (GB 3838–2002) [30]. Figure 2c shows that dissolved oxygen levels ranged from 7.63 mg/L to 11.26 mg/L, falling within the normal range specified in the Surface Water Environmental Quality Standards (GB 3838–2002). As shown in Figure 2d–f, in terms of nutrient index, the average concentration of TN and TP in the surface water of the Dongliao River is 1.5 mg/L and 0.12 mg/L. In addition, the average detection concentration of NH4+–N in each monitoring section was 1.43 mg/L. These nutrient concentration data not only provided a basis for evaluating the eutrophication status of the Dongliao River, but also have great significance for revealing the potential relationship between the nutrient cycle and the distribution of ARGs and mobile genetic elements (MGEs) [31,32]. As shown in Figure 2g, according to the Surface Water Environmental Quality Standard (GB 3838–2002), the COD levels at all sampling points range from 15.5 mg/L to 41 mg/L, all falling within the normal range. Additionally, as shown in Figure 2h–k, the concentrations of aluminum (0.004–0.11 mg/L), lead (0.0016–0.071 mg/L), fluoride ions (1.2–1.42 mg/L), and chloride ions (6.0–20.6 mg/L) all comply with the normal ranges specified in the aforementioned standard.

3.2. Spatial and Temporal Distribution Characteristics of ARGs in the Water Environment

3.2.1. Temporal Distribution Characteristics of ARGs in the River Basin

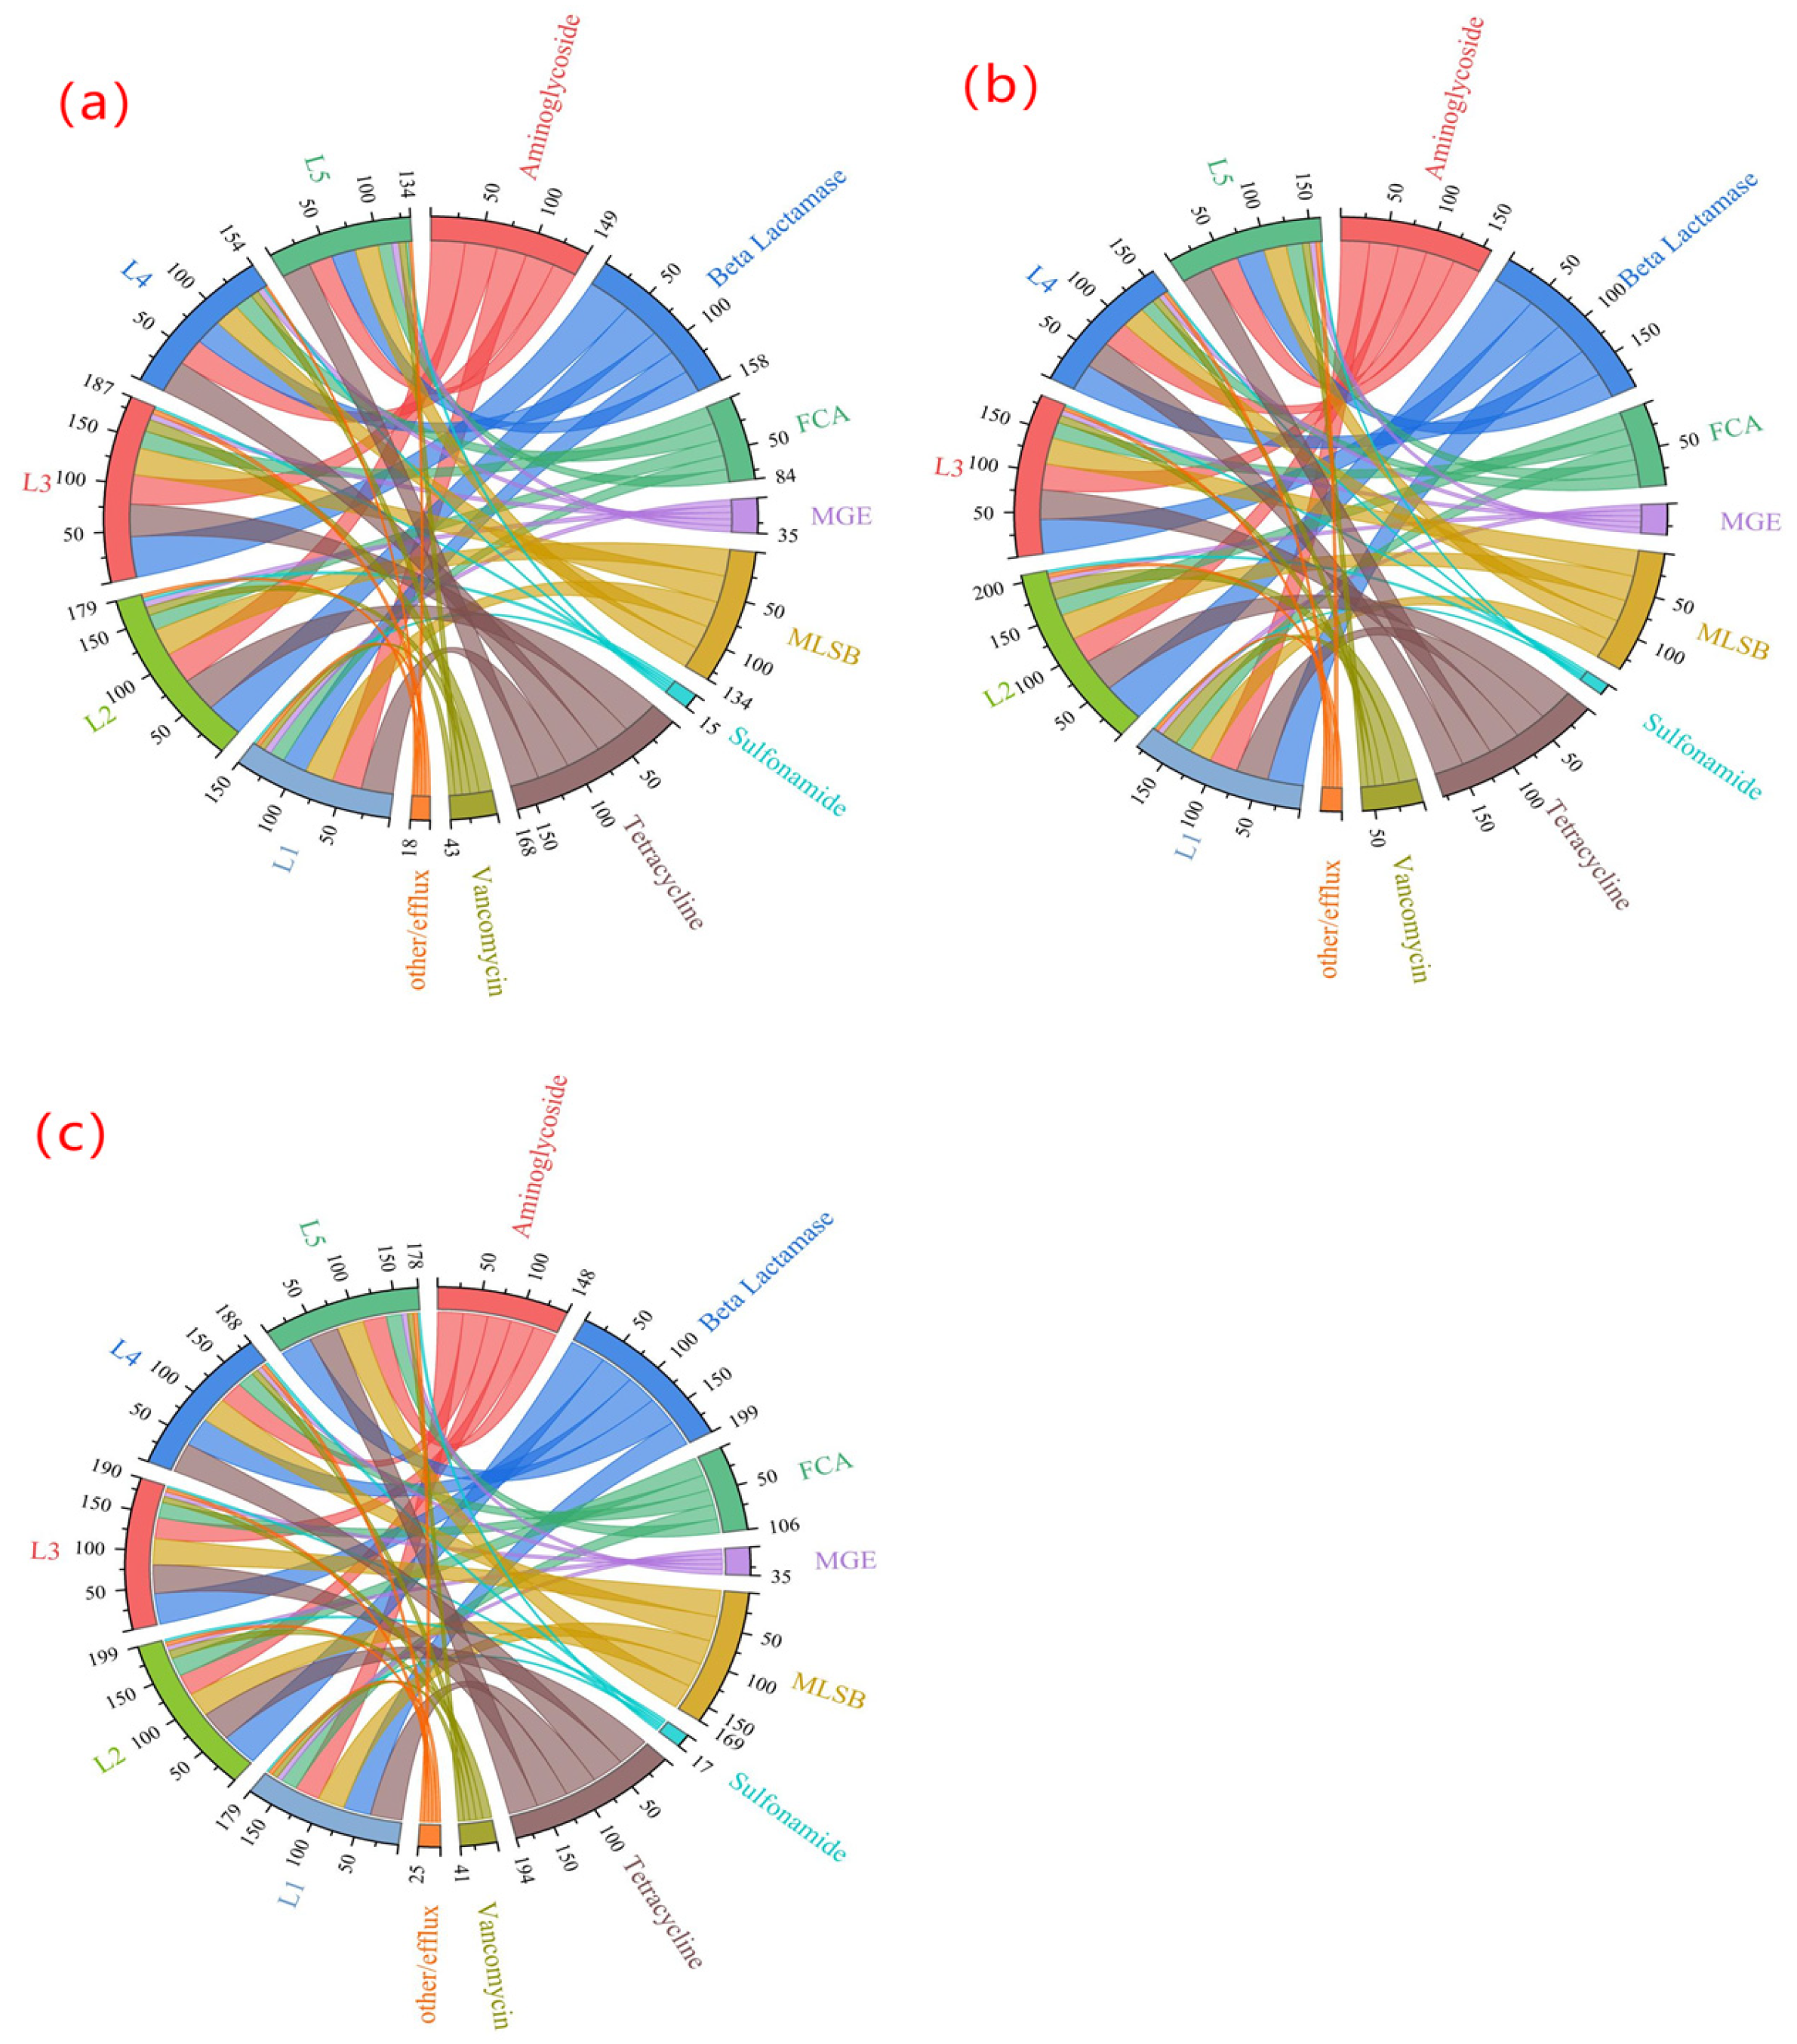
In the experiment, ARGs in water samples from three periods in the Dongliao River Basin were detected, and the detection targets covered 271 resistance genes and 7 mobile genetic elements (MGEs) reported in the current environment. The test results are shown in Figure 3. Seven types of resistance genes were detected in the water of the Dongliao River Basin, namely, Tetracycline antibiotics (TCs), Sulfonamide antibiotics (SAs), macrolides–lincosamide–streptomycin B (MLSB), Beta-Lactamase antibiotics (β–Ls), Vancomycin antibiotics (VAs), Fluoroquinolone–quinolone–florfenicol–chloramphenicol–amphenicol (FCA), aminoglycosides (AMs), other/efflux resistance genes, and MGEs.
The relative abundance of each type of ARGs at each sampling point was analyzed. The results showed that there were significant differences in the pollution contribution of various ARGs in different seasons in the basin. Specifically, in the wet season, the AGRs’ abundance of SAs and AMs contributed to the water environment in the basin, reaching 13–27% and 7–37%. In the normal season, the contribution rate of AMs was further increased to 26–37%, while the contribution rates of SAs and TCs resistance genes were higher, which were 12–20% and 11–16%. In the dry season, AMs and TCs categories became the dominant ARGs, contributing 29–43% and 16–22%. It can be seen that the detection rate and the pollution contribution rate of SAs, TCs, and AMs have obvious differences in different water periods. There might be two reasons for the above phenomenon: one was the concentration of fecal source in the dry season and the dilution effect in the wet season, and the other was the change in the source structure of various ARGs caused by storm runoff [33,34]. In general, the above three types of ARGs had great pollution contributions to the water environment in the Dongliao River Basin, especially in the wet season and the dry season.
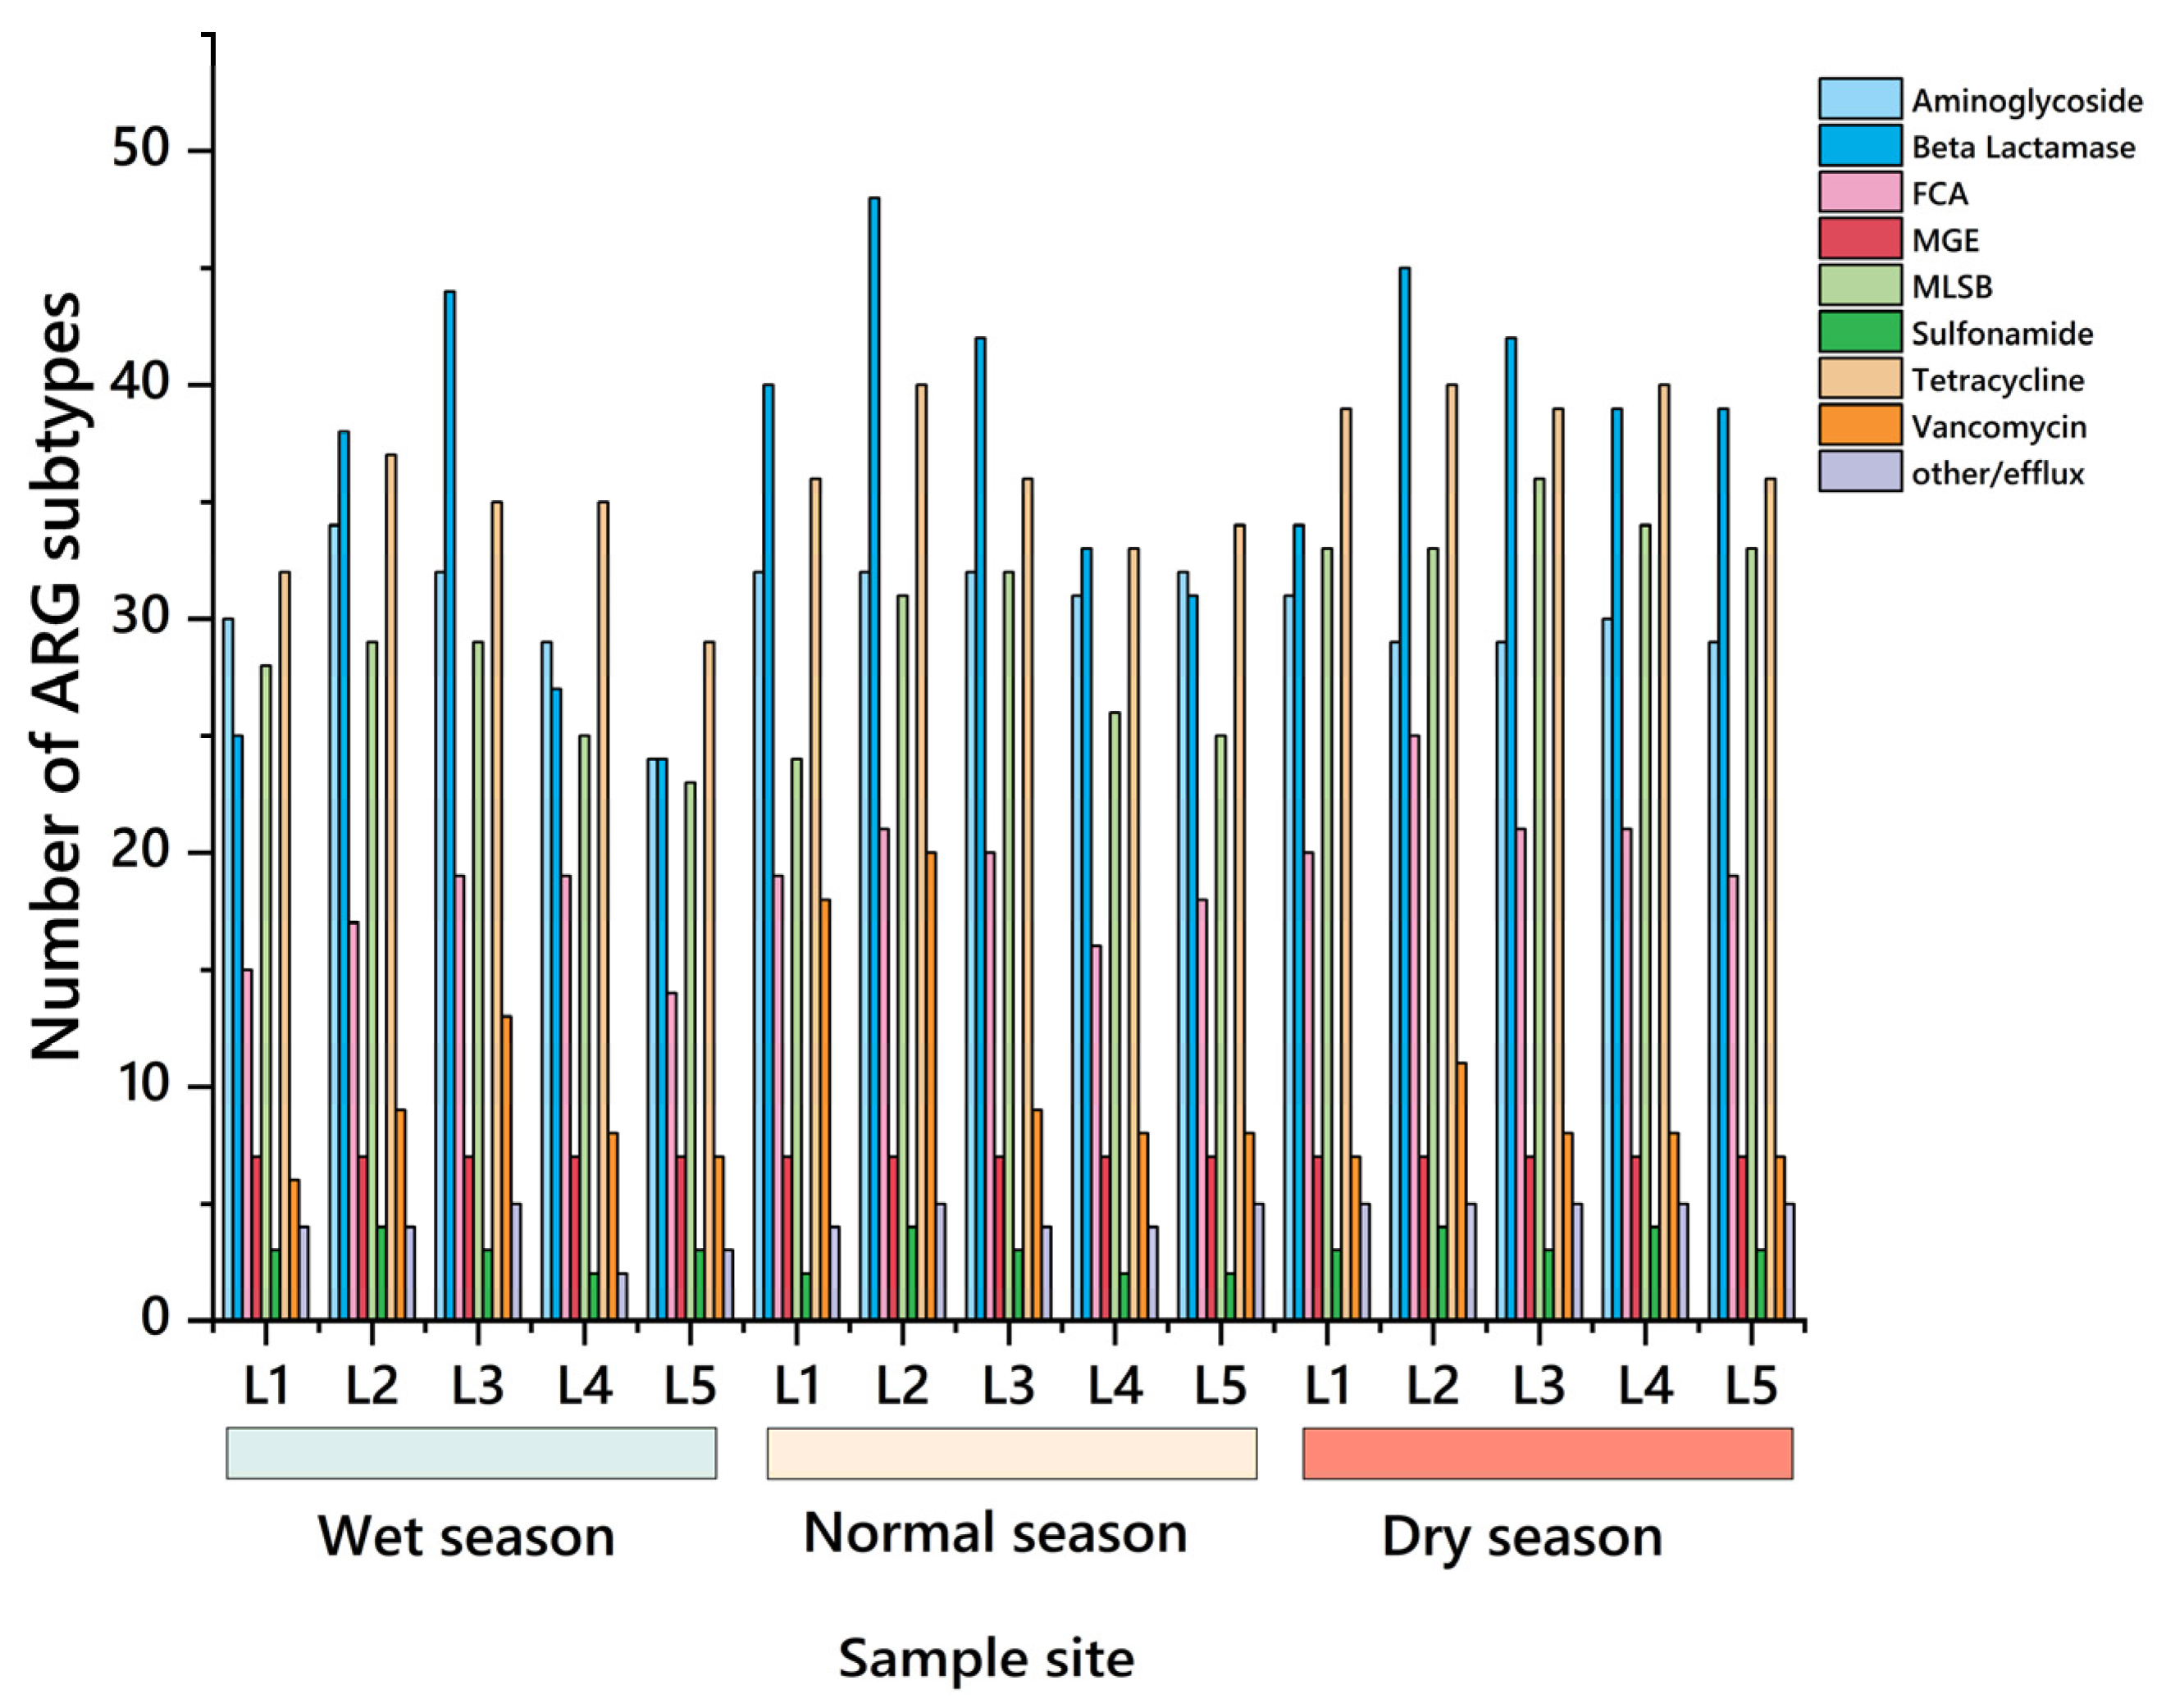
The detected number of 271 target genes is shown in Figure 4. The results showed that the total number of gene subtypes detected in the wet season ranged from 134 to 187, including 7 MGEs. Among them, β–lactam resistance genes were the most detected in this period, reaching 24–44, indicating that they accounted for a large proportion of the total gene subtypes in the wet season. In the normal season, the total number of gene subtypes detected ranged from 162 to 208, including 7 MGEs. Among them, there were many subtypes of β–lactam and tetracycline genes, which are 31–48 and 33–40. However, in the dry season, the total number of gene subtypes detected was the highest, the number of which at each sampling point was between 180 and 200, including 7 MGEs. Among them, β–lactams and MLSB were detected in a large number, with 39–50 and 30–36. Related research showed that the total number of genes detected in the wet season and the normal season was 129–163 and 122–169, respectively, and the average number of MGEs detected was 7 in the Songhua River Basin and the Yitong River Basin [35]. In contrast, the number of gene subtypes detected in the Dongliao River Basin was larger as a whole. In addition, the study found that there was a significant positive correlation between the intensity of agricultural activities and subtype richness, and the land use pattern of agricultural activities was the core driving factor to determine the subtype diversity in the environment [36]. Because there was a lot of cultivated land and aquaculture activities in the Dongliao River Basin, this might be one of the reasons for the large number of ARGs subtypes in this basin. By analyzing the data of three periods, we can know that the subtypes of β–lactam ARGs were always the most detected. This phenomenon showed that in the water environment of the Dongliao River basin, the high diversity of β–lactam ARGs might pose a potential threat to the ecological environment of the basin.
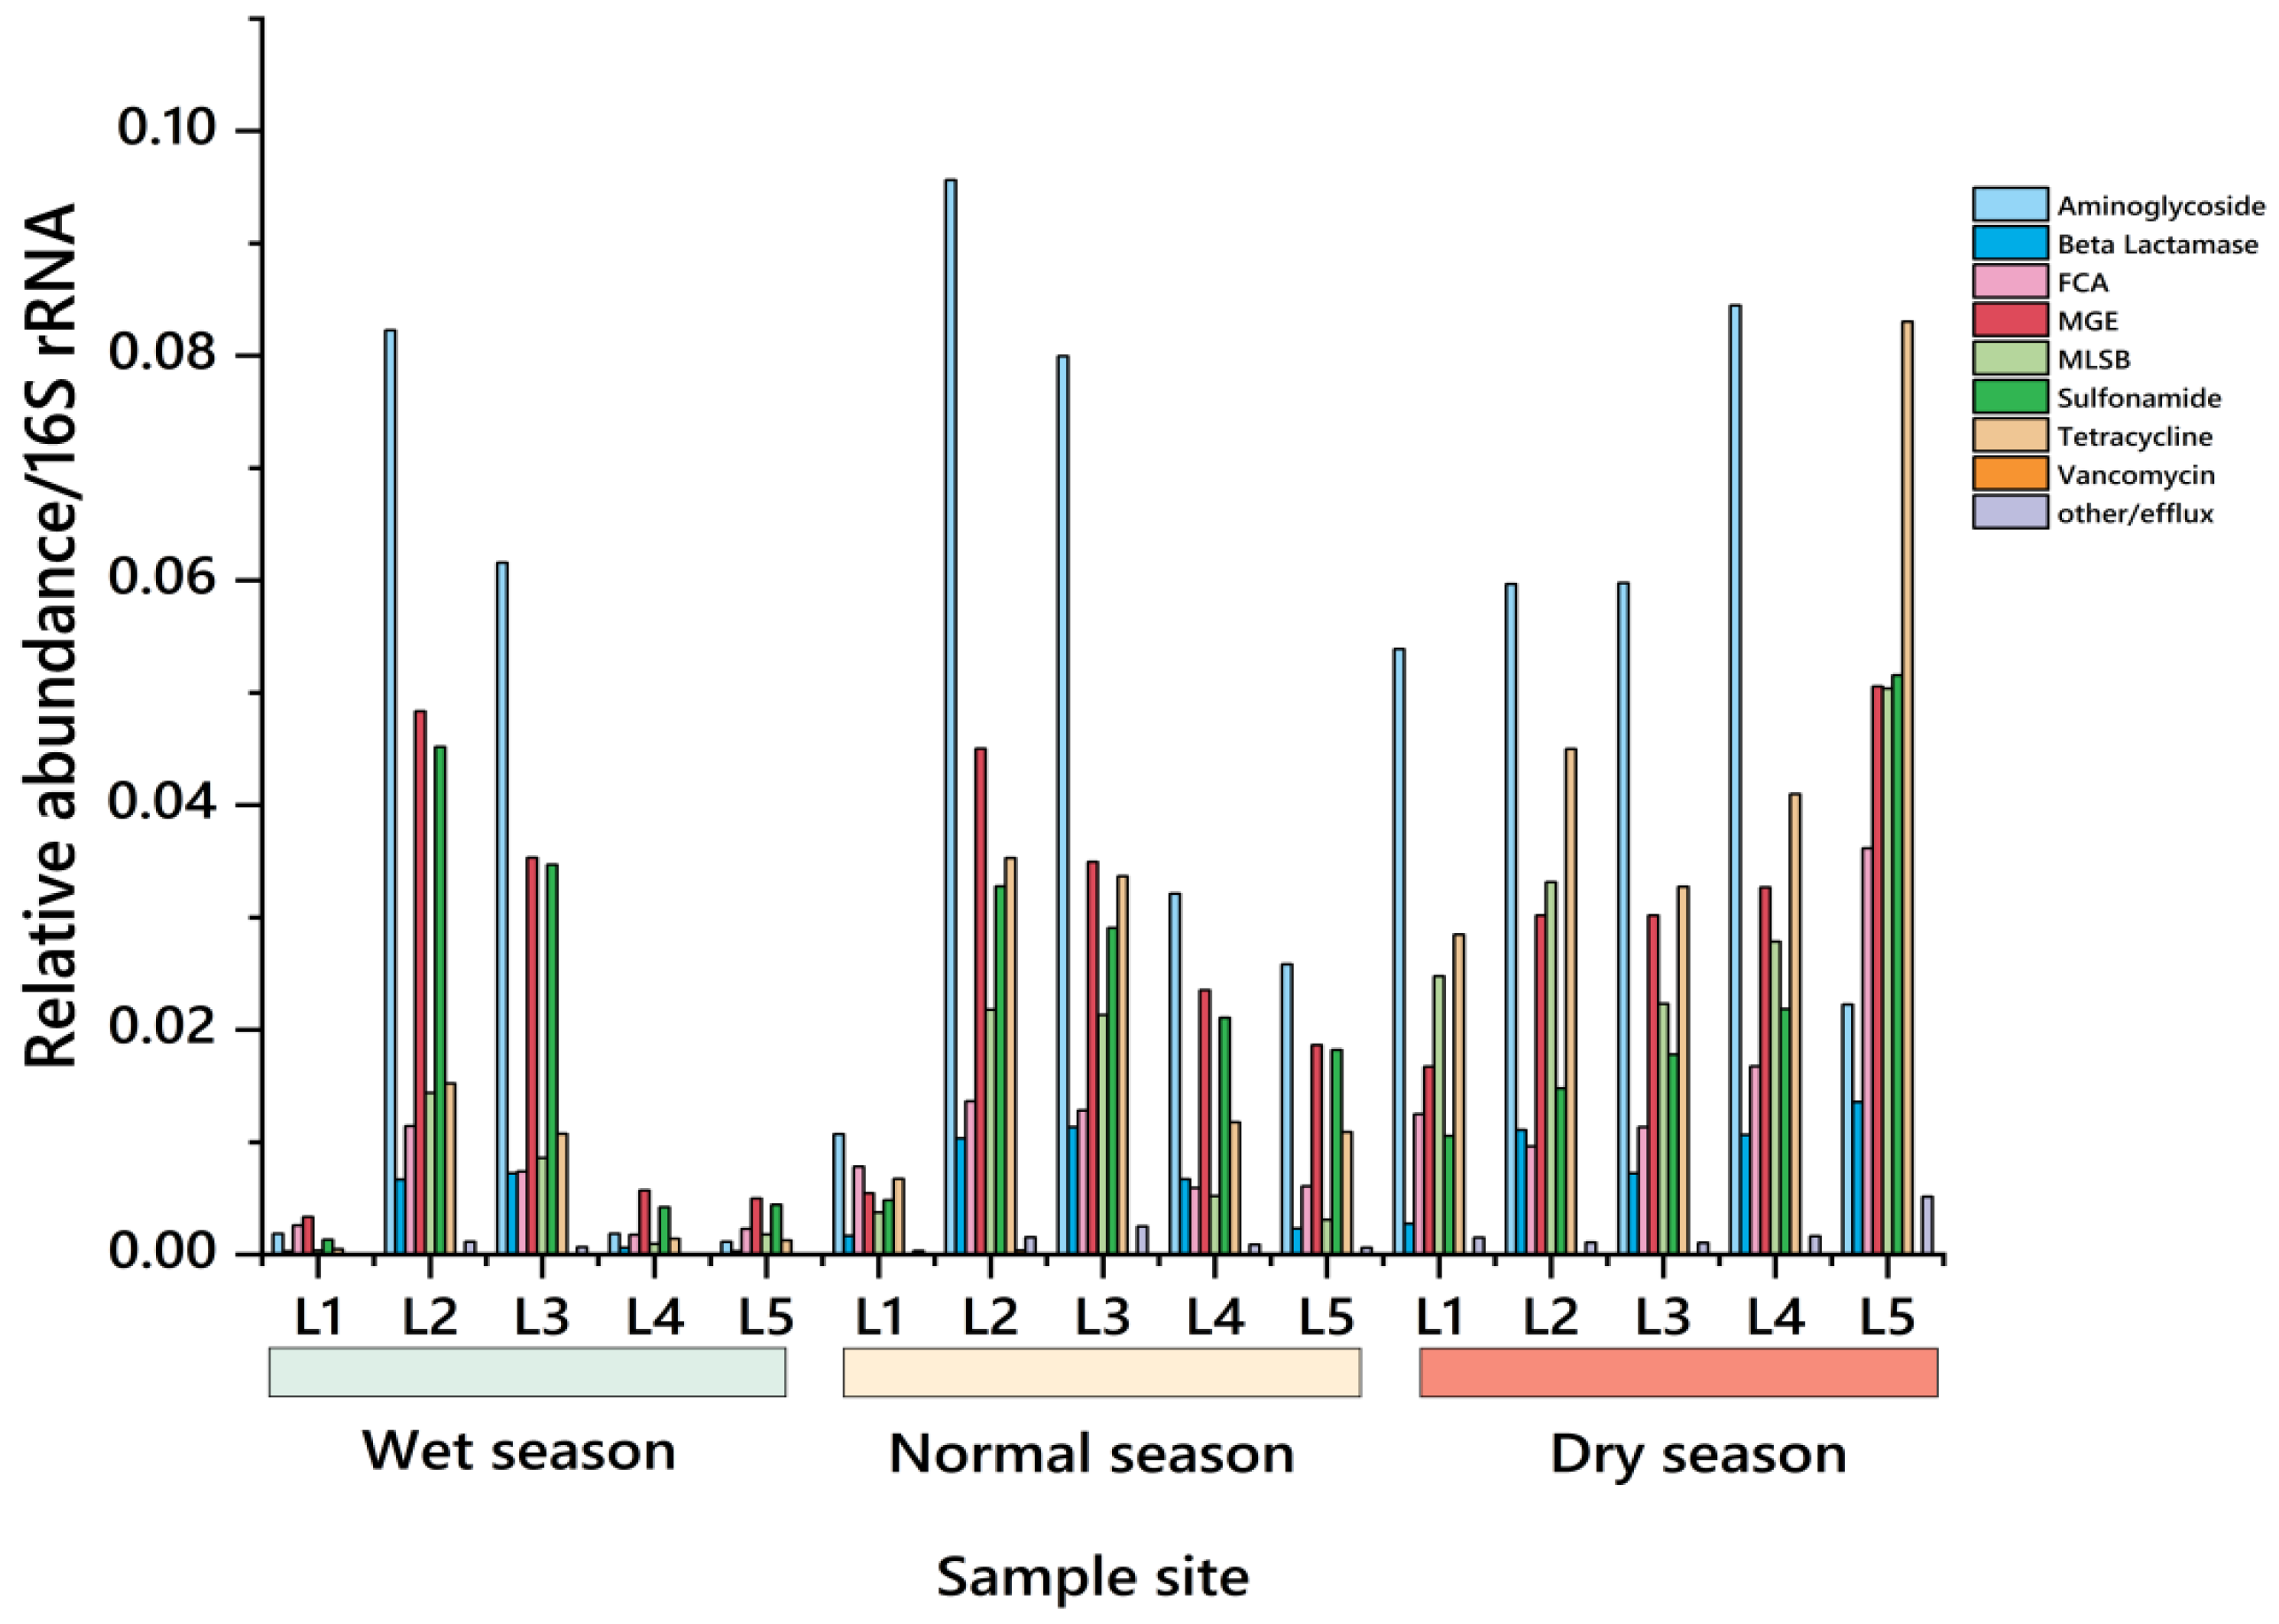
The temporal distribution characteristics of the relative abundance of ARGs in the basin are shown in Figure 5. The results show that there were significant differences in the relative abundance of ARGs and MGEs in different seasons in the water environment of the Dongliao River Basin. Specifically, in the wet season, the resistance genes with high relative abundance included AMs (aadA–02, aadA1, aadA2–03, strB), MLSB (ermF), SAs (sul1, sul2), and TCs (tetG–02, tetX, tetA–01). The maximum relative abundances of the above four types of ARGs were 0.0822, 0.0143, 0.0451 and 0.0152/16S rRNA. Meanwhile, the maximum relative abundance of MGEs (intI1) was 0.0483/16S rRNA. The high abundance in this period might be related to the diffusion of pollutants caused by rain erosion.
In the normal season, the relative abundance of SAs (sul1 and sul2), MLSB (ermF), AMs (aadA–02, aadA1, aadA2–03, strB) and FCA (mexE) were relatively high, which were 0.0327, 0.0217, 0.0956 and 0.0163/16S rRNA. At the same time, the maximum relative abundance of MGEs (intI1) was 0.0450/16S rRNA. It can be seen that the pollutant load was relatively stable in this season, and the relative abundance of ARGs in this period might be closer to the basic level of the basin.
In the dry season, ARGs with high relative abundance included SAs (sul1, sul2), AMs (aadA–02, aadA1, aadA2–03, strB), TCs (tetG–02, tetX, tetA–01), and MLSB (ermB, mexF), of which the values were 0.051, 0.223, 0.083, and 0.0503/16S rRNA. Meanwhile, the maximum relative abundance of MGEs (intI1) was 0.0505/16S rRNA. In this season, the concentration of pollutants increased due to the decrease in water flow. At the same time, the low temperature might inhibit microbial activity and reduce the attenuation of ARGs, and then increase the relative abundance of ARGs.
On the whole, SAs and AMs genes were common in the water environment of the Dongliao River Basin, especially in the wet season and the normal season, and their high relative abundance might be closely related to agricultural activities and domestic sewage discharge. However, TCs genes were abundant in the dry season, which might be related to the weakening of the self-purification ability of water bodies during this period. The abundance of FCA genes was high in the normal season, which might reflect the influence of specific industrial or domestic pollution sources. In addition, MGEs, such as intl1, had maintained a high abundance in all periods, which indicated their continuous active role in the spread of ARGs. This result was consistent with Liang et al.’s research on the high abundance of ARGs in the dry season of Poyang Lake [37]. The reason for this phenomenon was that the water flow in the basin was significantly reduced during the dry season, which led to the enrichment of ARGs and the increase in their concentration. In addition, low temperature might have a negative impact on the attenuation of ARGs, because the microbial species carrying ARGs had more advantages in adverse environmental conditions such as low temperature. Moreover, the increase in the concentration of pollutants (such as heavy metals, persistent organic pollutants, and nutrients) in the aquatic environment during the dry season might also lead to the choice of ARGs. However, in the wet season and normal season, high temperatures, strong sunlight, and heavy rainfall could lead to photodegradation and dilution of pollutants, so their abundance and quantity would be significantly reduced.
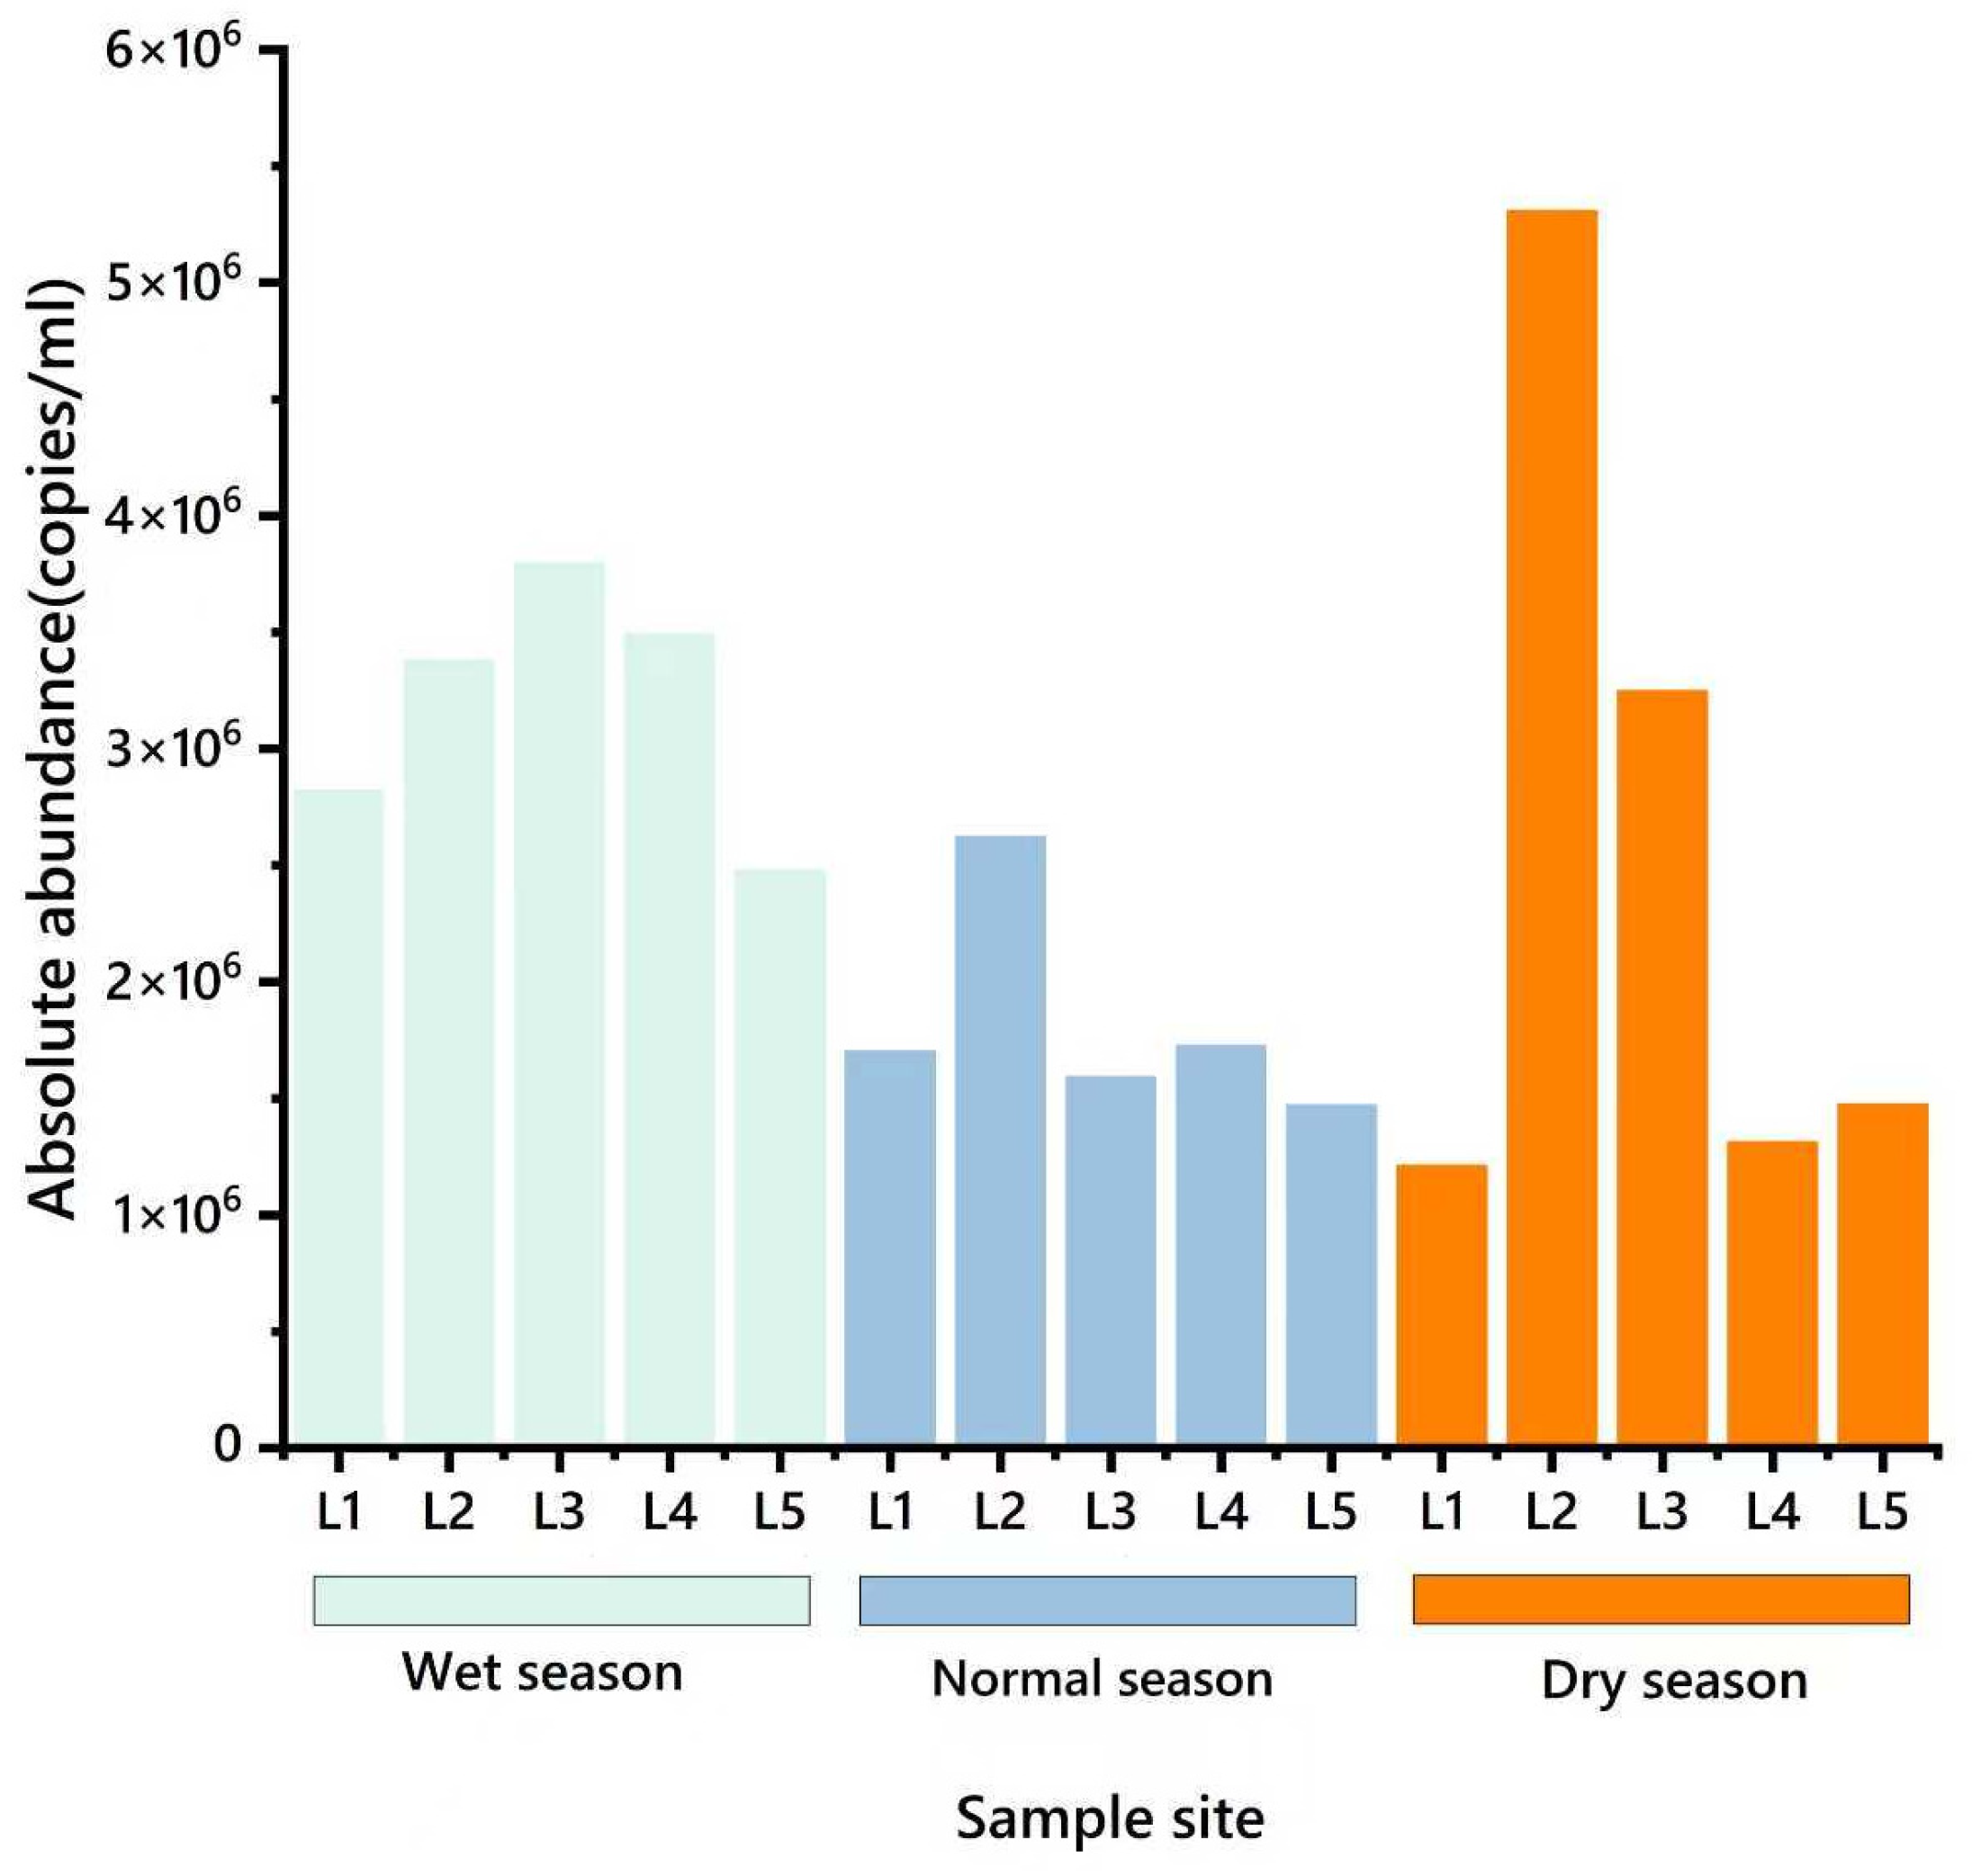
The absolute abundance of the 16S rRNA gene in surface water is shown in Figure 6. The results showed that its absolute abundance ranged from 2.47 × 10⁶ to 3.79 × 10⁶ copies/mL in the wet season. In the normal season, the range was slightly reduced to 1.7 × 10⁶–2.62 × 10⁶ copies/mL; however, in the dry season, the abundance range rose back to 1.21 × 10⁶–5.30 × 10⁶ copies/mL. Generally speaking, the absolute abundance of the 16S rRNA gene in the wet season, normal season, and dry season was obviously different.
The high detection rate and abundance level of ARGs indicated that the extensive use of corresponding antibiotics and the distribution of other human activities and pollution sources around the reach had posed certain risks to the environment in this area [38]. This risk might come from the discharge of agricultural, animal husbandry and industrial wastewater, from which the antibiotics and ARGs entered the water body through surface runoff or direct discharge, resulting in the accumulation of ARGs in the water environment. In addition, the unreasonable use of antibiotics and improper disposal of waste might also aggravate this problem.

3.2.2. Spatial Distribution Characteristics of ARGs in Watershed

In the Dongliao River Basin, the pollution degree of ARGs in the upstream areas (such as L2 and L3 sampling points) was significantly higher than that in the downstream areas. This difference was mainly due to the intensity and nature of human activities around the sampling points [39]. Specifically, there were facilities such as hospitals and factories around the L1 sampling point, and wastewater containing antibiotics and other pollutants discharged from these places would pollute the water environment. However, the pollution degree of L1 was lower than that of L2 and L3, which were also located upstream, which might be related to the treatment of the sewage plant, the self-purification ability of the water body, or the dilution effect at this point. In contrast, there were a large number of livestock farms around the L2 and L3 sampling points. A large number of antibiotics are often used in the process of breeding to promote animal growth and prevent diseases in animal husbandry. However, these antibiotics and their metabolites will enter the surrounding water with the discharge of livestock manure and aquaculture wastewater [40]. Because livestock manure is discharged without effective treatment or improper treatment, antibiotics and ARGs carried in it will enter the Dongliao River Basin, thus increasing the species and abundance of ARGs in the water in this area.
With the migration of water flow and the passage of time, ARGs in upstream water bodies (L2, L3) would be affected by various environmental factors and sewage treatment plants in the process of flowing downstream (L4, L5). For example, photodegradation under light could destroy the structure of some antibiotics and ARGs, thus reducing their activity and detected abundance [41]. In addition, the dilution of water flow would gradually reduce the concentration of ARGs, which would lead to a relative decrease in the species and abundance of ARGs in downstream water bodies [42,43,44].
This spatial and temporal distribution of ARGs in the water environment of the Dongliao River Basin reflected the complex interaction between human activities and the natural environment. Due to the concentration of animal husbandry and industrial activities, the upstream area had become a high-incidence area of ARGs pollution. In the downstream area, due to the self-purification process of water and environmental factors, the pollution degree of ARGs was relatively low. This spatial and temporal distribution not only provided an important scientific basis for environmental management and pollution control in the basin, but also reminded us that when formulating relevant policies, we should fully consider the pollution sources and environmental carrying capacity of different regions and take targeted measures to realize the sustainable development of the whole basin.
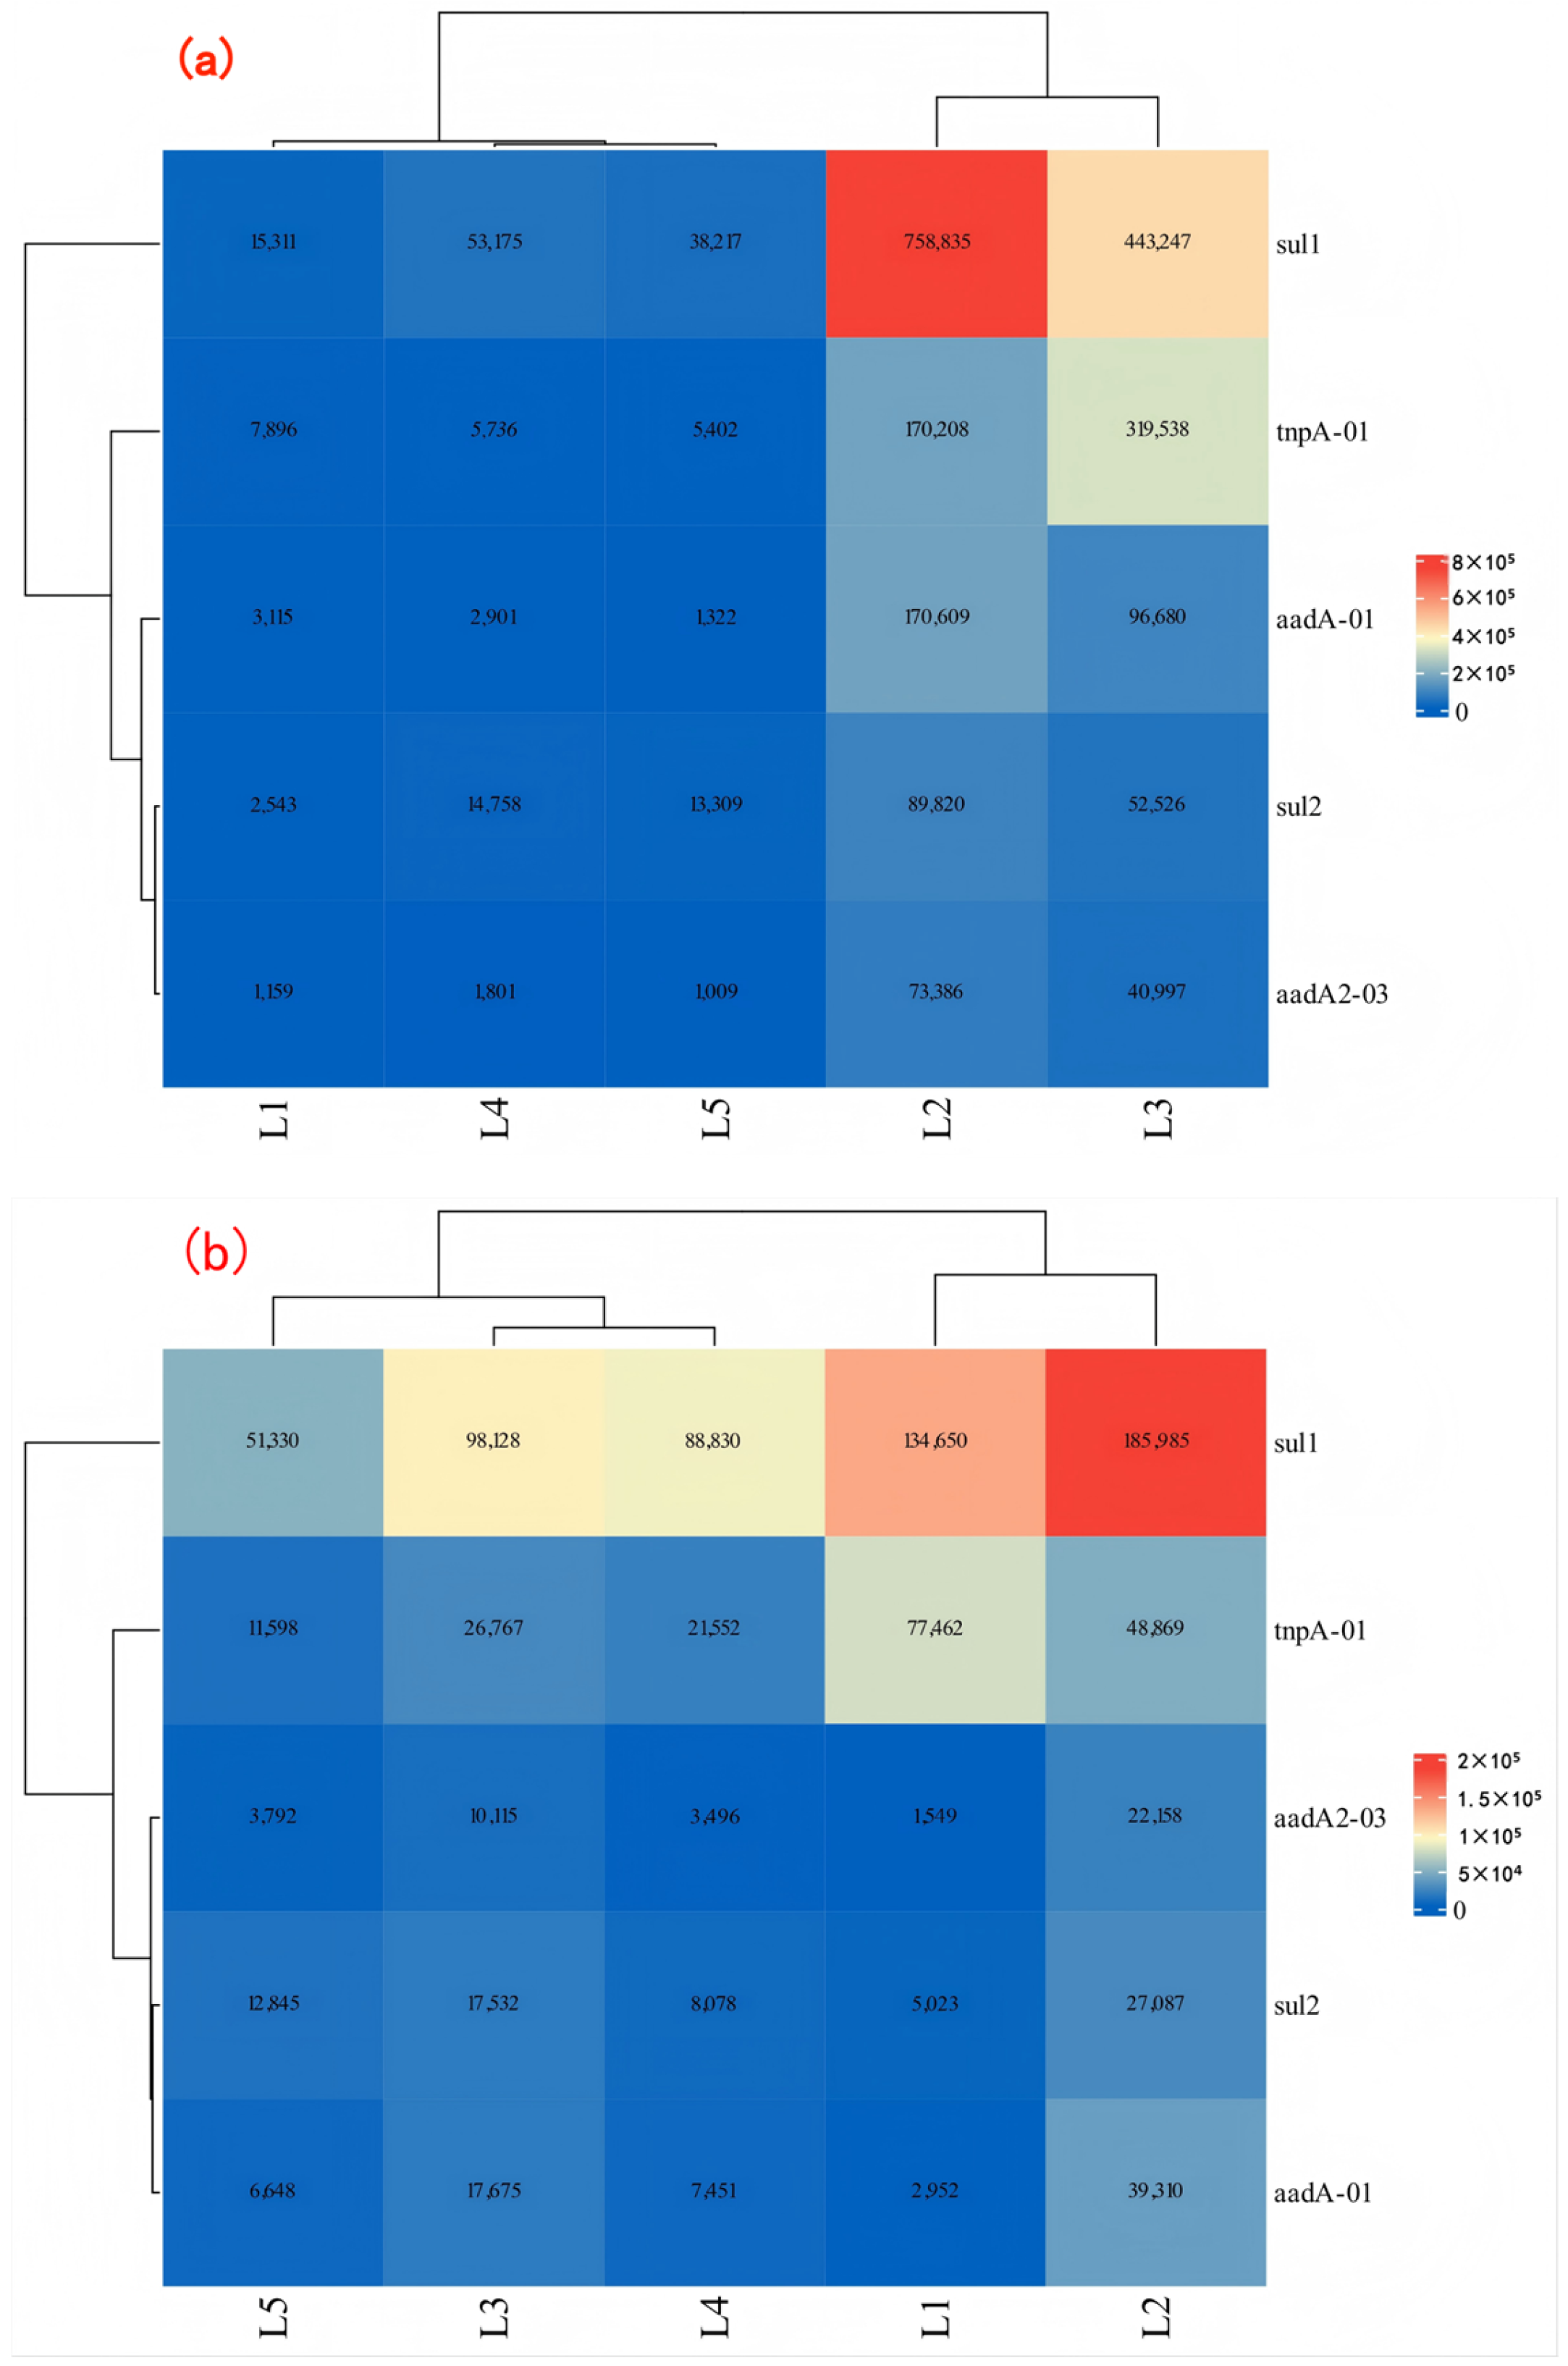
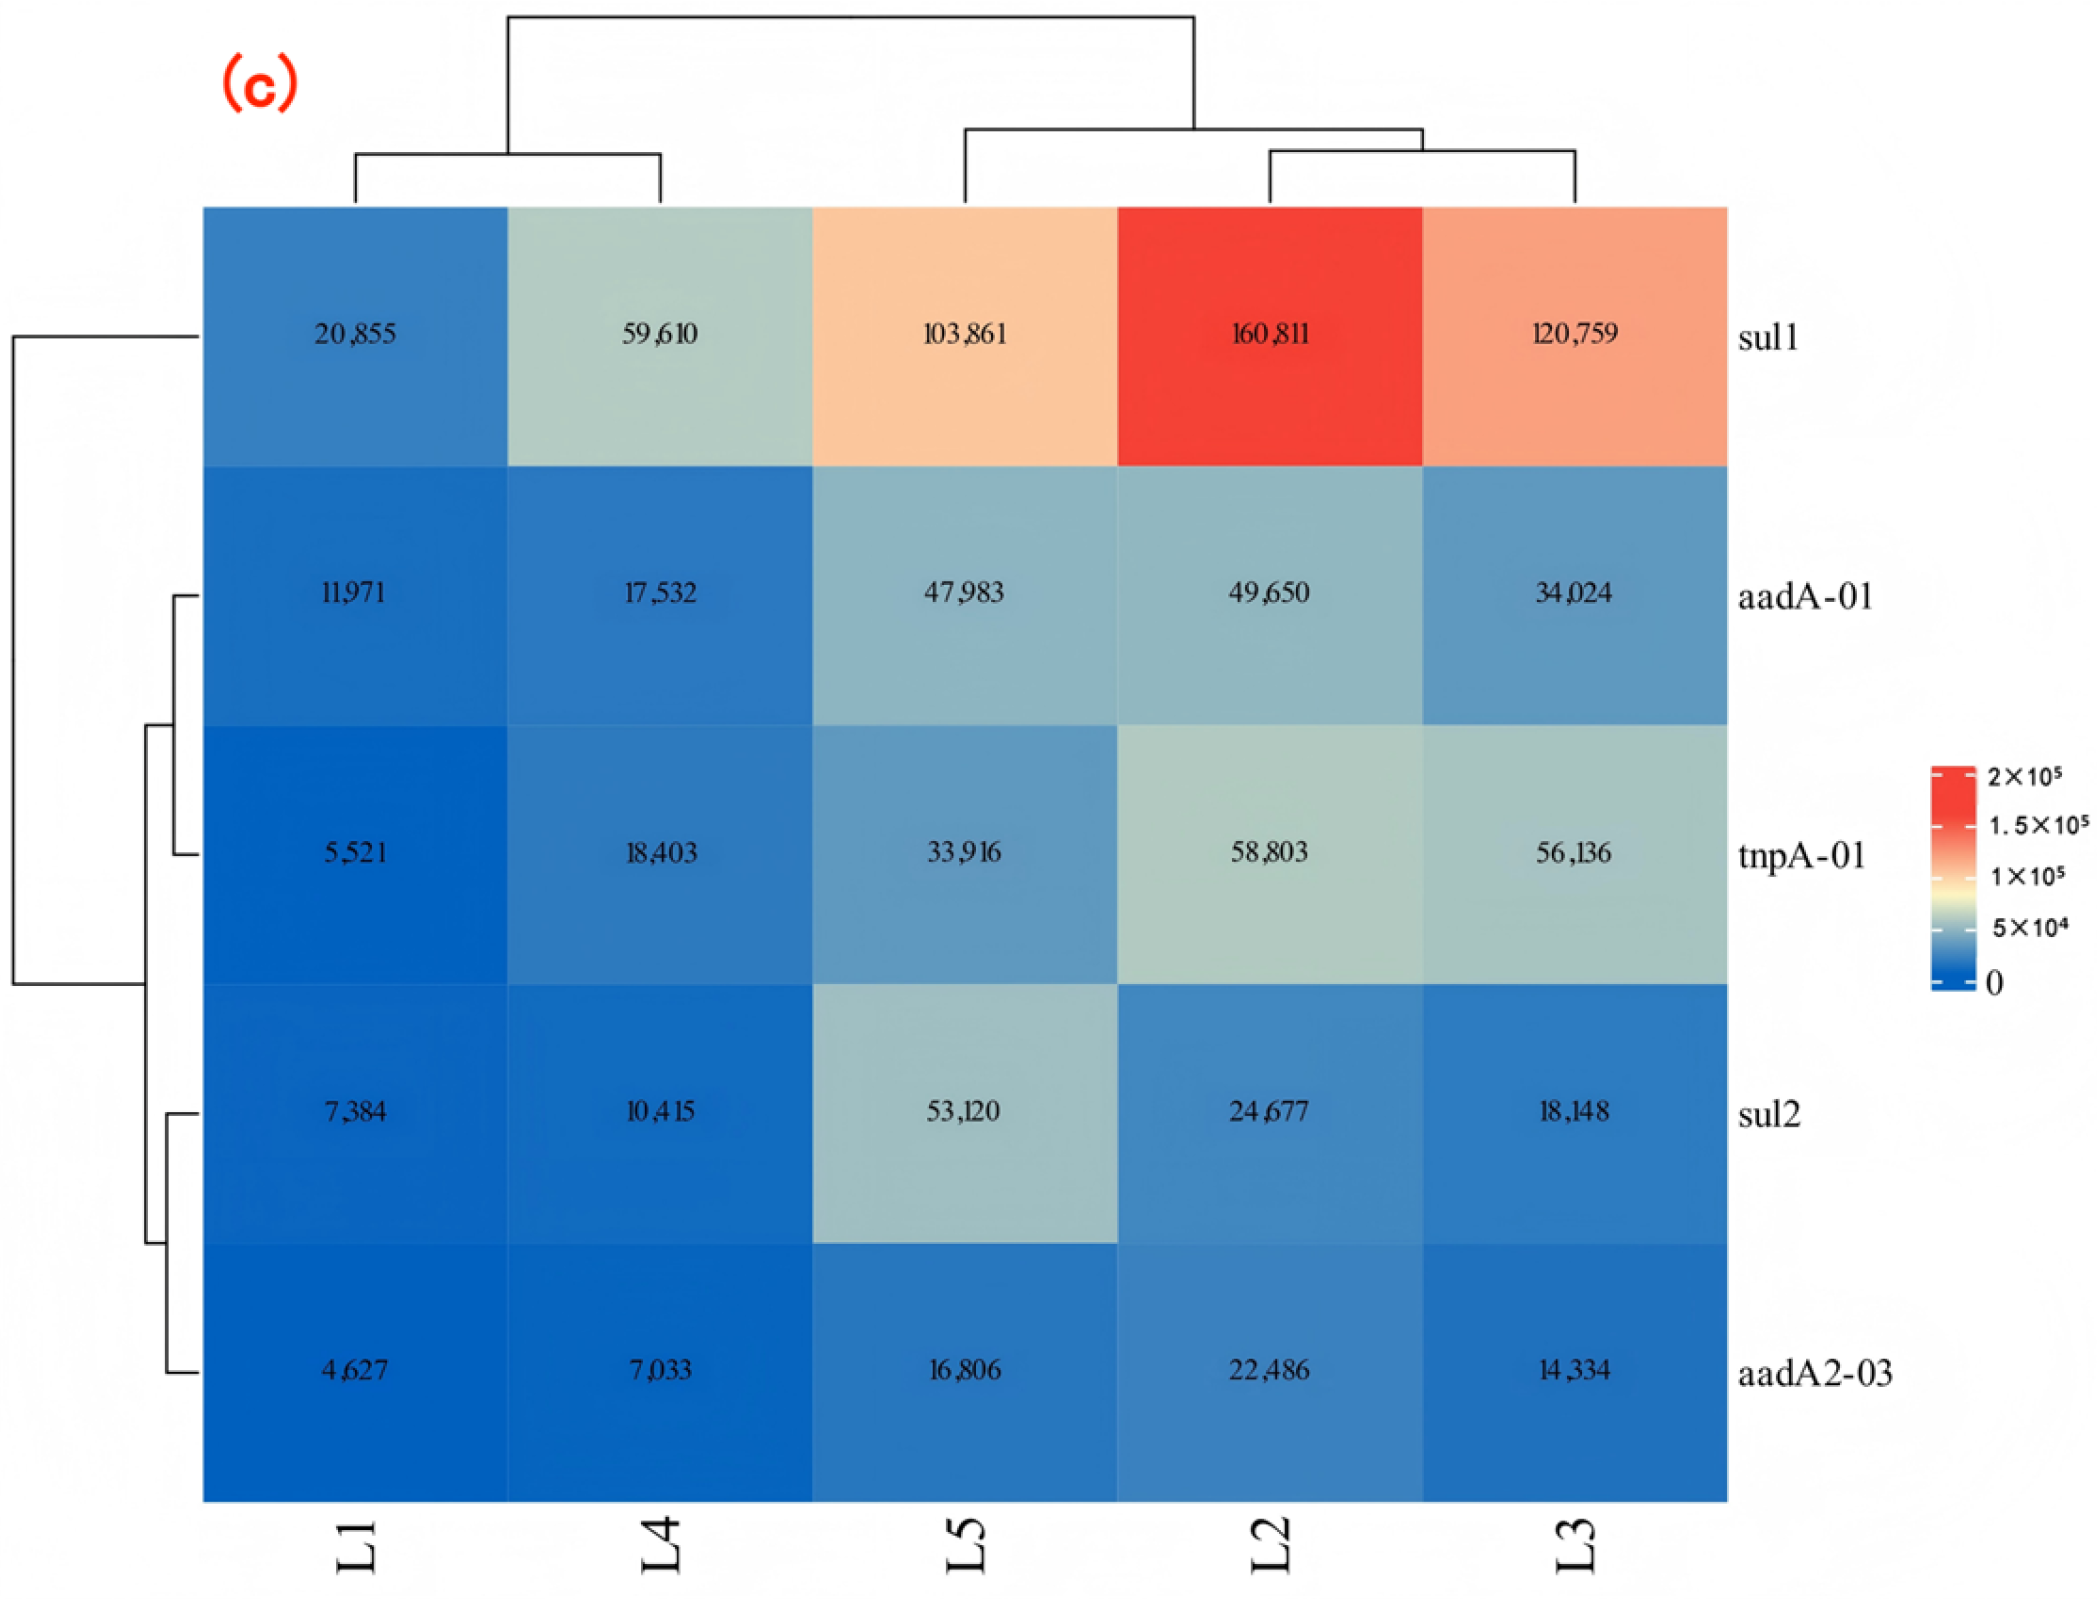
In this study, we focused on the top five genes in absolute abundance, namely sul1, sul2, aadA2–03, aadA–01, and tnpA–01, and their absolute abundance changes are shown in Figure 7. The results showed that, in the wet season, the sul1 gene at L2 and L3 sampling points showed the highest absolute abundance, which was significantly higher than other sampling points, with the highest value larger than 7.58 × 10⁶ copies/mL. The appearance of this phenomenon was closely related to a large number of farmland and livestock farms distributed around these two sampling points. In other words, the extensive use of antibiotics in agricultural production led to the high absolute abundance of sul1 gene. In the normal season, the absolute abundance of sul1 in L2, L3, and L4 sampling points was significantly higher than that in other sampling points, and the highest value was 1.85 × 10⁶ copies/mL. Among them, L2 and L3 were close to cities and towns, which had a great influence on farmland and animal husbandry. At the same time, the possible urban sewage discharge had jointly led to the high use of antibiotics and the production of resistance genes. Meanwhile, in the dry season, the absolute abundance of the sul1 gene was the highest in L2, L3, and L5 sampling points, reaching 1.60 × 10⁶ copies/mL.
Based on the data of three water periods, it can be clearly seen that the absolute abundance of ARGs at L2 and L3 sampling points was always at the highest level during the whole monitoring period. Through sampling field investigation and satellite map observation, it was found that there were lots of agricultural and animal husbandry activities around these two sampling points. The long–term abuse of antibiotics in aquaculture and animal husbandry may lead to the production of ARGs in animals [45,46]. These resistance genes enter the environment through animal excreta, which may cause potential gene pollution to the culture area and its surrounding environment. This might be the reason why the absolute abundance of ARGs at L2 and L3 points was always at the highest level. These resistance genes had the potential to spread and spread in the environment, thus posing a threat to public health, food safety and drinking water safety [47]. From the above results, it can be preliminarily determined that ARGs at L2 and L3 sampling points had the most significant pollution to the Dongliao River Basin. Therefore, in view of these two key areas, it is necessary to strengthen the management of antibiotic use and pollution control measures in the future to reduce its impact on the water environment of the basin.
The test results showed that in the wet season, the total number of genes detected ranged from 134 to 187, including 7 kinds of MGEs. Among them, sampling points L2 and L3 had the largest number of ARGs subtypes, reaching 180 and 184. In the normal season, the total number of genes detected increased, ranging from 162 to 208, and MGEs remained at 7. At this time, the number of ARG subtypes in L2 and L3 was still high, with the values of 208 and 185. In the dry season, the total number of genes detected reached the highest, ranging from 180 to 200, and MGEs were still 7. The number of ARG subtypes of L2 and L3 also reached the peak in this period, with values of 200 and 199. The quantitative results of ARGs subtypes in three periods showed that L2 and L3 sampling points maintained a high diversity of resistance genes, reflecting the persistent pollution characteristics in this area under different hydrological conditions. This further highlighted the particularity of L2 and L3 sampling sections in the Dongliao River Basin, and this might be related to more agricultural and aquaculture activities around these two sampling sections [48,49].

3.3. Correlation Analysis Between ARGs and Environmental Factors

As shown in Figure 8, redundancy analysis is performed using ARGs (sul1, sul2, aadA2–03, aadA–01) and MGEs (intl1, tnpA–01) with higher absolute abundances in 15 surface water samples across three periods, along with 11 physicochemical factors. The 15 surface water samples were distributed across four quadrants. Water samples from the wet season clustered within all four quadrants; samples from the normal season were distributed across quadrants 2, 3, and 4; and samples from the dry season were distributed across quadrants 1, 2, and 3. The first and second principal component axes, explaining 80.64% and 5.98% of the variance, respectively, accounted for 86.62% of the total variance in ARG distribution patterns. Redundancy analysis revealed that DO, pH, temperature, TN, TP, COD, Al, Pb, F, and Cl all contributed to varying degrees to explaining the differences in these five ARGs across different water samples. Furthermore, significant correlations (p < 0.05) were observed among most of these variables. sul1, sul2, aadA2–03, tnpA–01, and intl1 showed extremely strong correlations (p < 0.05) with environmental factor levels including COD, pH, TN, NH4+–N, F, and Cl. Previous studies have also demonstrated that the abundance of ARGs exhibits significant correlations with temperature, TN, DO, pH, and NH4+–N [50,51,52].
The results showed that environmental factors indeed exhibit significant correlations with the occurrence of ARGs in water, providing valuable insights for studying the sources of ARGs in the Dongliao River. Overall, the association between ARGs and environmental factors was stronger during the normal and dry season than during the wet season.

3.4. ARGs Pollution Source Analysis

ARGs in the aquatic environment not only have direct toxic effects on aquatic organisms but also may change the structure and function of microbial communities, induce the production and spread of more ARGs, and then pose a threat to human health and the stability of ecosystems. Therefore, it is particularly important to analyze the source of ARGs in water and prevent and control them at the source.

3.4.1. Establishment of the PCA–MLR Model

Principal component analysis was performed on 11 environmental factors using SPSS 26.0 software. Raw data were first standardized using Z-scores to eliminate dimensional effects. Kaiser–Meyer–Olkin (KMO) and Bartlett’s sphericity tests (KMO = 0.732, Bartlett p < 0.001) confirmed suitability for dimensionality reduction analysis. Principal components with eigenvalues > 1 were extracted. The variance contribution rate and cumulative contribution rate for each principal component were calculated, with results presented in Table 2.
The extracted principal component scores (PC scores) were used as independent variables, and the log-transformed abundance of ARGs served as the dependent variable to establish the MLR model (1).
l o g 10 ( A R G i ) = β 0 + j = 1 k β j · P C j + ε
where
  • log10(ARGi): Log-transformed abundance of the i-th ARG (dependent variable);
  • β0: the intercept;
  • βj: the regression coefficient;
  • k: Number of principal components (k = 3 in this study);
  • ε: the error;
  • PCj: jth principal component score (independent variable).
The principal component extraction results are as follows: PCA analysis extracted three principal components (PC1–PC3), with a cumulative variance contribution rate of 86.2%, meeting the dimension reduction requirement.
Table 3 shows that PC1 accounts for 42.3% of the variance, with its high–loading variables being water temperature (0.450), DO (0.350), pH (−0.400), and Cl (−0.300). Positive scores correspond to the characteristics of high temperature, high DO, low pH, and low Cl during the wet season; negative scores represent the low-temperature environment during the dry season. This gradient reflects the combined influence of seasonal hydrological cycles on the physicochemical properties of the water. PC2 accounts for 28.7% of the variance, with its high–load variables being COD (0.450), TN (0.400), TP (0.350), and NH4+–N (0.300). All these variables exhibit positive loadings, representing the intensity of anthropogenic pollution inputs. Higher positive scores indicate more severe eutrophication and organic pollution in water bodies, reflecting the combined effects of point source and nonpoint source pollution. PC3 contributed 15.2%, with high–load variables Pb (0.450), Al (0.400), and F (0.350), representing the composite characteristics of industrial pollutants. This gradient correlates with industrial discharges, mining activities, or urban surface runoff. The negative load of TP (−0.350) may reflect the antagonistic relationship between phosphorus and heavy metals under certain conditions.
MLR models were established for four representative genes with high absolute abundance. Four MLR models were constructed using PC1, PC2, and PC3 scores as independent variables and the absolute abundance of each resistance gene as the dependent variable (Table 4).
Results indicate that the PC2 coefficient (β2) for sulfonamide resistance genes (sul1, sul2) is significantly positive, suggesting their abundance is primarily driven by nutrient salt pollution. The PC1 coefficient (β1) was negative, indicating reduced abundance under high temperatures, possibly due to intensified microbial community competition caused by elevated temperatures. The PC3 coefficient (β1) for sul2 was also relatively high, suggesting that heavy metals act as a co-selective pressure promoting the maintenance of sulfonamide resistance genes.
The principal component analysis (PC1) coefficient for aminoglycoside resistance genes (aadA2–03, aadA–01) was significantly positive (β1), indicating sensitivity to temperature gradients and significant proliferation during high–temperature, high–water periods. This may be related to high temperatures promoting bacterial metabolic activity, accelerating gene replication, and facilitating horizontal gene transfer. The PC2 coefficient (β2) was also positive, reflecting that nutrient input conferred a growth advantage to host bacteria harboring resistance genes.

3.4.2. Model Validation and Reliability Assessment

KMO > 0.7 and Bartlett’s test p < 0.001 ensured data suitability; all models achieved R2 > 0.68 and F–test p < 0.01, guaranteeing significant model fit; residual diagnostics confirmed hypothesis fulfillment; cross–validation R2 cv closely matched training R2, indicating strong generalization capability.

4. Conclusions

In this study, the main conclusions obtained are as follows:
(1)
In the water environment of the Dongliao River Basin, the pollution of ARGs has shown a wide distribution trend. The monitoring data showed that the relative abundance of the seven kinds of ARGs in surface water was detected, with the relative abundances of ARGs of SAs, AMs, and TCs being relatively large. The data showed that the absolute abundance of sul1 was large, which indicates that it contributed a lot to ARGs pollution in the Dongliao River basin.
(2)
The detected subtypes results showed that the number of gene subtypes was the highest in the dry season, with 180–200 at each sampling point, and 7 MGEs were detected at the same time, among which β-lactams and MLSB were more, with 39–50 and 30–36 gene subtypes. Therefore, in the water environment of the Dongliao River basin, β-β-lactam ARGs had high diversity, which might pose a potential danger to the ecological environment of the basin.
(3)
The total number of genes detected in the wet season was 134–187, and MGEs were 7, among which the ARGs subtypes of L2 and L3 were the most, reaching 180 and 184. The total number of genes detected in the normal season was 162–208, and MGEs were still 7. The ARG subtypes of L2 and L3 were the most, with 208 and 185. The total number of genes detected in the dry season was 180–200, with 7 MGEs, and the ARGs subtypes of L2 and L3 were the most, with 200 and 199. Therefore, it can be seen that in the three water periods, the number of ARG subtypes at sampling points L2 and L3 was always at a high level, which clearly pointed out that the ARG pollution problem was particularly prominent in densely populated areas of agriculture and animal husbandry.
(4)
Analysis of river physicochemical indicators and resistance gene abundance using the PCA–MLR model revealed that sulfonamide resistance genes (sul1, sul2) were primarily driven by nutrient pollution. Aminoglycoside resistance genes (aadA2–03, aadA–01) exhibited sensitivity to temperature gradients, with significant proliferation during high–temperature seasons. The PCA–MLR model provides a scientific basis for pollution source control, risk assessment, and precision management. Future studies are recommended to expand sample size, incorporate nonlinear models, and integrate biological factors to further enhance the model’s predictive capability and applicability.
(5)
This study marked the beginning of long–term monitoring research on ARGs in the Dongliao River. It had limitations such as insufficient sampling points and the absence of ARG detection in sediments. Future research will incorporate sediment and vertical profile samples. Should further investigation into ARGs in the Dongliao River water environment be required, continuous monitoring will need to be maintained.

Author Contributions

Conceptualisation, H.L.; methodology, Y.Z.; software, H.L.; validation, Y.Z.; formal analysis, H.L.; investigation, L.W.; resources, Q.C.; data curation, L.W.; writing—original draft preparation, H.L.; writing—review and editing, Q.C.; visualization, Y.Z.; supervision, Q.C.; project administration, Q.C.; funding acquisition, H.L. and Q.C. All authors have read and agreed to the published version of the manuscript.

Funding

This work was supported by the Environmental Protection Scientific Research Project (JiHuanKeZi No. 2024–02), the National Natural Science Foundation of China (No. 42130705), and the Education Department of Jilin Province (No. JJKH20250991KJ).

Data Availability Statement

The original contributions presented in this study are included in the article. Further inquiries can be directed to the corresponding author.

Conflicts of Interest

The authors declare no conflicts of interest.

References

  1. Jarab, A.S.; Mukattash, T.L.; Nusairat, B.; Shawaqfeh, M.; Abu Farha, R. Patterns of Antibiotic Use and Administration in Hospitalized Patients in Jordan. Saudi Pharm. J. 2018, 26, 764–770. [Google Scholar] [CrossRef]
  2. Chen, H.; Zhang, M. Occurrence and removal of antibiotic resistance genes in municipal wastewater and rural domestic sewage treatment systems in eastern China. Environ. Int. 2013, 55, 9–14. [Google Scholar] [CrossRef]
  3. Gallagher, M.T.; Reisinger, A.J. Effects of ciprofloxacin on metabolic activity and algal biomass of urban stream biofilms. Sci. Total Environ. 2019, 706, 135728. [Google Scholar] [CrossRef]
  4. Gracia–Marín, E.; Rico, A.; Fabregat–Safont, D.; López, F.J.; Hernández, F.; Pitarch, E.; Bijlsma, L. Comprehensive study on the potential environmental risk of temporal antibiotic usage through wastewater discharges. Chemosphere 2023, 346, 140587. [Google Scholar] [CrossRef] [PubMed]
  5. Gros, M.; Mas–Pla, J.; Sànchez–Melsió, A.; Čelić, M.; Castaño, M.; Rodríguez–Mozaz, S.; Borrego, C.M.; Balcázar, J.L.; Petrović, M. Antibiotics, antibiotic resistance and associated risk in natural springs from an agroecosystem environment. Sci. Total Environ. 2022, 857, 159202. [Google Scholar] [CrossRef] [PubMed]
  6. Guo, X.P.; Zhao, S.; Chen, Y.R.; Yang, J.; Hou, L.J.; Liu, M.; Yang, Y. Antibiotic resistance genes in sediments of the Yangtze Estuary: From 2007 to 2019. Sci. Total Environ. 2020, 744, 140713. [Google Scholar] [CrossRef]
  7. Na, G.; Zhang, K.; Gao, H.; Li, R.; Jin, S.; Zhao, F.; Zhang, H.; Li, S. Occurrence and distribution characteristics of antibiotic resistance genes in sediments between urban and rural of the Liaohe River Basin, China. Environ. Sci. Pollut. Res. 2021, 28, 54002–54014. [Google Scholar] [CrossRef]
  8. Li, J.; Feng, S.; Liu, X.; Jia, X.; Qiao, F.; Guo, J.; Deng, S. Effects of Traditional Chinese Medicine and its Active Ingredients on Drug–Resistant Bacteria. Front. Pharmacol. 2022, 13, 837907. [Google Scholar] [CrossRef]
  9. Guo, Z.F.; Boeing, W.J.; Xu, Y.Y.; Borgomeo, E.; Liu, D.; Zhu, Y.G. Data–driven discoveries on widespread contamination of freshwater reservoirs by dominant antibiotic resistance genes. Water Res. 2022, 229, 119466. [Google Scholar] [CrossRef]
  10. Jiang, L.; Zhai, W.; Wang, J.; Li, G.; Zhou, Z.; Li, B.; Zhuo, H. Antibiotics and antibiotic resistance genes in the water sources of the Wuhan stretch of the Yangtze River: Occurrence, distribution, and ecological risks. Environ. Res. 2023, 239, 117295. [Google Scholar] [CrossRef]
  11. Su, S.; Li, C.; Yang, J.; Xu, Q.; Qiu, Z.; Xue, B.; Wang, S.; Zhao, C.; Xiao, Z.; Wang, J.; et al. Distribution of Antibiotic Resistance Genes in Three Different Natural Water Bodies–A Lake, River and Sea. Int. J. Environ. Res. Public Health. 2020, 17, 552. [Google Scholar] [CrossRef]
  12. Givens, C.E.; Kolpin, D.W.; Hubbard, L.E.; Meppelink, S.M.; Cwiertny, D.M.; Thompson, D.A.; Lane, R.F.; Wilson, M.C. Simultaneous Stream Assessment of Antibiotics, Bacteria, Antibiotic Resistant Bacteria, and Antibiotic Resistance Genes in an Agricultural Region of the United States. Sci. Total Environ. 2023, 904, 166753. [Google Scholar] [CrossRef]
  13. Jiang, L.; Hu, X.; Xu, T.; Zhang, H.; Sheng, D.; Yin, D. Prevalence of Antibiotic Resistance Genes and Their Relationship with Antibiotics in the Huangpu River and the Drinking Water Sources, Shanghai, China. Sci. Total Environ. 2013, 458–460, 267–272. [Google Scholar] [CrossRef]
  14. Muoghalu, C.; Kaboggoza, H.C.; Semiyaga, S.; Lebu, S.; Lui, C.; Niwagaba, C.; Nansubuga, F.; Manga, M. Antibiotic Resistant Bacteria (ARB) and Genes (ARGs) in Urban Wastewater Treatment Plants: Influencing Factors, Mechanisms, and Removal Efficiency. Environ. Pollut. 2025, 383, 126851. [Google Scholar] [CrossRef] [PubMed]
  15. Silvester, R.; Perry, W.B.; Webster, G.; Rushton, L.; Baldwin, A.; Pass, D.A.; Byrnes, N.A.; Farkas, K.; Heginbothom, M.; Craine, N.; et al. Metagenomic Profiling of Hospital Wastewater: A Comprehensive National Scale Analysis of Antimicrobial Resistance Genes and Opportunistic Pathogens. J. Infect. 2025, 90, 106503. [Google Scholar] [CrossRef] [PubMed]
  16. Chen, T.; Zhang, S.; Zhu, R.; Zhao, M.; Zhang, Y.; Wang, Y.; Liao, X.; Wu, Y.; Mi, J. Distribution and Driving Factors of Antibiotic Resistance Genes in Treated Wastewater from Different Types of Livestock Farms. Sci. Total Environ. 2022, 849, 157837. [Google Scholar] [CrossRef] [PubMed]
  17. Kirschner, A.K.T.; Schachner–Groehs, I.; Linke, R.B.; Farnleitner, A.H. Correspondence on “Tracking Sources and Dissemination of Indicator Antibiotic Resistance Genes at a Watershed Scale”. Be Aware of DNA Loss during Extraction from Water Samples! ACS EST Water 2024, 4, 4658–4660. [Google Scholar] [CrossRef]
  18. Wiesner–Friedman, C.; Beattie, R.E.; Stewart, J.R.; Hristova, K.R.; Serre, M.L. Identifying Sources of Antibiotic Resistance Genes in the Environment Using the Microbial Find, Inform, and Test Framework. Front. Microbiol. 2023, 14, 1223876. [Google Scholar] [CrossRef]
  19. Zhang, A.N.; Hou, C.J.; Negi, M.; Li, L.G.; Zhang, T. Online Searching Platform for the Antibiotic Resistome in Bacterial Tree of Life and Global Habitats. FEMS Microbiol. Ecol. 2020, 96, fiaa107. [Google Scholar] [CrossRef]
  20. Wang, H.; Hou, L.; Liu, Y.; Liu, K.; Zhang, L.; Huang, F.; Wang, L.; Rashid, A.; Hu, A.; Yu, C. Horizontal and Vertical Gene Transfer Drive Sediment Antibiotic Resistome in an Urban Lagoon System. J. Environ. Sci. 2020, 102, 11–23. [Google Scholar] [CrossRef]
  21. Sanganyado, E.; Gwenzi, W. Antibiotic Resistance in Drinking Water Systems: Occurrence, Removal, and Human Health Risks. Sci. Total. Environ. 2019, 669, 785–797. [Google Scholar] [CrossRef]
  22. Zhu, D.; Xiang, Q.; Yang, X.R.; Ke, X.; O’Connor, P.; Zhu, Y.G. Trophic Transfer of Antibiotic Resistance Genes in a Soil Detritus Food Chain. Environ. Sci. Technol. 2019, 53, 7770–7781. [Google Scholar] [CrossRef] [PubMed]
  23. Zhou, Z.C.; Shuai, X.Y.; Lin, Z.J.; Zheng, J.; Chen, H. Comprehensive Profiling and Risk Assessment of Antibiotic Resistance Genes in a Drinking Water Watershed by Integrated Analysis of Air–Water–Soil. J. Environ. Manag. 2023, 347, 119092. [Google Scholar] [CrossRef] [PubMed]
  24. Jiang, C.; Pan, X.; Grossart, H.P.; Lin, L.; Shi, J.; Yang, Y. Vertical and Horizontal Distributions of Clinical Antibiotic Resistance Genes and Bacterial Communities in Danjiangkou Reservoir, China. Environ. Sci. Pollut. Res. 2021, 28, 61163–61175. [Google Scholar] [CrossRef]
  25. Wang, S.; Fang, L.; Sun, X.; Lu, W. Occurrence and Distribution of Antibiotic Resistance Genes in Urban Rivers with Black–Odor Water of Harbin, China. Environ. Res. 2024, 259, 119497. [Google Scholar] [CrossRef]
  26. Li, L.G.; Huang, Q.; Yin, X.; Zhang, T. Source Tracking of Antibiotic Resistance Genes in the Environment—Challenges, Progress, and Prospects. Water Res. 2020, 185, 116127. [Google Scholar] [CrossRef]
  27. HJ 91.2–2022; Technical Specifications for Surface Water Environmental Quality Monitoring. Standards Press of China: Beijing, China, 2022.
  28. HJ 442.4–2020; Technical Specification for Offshore Environmental Monitoring–Part 4: Offshore Sediment Monitoring. Standards Press of China: Beijing, China, 2020.
  29. HJ/T 91–2002; Technical Specifications Requirements for Monitoring of Surface Water and Waste Water. Standards Press of China: Beijing, China, 2002.
  30. GB 3838–2002; Environmental Quality Standards for Surface Water. Standards Press of China: Beijing, China, 2002.
  31. Ogola, H.J.O. Wastewater–Driven Nutrient Enrichment Restructures Viral Community Assembly, Host Interactions, and Ecological Function along the Nakivubo–Lake Victoria Interface in Uganda. Sci. Total Environ. 2025, 993, 180002. [Google Scholar] [CrossRef]
  32. Fernanda, P.A.; Liu, S.; Yuan, T.; Ramalingam, B.; Lu, J.; Sekar, R. Diversity and Abundance of Antibiotic Resistance Genes and Their Relationship with Nutrients and Land Use of the Inflow Rivers of Taihu Lake. Front. Microbiol. 2022, 13, 1009297. [Google Scholar] [CrossRef]
  33. Li, Y.; Xu, Y.; Zhou, X.; Huang, L.; Wang, G.; Liao, J.; Dai, R. From “Resistance Genes Expression” to “Horizontal Migration” as Well as over Secretion of Extracellular Polymeric Substances: Sludge Microorganism’s Response to the Increasing of Long–Term Disinfectant Stress. J. Hazard. Mater. 2024, 469, 133940. [Google Scholar] [CrossRef]
  34. Yu, K.; Chai, B.; Zhuo, T.; Tang, Q.; Gao, X.; Wang, J.; He, L.; Lei, X.; Chen, B. Hydrostatic Pressure Drives Microbe–Mediated Biodegradation of Microplastics in Surface Sediments of Deep Reservoirs: Novel Findings from Hydrostatic Pressure Simulation Experiments. Water Res. 2023, 242, 120185. [Google Scholar] [CrossRef]
  35. Chen, A.; Zhang, T.; Cheng, F.; Yang, H.; Guo, Z.; Zhao, S.; Zhang, Y.-N.; Qu, J. Comprehensive Analysis and Risk Assessment of Antibiotic Contaminants, Antibiotic–Resistant Bacteria, and Resistance Genes: Patterns, Drivers, and Implications in the Songliao Basin. Environ. Pollut. 2024, 361, 124852. [Google Scholar] [CrossRef] [PubMed]
  36. Omeyer, L.C.M.; Duncan, E.M.; Aiemsomboon, K.; Beaumont, N.; Bureekul, S.; Cao, B.; Carrasco, L.R.; Chavanich, S.; Clark, J.R.; Cordova, M.R.; et al. Corrigendum to “Priorities to Inform Research on Marine Plastic Pollution in Southeast Asia”. Sci. Total Environ. 2022, 841, 159595. [Google Scholar] [CrossRef] [PubMed]
  37. Liang, X.; Guan, F.; Chen, B.; Luo, P.; Guo, C.; Wu, G.; Ye, Y.; Zhou, Q.; Fang, H. Spatial and Seasonal Variations of Antibiotic Resistance Genes and Antibiotics in the Surface Waters of Poyang Lake in China. Ecotoxicol. Environ. Saf. 2020, 196, 110543. [Google Scholar] [CrossRef]
  38. Huang, Y.; Wang, F.; Li, Y.; Yue, C.; Zhang, Y.; Zhou, P.; Mu, J. Influence of Anthropogenic Disturbances on Antibiotic Resistance Gene Distributions along the Minjiang River in Southeast China. J. Environ. Manag. 2022, 323, 116154. [Google Scholar] [CrossRef] [PubMed]
  39. Lu, Z.; Na, G.; Gao, H.; Wang, L.; Bao, C.; Yao, Z. Fate of Sulfonamide Resistance Genes in Estuary Environment and Effect of Anthropogenic Activities. Sci. Total Environ. 2015, 527–528, 429–438. [Google Scholar] [CrossRef]
  40. Tian, M.; He, X.; Feng, Y.; Wang, W.; Chen, H.; Gong, M.; Liu, D.; Clarke, J.L.; van Eerde, A. Pollution by Antibiotics and Antimicrobial Resistance in LiveStock and Poultry Manure in China, and Countermeasures. Antibiotics 2021, 10, 539. [Google Scholar] [CrossRef]
  41. Zhang, L.; Du, S.; Zhang, X.; Lyu, G.; Dong, D.; Hua, X.; Zhang, W.; Guo, Z. Occurrence, Distribution, and Ecological Risk of Pharmaceuticals in a Seasonally Ice–Sealed River: From Ice Formation to Melting. J. Hazard. Mater. 2020, 389, 122083. [Google Scholar] [CrossRef]
  42. White, D.; Lapworth, D.J.; Civil, W.; Williams, P. Tracking Changes in the Occurrence and Source of Pharmaceuticals within the River Thames, UK; from Source to Sea. Environ. Pollut. 2019, 249, 257–266. [Google Scholar] [CrossRef]
  43. Czatzkowska, M.; Wolak, I.; Harnisz, M.; Korzeniewska, E. Impact of Anthropogenic Activities on the Dissemination of ARGs in the Environment—A Review. Int. J. Environ. Res. Public Health 2022, 19, 12853. [Google Scholar] [CrossRef]
  44. Lu, X.M.; Peng, X.; Xue, F.; Qin, S.; Ye, S.; Dai, L.B. Distance Dilution of Antibiotic Resistance Genes of Sediments in an Estuary System in Relation to Coastal Cities. Environ. Pollut. 2021, 281, 116980. [Google Scholar] [CrossRef]
  45. Adelowo, O.O.; Fagade, O.E.; Agersø, Y. Antibiotic Resistance and Resistance Genes in Escherichia Coli from Poultry Farms, Southwest Nigeria. J. Infect. Dev. Ctries. 2014, 8, 1103–1112. [Google Scholar] [CrossRef]
  46. Su, H.; Liu, S.; Hu, X.; Xu, X.; Xu, W.; Xu, Y.; Li, Z.; Wen, G.; Liu, Y.; Cao, Y. Occurrence and Temporal Variation of Antibiotic Resistance Genes (ARGs) in Shrimp Aquaculture: ARGs Dissemination from Farming Source to Reared Organisms. Sci. Total. Environ. 2017, 607–608, 357–366. [Google Scholar] [CrossRef]
  47. Ramessar, K.; Egbewale, O.S.; Kumar, A.; Olaniran, A.O. Prevalence and Removal of Antibiotic–Resistant Bacteria and Genes in Treated Effluents of Four Wastewater Treatment Plants and Receiving Surface Waters. J. Water Process. Eng. 2025, 77, 108432. [Google Scholar] [CrossRef]
  48. Li, Z.; Cai, H.; Xu, B.; Dong, Q.; Jia, K.; Lin, Z.; Wang, X.; Liu, Y.; Qin, X. Prevalence, Antibiotic Resistance, Resistance and Virulence Determinants of Campylobacter Jejuni in China: A Systematic Review and Meta–Analysis. One Health 2025, 20, 100990. [Google Scholar] [CrossRef]
  49. Rahman, A.U.; Valentino, V.; Sequino, G.; Ercolini, D.; De Filippis, F. Comparative Analysis of Antibiotic–Administered vs. Antibiotic–Free Farming in Meat Production: Implications for Health, Environment, and Antibiotic Resistance. Food Microbiol. 2025, 133, 104877. [Google Scholar] [CrossRef] [PubMed]
  50. Lv, B.; Cui, Y.; Tian, W.; Wei, H.; Chen, Q.; Liu, B.; Zhang, D.; Xie, B. Vessel Transport of Antibiotic Resistance Genes across Oceans and Its Implications for Ballast Water Management. Chemosphere 2020, 253, 126697. [Google Scholar] [CrossRef]
  51. Huang, Z.; Zhao, W.; Xu, T.; Zheng, B.; Yin, D. Occurrence and Distribution of Antibiotic Resistance Genes in the Water and Sediments of Qingcaosha Reservoir, Shanghai, China. Environ. Sci. Eur. 2019, 31, 81–89. [Google Scholar] [CrossRef]
  52. Chen, Y.; Guo, X.; Niu, Z.; Lu, D.; Sun, X.; Zhao, S.; Hou, L.; Liu, M.; Yang, Y. Antibiotic Resistance Genes (ARGs) and Their Associated Environmental Factors in the Yangtze Estuary, China: From Inlet to Outlet. Mar. Pollut. Bull. 2020, 158, 111360. [Google Scholar] [CrossRef]
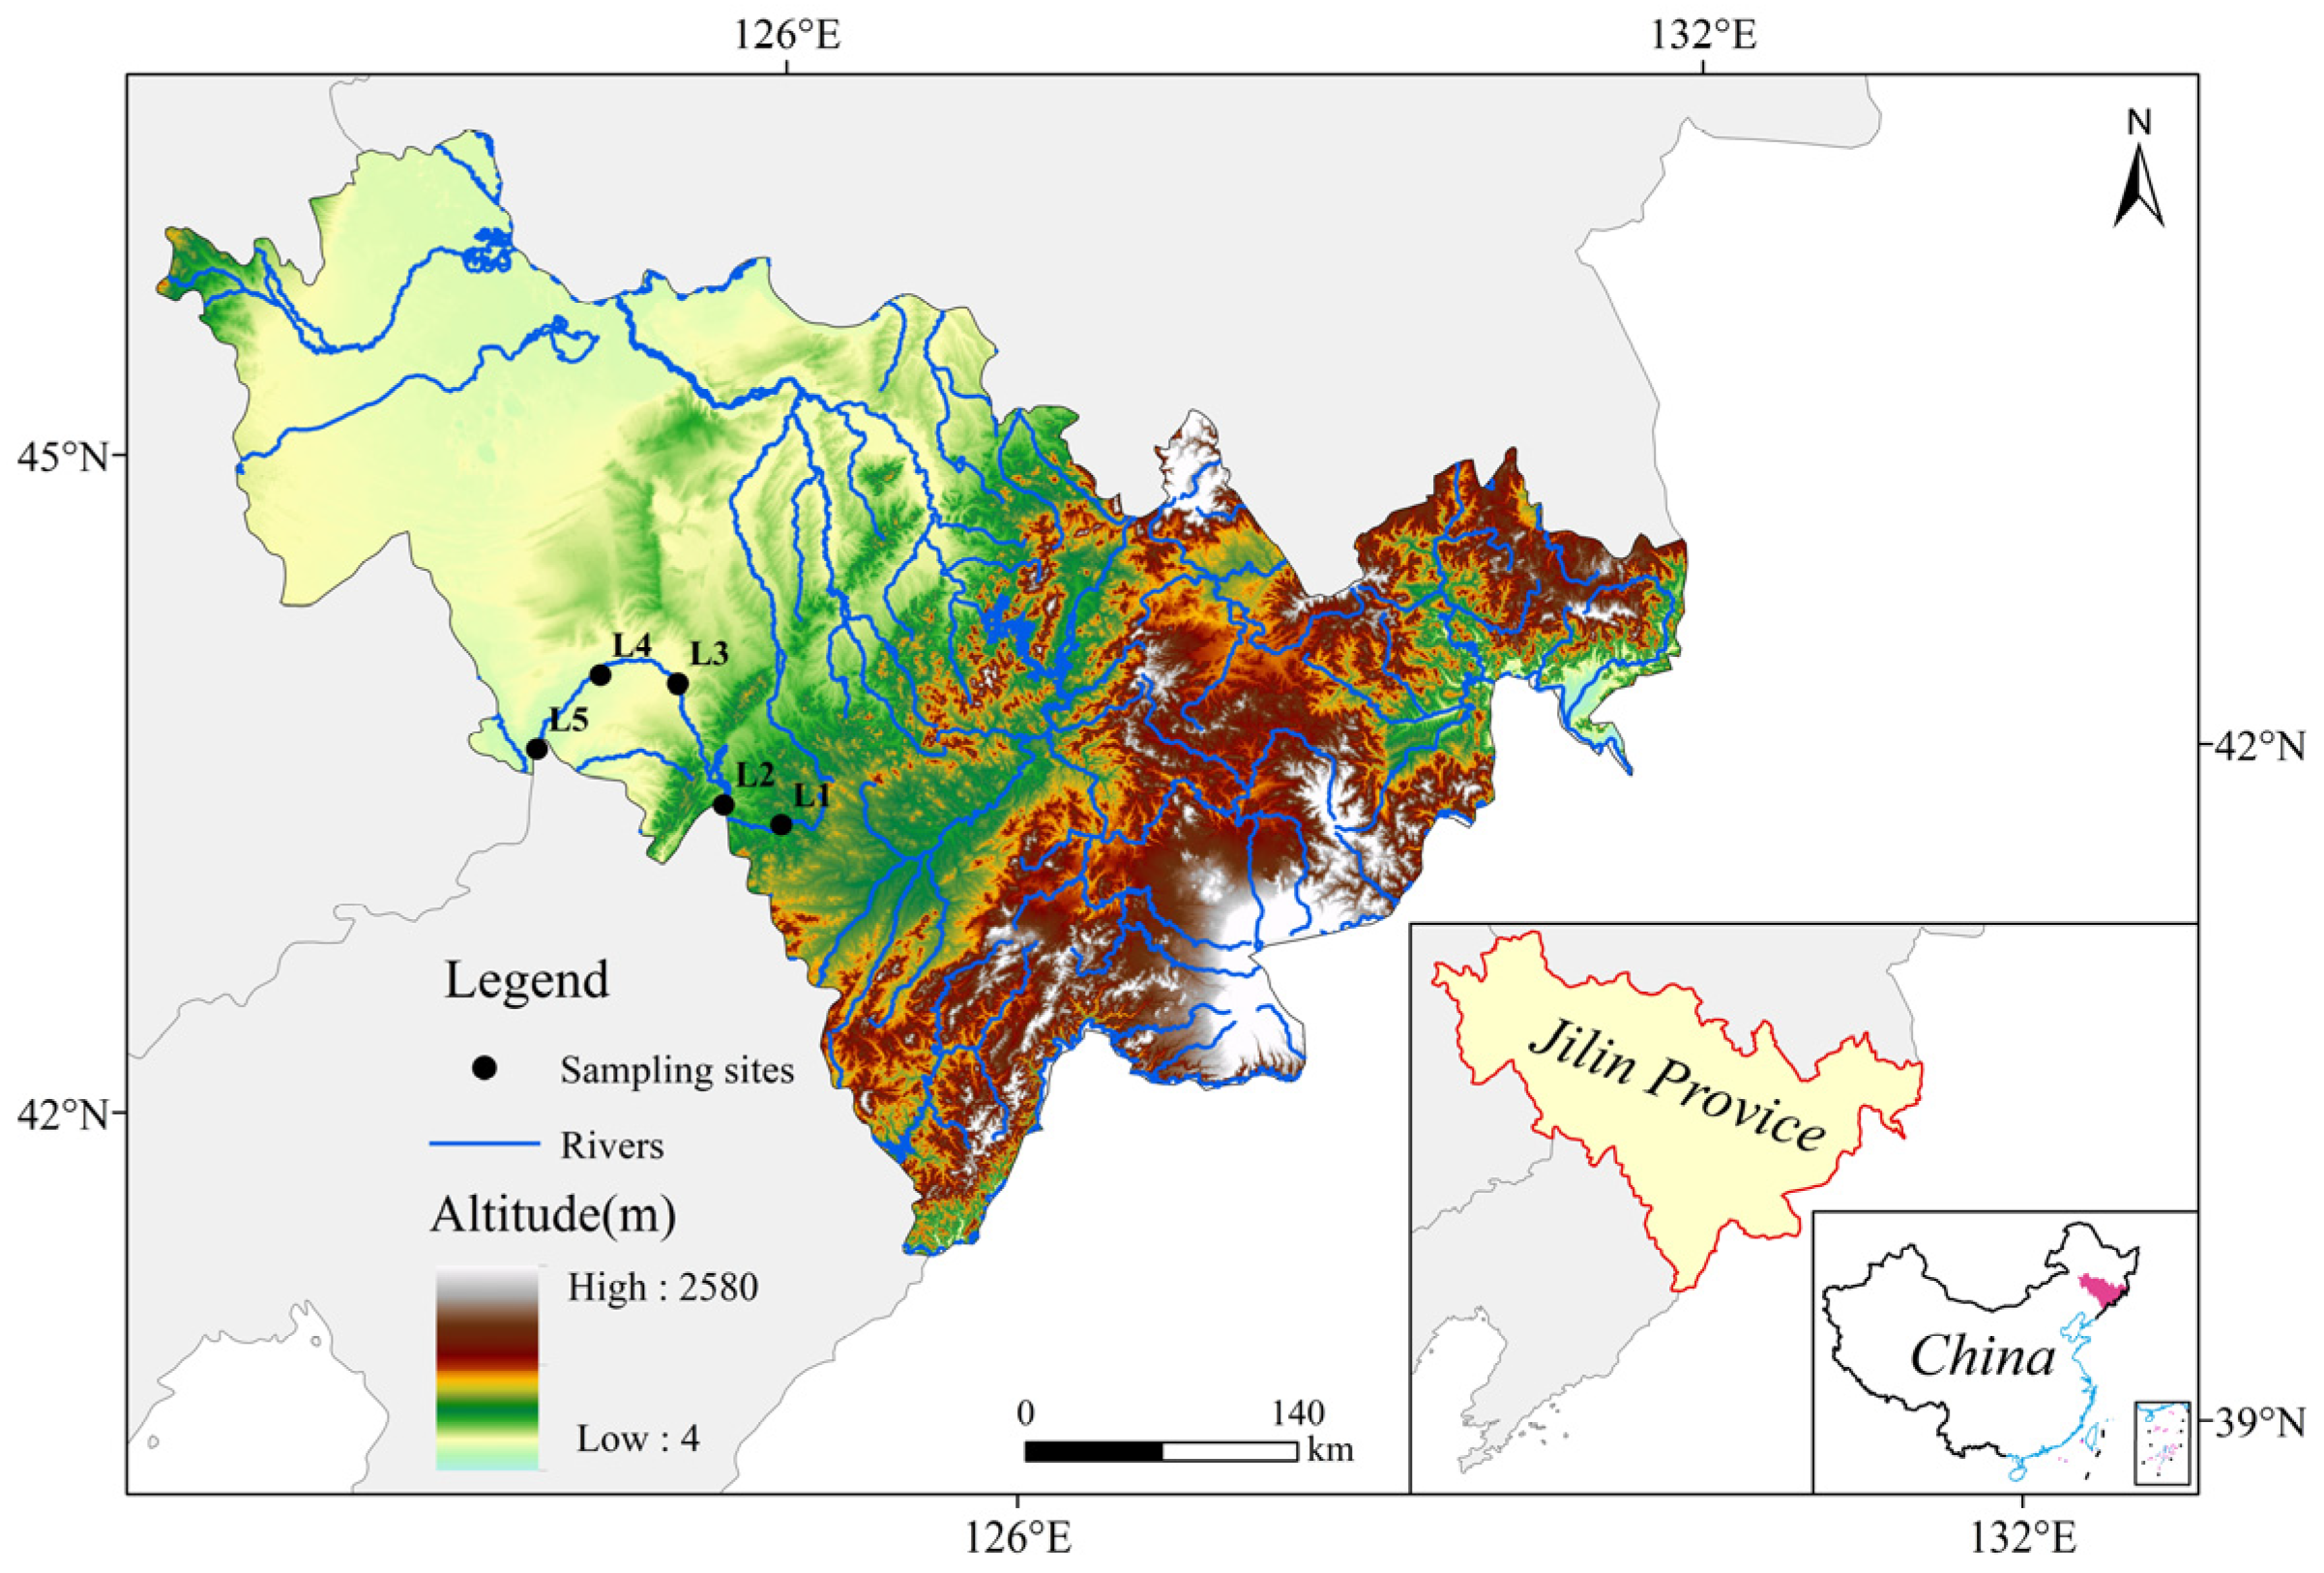
Figure 1. Schematic diagram of sampling point distribution in Dongliao River.
Water 17 03168 g001
Figure 2. Physical and chemical indices were measured at sampling points in the Dongliao River. (a) temperature; (b) pH; (c) DO; (d) NH4+–N; (e) TN; (f) total nitrogen; (g) COD; (h) aluminum ion; (i) Lead ion; (j) Fluoride ion; (k) Chloride ion.
Water 17 03168 g002
Figure 3. Circos diagram of ARGs in the Dongliao River Basin. (a) the wet season, (b) the normal season, (c) the dry season.
Water 17 03168 g003
Figure 4. Quantitative distribution of ARGs and MGEs detected in river basin water in three water periods.
Water 17 03168 g004
Figure 5. Relative abundance of ARGs and MGEs in surface water of the Dongliao River in three periods.
Water 17 03168 g005
Figure 6. Absolute abundance of 16S rRNA in surface water of the Dongliao River.
Water 17 03168 g006
Figure 7. Absolute abundance thermograms of sul1, sul2, aadA2–03, aadA–01 and tnpA–01. (a) the wet season; (b) the normal season; (c) the dry season.
Water 17 03168 g007aWater 17 03168 g007b
Figure 8. Redundancy analysis of absolute abundance and environmental factors for ARGs and MEGs across sampling points during the three periods.
Water 17 03168 g008
Table 1. Geographical location information of sampling points in the Dongliao River.
Name of Sampling PointNumber of Sampling PointsLongitude and Latitude
Dashou villageL1(42°54′51″ N, 125°11′47″ E)
HeqingL2(43°2′46″ N, 124°51′11″ E)
ChengzishangL3(43°37′34″ N, 124°40′33″ E)
ZhoujiahekouL4(43°42′57″ N, 124°11′20″ E)
Sishuang BridgeL5(43°25′12″ N, 123°43′0″ E)
Table 2. Characteristics of Each Principal Component.
Principal ComponentEigenvalueVariance Contribution Rate (%)Cumulative Contribution Rate (%)Primary Environmental Gradients
PC14.65342.342.3Temperature–Season
PC23.15728.771.0Nutrient pollution
PC31.67315.286.2Heavy metal pollution
Table 3. Rotated principal component loadings matrix.
Environmental FactorsPC1PC2PC3Togetherness
DO0.350−0.2500.2000.228
pH−0.4000.3500.2500.343
Temperature0.450−0.1500.1000.234
TN0.1500.4000.2500.244
TP0.2000.350−0.3500.294
NH4+–N0.2500.300−0.2500.212
COD0.3000.4500.1500.317
Al0.1500.2500.4000.254
Pb0.2800.3200.4500.386
F0.2000.2800.3500.251
Cl−0.300−0.2000.3000.230
Note: An absolute load value > 0.4 indicates a primary contributing factor; commonality represents the proportion of information extracted by the variable.
Table 4. PCA–MLR regression model parameters.
GeneIntercept (β0)PC1 (β1)PC2 (β2)PC3 (β3)R2Adjusted R2Fp
sul173,250.4−8623.524,851.212,305.60.7420.67210.5<0.001
sul228,184.0−5241.818,934.715,627.30.6890.60048.13<0.01
aadA2–0316,641.915,482.312,076.46835.20.7150.6389.21<0.001
aadA–0133,484.118,756.919,245.89124.70.7580.69211.5<0.001
Note: Bold coefficients indicate standardized absolute values > 0.3, indicating significant influence on gene abundance; all model F-tests yielded p < 0.01, reaching highly significant levels.
Disclaimer/Publisher’s Note: The statements, opinions and data contained in all publications are solely those of the individual author(s) and contributor(s) and not of MDPI and/or the editor(s). MDPI and/or the editor(s) disclaim responsibility for any injury to people or property resulting from any ideas, methods, instructions or products referred to in the content.