Article

Modeling Dissolved Organic Carbon in an Estuary Using Optical Properties and Salinity

by
Melissa W. Southwell
*,
Conrad Schindler
and
Francisco Ramirez
Department of Natural Sciences, Flagler College, Saint Augustine, FL 32084, USA
*
Author to whom correspondence should be addressed.
Water 2025, 17(21), 3133; https://doi.org/10.3390/w17213133 (registering DOI)
Submission received: 18 September 2025 / Revised: 26 October 2025 / Accepted: 29 October 2025 / Published: 31 October 2025
(This article belongs to the Special Issue Dissolved Organic Matter in Aquatic Environments)

Abstract

UV-Visible spectroscopy provides qualitative and quantitative information on colored dissolved organic matter (CDOM) that can be used as a proxy for dissolved organic carbon (DOC). We developed an absorbance-based linear model of DOC for the San Sebastian River estuary in NE Florida. We compared linear and mixed models, with and without salinity as an additional fixed effect. All models exhibited strong correlations (R2 = 0.88–0.97) with measured DOC values for the training dataset. The model with the strongest performance on the testing dataset was a linear model containing the absorption coefficient at 254 nm, the spectral slope at 275–295 nm, and salinity. The range of measured DOC was 0.5 to 52.3 mg/L, and the model was able to predict DOC concentrations for an independent testing dataset with a relative mean absolute error of 17%. Incubation experiments indicated that aging and photolysis altered absorption coefficients and spectral slopes, which negatively affected the model performance, particularly for photolysis. However, predicted DOC was still well-correlated (R2 > 0.9) with measured DOC, even for photolyzed samples. Spectral slope ratios indicate that DOM in the San Sebastian River is mainly terrigenous, and that hydrologic variability, possibly associated with freshwater inflow from rainfall, influences DOC/CDOM concentration and composition.

1. Introduction

Inputs of dissolved organic matter (DOM) from the coastal zone contribute an estimated 4.4 ± 1.0 Pg C yr −1 to 27.0 ± 1.8 Pg C yr −1 to the ocean [1]. This amount represents an annual contribution of carbon equivalent to approximately 10–60% of the dissolved organic carbon (DOC) content of the surface ocean, thus representing a substantial exchange of matter and energy between terrestrial and marine systems [2]. This complex mixture profoundly influences coastal ecosystems in several ways. For example, DOM chelates dissolved metals, which influences micronutrient availability and metal toxicity [3,4,5]. It also stimulates microbial respiration and shapes bacterial community composition [6]. Although it was once considered a largely refractory material [2], DOM bioavailability averages 16% globally, varying by nutrient content, source, and physical conditions in the watershed [2,3]. It is also photochemically active and can produce reactive oxygen species, inorganic nutrients, and CO2 upon photolysis [7,8,9]. Many functional groups commonly found in DOM molecules absorb light in the ultraviolet (UV) and visible (VIS) spectrum [10]; this material is known as colored dissolved organic matter (CDOM). Terrigenous CDOM is of particular interest because it contains substances that absorb light in photosynthetically active wavelength ranges [10,11,12]. Fluxes of terrestrial CDOM to the coastal ocean can therefore influence rates of primary productivity, photic zone depth, and the distribution of benthic primary producers like seagrasses [13,14,15]. CDOM therefore plays a dynamic role in coastal biogeochemistry, both affecting and being affected by the chemical and biological processes in the system.
Despite the many ways DOM influences ecosystem function, carbon cycling, and water quality, routine monitoring of this parameter is rare, likely due to the difficulty of direct measurements. As a complex mixture of organic molecules, DOM is typically quantified as DOC through oxidation to CO2 [16]. Although the methods are well-established, they are costly, time-consuming, and destroy the sample. An alternative approach is to estimate CDOM through optical characteristics such as absorbance or fluorescence. Once the relationship between CDOM and DOC is established, optical characteristics can be used as a proxy measurement [17]. In this study, we use the term DOC to refer to quantifiable concentrations (either directly measured or modeled), we use the term DOM when discussing qualitative aspects (like composition), and we use CDOM to refer specifically to the light-absorbing portion of DOM. Absorbance measurements generate no chemical waste and require no consumable materials, facilitating greater sampling resolution and larger datasets that are helpful in parsing complex processes. Furthermore, calculated metrics from the absorbance spectrum also provide broad indicators of DOM composition and/or processing [10,18,19,20]. For example, spectral slope (S) is the exponential decrease in absorbance with increasing wavelength, and is inversely correlated with molecular weight [21,22]. This and other calculated parameters can be employed to characterize sources, though it is important to consider the system-specific context and the connectivity between systems [10,23].
Absorbance-based models of DOC are powerful tools for studying coastal systems, especially when applied to large-scale remote sensing data [24,25,26]. However, the models are not universal. Because each system contains a unique combination of organic matter sources, models for a given place must be calibrated through paired absorbance and direct DOC measurements [27]. A variety of different model types have been published for freshwater, marine, and stormwater systems [18,25,27,28,29,30]. Estuarine systems are particularly difficult to characterize due to the mixture of organic matter sources, transitions in salinity and pH, and complex physical mixing [27,31]. However, several studies have successfully used CDOM-based models in estuarine waters [24,25,26,27,32].
In the current study, we used a year-long dataset of absorbance and DOC in the San Sebastian River, Northeast Florida, to calibrate a model of DOC for this estuary. Rapid human population growth in this region, plus indications of eutrophication and harmful algae blooms, has created a strong need to understand factors affecting water quality [33,34,35]. However, DOC measurements are not commonly performed in surface water quality monitoring [13]. CDOM-based models would help address this gap, but to our knowledge, there have been no such models developed for rivers on Florida’s east coast, though CDOM is reported to be a key component of riverine light attenuation [36]. Our dataset was used to develop a linear model of DOC that employs an absorption coefficient, spectral slope, and salinity. We validate the model with an independent dataset, plus assess the effects of aging and photolysis on model predictions. We also discuss the seasonal and hydrological influences on spatial and temporal trends in DOC concentration and composition.

2. Materials and Methods

2.1. Site Description

The San Sebastian River is part of the Guana estuary system, which is classified as a well-mixed, bar-built estuary [37]. The hydrology of the area is complex due to the confluence of the San Sebastian with the Matanzas and Tolomato Rivers and the St. Augustine Inlet (Figure 1). The San Sebastian drains an area of 63 km2, which includes urban and suburban areas of St. Augustine, as well as extensive swamp and bottomland forest areas in the northern part of the watershed (Figure 1). Along the river itself, there are abundant oysters (Crassostrea virginica) and fringing salt marshes (Sporobolus alterniflorus) mixed with black mangroves (Avicennia germinans) [37,38]. Mean annual discharge for 1999–2003 averaged 9.08 m3/s [39], and residence time is reported to be 5.3 days [38].
Three of our sampling sites (Nix, King, and SR-16) are located along the main stem of the river, and three sites (Oyster, Lewis, and Red House Branch) are located at the lower ends of tributary creeks (Figure 1). All sites experience semi-diurnal tides. Oyster is located on Oyster Creek, which is approximately 1.5 km long and drains an urban/suburban area of West St. Augustine. The Lewis site is located at the extreme upper end of the San Sebastian River in an area of tidal creeks, mud flats, and fringing marsh. Its tidal creek extends 0.4 km upstream of the sampling point and drains an extensive area of intermittent swamp and marsh, with small amounts of residential and commercial development. Red House Branch is located on the creek of the same name, which extends 2.5 km upstream of the sampling point and drains an area with suburban residential neighborhoods. Red House Branch is hydrologically connected to natural ponds, stormwater detention ponds, and extensive wetlands.

2.2. Materials

All glassware, plasticware and membrane filters that contacted sample water were rinsed 3 times with deionized water, soaked overnight in 10% HCl, and rinsed 5 times with deionized water (Ω > 18.5 µS/cm). Glassware and glass fiber filters were combusted at 450 °C for 4 h. Immediately before sample collection, all sampling containers were rinsed three times with ambient surface water.

2.3. Sample Collection for Paired Absorbance-DOC Measurements

Water samples were collected approximately monthly from all six sites from October 2023 to October 2024 to create the training dataset. A separate testing sample set was generated by collecting samples opportunistically between March 2024 and April 2025, with all test samples separated in time from training samples by a minimum of 10 d. The test samples were collected and processed in the same way as the training samples. All six sites and all four seasons are represented in the testing dataset, but not every site was sampled at every collection, as was performed for the training sample set.
Surface water was retrieved using a high-density polyethylene (HDPE) bucket, and a 60 mL syringe was used to remove aliquots of water from the bucket. The sample was immediately filtered using a pre-combusted Whatman GF/F filter (nominal pore size 0.7 µm; Whatman plc, Thermo Fisher Scientific, Waltham, MA, USA) in a syringe filter holder. The first 5 mL of filtrate were discarded, and the subsequent 40 mL were filtered into a glass scintillation vial. The sample vials were placed in a cooler and kept at near ambient water temperatures during transport to the lab, which took less than one hour. UV-VIS absorbance and salinity were measured within 2 h, and the remaining sample was acidified and stored at 4 °C for DOC analysis.

2.4. Incubation Experiments

As DOM traverses the estuary, it undergoes a number of processes that could alter optical parameters that affect the model performance, including mixing with saltwater, biotic/abiotic degradation processes, and photochemical reactions. We performed experiments to evaluate these effects using water from tributary sites, due to their higher DOM concentrations (Table 1). Large volume (3.5 L) samples of water were collected with a high-density polyethylene (HDPE) bucket and transported back to the lab in HDPE jugs.

2.4.1. Photochemical Experiments

Experiments to evaluate photolability were conducted in natural sunlight under conditions of sunny to partly cloudy weather. Water samples were filtered with mixed cellulose ester (MCE) membrane filters (0.2 µm pore size; Whatman plc, Thermo Fisher Scientific, Waltham, MA, USA). Aliquots were removed for initial UV-VIS absorbance measurements and preserved for DOC analysis. The remainder of the filtered water was used to fill round-bottom flasks. The light treatment flasks were made of quartz, with ground-glass stoppers that were secured with electrical tape. The dark flasks were made of glass. They were similarly stoppered and sealed, then wrapped in a double layer of heavy-duty aluminum foil. All the flasks were then zip-tied to a floating rack, which was tied to a dock near the King site (Figure 1a). The flasks were positioned on their sides so that the round portion of the flask was at the water’s surface, and the glass stoppers and electrical tape were not blocking the sunlight. The flasks were exposed to natural sunlight for 48 h and then retrieved. UV-VIS absorbance was analyzed immediately after collection, and samples for DOC were acidified and stored at 4 °C.

2.4.2. Aging Experiments

Water from tributary sites was filtered with 0.2 µm MCE membrane filters. An unfiltered sample of water was collected from Nix (the most downstream site) to provide a sample of the coastal microbial consortium. Artificial seawater (ASW) was prepared and diluted as needed to equal the salinity of the Nix site [40]. The ASW was boiled for 15 min while covered with combusted aluminum foil, then cooled to room temperature. The filtered water from the tributary sites was then mixed in a 4:1 ratio with either unfiltered Nix water (Inoculate treatment) or artificial seawater (ASW treatment). We dispensed 200 mL portions of each mixture into each of the glass bottles. The bottle openings were not sealed but were covered with combusted aluminum foil to prevent contamination from dust while allowing gas exchange. Approximately 30 min after mixing, 50 mL samples were removed and filtered with 0.2 µm nylon syringe filters (LabZhang, Amazon, Seattle, WA, USA). The first 5 mL were discarded, and the remainder was used for initial measurements of UV-VIS absorbance, salinity, and DOC. UV-VIS and salinity measurements were performed on the same day. Samples for DOC were acidified and stored at 4 °C until analysis. The bottles were then stored in the dark at room temperature for 20 d, when final samples were collected and filtered in the same way.

2.5. Sample Analysis

To measure UV-VIS absorbance, samples were first equilibrated to room temperature. Absorbance was measured between 240 and 800 nm (2 nm interval) on a Gensys 180 dual beam UV-VIS spectrophotometer (Gensys, Thermo Fisher Scientific, Waltham, MA, USA), using a 1 cm quartz cuvette. Samples with absorbance higher than 0.03 were diluted and rerun to check for linearity. Salinity was measured using a refractometer. DOC analysis was performed at the University of Florida Whitney Lab using EPA method SM 5310 B-00. The analysis was performed via high temperature combustion using a Shimadzu TOC-L Total Organic Carbon analyzer (Colombia, MD, USA) [41].

2.6. Data Analysis

Because discharge data were unavailable for the study period, salinity data were used to provide context on freshwater inflow [42]. Salinity data from the mouth of the San Sebastian River (29.86885° N, 81.30743° W) were downloaded from the National Oceanographic and Atmospheric Administration National Estuarine Research Reserve System-Wide Monitoring Program database [43], and a rolling mean was used to calculate daily salinity averages. Monthly rainfall data from the water treatment plant in St. Augustine, FL and were accessed from the Florida Climate Center [44]. UV-VIS data were processed using ASFit version 1.0.0.7, which is a free, open-source software tool [45]. ASFit performed baseline corrections using the average absorbance from 750 to 800 nm; calculated Naperian absorption coefficients ( a λ) at 254, 280, 325, 355, and 440 nm (Equation (1), where L is the optical pathlength, 0.01 m and Aλ is the measured absorbance at a specific wavelength, λ); calculated spectral slope coefficients (Sλ) using the non-log-linearized approach (Equation (2)) for the wavelength ranges 275–295 nm (S275–295) and 350–400 nm (S350–400); and spectral slope ratio SR (Equation (3)). Specific UV absorbance at 254 nm (SUVA254) was also calculated (Equation (4)). These calculations and their applications are reviewed extensively elsewhere [18].
a λ = 2.303 A λ L
a λ = a λ 0 ·   e S ( λ λ 0 )
S R = S 275 295 / S 350 400
S U V A 254 = A 254 / ( D O C L )
The data were analyzed in R version 4.4.0 to explore relationships between variables and generate predictive models for comparison. Correlations between salinity and DOC, a 254 , S275–295, and SUVA254 were evaluated with a Pearson correlation test. In cases where the data were not normally distributed, the significance of the relationship was determined using Spearman’s rank correlation. For model development, the potential independent variables for the “Absorbance” model included the absorption coefficients, spectral slopes, and spectral slope ratio derived from the ASFit output. Many of these have been used previously to estimate DOC [18]. The “Comprehensive” model included all of these variables, plus salinity. We first scaled the potential independent variables by z-score, and then conducted bidirectional stepwise linear regression of the DOC concentrations against the scaled independent variables [46]. The analysis was performed using the stepAIC() function in the MASS package in R, which starts from a null model and adds/removes terms based on Akaike’s Information Criterion (AIC). We calculated the Variance Inflation Factor (VIF) to check for collinearity and removed terms with a VIF greater than 5. After this procedure identified the most parsimonious linear models (called Comprehensive Linear and Absorbance Linear), we used the identified terms as fixed effects in two linear mixed-effect models with random intercepts for site and date. These models are called Comprehensive Mixed and Absorbance Mixed. Finally, to obtain model coefficients that could be directly applied to unscaled data, we reran the four models with unscaled predictor variables. Normality of residuals was assessed by Q-Q plots and the Shapiro–Wilk test.
We compared the model fits of the training data using the AIC value from the final unscaled models. The performance on the testing data was primarily evaluated using the root mean squared error (RMSE) of the calculated versus measured DOC. The coefficient of determination (R2) and mean absolute error (MAE) for the regression against measured DOC were also calculated for the testing dataset. Relative MAE (rMAE) was then calculated as the MAE divided by mean DOC concentration and expressed as a percentage. Predicted DOC for the testing data was calculated based on fixed effects only. This was performed to assess performance when random intercepts associated with specific sites and/or dates are unknown.
The effects of aging and photochemical alteration on model terms were evaluated in incubation experiments. For each parameter, the percent change during the experiments was calculated in order to create a common scale for variables with different absolute values. For example,
ΔDOC = 100% × (DOCfinal − DOCinitial)/DOCinitial
The percent change values were then analyzed using an ANOVA with treatment, site, and date as factors, with interactions between treatment and site plus treatment and date. Normality of residuals was evaluated with a Q-Q plot and a Shapiro–Wilk test. To test how the alterations from photolysis and aging affected model performance, a second set of test samples was generated by using one replicate each of initial and final samples from each treatment group in the aging and photochemical experiments. Model evaluation on this second test dataset was performed in the same way as in the primary testing dataset.
Generative artificial intelligence platforms Elicit and ChatGPT-5 were used to help identify relevant sources in the literature review. ChatGPT-5 was also used to generate and troubleshoot R code and to revise the manuscript for conciseness and flow.

3. Results

3.1. DOC Concentrations and DOM Composition

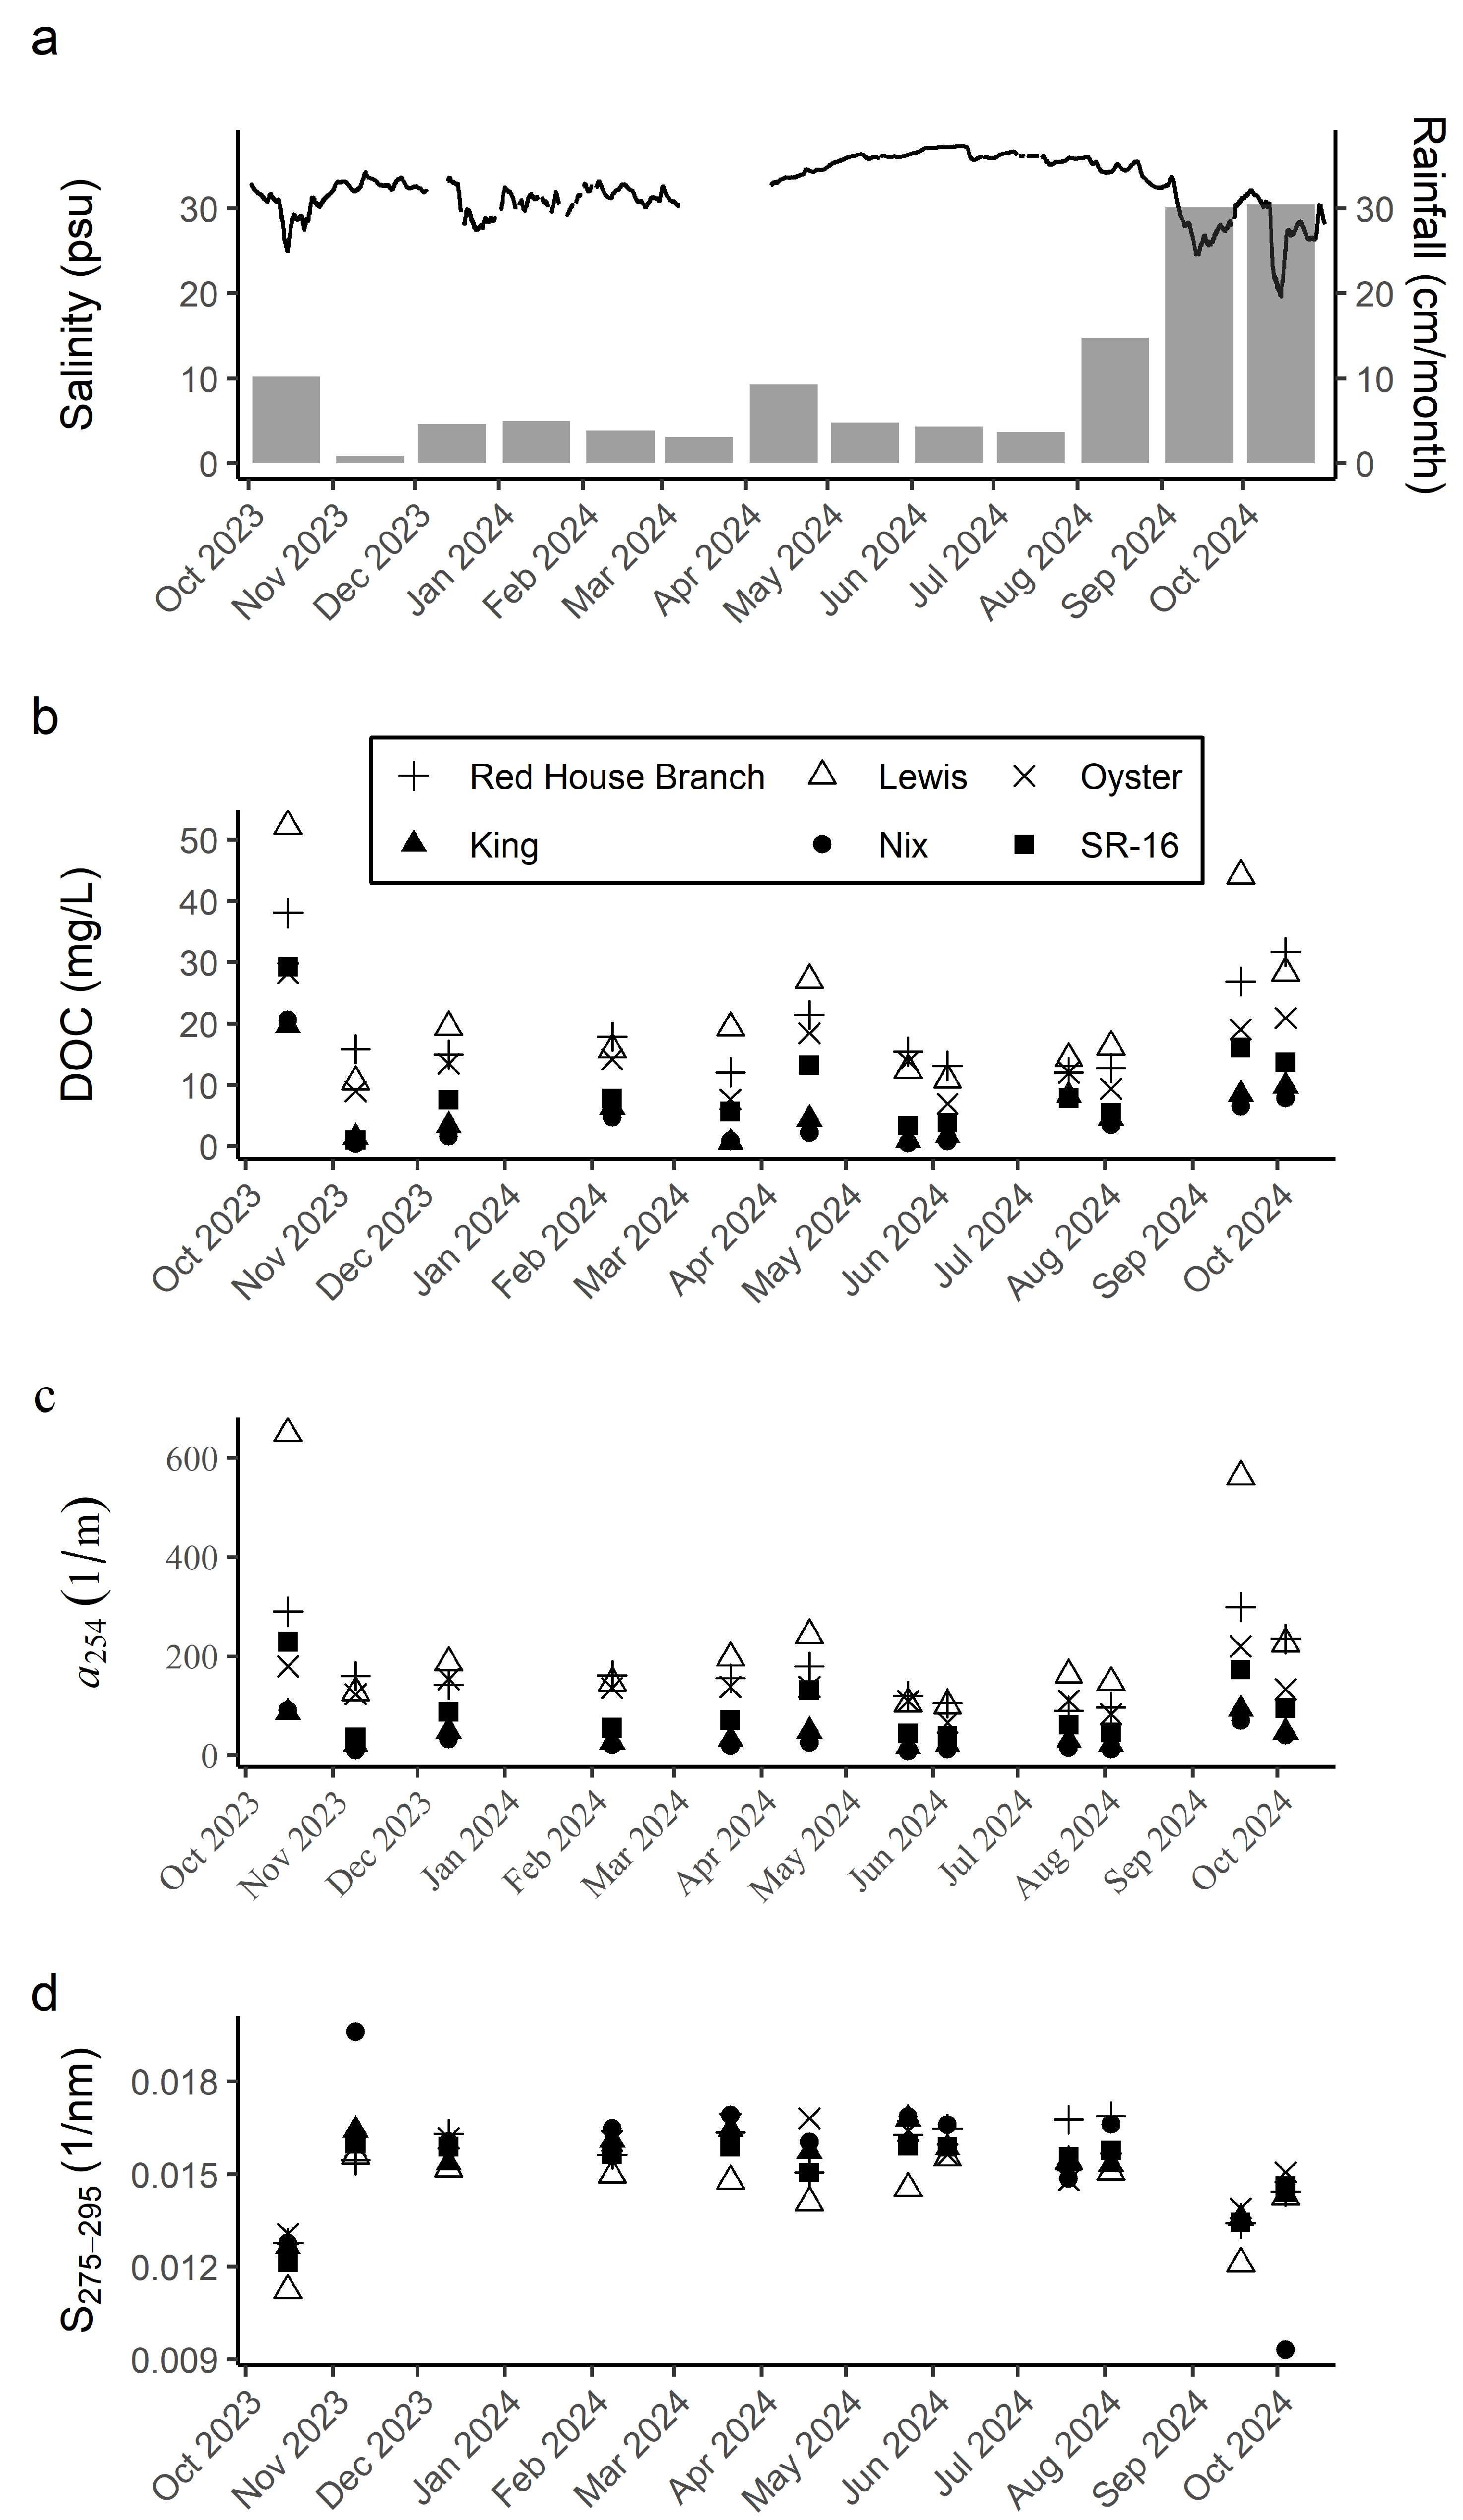
Mean values for the combined training and testing dataset are shown in Table 2. Relative standard deviation of sample splits was less than 1% for a 254 and S275–295, and less than 2% for DOC. DOC concentrations in the San Sebastian River ranged from 0.5 to 52.3 mg/L, with higher concentrations in the upstream/tributary sites (Figure 2). In general, tributary sites also exhibited lower S275–295 and higher a 254. October 2023 and September/October 2024 had heavy rainfall, with notably lower salinity and higher DOC concentrations. Correlations with salinity were significant for DOC (p < 0.001), a 254 (p < 0.001), and S275–295 (p = 0.048). These are shown in Figure 3. SUVA254 was not correlated with salinity (p = 0.238). SR values exhibited lower values and less intersite variability during months with heavy rainfall (Figure S1).

3.2. DOC Models

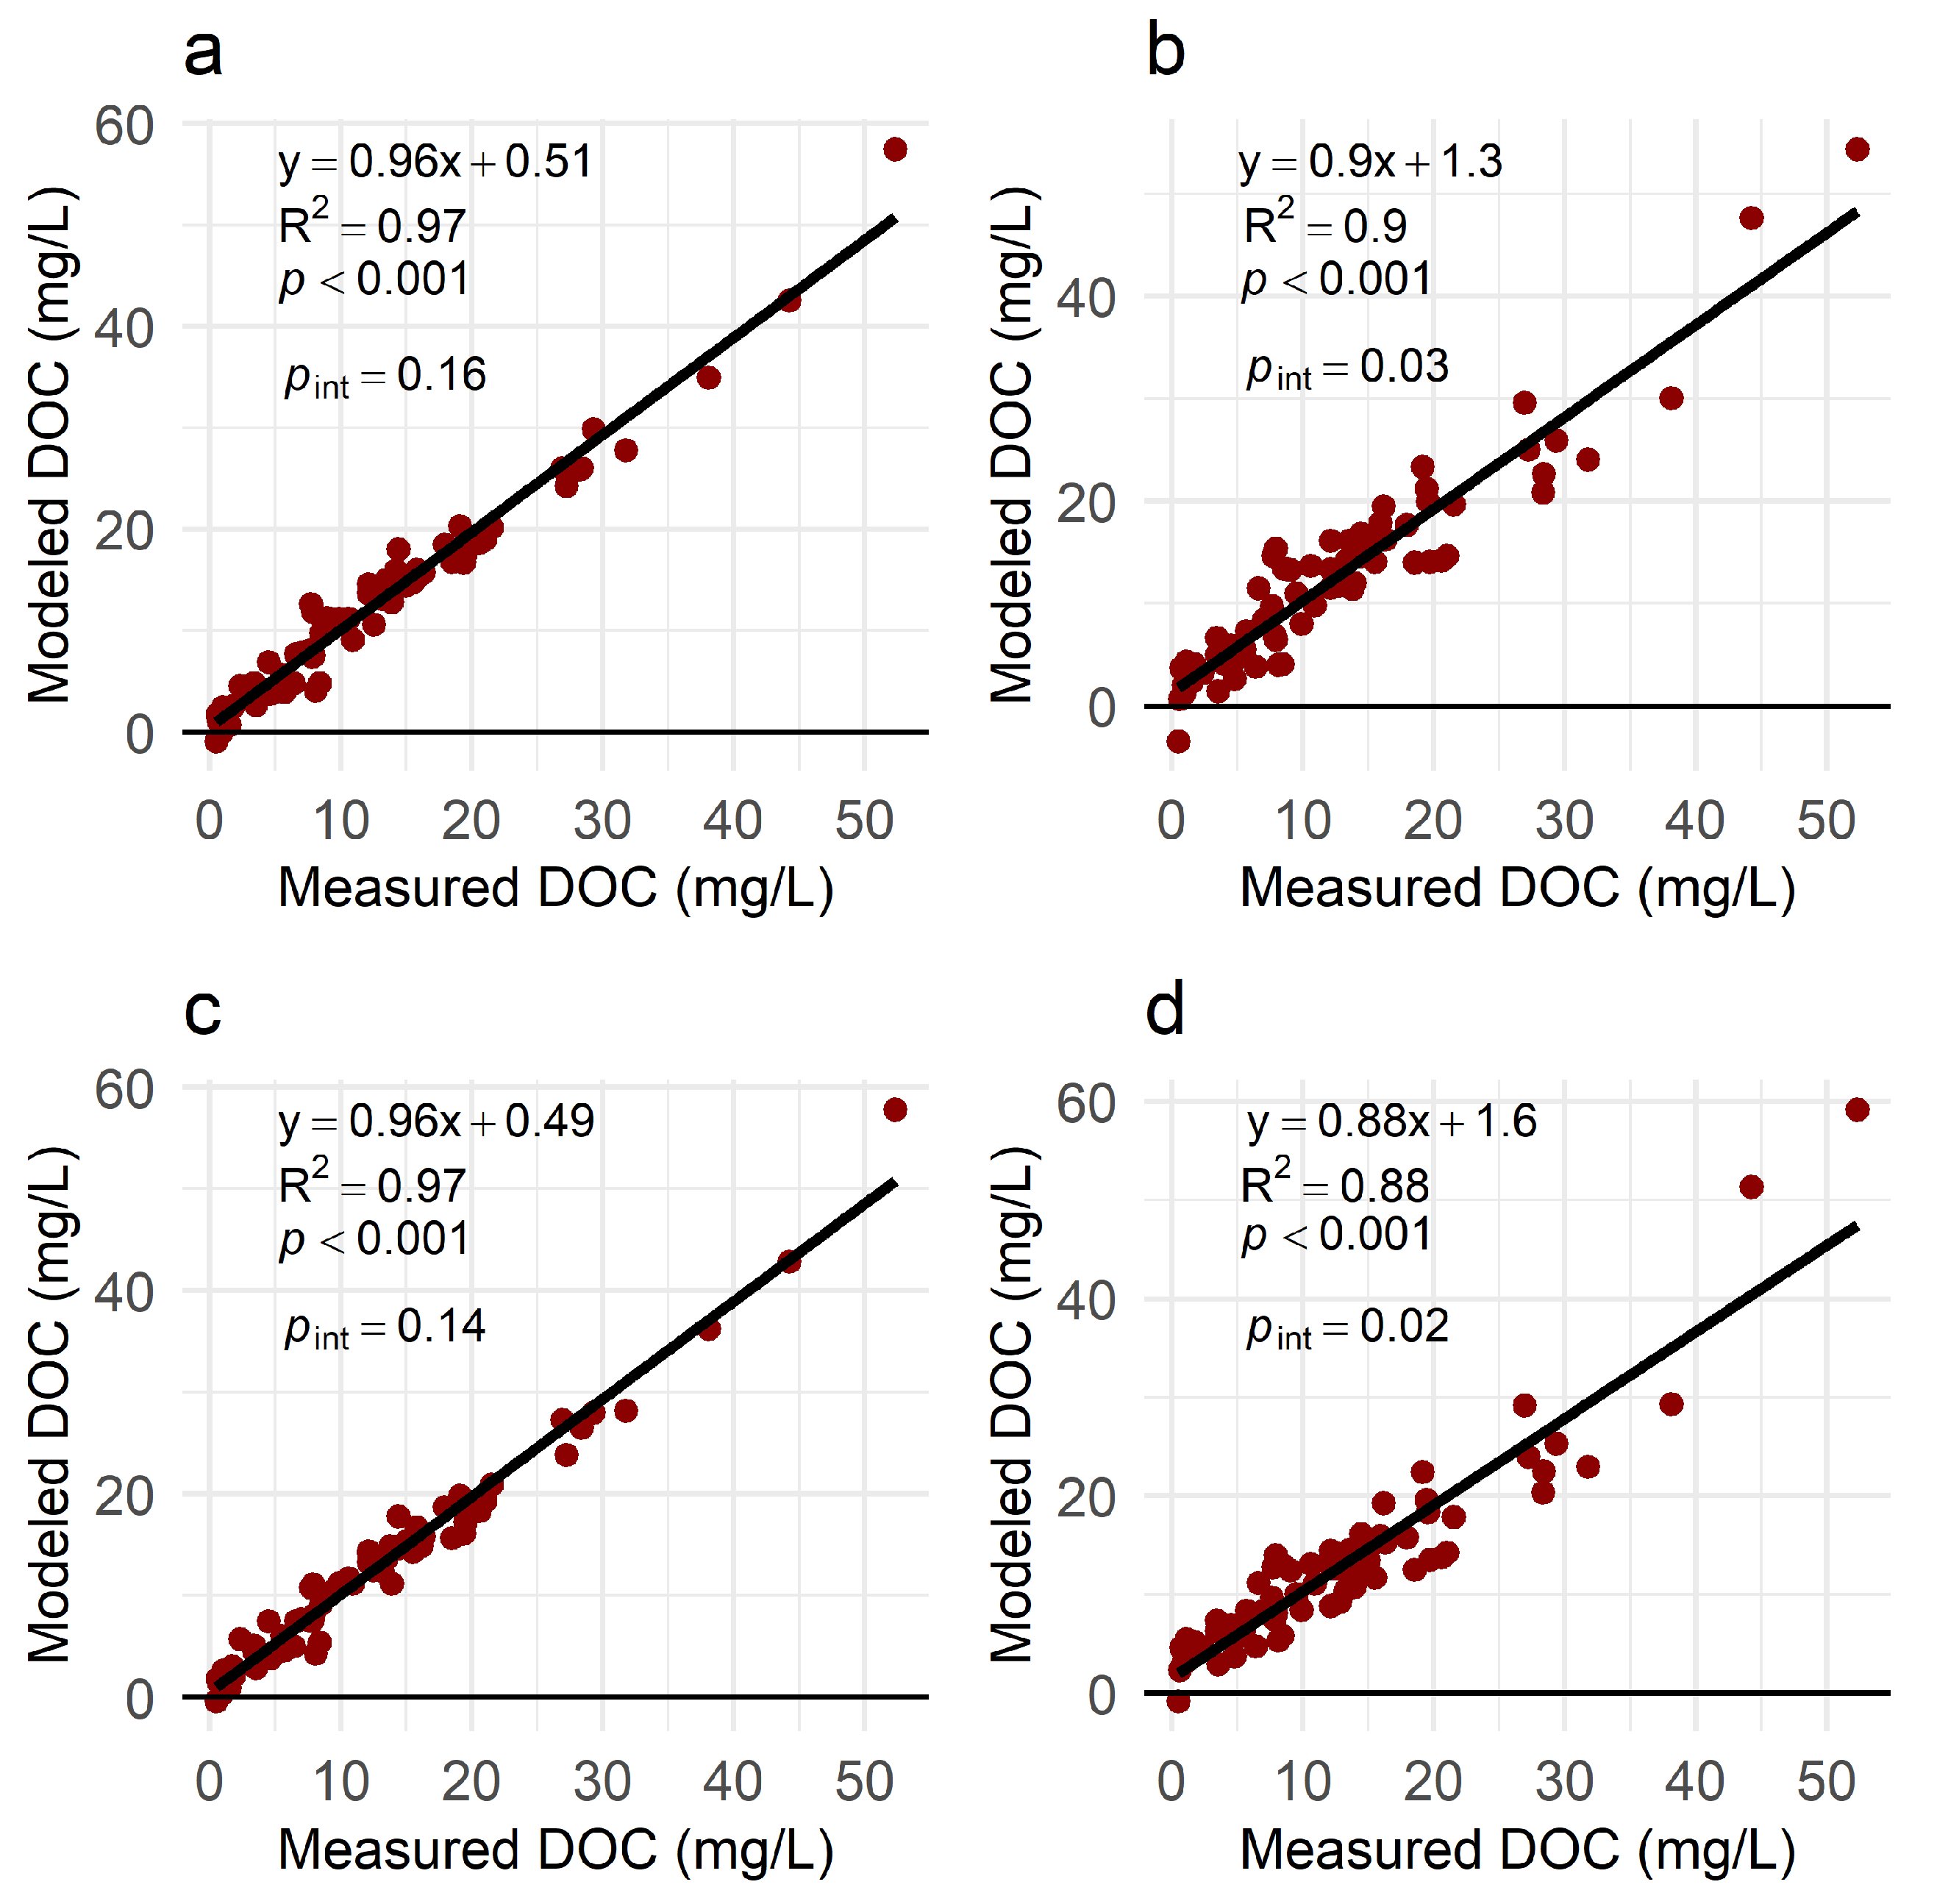
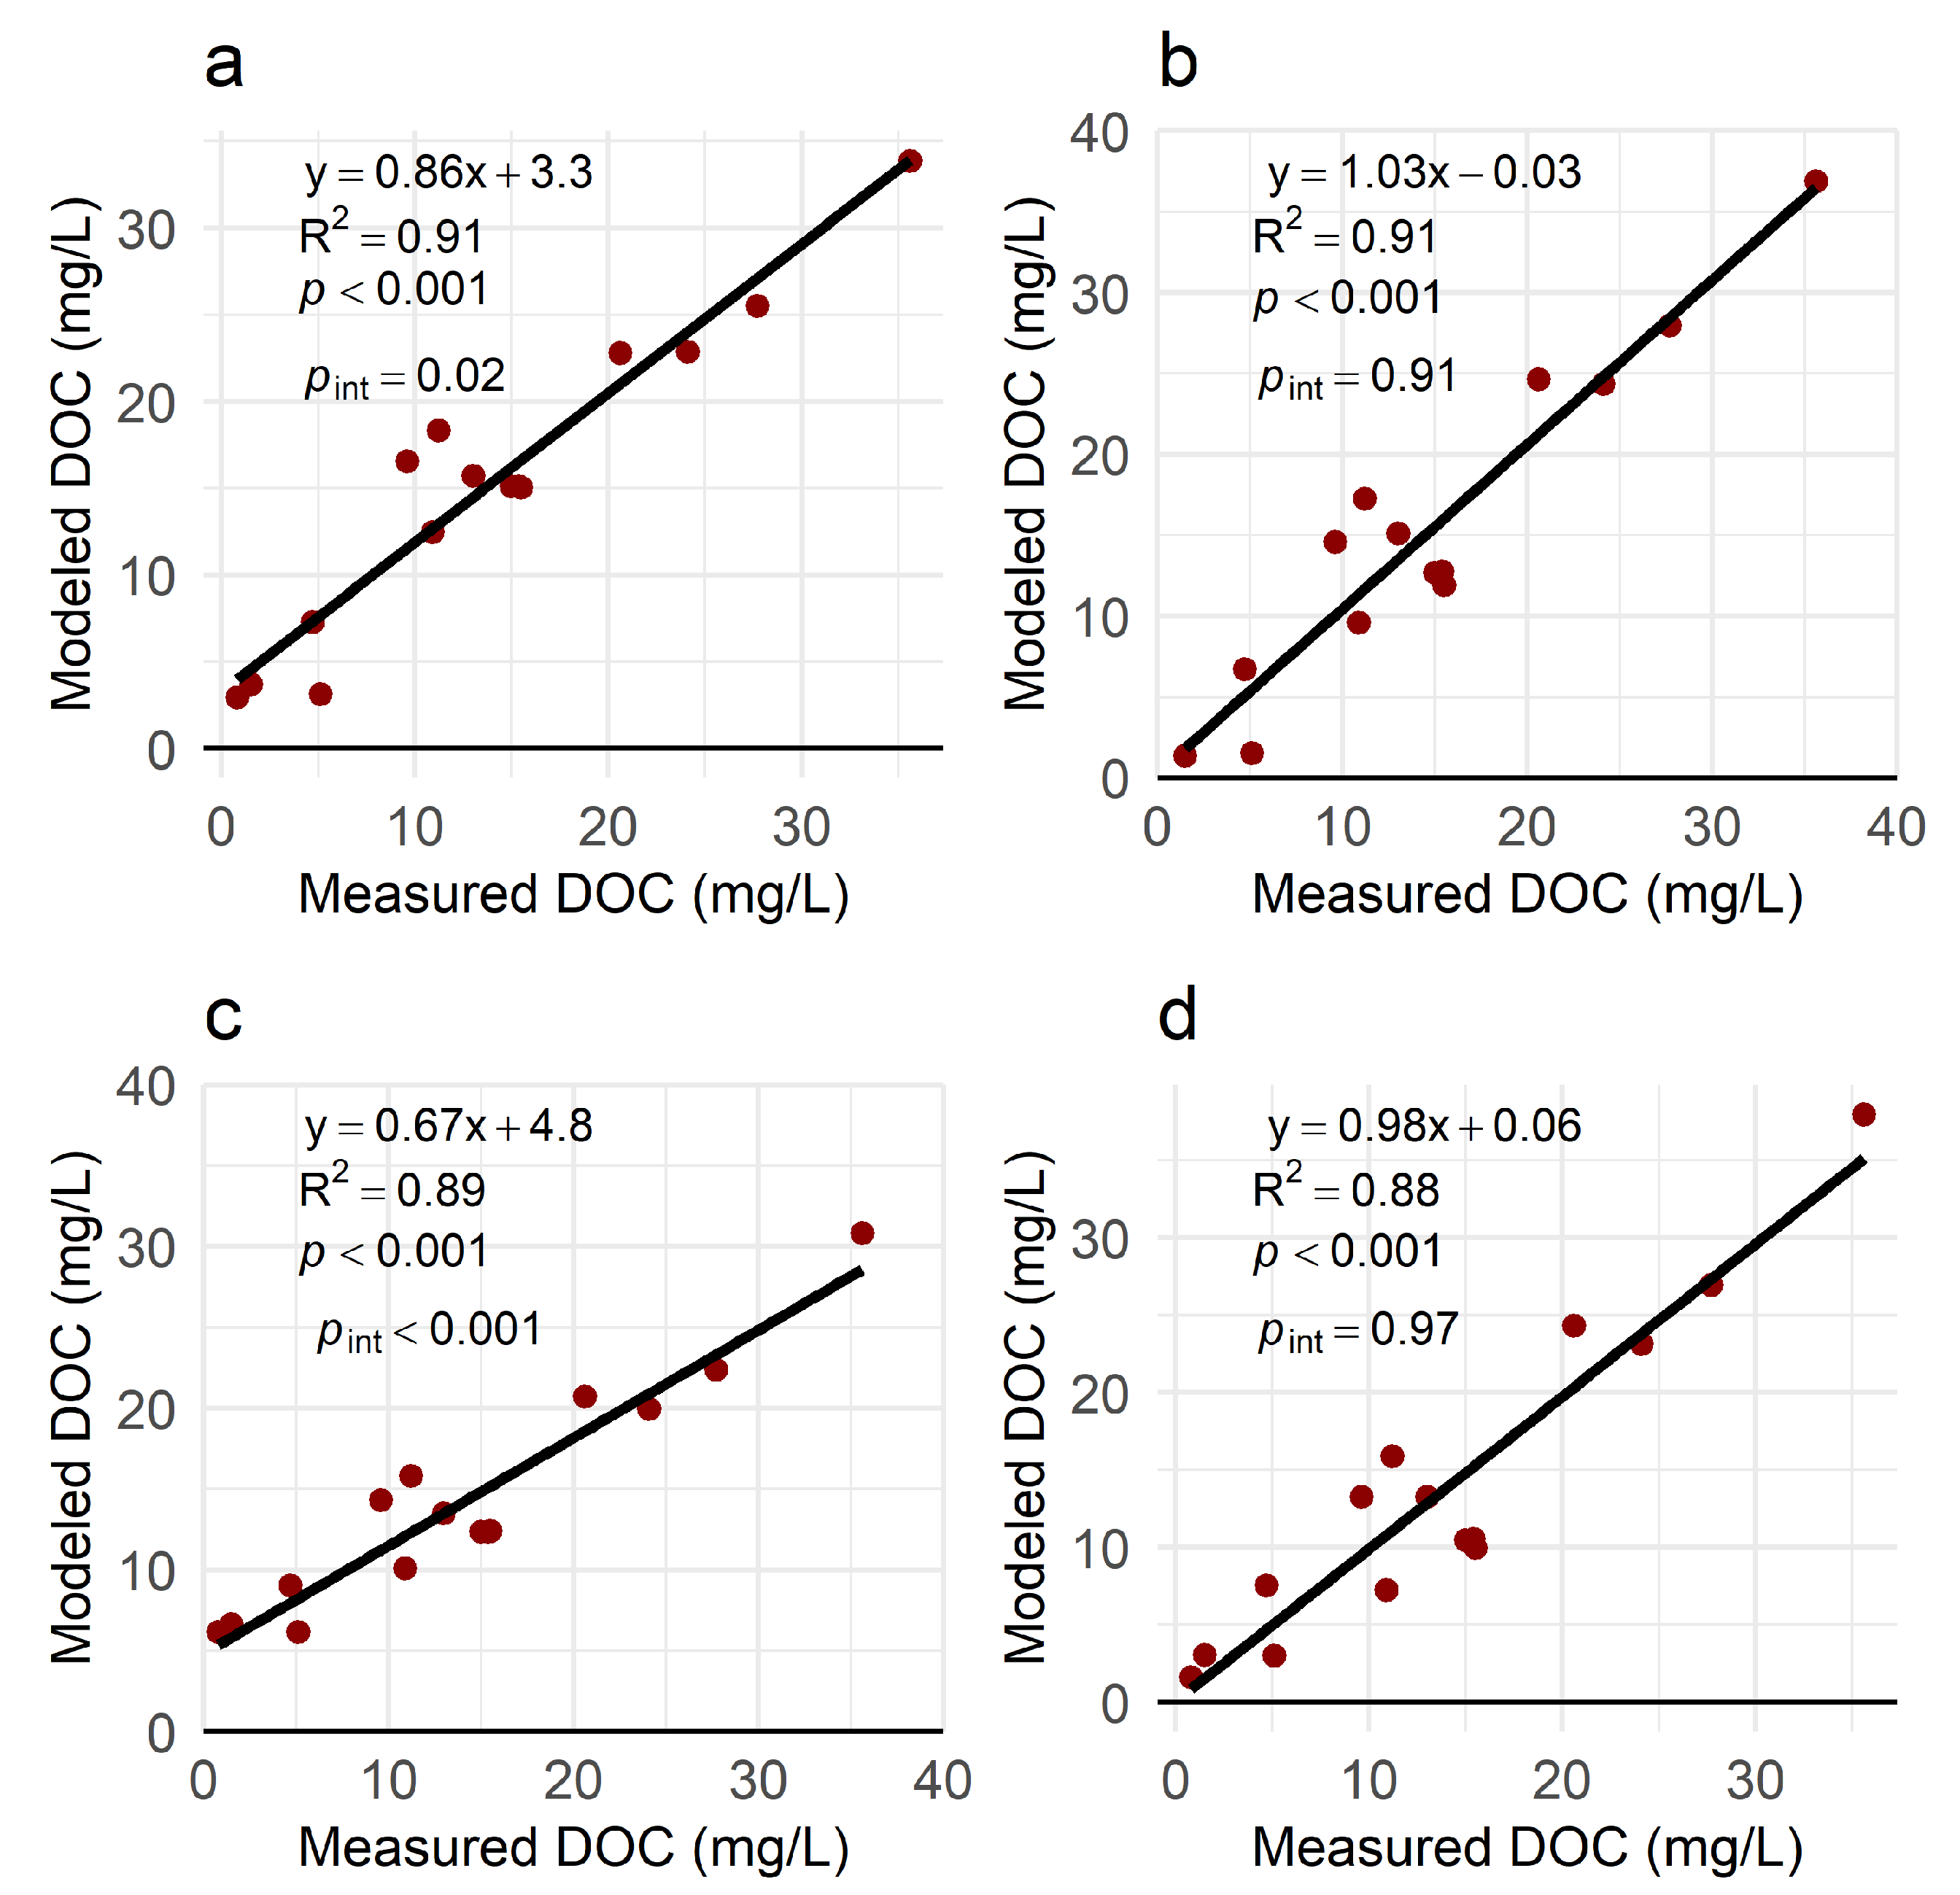
The bidirectional stepwise linear regression of the training dataset converged on a model with S275–295 and a 254 as the predictors for the Absorbance model. For the Comprehensive model, S275–295, a 254 , and salinity were selected as predictors (Table 3). In the Comprehensive Mixed model, the random intercepts for site were zero and were therefore removed. Regression of measured versus modeled DOC yielded p-values of <0.001 for all models, for both training (n = 72) and testing (n = 15) datasets. For the training dataset, the Comprehensive Mixed model exhibited the lowest AIC, as well as a slope closer to 1 and a non-significant intercept in the regression of predicted versus measured DOC (Figure 4). However, on the testing dataset, the Comprehensive Linear model had the lowest RMSE, a slope closer to 1 and smaller, non-significant intercepts in the regression of predicted versus measured DOC values (Figure 5). Therefore, the Comprehensive Linear model was used for subsequent calculations of predicted DOC for pre- and post-incubation samples.

3.3. Incubation Experiments

Photochemical Experiments

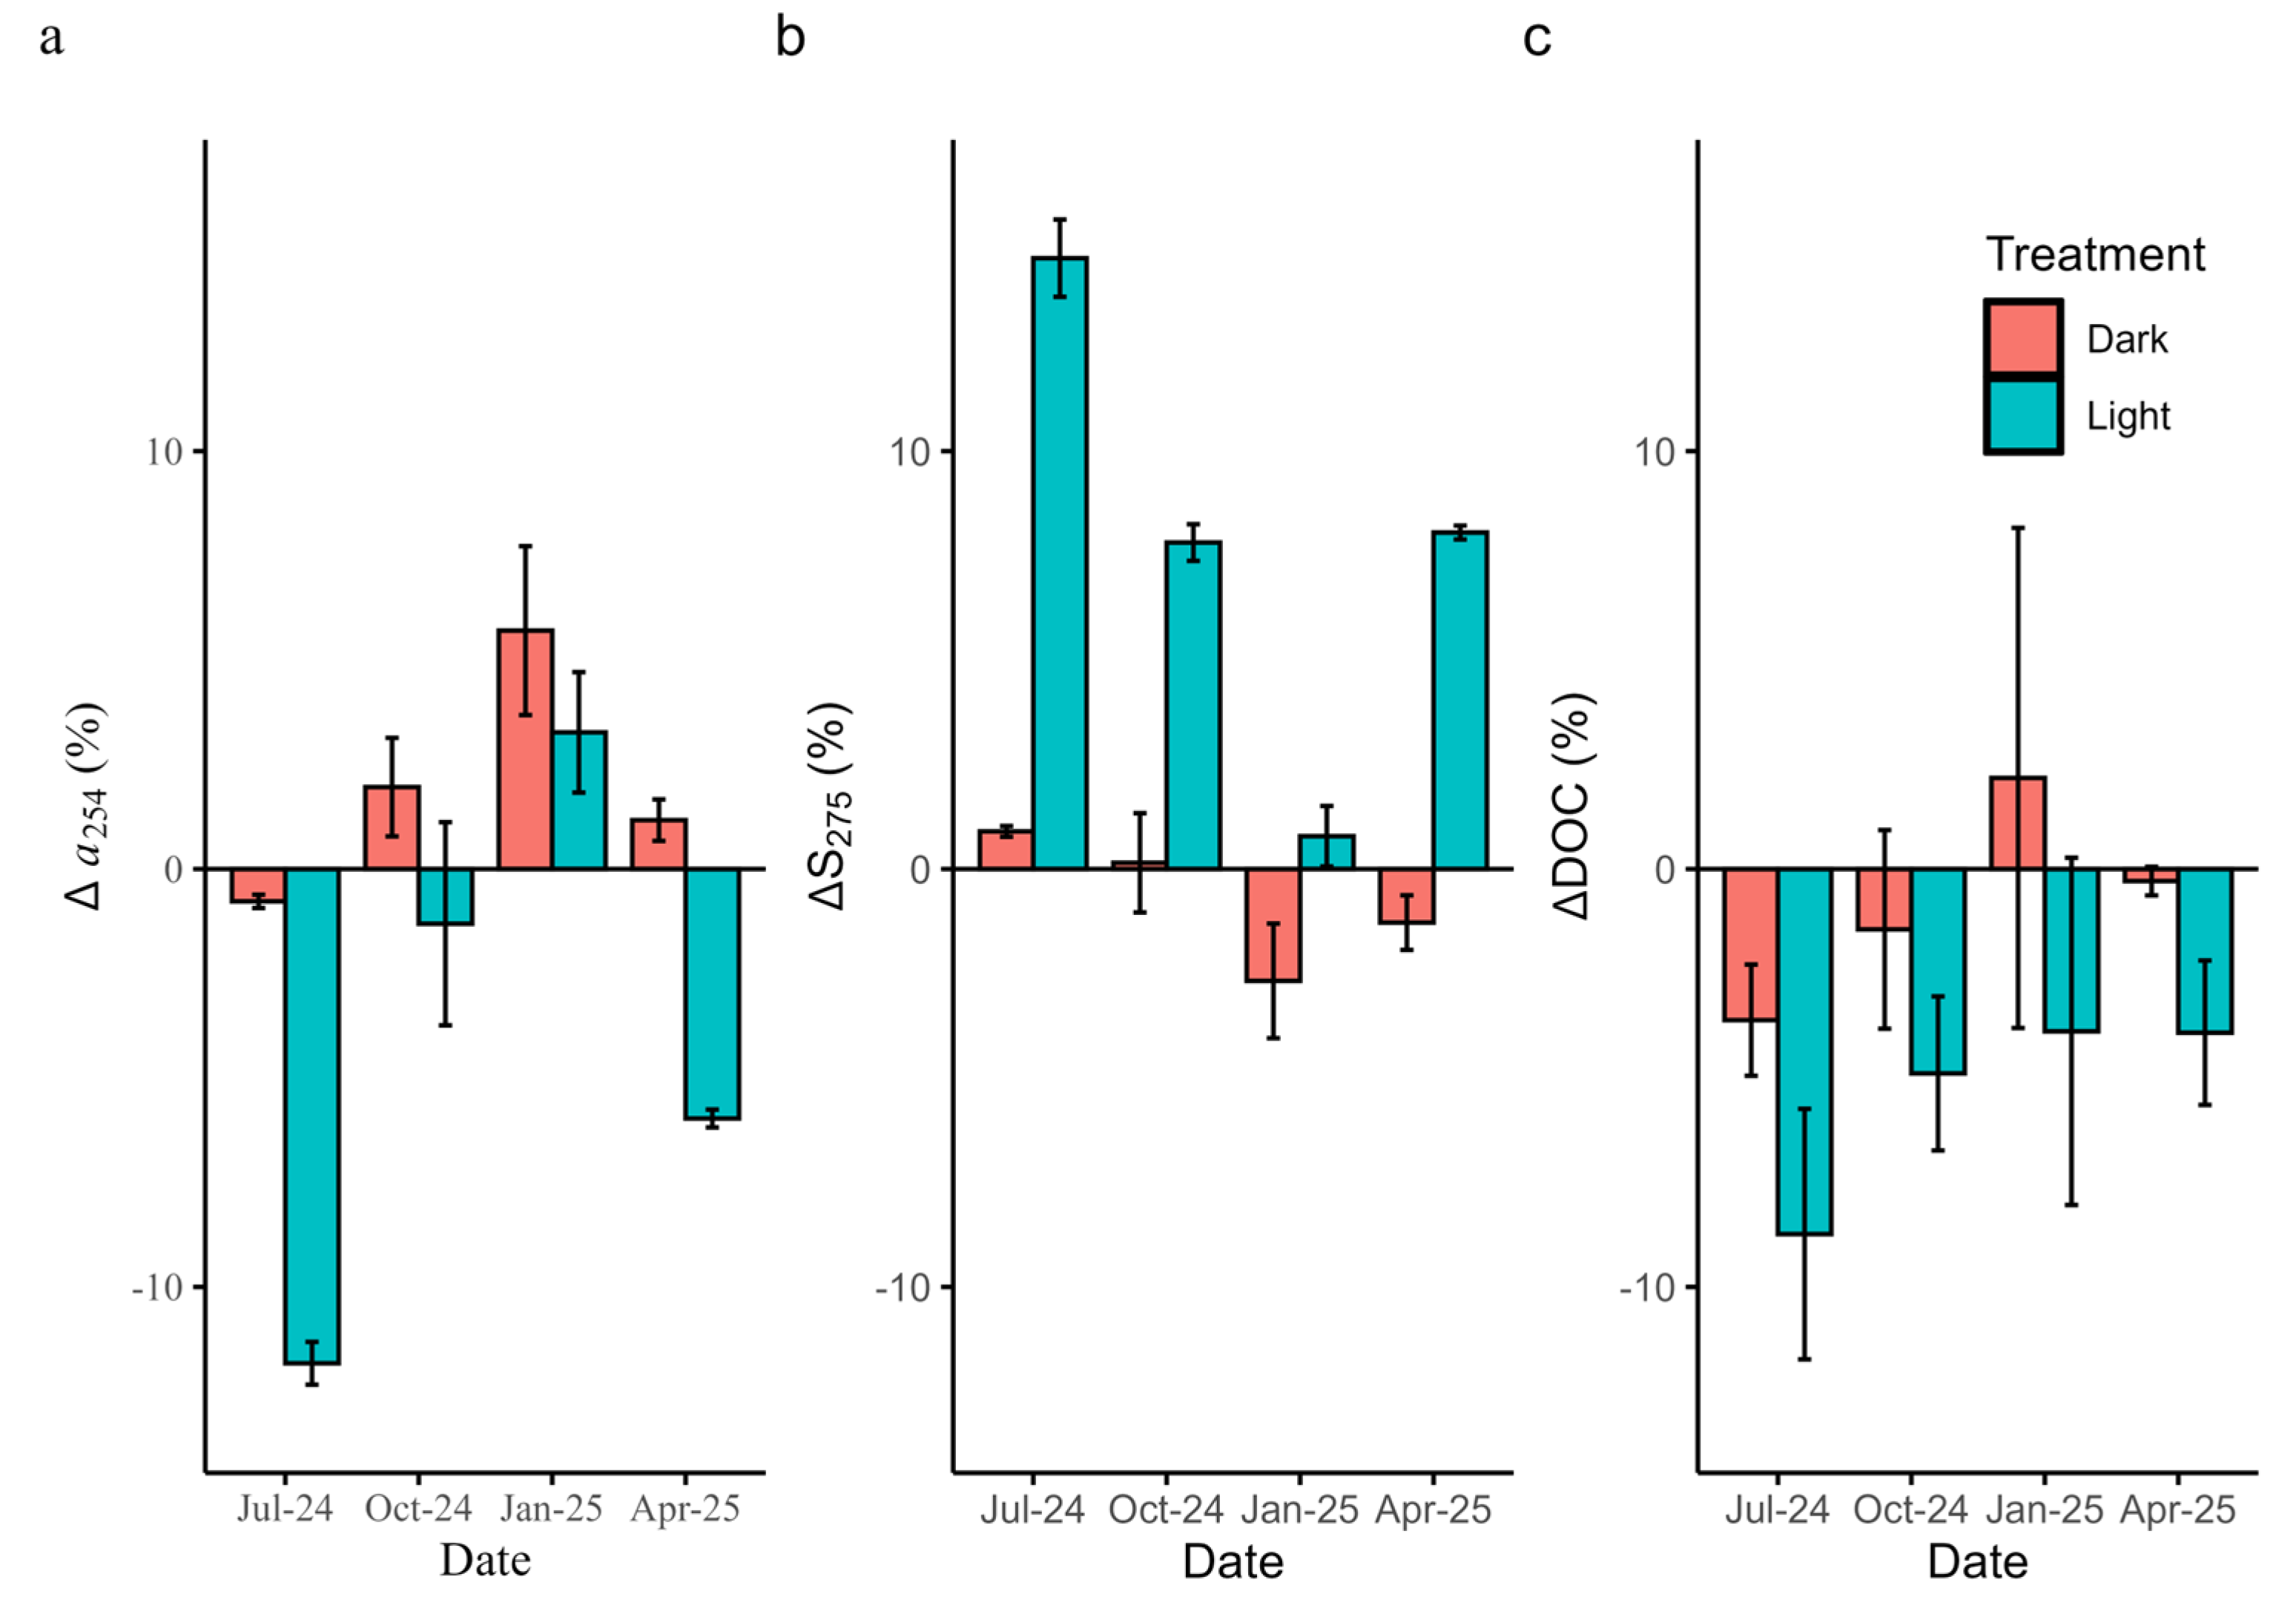
Changes in model predictors and DOC over the course of the photochemical degradation experiment are shown in Figure 6, and the results of the ANOVA regression are in Table 4. For ∆ a 254 and ∆S275–295, treatment, date, and the interaction between treatment and date were significant factors. For ∆DOC, treatment, date, and site were significant factors.

3.4. Aging Experiments

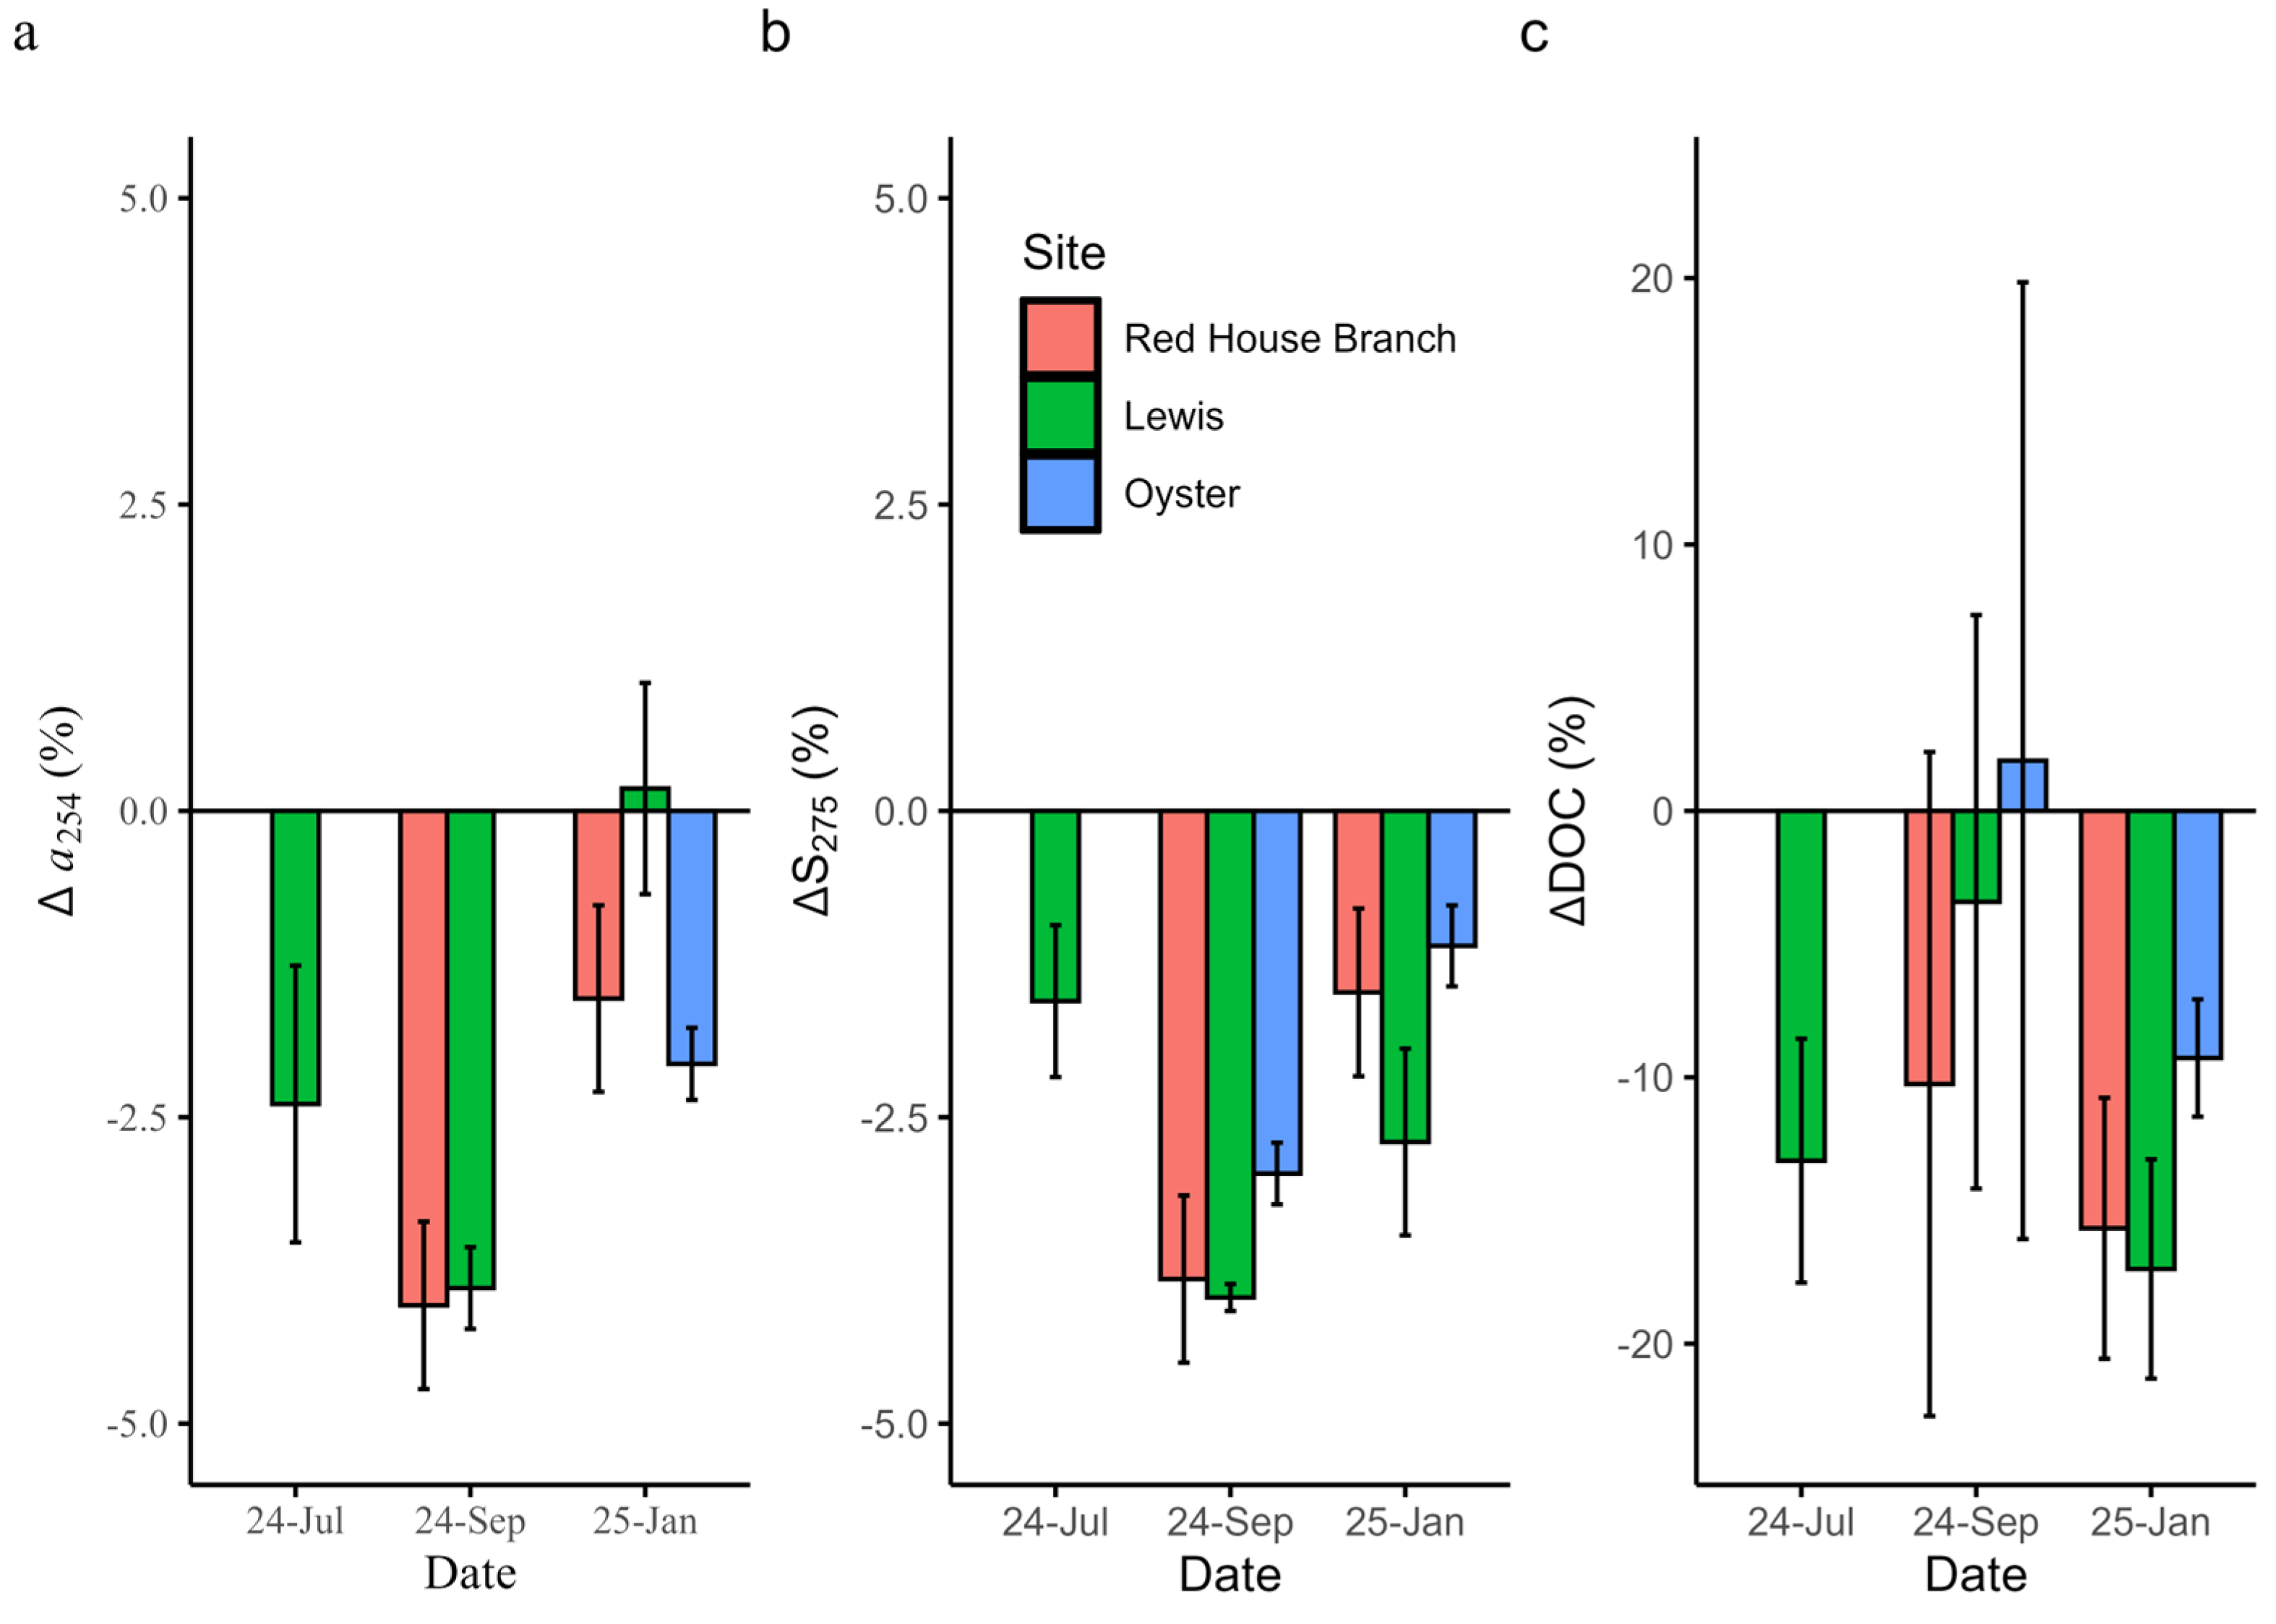
Treatment (ASW/Inoculate) did not significantly affect ∆ a 254 , ∆S275–295, or ∆DOC, nor did any interactions with treatment (Table 5). Therefore, ASW and Inoculate treatments are considered as one group hereafter. Date and site were significant factors in the ANOVA for all three parameters. Percent changes in a 254, S275–295, and DOC concentrations over the course of the aging experiments are shown in Figure 7.

3.5. Effects of Aging and Photolysis on Model Performance

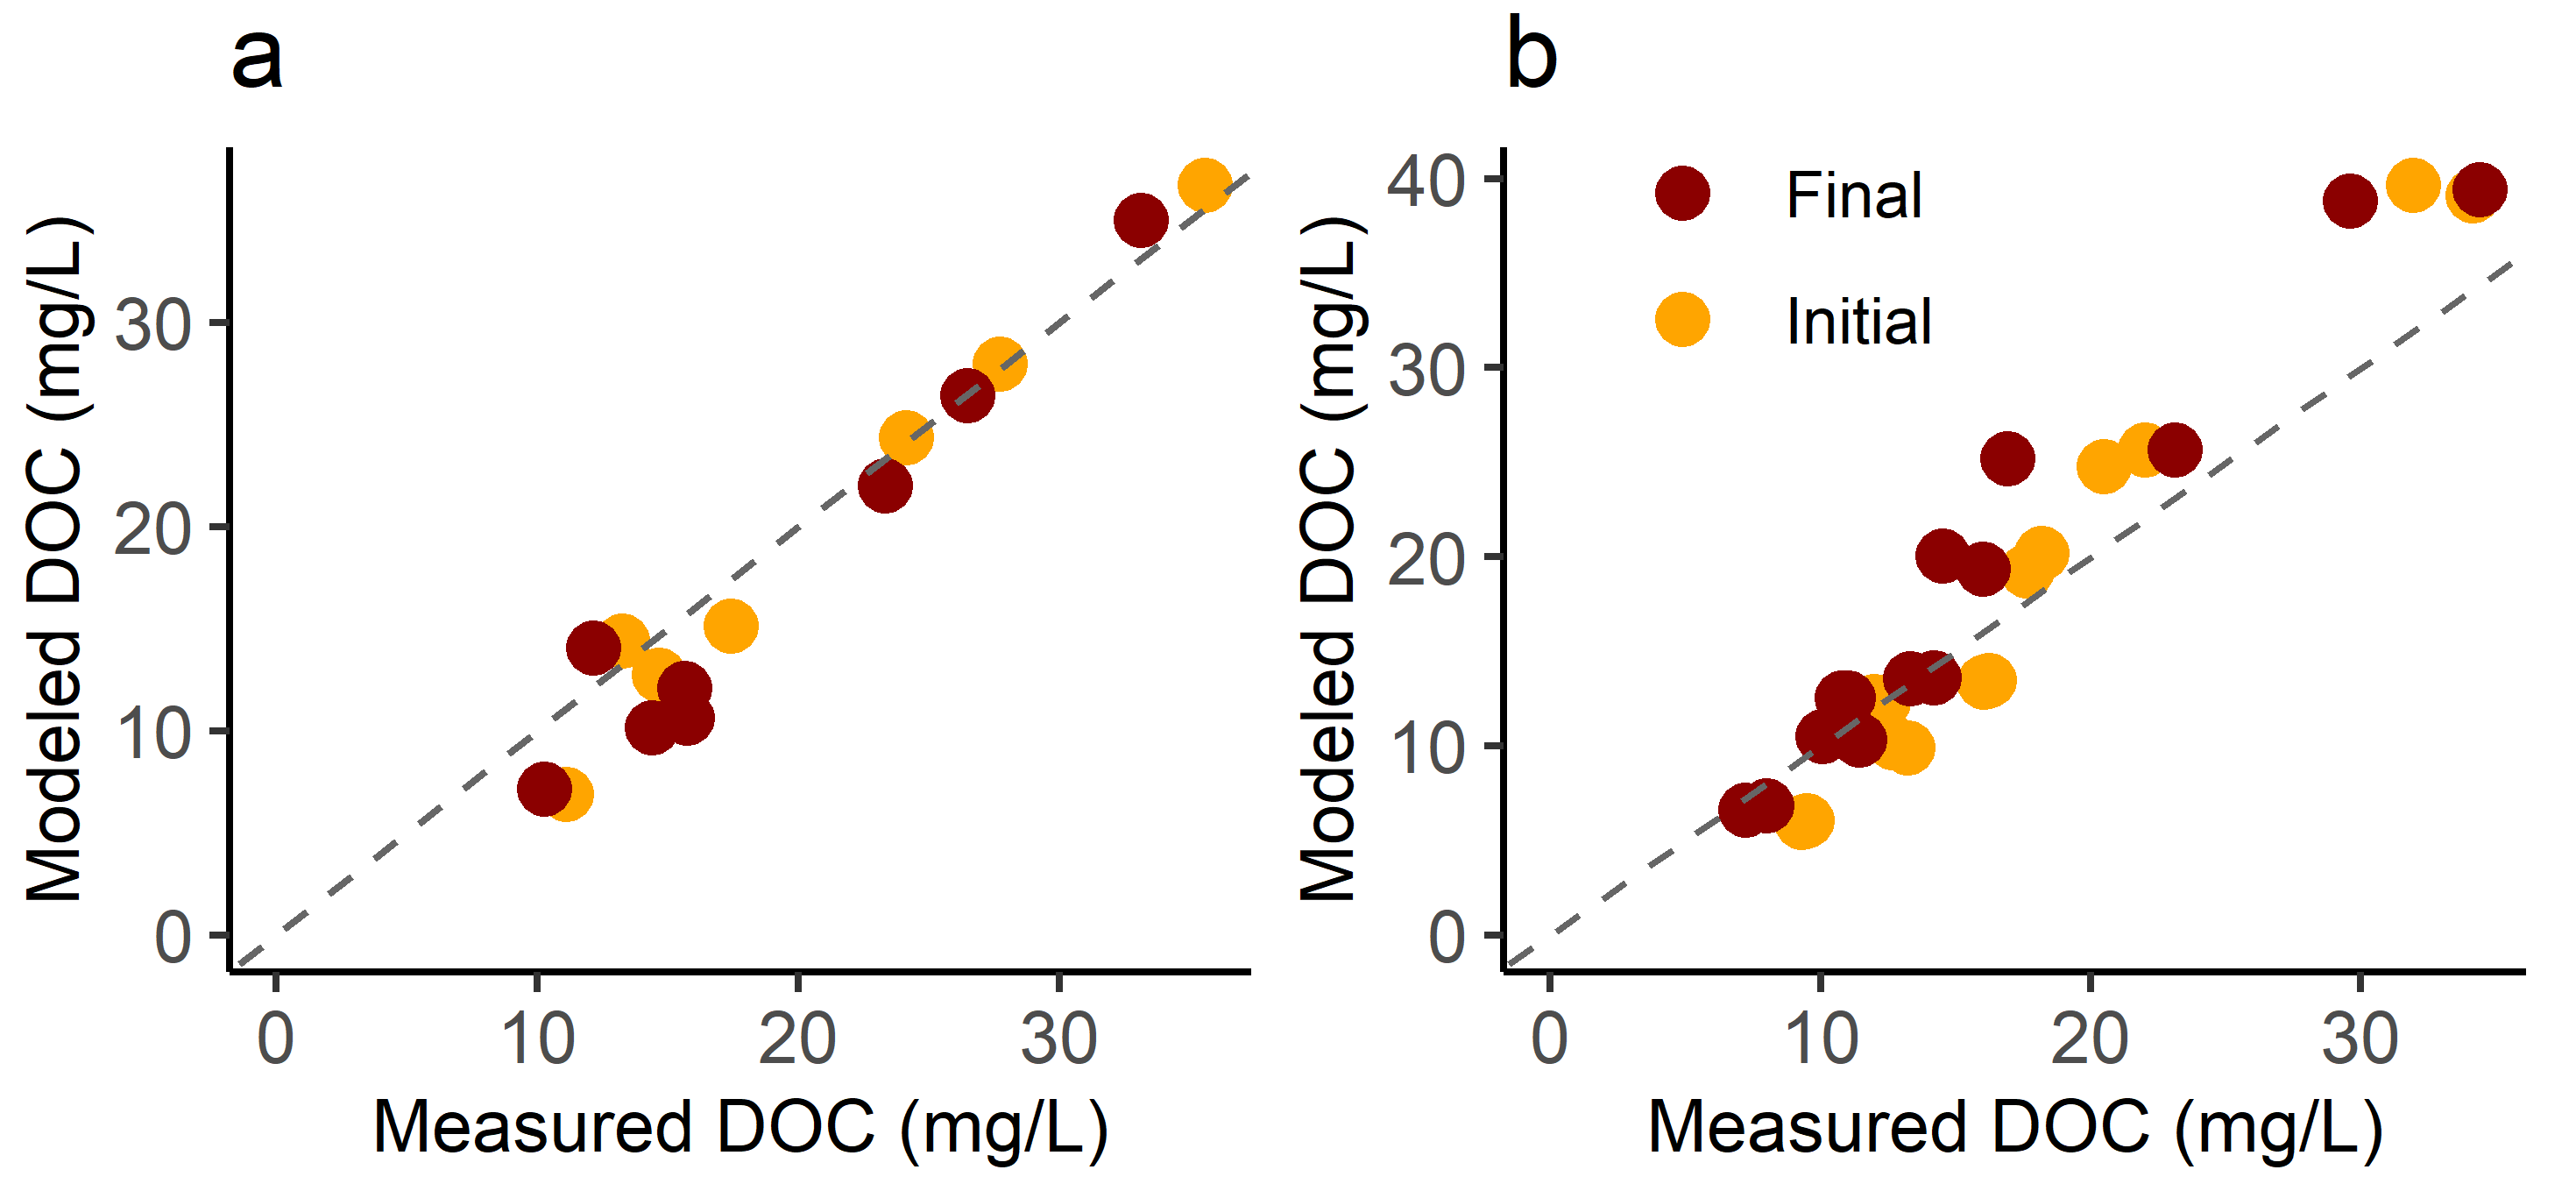
In the comparison of model predictions from incubation experiment samples, the model performance declined slightly when predicting values for final samples (Table 6, Figure 8). The R2 and RMSE values of final samples were lower and higher, respectively, compared to initial samples. Relative MAE increased for aged and photolyzed samples as well.

4. Discussion

4.1. DOC Concentrations and DOM Composition

The San Sebastian is a relatively small river, yet within its 63 km2 watershed, there are a variety of potential sources that likely contribute to DOM, including urban stormwater, phytoplankton, forests, and marshes. Median SR values for all sites were less than 1, suggesting that the DOM was strongly influenced by terrigenous material [21,47], even for the most downstream sites (Table 2). Although terrigenous organic matter usually has higher SUVA254 values [48], the tributary creeks in this study exhibited lower and more consistent SUVA254 values than main stem river sites. However, the main stem river site values were highly variable, and both sets of values are within the expected range for river systems [10].
DOC concentrations were markedly higher in October 2023 and September–October 2024 (Figure 2). During these months, a 254 also increased, and SR values were lower and more uniform (Figure S1). Consistent with these temporal patterns, DOC, and a 254 , and S275–295 were each significantly correlated with salinity, though the correlation for S275–295 was relatively weak (R2 = 0.04; Figure 3). Together, these relationships indicate that freshwater discharge influences estuarine DOM concentration and composition. However, zero salinity samples also exhibited considerable variation in DOC and optical parameters, possibly because these samples come from 3 separate tributary sites, which differ in organic matter source composition and watershed characteristics (Figure 1b). This variability further suggests that estuarine DOM is not governed solely by the amount of freshwater discharge, but also by processes shaping the concentration and composition of the freshwater endmembers.
Direct discharge measurements are unavailable for the study period, yet the higher rainfall and lowered salinity suggest elevated freshwater discharge during this period (Figure 2). A portion of the September-October 2024 rainfall was associated with Hurricanes Helene and Milton, though neither storm hit the area directly. Tropical cyclones can mobilize large fluxes of terrigenous CDOM, which can reshape coastal microbial communities and increase microbial respiration rates [6,41,49,50]. The lower salinity and elevated rainfall in October 2023 were not associated with a tropical weather system, demonstrating that extra-tropical weather systems may also increase DOC concentrations, and possibly cause similar downstream effects on microbial communities, primary production, and carbon cycling [15,51,52].
The downstream effects of rainfall on DOC concentrations are complex, reflecting the interaction of mobilization versus dilution, as well as the influences of stormwater management practices, watershed characteristics, and antecedent soil saturation state [51,53,54]. In our study, increases in DOC/CDOM and decreases in S275–295 and SR were associated with periods of higher rainfall and lowered salinity, which is consistent with elevated terrigenous DOM mobilization. Although these relationships cannot be attributed solely to rainfall, the observed trends are consistent with increased freshwater discharge and terrigenous inputs during wet periods [41,55]. Pulses of freshwater runoff are likely to increase in the future due to increased rainfall intensity associated with climate change [56,57]. Important questions remain about the lifespan and fate of the resulting CDOM fluxes [25,27] and the resilience of estuaries after such events. To answer these questions, large datasets are needed to capture the temporal and spatial variability. Optical measurements/models can be an important tool for parsing causality in complex systems that experience overlapping long-term trends, cyclic patterns, and episodic events [24].

4.2. DOC Models

All models in our study predicted DOC values that were highly correlated with the measured values in the training data (R2 ranged from 0.88 to 0.97). The Comprehensive models outperformed the Absorbance models on training and testing datasets (Table 2). Comparing the Comprehensive Linear versus Comprehensive Mixed model, we found that the mixed model fit the training data better, based on AIC and statistical fit of measured vs. modeled DOC. However, the Comprehensive Linear model predicted the testing dataset better, producing a slope closer to 1 and smaller, non-significant y-intercepts (Figure 5). The key difference between the models is the inclusion of random intercepts in the mixed model, which account for possible idiosyncratic effects associated with specific sites or sampling dates that might otherwise bias the fixed effects. The linear models, lacking these random intercepts, have larger (more negative) coefficients for the S275–295 and salinity terms (Table 3), indicating a greater reliance on those terms. Because random intercepts are not transferable to new sites and sampling dates, we chose to omit them for testing the mixed models. This is a more realistic test of the model’s generalizability. This likely caused the overestimation of DOC at the low end of the concentration range (Figure 5a,c). The rMAE was 17% for both Comprehensive models (Table 3), whereas the RMSE, which penalizes larger deviations more, was lower for the Comprehensive Linear model. Overall, the Comprehensive Linear model was preferred due to its better fit of the testing dataset and more accurate predictions of both low and high DOC concentrations. However, in a scenario where predictions are required only for specific sites with known random intercepts, a mixed model could provide improved fit.
While some models have successfully predicted DOC based on a single absorption coefficient, dynamic systems like estuaries often require more complexity to reflect spatial and temporal gradients in organic matter source [27]. Carter et al. addressed source variability using a 2-component model that explicitly delineates two fractions of DOM, one strongly absorbing and one weakly absorbing [29]. Fichot and Benner employed 2 different equations for high versus low DOM concentrations in coastal waters [58]. This approach evolved towards using S275 as a tracer of terrigenous DOM and DOC [24,25]. Likewise, we found that S275–295 significantly improved the estimation of DOC over an absorption coefficient alone. Although S275–295 is more commonly used as an indicator of molecular weight and/or source [21,32], it logically informs the relationship between CDOM and DOC in much the same way that the use of multiple absorption coefficients has in previous models [18]. Cao et al. found a tight correlation between DOC-specific absorbance and S275, providing direct support for using S275–295 in this way [24]. We found only a weak (but significant) correlation between these two variables (Figure S2,) but this may be due to increased variability in SUVA254 at low DOC concentrations. Because our S275–295 precision exceeded DOC precision, S275–295 may be a more robust metric. With the advent of in situ spectrophotometers and satellite-based systems capable of hyperspectral imaging, models with spectral slope could become more widely applicable [26,28,46,59].
The use of salinity as a fixed effect in a CDOM model is rare, but such ancillary data shows potential to enhance predictions in certain contexts [30]. Salinity has a well-established anticorrelation with CDOM [26,60], and provides important context as a tracer of conservative mixing between freshwater and seawater. It also directly influences optical properties through conformational changes and flocculation [61,62,63]. Stedmon and Markager caution that spectral slope varies non-linearly when mixing water masses with differing absorbance characteristics [23], which could present some concerns for using S275–295 in a linear model. Inclusion of a salinity term may provide additional context for modeling estuarine systems. Empirically, the Comprehensive model performed better on the training and testing data, providing support for the salinity term. Nonetheless, we acknowledge that the Absorbance model would provide an effective alternative if salinity data were unavailable.

4.3. Incubation Experiments

In situ processing can affect CDOM optical properties, possibly altering the CDOM-DOC relationship. For example, photolysis (or photobleaching) of DOM is a key driver of the increase in spectral slopes observed from nearshore to offshore waters, which corresponds to a shift towards lower molecular weight [21,22,47,64,65]. Similarly to these previous studies, our light-exposed flasks generally exhibited greater DOC and a 254 losses, and greater increases in S275–295, compared to dark flasks (Figure 6). This suggests the cleavage of chemical bonds to form smaller, less chromophoric molecules, as well as some remineralization to CO2. The largest changes occurred in summer, aliging with higher sunlight intensity. The photolysis results are particularly relevant for the San Sebastian River, where the areal extent of the intertidal zone is more than 5 times that of the subtidal zone [38]. In these shallow areas, sunlight exposure would be optimal, potentially allowing for substantial DOM photolysis during transit. Also, the 2 d exposure time is reasonable compared to a residence time of 5.3 d for the river [38]. Finally, the incubations were conducted with natural sunlight and in situ temperatures. These results therefore suggest that photolysis is an environmentally relevant pathway for CDOM transformation in the San Sebastian River. Such transformations have resulted in smaller, more bioavailable organic molecules and the release of dissolved inorganic nutrients in other systems [66,67].
For the aging experiments, the largest changes in a 254 and S275–295 were observed in the September 2024 experiment, which coincided with lower salinities and higher DOC after heavy rainfall (Figure 7). These larger percent changes could be interpreted as evidence of greater lability, but the statistical similarity between the ASW and Inoculate treatments indicates that biological degradation was not the main process at work. This aligns with previous findings showing very limited biodegradation of DOM from U.S. rivers [68,69]. Possible abiotic processes that could explain changes in a 254 , S275–295, and DOC include flocculation, adsorption to bottle surfaces, and oxidation. Flocculation is a common occurrence when DOM encounters increasingly saline waters [61,62], which happened in our aging experiments due to deliberate mixing. The initial samples were removed and filtered approximately 30 min after mixing. Salt-induced flocculation usually occurs quickly, but can continue for up to an hour [70]. Therefore, aggregates may have continued to form after initial sample removal, thus contributing to the observed changes. While the mechanism of change remains uncertain, the aging experiment results indicate the potential for aging and/or mixing processes to affect absorbance. We also note that each incubation experiment represents a single point in time in a system influenced by multiple variables that are constantly changing. Therefore, the results may be influenced by the timing of the sampling dates and may not represent the full range of conditions in situ.
The changes during our aging and photochemical experiments were modest, on the order of 15% or less. Yet, they could still significantly impair model efficacy if DOC and predictors ( a 254 and S275–295) are affected in disparate ways. We therefore assessed the impacts on the preferred model (Comprehensive Linear) performance by comparing predictions for initial and final samples from the incubation experiments (Figure 8). For the aging experiment, there were only minor changes between initial and final samples for R2, RMSE, and rMAE (Table 6). Therefore, the changes in optical properties during the incubation appeared to reduce the model’s efficacy only slightly. For the photolysis experiment, the model performance declined to a greater extent, reflected in higher RMSE and rMAE values for the final samples compared to the initial. The largest errors in predictions occurred with the samples that had the largest ∆ a 254 and ∆S275–295 during the incubation. A close examination of the magnitude of those changes and the coefficients in the Comprehensive Linear model indicates that the majority of the error is derived from the changes in the S275–295 term. Yet, despite the decline in accuracy, the R2 values of measured versus calculated DOC were still >0.9, even for the photolyzed samples (Table 6). This suggests that the Comprehensive Linear model can provide adequate DOC predictions, even for samples that have been deliberately photochemically altered. However, we acknowledge the potential for photolysis to alter S275–295 and the CDOM:DOC relationship, and it is therefore a potential source of error in the CDOM model. This is especially true for coastal systems with strong sunlight intensity and long residence times, such as the many shallow, slow-moving rivers and lagoons in Florida (e.g., the Everglades, the St. Johns River, and the Indian River Lagoon).
Our year-long dataset revealed variability in CDOM/DOC concentrations that may be driven by periods of heavy rainfall. The mobilization of terrigenous and/or anthropogenic CDOM may also increase in the future due to the effects of climate change on rainfall intensity [56,57]. Characterizing this phenomenon and its consequences requires frequent measurements with a large dynamic range. In our study, the strong correlations between optical characteristics and DOC have allowed us to create a robust model based on a 254 , S275–295, and salinity that effectively predicted DOC over a wide range of conditions. The model even produced reasonable estimations for samples that had undergone 20 d of aging or 2 d of photolysis. To our knowledge, there are no other published CDOM models for rivers on Florida’s east coast. This study therefore contributes an important dataset for understanding regional patterns in DOM dynamics, which contribute to a more complete understanding of DOM fate and carbon cycling. Finally, we propose that the combination of absorption coefficient, spectral slope, and salinity could be adapted for other estuarine systems as well, possibly improving predictive capacity.

Supplementary Materials

The following supporting information can be downloaded at: https://www.mdpi.com/article/10.3390/w17213133/s1, Figure S1: Monthly SR values for the training dataset; Figure S2: SUVA254 values versus S275–295 values for the training dataset.

Author Contributions

Conceptualization, software, formal analysis, resources, visualization, supervision, project administration, and writing—original draft, M.W.S.; investigation, data curation, validation, M.W.S., C.S., F.R. and M.W.S.; writing—review and editing, C.S. and F.R. All authors have read and agreed to the published version of the manuscript.

Funding

This research was supported by the Flagler College Science Advisory Board and Flagler College Vice President of Academic Affairs.

Data Availability Statement

Data used in this study are available at https://drive.google.com/drive/folders/132L3ydZWd7BhxFf1yoSoJpWv28JeT0be?usp=sharing (accessed on 20 October 2025).

Acknowledgments

We thank Daniel and Nathan Wooldridge, Ashley Floriano and Ashlyn Stevenson for assistance with sample collection; Lexis Massey and the UF Whitney Lab Biogeochemistry group for assistance in chemical analysis; Carrie Grant and Jessica Veenstra for providing editorial comments on the manuscript. During the preparation of this manuscript, the authors used generative artificial intelligence platforms Elicit and ChatGPT-5 to identify relevant sources. ChatGPT-5 was also used to generate and troubleshoot R code and to revise the manuscript for conciseness and flow. The authors have reviewed and edited the output and take full responsibility for the content of this publication.

Conflicts of Interest

The authors declare no conflicts of interest.

Abbreviations

The following abbreviations are used in this manuscript:
AICAkaike’s Information Criterion
ASWArtificial Seawater
DOMDissolved Organic Matter
DOCDissolved Organic Carbon
CDOMColored Dissolved Organic Matter
HDPEHigh-Density Polyethylene
MAEMean Absolute Error
MCEMixed Cellulose Ester
RMSERoot Mean Square Error
SUVA254Specific Ultraviolet Absorbance
VIFVariance Inflation Factor

References

  1. Barrón, C.; Duarte, C.M. Dissolved Organic Carbon Pools and Export from the Coastal Ocean. Glob. Biogeochem. Cycles 2015, 29, 1725–1738. [Google Scholar] [CrossRef]
  2. Hansell, D.A.; Carlson, C.A.; Repeta, D.J.; Schlitzer, R. Dissolved Organic Matter in the Ocean: A Controversy Stimulates New Insights. Oceanography 2009, 22, 202–211. [Google Scholar] [CrossRef]
  3. Muller, F.L.L.; Tankéré-Muller, S.P.C.; Tang, C.-H. Terrigenous Humic Substances Regulate the Concentrations of Dissolved Fe and Cu (but Not Al, Mn, Ni or Zn) in the Gaoping River Plume. Sci. Total Environ. 2024, 906, 167374. [Google Scholar] [CrossRef] [PubMed]
  4. Ullrich, S.M.; Tanton, T.W. Mercury in the Aquatic Environment: A Review of Factors Affecting Methylation. Crit. Rev. Environ. Sci. Technol. 2001, 31, 241–293. [Google Scholar] [CrossRef]
  5. Krachler, R.; Krachler, R.; Valda, A.; Keppler, B.K. Natural Iron Fertilization of the Coastal Ocean by “Blackwater Rivers”. Sci. Total Environ. 2019, 656, 952–958. [Google Scholar] [CrossRef]
  6. Garrison, C.E.; Roozbehi, S.; Mitra, S.; Corbett, D.R.; Field, E.K. Coastal Microbial Communities Disrupted During the 2018 Hurricane Season in Outer Banks, North Carolina. Front. Microbiol. 2022, 13, 816573. [Google Scholar] [CrossRef]
  7. Kieber, D.J.; Powers, L.C.; Stubbins, A.; Miller, W.L. Chapter 11—Marine Photochemistry of Organic Matter: Processes and Impacts. In Biogeochemistry of Marine Dissolved Organic Matter, 3rd ed.; Hansell, D.A., Carlson, C.A., Eds.; Academic Press: Amsterdam, The Netherlands, 2024; pp. 507–585. ISBN 978-0-443-13858-4. [Google Scholar]
  8. Sulzberger, B.; Durisch-Kaiser, E. Chemical Characterization of Dissolved Organic Matter (DOM): A Prerequisite for Understanding UV-Induced Changes of DOM Absorption Properties and Bioavailability. Aquat. Sci. 2009, 71, 104–126. [Google Scholar] [CrossRef]
  9. Bushaw, K.L.; Zepp, R.G.; Tarr, M.A.; Schulz-Jander, D.; Bourbonniere, R.A.; Hodson, R.E.; Miller, W.L.; Bronk, D.A.; Moran, M.A. Photochemical Release of Biologically Available Nitrogen from Aquatic Dissolved Organic Matter. Nature 1996, 381, 404–407. [Google Scholar] [CrossRef]
  10. D’Andrilli, J.; Silverman, V.; Buckley, S.; Rosario-Ortiz, F.L. Inferring Ecosystem Function from Dissolved Organic Matter Optical Properties: A Critical Review. Environ. Sci. Technol. 2022, 56, 11146–11161. [Google Scholar] [CrossRef]
  11. Coble, P.G. Marine Optical Biogeochemistry:  The Chemistry of Ocean Color. Chem. Rev. 2007, 107, 402–418. [Google Scholar] [CrossRef]
  12. Bricaud, A.; Morel, A.; Prieur, L. Absorption by Dissolved Organic Matter of the Sea (Yellow Substance) in the UV and Visible Domains1. Limnol. Oceanogr. 1981, 26, 43–53. [Google Scholar] [CrossRef]
  13. Conmy, R.N.; Schaeffer, B.A.; Schubauer-Berigan, J.; Aukamp, J.; Duffy, A.; Lehrter, J.C.; Greene, R.M. Characterizing Light Attenuation Within Northwest Florida Estuaries: Implications for RESTORE Act Water Quality Monitoring. Mar. Pollut. Bull. 2017, 114, 995–1006. [Google Scholar] [CrossRef] [PubMed]
  14. Martin, P.; Sanwlani, N.; Lee, T.W.Q.; Wong, J.M.C.; Chang, K.Y.W.; Wong, E.W.-S.; Liew, S.C. Dissolved Organic Matter from Tropical Peatlands Reduces Shelf Sea Light Availability in the Singapore Strait, Southeast Asia. Mar. Ecol. Prog. Ser. 2021, 672, 89–109. [Google Scholar] [CrossRef]
  15. Berezovski, A.; Hessen, D.O.; Andersen, T. Photon Budgets and the Relative Effects of CDOM and Pigment Absorptions on Primary Production Along a Coastal Salinity Gradient. Front. Photobiol. 2025, 2, 1452747. [Google Scholar] [CrossRef]
  16. Peltzer, E.T.; Fry, B.; Doering, P.H.; McKenna, J.H.; Norrman, B.; Zweifel, U.L. A Comparison of Methods for the Measurement of Dissolved Organic Carbon in Natural Waters. Mar. Chem. 1996, 54, 85–96. [Google Scholar] [CrossRef]
  17. Forsberg, C. Dissolved Organic Carbon in Some Lakes in Uppland, Sweden. Oikos 1967, 18, 210–216. [Google Scholar] [CrossRef]
  18. Li, P.; Hur, J. Utilization of UV-Vis Spectroscopy and Related Data Analyses for Dissolved Organic Matter (DOM) Studies: A Review. Crit. Rev. Environ. Sci. Technol. 2017, 47, 131–154. [Google Scholar] [CrossRef]
  19. Zhang, M.; He, Z. Characteristics of Dissolved Organic Carbon Revealed by Ultraviolet-Visible Absorbance and Fluorescence Spectroscopy: The Current Status and Future Exploration. In Labile Organic Matter—Chemical Compositions, Function, and Significance in Soil and the Environment; John Wiley & Sons, Ltd.: Hoboken, NJ, USA, 2015; pp. 1–21. ISBN 978-0-89118-963-3. [Google Scholar]
  20. Hansen, A.M.; Kraus, T.E.C.; Pellerin, B.A.; Fleck, J.A.; Downing, B.D.; Bergamaschi, B.A. Optical Properties of Dissolved Organic Matter (DOM): Effects of Biological and Photolytic Degradation. Limnol. Oceanogr. 2016, 61, 1015–1032. [Google Scholar] [CrossRef]
  21. Helms, J.R.; Stubbins, A.; Ritchie, J.D.; Minor, E.C.; Kieber, D.J.; Mopper, K. Absorption Spectral Slopes and Slope Ratios as Indicators of Molecular Weight, Source, and Photobleaching of Chromophoric Dissolved Organic Matter. Limnol. Oceanogr. 2008, 53, 955–969. [Google Scholar] [CrossRef]
  22. Helms, J.R.; Stubbins, A.; Perdue, E.M.; Green, N.W.; Chen, H.; Mopper, K. Photochemical Bleaching of Oceanic Dissolved Organic Matter and Its Effect on Absorption Spectral Slope and Fluorescence. Mar. Chem. 2013, 155, 81–91. [Google Scholar] [CrossRef]
  23. Stedmon, C.A.; Markager, S. Behaviour of the Optical Properties of Coloured Dissolved Organic Matter under Conservative Mixing. Estuar. Coast. Shelf Sci. 2003, 57, 973–979. [Google Scholar] [CrossRef]
  24. Cao, F.; Tzortziou, M.; Hu, C.; Mannino, A.; Fichot, C.G.; Del Vecchio, R.; Najjar, R.G.; Novak, M. Remote Sensing Retrievals of Colored Dissolved Organic Matter and Dissolved Organic Carbon Dynamics in North American Estuaries and Their Margins. Remote Sens. Environ. 2018, 205, 151–165. [Google Scholar] [CrossRef]
  25. Fichot, C.G.; Lohrenz, S.E.; Benner, R. Pulsed, Cross-Shelf Export of Terrigenous Dissolved Organic Carbon to the Gulf of Mexico. J. Geophys. Res. Ocean. 2014, 119, 1176–1194. [Google Scholar] [CrossRef]
  26. Keith, D.J.; Lunetta, R.S.; Schaeffer, B.A. Optical Models for Remote Sensing of Colored Dissolved Organic Matter Absorption and Salinity in New England, Middle Atlantic and Gulf Coast Estuaries USA. Remote Sens. 2016, 8, 283. [Google Scholar] [CrossRef]
  27. Osburn, C.L.; Boyd, T.J.; Montgomery, M.T.; Bianchi, T.S.; Coffin, R.B.; Paerl, H.W. Optical Proxies for Terrestrial Dissolved Organic Matter in Estuaries and Coastal Waters. Front. Mar. Sci. 2016, 2, 127. [Google Scholar] [CrossRef]
  28. Avagyan, A.; Runkle, B.R.K.; Kutzbach, L. Application of High-Resolution Spectral Absorbance Measurements to Determine Dissolved Organic Carbon Concentration in Remote Areas. J. Hydrol. 2014, 517, 435–446. [Google Scholar] [CrossRef]
  29. Carter, H.T.; Tipping, E.; Koprivnjak, J.-F.; Miller, M.P.; Cookson, B.; Hamilton-Taylor, J. Freshwater DOM Quantity and Quality from a Two-Component Model of UV Absorbance. Water Res. 2012, 46, 4532–4542. [Google Scholar] [CrossRef] [PubMed]
  30. Codden, C.J.; Snauffer, A.M.; Mueller, A.V.; Edwards, C.R.; Thompson, M.; Tait, Z.; Stubbins, A. Predicting Dissolved Organic Carbon Concentration in a Dynamic Salt Marsh Creek via Machine Learning. Limnol. Oceanogr. Methods 2021, 19, 81–95. [Google Scholar] [CrossRef]
  31. Harvey, E.T.; Kratzer, S.; Andersson, A. Relationships between Colored Dissolved Organic Matter and Dissolved Organic Carbon in Different Coastal Gradients of the Baltic Sea. AMBIO 2015, 44, 392–401. [Google Scholar] [CrossRef]
  32. Fichot, C.G.; Benner, R. The Spectral Slope Coefficient of Chromophoric Dissolved Organic Matter (S275–295) as a Tracer of Terrigenous Dissolved Organic Carbon in River-Influenced Ocean Margins. Limnol. Oceanogr. 2012, 57, 1453–1466. [Google Scholar] [CrossRef]
  33. San Sebastian Water Quality Monitoring. Matanzas Riverkeeper. Available online: https://www.matanzasriverkeeper.org/sansebastian_sampling_2024 (accessed on 29 July 2025).
  34. US Census Bureau. Sunshine State Home to Metro Areas Among Top 10 U.S. Population Gainers From 2022 to 2023. Available online: https://www.census.gov/library/stories/2024/03/florida-and-fast-growing-metros.html (accessed on 11 July 2025).
  35. Pinto, G.; Bielmyer-Fraser, G.K.; Baynard, C.W.; Casamatta, D.; Closmann, C.; Goldberg, N.; Jones, S.F.; Johnson, A.; Penwell, W.; Pyati, R.; et al. 2024 State of the River Report for the Lower St. Johns River Basin, Florida: Water Quality, Fisheries, Aquatic Life, & Contaminants; Prepared for the City of Jacksonville, Environmental Protection Board; St. Johns Riverkeeper: Jacksonville, FL, USA, 2024. [Google Scholar]
  36. Gallegos, C.L. Optical Water Quality of a Blackwater River Estuary: The Lower St. Johns River, Florida, USA. Estuar. Coast. Shelf Sci. 2005, 63, 57–72. [Google Scholar] [CrossRef]
  37. Final Environmental Assessment Guana Tolomato Matanzas National Estuarine Research Reserve Boundary Change; U.S. Department of Commerce, National Oceanic and Atmospheric Administration: Silver Spring, MD, USA, 2019. Available online: https://coast.noaa.gov/data/docs/compliance/gtmnerr-final-ea.pdf (accessed on 22 July 2025).
  38. Gray, M.W.; Pinton, D.; Canestrelli, A.; Dix, N.; Marcum, P.; Kimbro, D.; Grizzle, R. Beyond Residence Time: Quantifying Factors That Drive the Spatially Explicit Filtration Services of an Abundant Native Oyster Population. Estuaries Coasts 2022, 45, 1343–1360. [Google Scholar] [CrossRef]
  39. Statistics for San Sebastian River at St. Augustine, FL—USGS Water Data for the Nation. Available online: https://waterdata.usgs.gov/monitoring-location/USGS-02246895/statistics/ (accessed on 22 July 2025).
  40. Ettensohn, C.A.; Wessel, G.M.; Wray, G. Development of Sea Urchins, Ascidians, and Other Invertebrate Deuterostomes: Experimental Approaches; Elsevier: Amsterdam, The Netherlands, 2004; ISBN 978-0-08-049659-7. [Google Scholar]
  41. Schafer, T.; Dix, N.; Dunnigan, S.; Reddy, K.R.; Osborne, T.Z. Impacts of Hurricanes on Nutrient Export and Ecosystem Metabolism in a Blackwater River Estuary Complex. J. Mar. Sci. Eng. 2022, 10, 661. [Google Scholar] [CrossRef]
  42. Iorio, D.D.; Castelao, R.M. The Dynamical Response of Salinity to Freshwater Discharge and Wind Forcing in Adjacent Estuaries on the Georgia Coast. Oceanography 2015, 26, 44–51. [Google Scholar] [CrossRef]
  43. NOAA National Estuarine Research Reserve System Wide Monitoring Program. Available online: http://www.nerrsdata.org (accessed on 17 July 2025).
  44. Florida Climate Center, Office of the State Climatologist St. Augustine-Precipitation. Available online: https://climatecenter.fsu.edu/products-services/data/precipitation/st-augustine (accessed on 23 July 2025).
  45. Omanović, D.; Santinelli, C.; Marcinek, S.; Gonnelli, M. ASFit—An All-Inclusive Tool for Analysis of UV–Vis Spectra of Colored Dissolved Organic Matter (CDOM). Comput. Geosci. 2019, 133, 104334. [Google Scholar] [CrossRef]
  46. Zhu, X.; Chen, L.; Pumpanen, J.; Keinänen, M.; Laudon, H.; Ojala, A.; Palviainen, M.; Kiirikki, M.; Neitola, K.; Berninger, F. Assessment of a Portable UV–Vis Spectrophotometer’s Performance for Stream Water DOC and Fe Content Monitoring in Remote Areas. Talanta 2021, 224, 121919. [Google Scholar] [CrossRef] [PubMed]
  47. Logozzo, L.; Tzortziou, M.; Neale, P.; Clark, J.B. Photochemical and Microbial Degradation of Chromophoric Dissolved Organic Matter Exported from Tidal Marshes. J. Geophys. Res. Biogeosci. 2021, 126, e2020JG005744. [Google Scholar] [CrossRef]
  48. Weishaar, J.L.; Aiken, G.R.; Bergamaschi, B.A.; Fram, M.S.; Fujii, R.; Mopper, K. Evaluation of Specific Ultraviolet Absorbance as an Indicator of the Chemical Composition and Reactivity of Dissolved Organic Carbon. Environ. Sci. Technol. 2003, 37, 4702–4708. [Google Scholar] [CrossRef]
  49. Yan, G.; Labonté, J.M.; Quigg, A.; Kaiser, K. Hurricanes Accelerate Dissolved Organic Carbon Cycling in Coastal Ecosystems. Front. Mar. Sci. 2020, 7, 248. [Google Scholar] [CrossRef]
  50. Nguyen, H.V.-M.; Hur, J.; Shin, H.-S. Changes in Spectroscopic and Molecular Weight Characteristics of Dissolved Organic Matter in a River During a Storm Event. Water Air Soil Pollut. 2010, 212, 395–406. [Google Scholar] [CrossRef]
  51. Bittar, T.B.; Berger, S.A.; Birsa, L.M.; Walters, T.L.; Thompson, M.E.; Spencer, R.G.M.; Mann, E.L.; Stubbins, A.; Frischer, M.E.; Brandes, J.A. Seasonal Dynamics of Dissolved, Particulate and Microbial Components of a Tidal Saltmarsh-Dominated Estuary under Contrasting Levels of Freshwater Discharge. Estuar. Coast. Shelf Sci. 2016, 182, 72–85. [Google Scholar] [CrossRef]
  52. Martineac, R.P.; Vorobev, A.V.; Moran, M.A.; Medeiros, P.M. Assessing the Contribution of Seasonality, Tides, and Microbial Processing to Dissolved Organic Matter Composition Variability in a Southeastern U.S. Estuary. Front. Mar. Sci. 2021, 8, 781580. [Google Scholar] [CrossRef]
  53. Inamdar, S.P.; Mitchell, M.J. Hydrologic and Topographic Controls on Storm-Event Exports of Dissolved Organic Carbon (DOC) and Nitrate across Catchment Scales. Water Resour. Res. 2006, 42. [Google Scholar] [CrossRef]
  54. Kalev, S.; Toor, G.S. Concentrations and Loads of Dissolved and Particulate Organic Carbon in Urban Stormwater Runoff. Water 2020, 12, 1031. [Google Scholar] [CrossRef]
  55. Lambert, T.; Pierson-Wickmann, A.-C.; Gruau, G.; Jaffrezic, A.; Petitjean, P.; Thibault, J.-N.; Jeanneau, L. Hydrologically Driven Seasonal Changes in the Sources and Production Mechanisms of Dissolved Organic Carbon in a Small Lowland Catchment. Water Resour. Res. 2013, 49, 5792–5803. [Google Scholar] [CrossRef]
  56. Wasko, C.; Nathan, R.; Stein, L.; O’Shea, D. Evidence of Shorter More Extreme Rainfalls and Increased Flood Variability under Climate Change. J. Hydrol. 2021, 603, 126994. [Google Scholar] [CrossRef]
  57. Shenoy, S.; Gorinevsky, D.; Trenberth, K.E.; Chu, S. Trends of Extreme US Weather Events in the Changing Climate. Proc. Natl. Acad. Sci. USA 2022, 119, e2207536119. [Google Scholar] [CrossRef]
  58. Fichot, C.G.; Benner, R. A Novel Method to Estimate DOC Concentrations from CDOM Absorption Coefficients in Coastal Waters. Geophys. Res. Lett. 2011, 38. [Google Scholar] [CrossRef]
  59. Gorman, E.T.; Kubalak, D.A.; Patel, D.; Dress, A.; Mott, D.B.; Meister, G.; Werdell, P.J. The NASA Plankton, Aerosol, Cloud, Ocean Ecosystem (PACE) Mission: An Emerging Era of Global, Hyperspectral Earth System Remote Sensing. In Proceedings of the Sensors, Systems, and Next-Generation Satellites XXIII, Strasbourg, France, 9–12 September 2019; SPIE: Bellingham, WA, USA, 2019; Volume 11151, pp. 78–84. [Google Scholar]
  60. Alberts, J.J.; Takács, M.; Schalles, J. Ultraviolet-Visible and Fluorescence Spectral Evidence of Natural Organic Matter (NOM) Changes along an Estuarine Salinity Gradient. Estuaries 2004, 27, 296–310. [Google Scholar] [CrossRef]
  61. Asmala, E.; Bowers, D.G.; Autio, R.; Kaartokallio, H.; Thomas, D.N. Qualitative Changes of Riverine Dissolved Organic Matter at Low Salinities Due to Flocculation. J. Geophys. Res. Biogeosci. 2014, 119, 1919–1933. [Google Scholar] [CrossRef]
  62. Sholkovitz, E.R. Flocculation of Dissolved Organic and Inorganic Matter during the Mixing of River Water and Seawater. Geochim. Et Cosmochim. Acta 1976, 40, 831–845. [Google Scholar] [CrossRef]
  63. Gao, Y.; Yan, M.; Korshin, G.V. Effects of Ionic Strength on the Chromophores of Dissolved Organic Matter. Environ. Sci. Technol. 2015, 49, 5905–5912. [Google Scholar] [CrossRef] [PubMed]
  64. Dalzell, B.J.; Minor, E.C.; Mopper, K.M. Photodegradation of Estuarine Dissolved Organic Matter: A Multi-Method Assessment of DOM Transformation. Org. Geochem. 2009, 40, 243–257. [Google Scholar] [CrossRef]
  65. Moran, M.A.; Sheldon, W.M.; Zepp, R.G. Carbon Loss and Optical Property Changes during Long-term Photochemical and Biological Degradation of Estuarine Dissolved Organic Matter. Limnol. Oceanogr. 2000, 45, 1254–1264. [Google Scholar] [CrossRef]
  66. Moran, M.A.; Zepp, R.G. Role of Photoreactions in the Formation of Biologically Labile Compounds from Dissolved Organic Matter. Limnol. Oceanogr. 1997, 42, 1307–1316. [Google Scholar] [CrossRef]
  67. Cory, R.M.; Kling, G.W. Interactions between Sunlight and Microorganisms Influence Dissolved Organic Matter Degradation along the Aquatic Continuum. Limnol. Oceanogr. Lett. 2018, 3, 102–116. [Google Scholar] [CrossRef]
  68. Wiegner, T.; Seitzinger, S.; Glibert, P.; Bronk, D. Bioavailability of Dissolved Organic Nitrogen and Carbon from Nine Rivers in the Eastern United States. Aquat. Microb. Ecol. 2006, 43, 277–287. [Google Scholar] [CrossRef]
  69. Wu, K.; Lu, K.; Dai, M.; Liu, Z. The Bioavailability of Riverine Dissolved Organic Matter in Coastal Marine Waters of Southern Texas. Estuar. Coast. Shelf Sci. 2019, 231, 106477. [Google Scholar] [CrossRef]
  70. Khoo, C.L.L.; Sipler, R.E.; Fudge, A.R.; Beheshti Foroutani, M.; Boyd, S.G.; Ziegler, S.E. Salt-Induced Flocculation of Dissolved Organic Matter and Iron Is Controlled by Their Concentration and Ratio in Boreal Coastal Systems. J. Geophys. Res. Biogeosci. 2022, 127, e2022JG006844. [Google Scholar] [CrossRef]
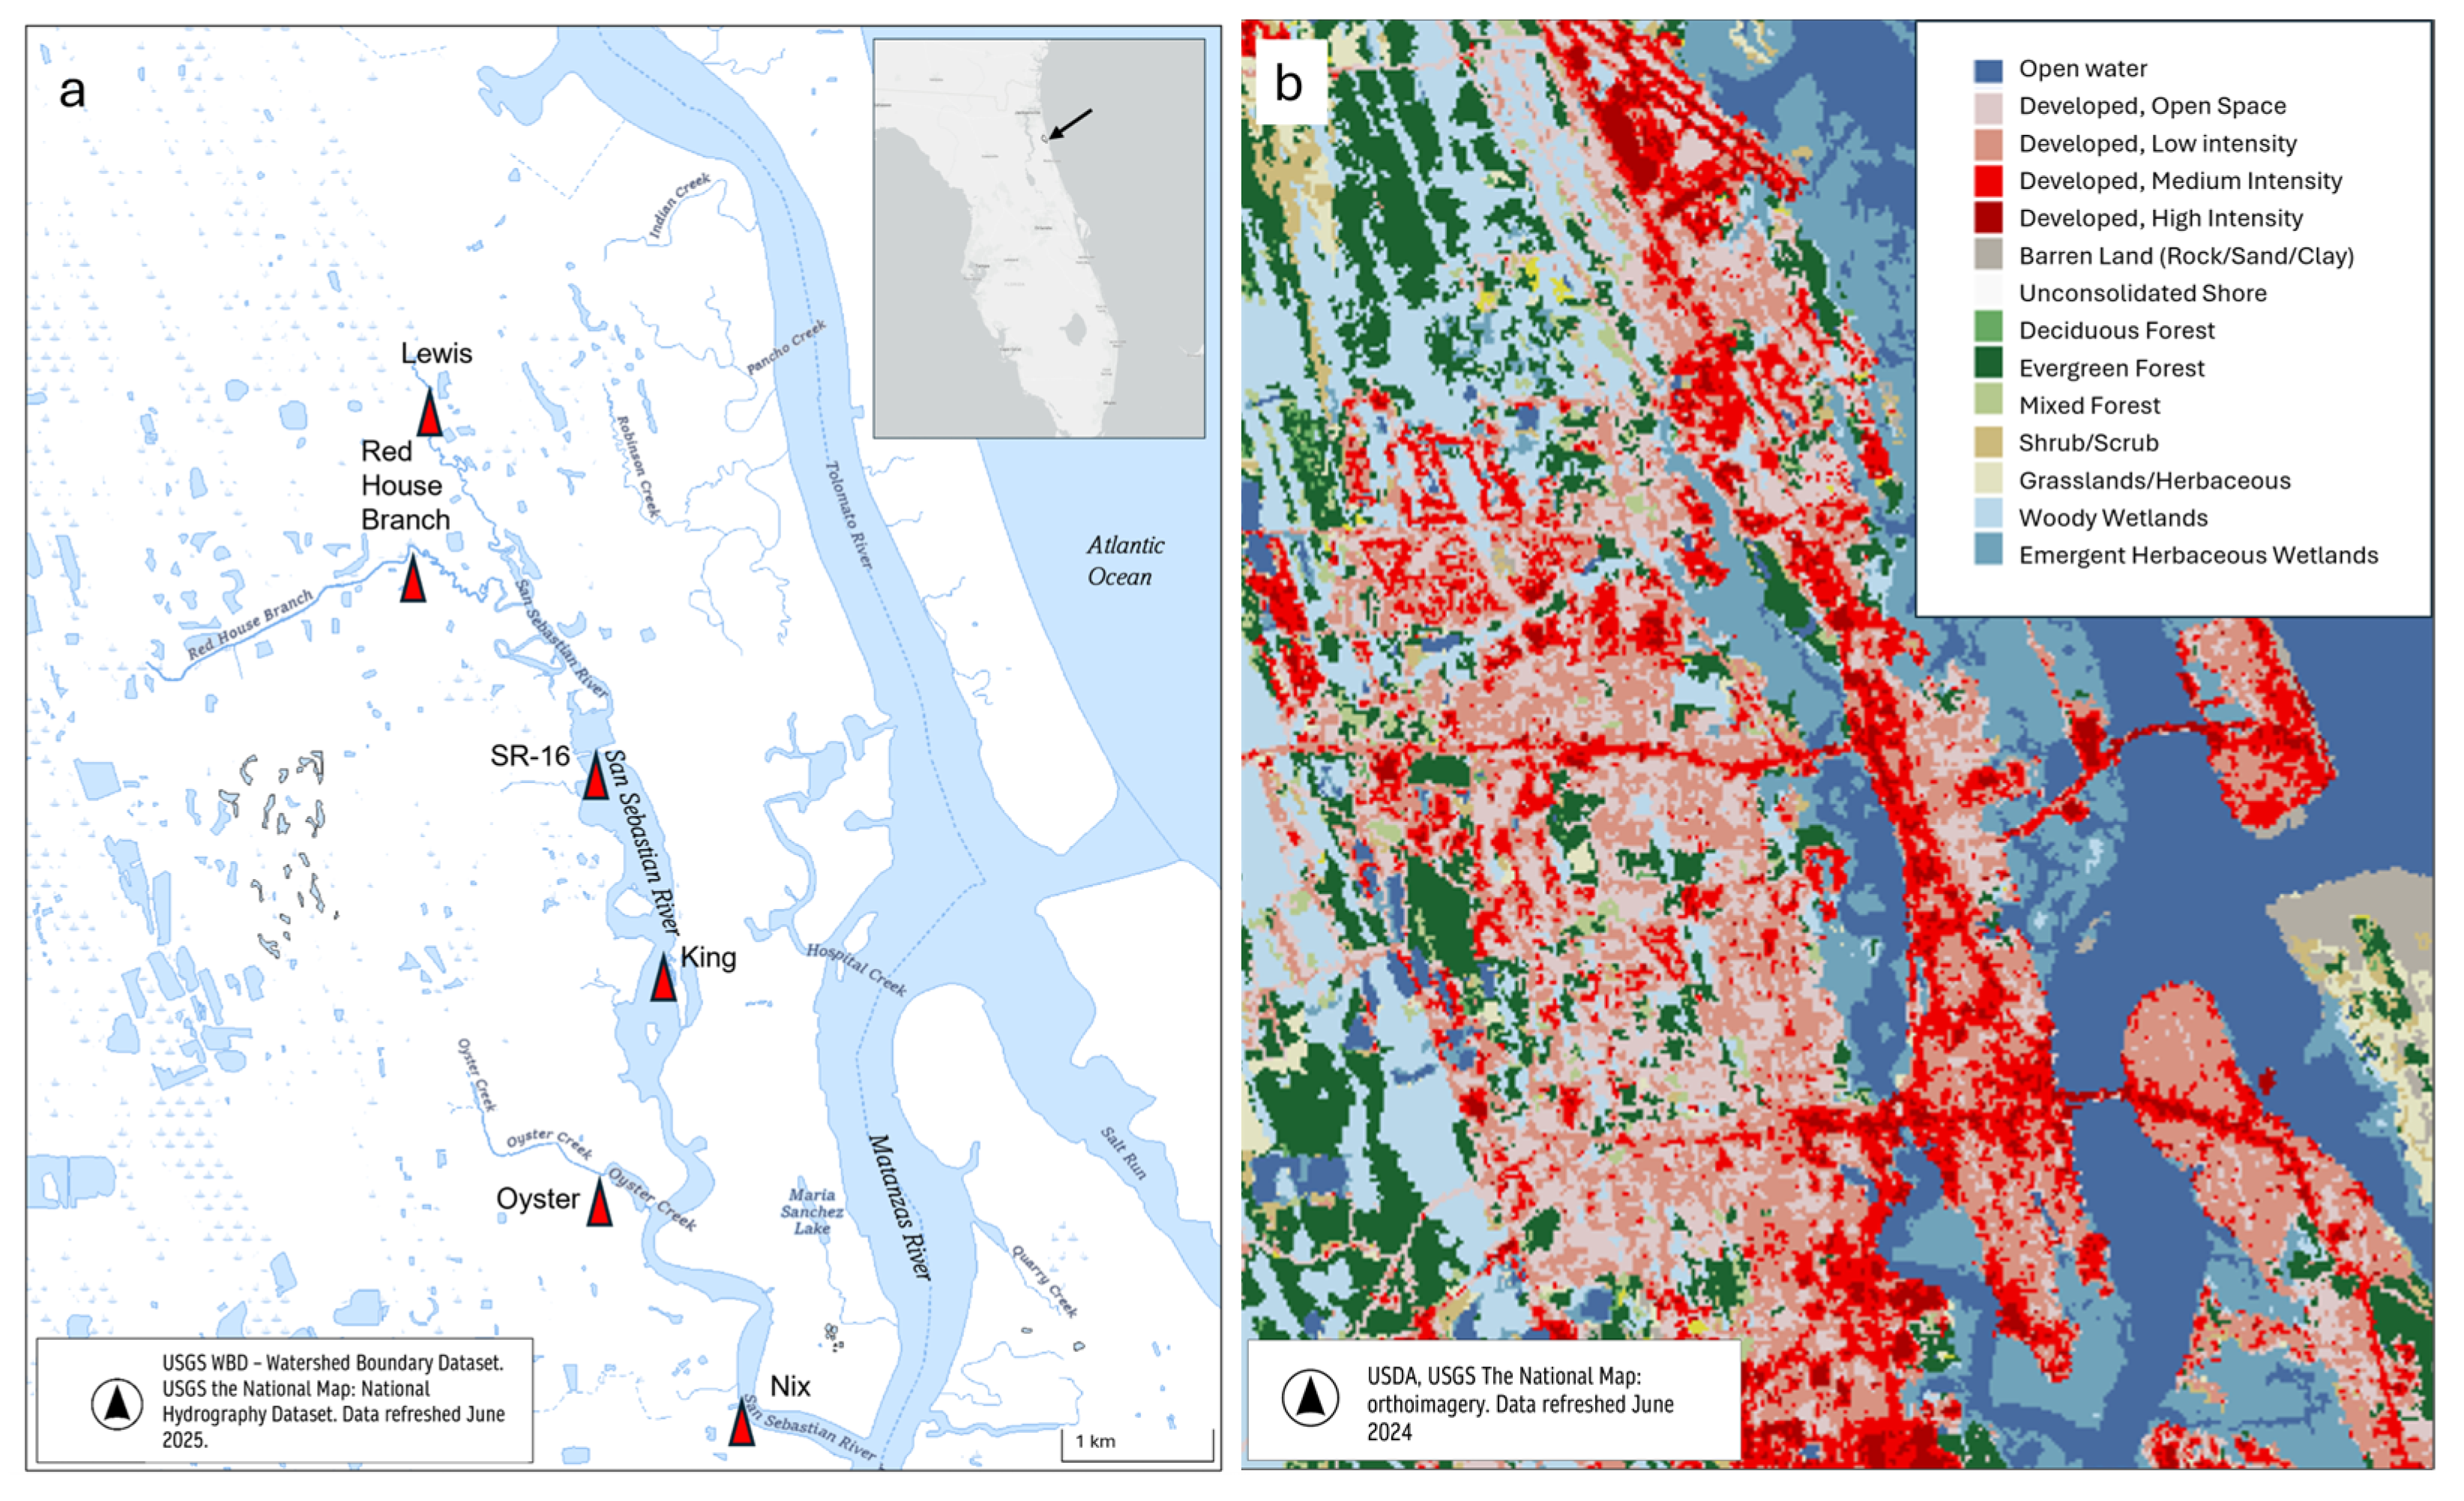
Figure 1. Panel (a) shows the San Sebastian River study area (29.9692–29.8692° N, 81.2800–81.3728° W). The sampling sites are located at the top of the red triangles; the inset shows a Florida map with the study location indicated by the arrow. Panel (b) shows a land use cover map of the same area.
Water 17 03133 g001
Figure 2. Daily average salinity from the river mouth (line) and monthly rainfall totals (columns) are shown in panel (a), DOC in panel (b), a 254 in panel (c), and S275–295 in panel (d). Values are from the training dataset. Tributary sites (Red House Branch, Lewis, and Oyster) are depicted in open symbols, main stem river sites (Nix, King, and SR-16) are depicted in closed symbols.
Water 17 03133 g002
Figure 3. Linear regressions showing correlations with salinity for the training dataset. Panel (a) shows DOC, panel (b) shows a 254 , and panel (c) shows S275–295.
Water 17 03133 g003
Figure 4. Regression of measured and calculated DOC concentrations for the training dataset, where p indicates the significance of the regression and pint indicates whether the intercept is significantly different from zero. Panels (ad) show the regressions with calculated values from the Comprehensive Mixed model (a), the Comprehensive Linear model (b), the Absorbance Mixed model (c), and the Absorbance Linear model (d).
Water 17 03133 g004
Figure 5. Regression of the measured and calculated DOC concentrations for the testing dataset, where p indicates the significance of the regression and pint indicates whether the intercept is significantly different from zero. Panels (ad) show the regressions with calculated values from the Comprehensive Mixed model (a), the Comprehensive Linear model (b), the Absorbance Mixed model (c), and the Absorbance Linear model (d). For the mixed models, the random intercepts were excluded from the calculations.
Water 17 03133 g005
Figure 6. Percent changes in a 254 (panel (a)), S275–295 (panel (b)), and DOC (panel (c)) during 2 d exposure to natural sunlight in situ. Columns and error bars show mean and SD, n = 3.
Water 17 03133 g006
Figure 7. Changes during 20 d aging experiments; panel (a) shows ∆ a 254 , panel (b) shows ∆S275–295, and panel (c) shows ∆DOC. ASW and Inoculate treatments were combined due to statistical similarity. Columns and error bars show mean and SD, respectively; n = 6 except for the July 2024 experiment, where n = 10.
Water 17 03133 g007
Figure 8. Predicted versus measured DOC concentrations for aged and photolyzed samples, calculated using the Comprehensive Linear model. Panels show initial and final samples from the (a) photochemical experiments (light-exposed flasks only) and (b) aging experiments. The dotted line shows y = x.
Water 17 03133 g008
Table 1. Summary of incubation experiments performed on San Sebastian River water.
Sampling DateSitesnExperiment Type
July 2024Lewisn = 5Aging
July 2024Lewisn = 3Photochemical
September 2024Lewis, Red House Branch, Oystern = 3Aging
October 2024Lewis, Red House Branch, Oystern = 1Photochemical
January 2025Lewis, Red House Branch, Oystern = 3Aging
January 2025Lewis, Red House Branch, Oystern = 1Photochemical
April 2025Red House Branchn = 3Photochemical
Table 2. Site means and (SD) for salinity, DOC, absorption coefficients, spectral slopes, and slope ratios. Values represent training and testing datasets combined.
SiteSalinity
(psu)
DOC
(mg/L)
a 254
(1/m)
a 280
(1/m)
a 325
(1/m)
a 355
(1/m)
a 440
(1/m)
SRS275–295
(1/nm)
S350–400
(1/nm)
SUVA254
(L/mg/m)
Red House Branch0 (1)18.7 (7.8)165 (68)122 (54)64 (32)41 (22)9.5 (6.1)0.90 (0.03)0.0156 (0.0014)0.0174 (0.0011)3.9 (0.9)
Lewis7 (8)21.9 (12.0) 227 (162)172 (129)94 (79)61 (54)15 (15)0.88 (0.05)0.0146 (0.0015)0.0166 (0.0011)4.3 (0.7)
Oyster8 (7)14.7 (6.2)140 (44)102 (33)52 (19)33 (13)7.5 (3.2)0.90 (0.07)0.0155 (0.0011)0.0172 (0.0014)4.5 (1.4)
SR-1625 (8)9.2 (7.5)87 (58)65 (46)34 (27)22 (18)5.3 (4.9)0.92 (0.05)0.0152 (0.0012)0.0165 (0.0008)5.0 (2.8)
King31 (5)5.5 (5.3)40 (25)30 (19)15 (11)9.8 (7.3)2.5 (1.9)0.96 (0.08)0.0155 (0.0013)0.0162 (0.0014)5.4 (4.7)
Nix33 (4)4.6 (5.3)28 (24)21 (19)11 (11)6.8 (7.0)1.7 (1.8)0.97 (0.16)0.0157 (0.0025)0.0163 (0.0022)4.8 (3.2)
Table 3. Comparison of four DOC models, with coefficients derived from unscaled predictor variables. Model fit parameters from training and primary testing datasets are also given.
ModelFixed EffectsRandom
Intercepts
AIC
(Train)
R2
(Train)
RMSE
(Test)
mg/L
R2
(Test)
MAE
(Test)
mg/L
rMAE
(Test)
%
Comprehensive
Mixed
0.0613 × a 254
− 282 × S275–295
− 0.169 × Salinity
+12.9
Date3540.973.10.912.417%
Comprehensive
Linear
0.0606 × a 254
− 1609 × S275–295
− 0.159 × Salinity
+33.0
3860.902.90.912.417%
Absorbance
Mixed
0.0625 × a 254
− 123 × S275–295
+7.38
Site, Date3630.973.80.893.323%
Absorbance
Linear
0.0779 × a 254
− 1217 × S275–295
+22.2
3970.883.30.882.820%
Table 4. ANOVA analysis of ∆DOC, ∆ a 254 , and ∆S275–295 from a 2 d exposure to natural sunlight; p-values < 0.05 are shown in bold. * indicates interactions between factors.
Response VariableFactorsdfF Valuep-Value
ΔDOCTreatment123.9<0.001
Date35.70.010
Site24.00.043
Treatment * Date30.40.764
Treatment * Site22.70.107
Δ a 254 Treatment1277.7<0.001
Date3145.0<0.001
Site27.50.007
Treatment * Date326.0<0.001
Treatment * Site20.60.557
ΔS275–295Treatment1761.2<0.001
Date3131.6<0.001
Site21.20.330
Treatment * Date342.8<0.001
Treatment * Site20.80.456
Table 5. ANOVA output for analysis of ∆DOC, ∆ a 254 , and ∆S275–295 during aging experiments; p-values < 0.05 are shown in bold. * indicates interactions between factors.
Response VariableFactorsdfF Valuep-Value
ΔDOCTreatment10.30.587
Date26.20.005
Site23.30.048
Treatment * Date20.90.404
Treatment * Site22.70.084
Δ a 254 Treatment13.60.065
Date281.4<0.001
Site220.0<0.001
Treatment * Date20.90.418
Treatment * Site20.50.619
ΔS275–295Treatment10.00.925
Date267.1<0.001
Site215.5<0.001
Treatment * Date22.80.073
Treatment * Site21.20.319
Table 6. Model fit statistics for measured versus predicted DOC of initial and final samples from incubation experiments. Calculated values were generated using the Comprehensive Linear model.
Experiment TypeTime PointR2RMSE
(mg/L)
rMAE
(%)
Aging Initial0.973.617
Aging Final0.944.119
Photochemical Initial0.972.39.5
Photochemical Final0.933.114
Disclaimer/Publisher’s Note: The statements, opinions and data contained in all publications are solely those of the individual author(s) and contributor(s) and not of MDPI and/or the editor(s). MDPI and/or the editor(s) disclaim responsibility for any injury to people or property resulting from any ideas, methods, instructions or products referred to in the content.