Article

Effect of Hydraulic Projects on the Phytoplankton Community Structure in the Mainstream of the Ganjiang River

Jiangxi Key Laboratory of Water Resources Allocation and Efficient Utilization, Jiangxi University of Water Resources and Electric Power, Nanchang 330099, China
*
Authors to whom correspondence should be addressed.
Water 2025, 17(21), 3126; https://doi.org/10.3390/w17213126
Submission received: 26 September 2025 / Revised: 28 October 2025 / Accepted: 29 October 2025 / Published: 31 October 2025
(This article belongs to the Special Issue Wetland Water Quality Monitoring and Assessment)

Abstract

To elaborate on the effects of hydraulic projects and physicochemical factors on the spatiotemporal distribution of phytoplankton communities, we monitored the phytoplankton communities and related water parameters in the Ganjiang River’s main channel over a five-year period. The survey revealed 65 species across six phyla, with Chlorophyta, Cyanophyta and Bacillariophyta as the most diverse groups. Phytoplankton abundance and biomass exhibited significant seasonal variations (p < 0.001), peaking in summer and autumn and reaching their lowest values in winter and spring. Spatially, phytoplankton abundance and biomass were not significantly different (p > 0.05), the abundance and biomass of Cyanophyta were higher in the two reservoir areas compared to the upstream sampling points. This suggests that the hydraulic projects altered the river’s flow and velocity, which led to a succession in phytoplankton community composition. Correlation analysis showed a strong positive association between the abundance and biomass of both Cyanophyta and Chlorophyta and water temperature (p < 0.001), but showed a significant negative relationship with nitrogen (p < 0.05). In contrast, Bacillariophyta abundance and biomass were positively and significantly correlated with ammonium nitrogen (p < 0.05). Redundancy analysis confirmed that water temperature and nitrogen are the primary environmental variables influencing the phytoplankton community’s succession. The direct alteration of river hydrodynamic characteristics by hydraulic projects, coupled with the reservoir-induced water stratification and its influence on vertical water temperature distribution, ultimately results in the profound reshaping of the phytoplankton community structure through coupled effects with nitrogen cycling. The findings from this study can scientifically inform the ecological scheduling, water quality management and water supply security of the Ganjiang River basin’s cascade reservoirs.

1. Introduction

Phytoplankton play a vital role in maintaining the stability and integrity of aquatic ecosystems by driving energy flow, material balance and biodiversity through their primary production, nutrient cycling and foundation of the food web [1,2]. The abundance, biomass, diversity indices, seasonal succession and stability of these communities are intimately linked to the physicochemical factors. Their species composition, succession patterns and biodiversity traits serve as significant bioindicators of environmental changes [3]. As such, they are frequently employed to assess the properties of water bodies such as rivers and reservoirs, becoming a focal point in aquatic ecology research. Facing growing global energy needs and difficulties in water management, the establishment of cascade reservoirs has become a pivotal approach to water utilization [4,5]. Since helps guarantee a consistent electricity supply, aids in flood mitigation, expands irrigated land and improves navigation, these large-scale hydraulic projects have been shown to profoundly impact aquatic environments [6,7]. However, the construction of cascade reservoirs alters natural river flow regimes and influences hydrological and hydrodynamic conditions, such as reducing flow velocity and prolonging water residence times. These changes inevitably affect the geochemical cycling of elements in the river’s headwaters [8,9]. Reservoirs sequester phosphorus (P) more effectively than nitrogen (N), leading to a reduced P/N ratio and the exacerbation of the disruption of nutrient cycles worldwide [10]. As a result, reservoirs are often considered to have detrimental effects on nutrient regulation, diminishing primary productivity in downstream areas, as well as fish yields and food security [11,12]. Hydraulic projects modify physicochemical factors (e.g., water temperature, light penetration and nutrient availability), which is intrinsically linked to the resulting changes in phytoplankton community succession [13]. However, the long-term or cumulative effects of reservoir construction on the diversity, abundance, and seasonal dynamics of phytoplankton communities remain not yet fully understood.
As a primary tributary of the Yangtze River, the Ganjiang River is the main river within the Poyang Lake water system. Originating in the Wuyi Mountains on the Fujian-Jiangxi border (26°38′ N, 116°18′ E), its 766 km main channel flows north through 11 county-level and above administrative regions before discharging into Poyang Lake, north of Nanchang City. The river’s basin forms a 80,900 km2 fan-shaped water network, encompassing 54% of Jiangxi’s land area and 49.9% of the Poyang Lake catchment. This makes the basin a pivotal component of the province’s ‘one lake, five rivers’ ecological framework [14,15,16]. The Ganjiang basin is home to numerous water conservancy facilities, including the Wan’an, Jinggangshan, Shihu Tang, Xiajiang, Xingan, Longtoushan and Nanchang hydraulic projects. Among these, the Wan’an and Xiajiang projects are the two most substantial, providing essential services such as flood control, navigation, irrigation and reservoir aquaculture for the river’s middle and lower reaches. These large-scale facilities yield significant comprehensive benefits in both water conservation and hydropower. Given that the Ganjiang River is the primary water source for industrial, agricultural and domestic use in surrounding cities, its water quality is of paramount concern [17]. Given that hydraulic project construction alters riverine environments, causing shifts in physicochemical factors and subsequent changes to phytoplankton communities, this study investigates the phytoplankton community structure and environmental factors in and around the Wan’an and Xiajiang reservoirs. This study has two particular objectives: (1) to determine the community structure and succession characteristics of phytoplankton, focusing on their species composition, abundance and biomass; and (2) to analyze the relationships between phytoplankton and physicochemical factors.

2. Material and Method

2.1. Study Area and Sample Site Selection

The study was conducted at the Xiajiang and Wan’an Hydraulic Projects within the Ganjiang River basin, the construction began in December 1988. The Wan’an Hydraulic Project on the middle reaches of the Ganjiang River, is located in Wan’an County, Ganzhou City, Jiangxi Province (26°30′ N, 114°50′ E). The project’s catchment area, covering 36,900 km2, is predominantly hilly and mountainous, with a surface area of 369 km2 is covered by water. The reservoir has a total capacity of 2.2 billion m3 and an average annual inflow of approximately 29.9 billion m3, its maximum depth is 70 m. Situated in a subtropical monsoon climate, the region receives an annual average precipitation of 1600 mm, with most rainfall occurring between April and September, the mean annual temperature is 18.5 °C. The Wan’an Hydraulic Projects is a multipurpose project primarily for power generation, with secondary functions in navigation and flood control. Its single-stage lock system, which features a maximum head of 32.3 m—the highest in China—has notably improved navigation along the middle and upper reaches of the Ganjiang River. The Xiajiang Hydraulic Project on the middle reaches of the Ganjiang River, is situated in Xiajiang County, Ji’an City, Jiangxi Province (27°15′ N, 115°10′ E). Initiated in September 2009, the project area encompasses 62,700 km2 of predominantly hilly and mountainous terrain, along with 145 km2 of water bodies. The reservoir, with a total capacity of 1.2 billion m3, receives an average annual inflow of approximately 51.8 billion m3, its maximum depth is 50 m. The Project is a multipurpose facility focused on flood control, power generation and navigation, with secondary functions including irrigation and other integrated uses. Situated in a subtropical monsoon climate, the region receives an annual average precipitation of 1600 mm, with most rainfall occurring between April and September, the mean annual temperature is 18.5 °C. Its single-line, single-stage lock system with a design head of 15.7 m has enhanced navigation on the middle reaches of the Ganjiang River and improved flood defense for Nanchang City [14,18].
Sampling was conducted at the Wan’an and Xiajiang Hydraulic Projects within the Ganjiang River basin. For each project, samples were collected from three locations: upstream (SN1, SN4), within the reservoir (SN2, SN5) and downstream (SN3, SN6). SN7 as a point affected by water control structures and human activities (Figure 1). To account for seasonal variations in the water system’s ecology, sampling of phytoplankton community structure and water environmental characteristics occurred quarterly from 2019 to 2023. Sampling months were winter (January), spring (April), summer (July) and autumn (October).

2.2. Sample Collection and Analysis

Water temperature (WT), pH and transparency (SD) were measured using a YSI 6600 V2 multiparameter water quality monitor (YSI Inc., Yellow Springs, OH, USA) and a Secchi disk (Fushun Bright Science and Technology Co., Ltd., Liaoning, China). Subsequent analysis of chemical oxygen demand (CODMn), total nitrogen (TN), total phosphorus (TP), phosphate (PO43−-P), nitrate (NO3-N) and ammonium nitrogen (NH4+-N) was performed according to [19].
Surface water samples (0.5 m below the water surface), mid-water, and bottom water samples (0.5 m above the bottom) were collected using a 5 L acrylic water sampler (Fushun Bright Science and Technology Co., Ltd., Liaoning, China). The samples were then subjected to a process of amalgamation, with 1 L of the composite water sample being allocated for the analysis of phytoplankton. Phytoplankton samples were preserved using 1% (v/v) Lugol’s solution (Sinopharm Chemical Reagent Co., Ltd., Shanghai, China), following which they were left to settle for a period of 48 h. The supernatant was then carefully aspirated using a small siphon, and the concentrated sample was adjusted to a final volume of 30 mL. After thorough homogenization of the concentrated sample, a 0.1 mL subsample was precisely transferred into a phytoplankton counting chamber [20]. Enumeration was performed under an Olympus BX51 upright optical microscope (Olympus Corporation, Tokyo, Japan) at a magnification of 40× across 100 randomly selected fields of view. Each collected sample was subjected to two independent sub-samplings and counts. The counting result was deemed acceptable and reliable only if the relative difference between the two counts and their mean was within ±15%. If this criterion was not met, the sub-sampling and counting process was repeated [21]. Finally, the total phytoplankton abundance was calculated using the appropriate formula derived from the accepted count [22].
N = n × (A × Vs)/(Ac × Va)
N denotes the density of phytoplankton in the raw water sample (cells/L); n denotes the number of phytoplankton counted (cell); A denotes the area of the counting frame (mm2); Ac denotes the total counting area (mm2), equal to the field of view area multiplied by the number of fields counted; Vs represents the volume (mm3) obtained after concentrating and settling 1 L of water sample; Va denotes the volume (mm3) of the counting frame.

2.3. Statistical Analysis

To assess the impact of physicochemical factors on phytoplankton, we performed one-way ANOVA to test for significant variations in the mean abundance, biomass and physicochemical factors across years, seasons and cross-sections. Pearson correlation analysis was conducted to determine the significance of the relationship between phytoplankton and physicochemical factors. Furthermore, a redundancy analysis (RDA) was performed to evaluate the influence of physicochemical factors on phytoplankton taxonomic and functional groups. The “vegan” package in R (v4.5.0) was used for all statistical procedures, with the specific methods following [23]. The choice between Canonical Correspondence Analysis (CCA) and RDA was determined by a preliminary Detrended Correspondence Analysis (DCA). CCA was utilized when the DCA gradient exceeded 4.0, whereas RDA was selected for a gradient value below 3.0. Before conducting either analysis, a Hellinger transformation was applied to the data to ensure normal distribution [24]. For the CCA or RDA, we selected dominant phytoplankton species based on a biomass contribution exceeding 1% [25]. Biomass is a critical metric for evaluating the functional role of phytoplankton in ecosystems, particularly concerning energy and material transfer. Previous research has shown that biomass provides a more accurate reflection of ecological significance than cell count [26]. Through this selection process, 19 species were identified, accounting for 89.99% of the total biomass. These analyses were performed using the stats package in R.

3. Results

3.1. Physicochemical Factors

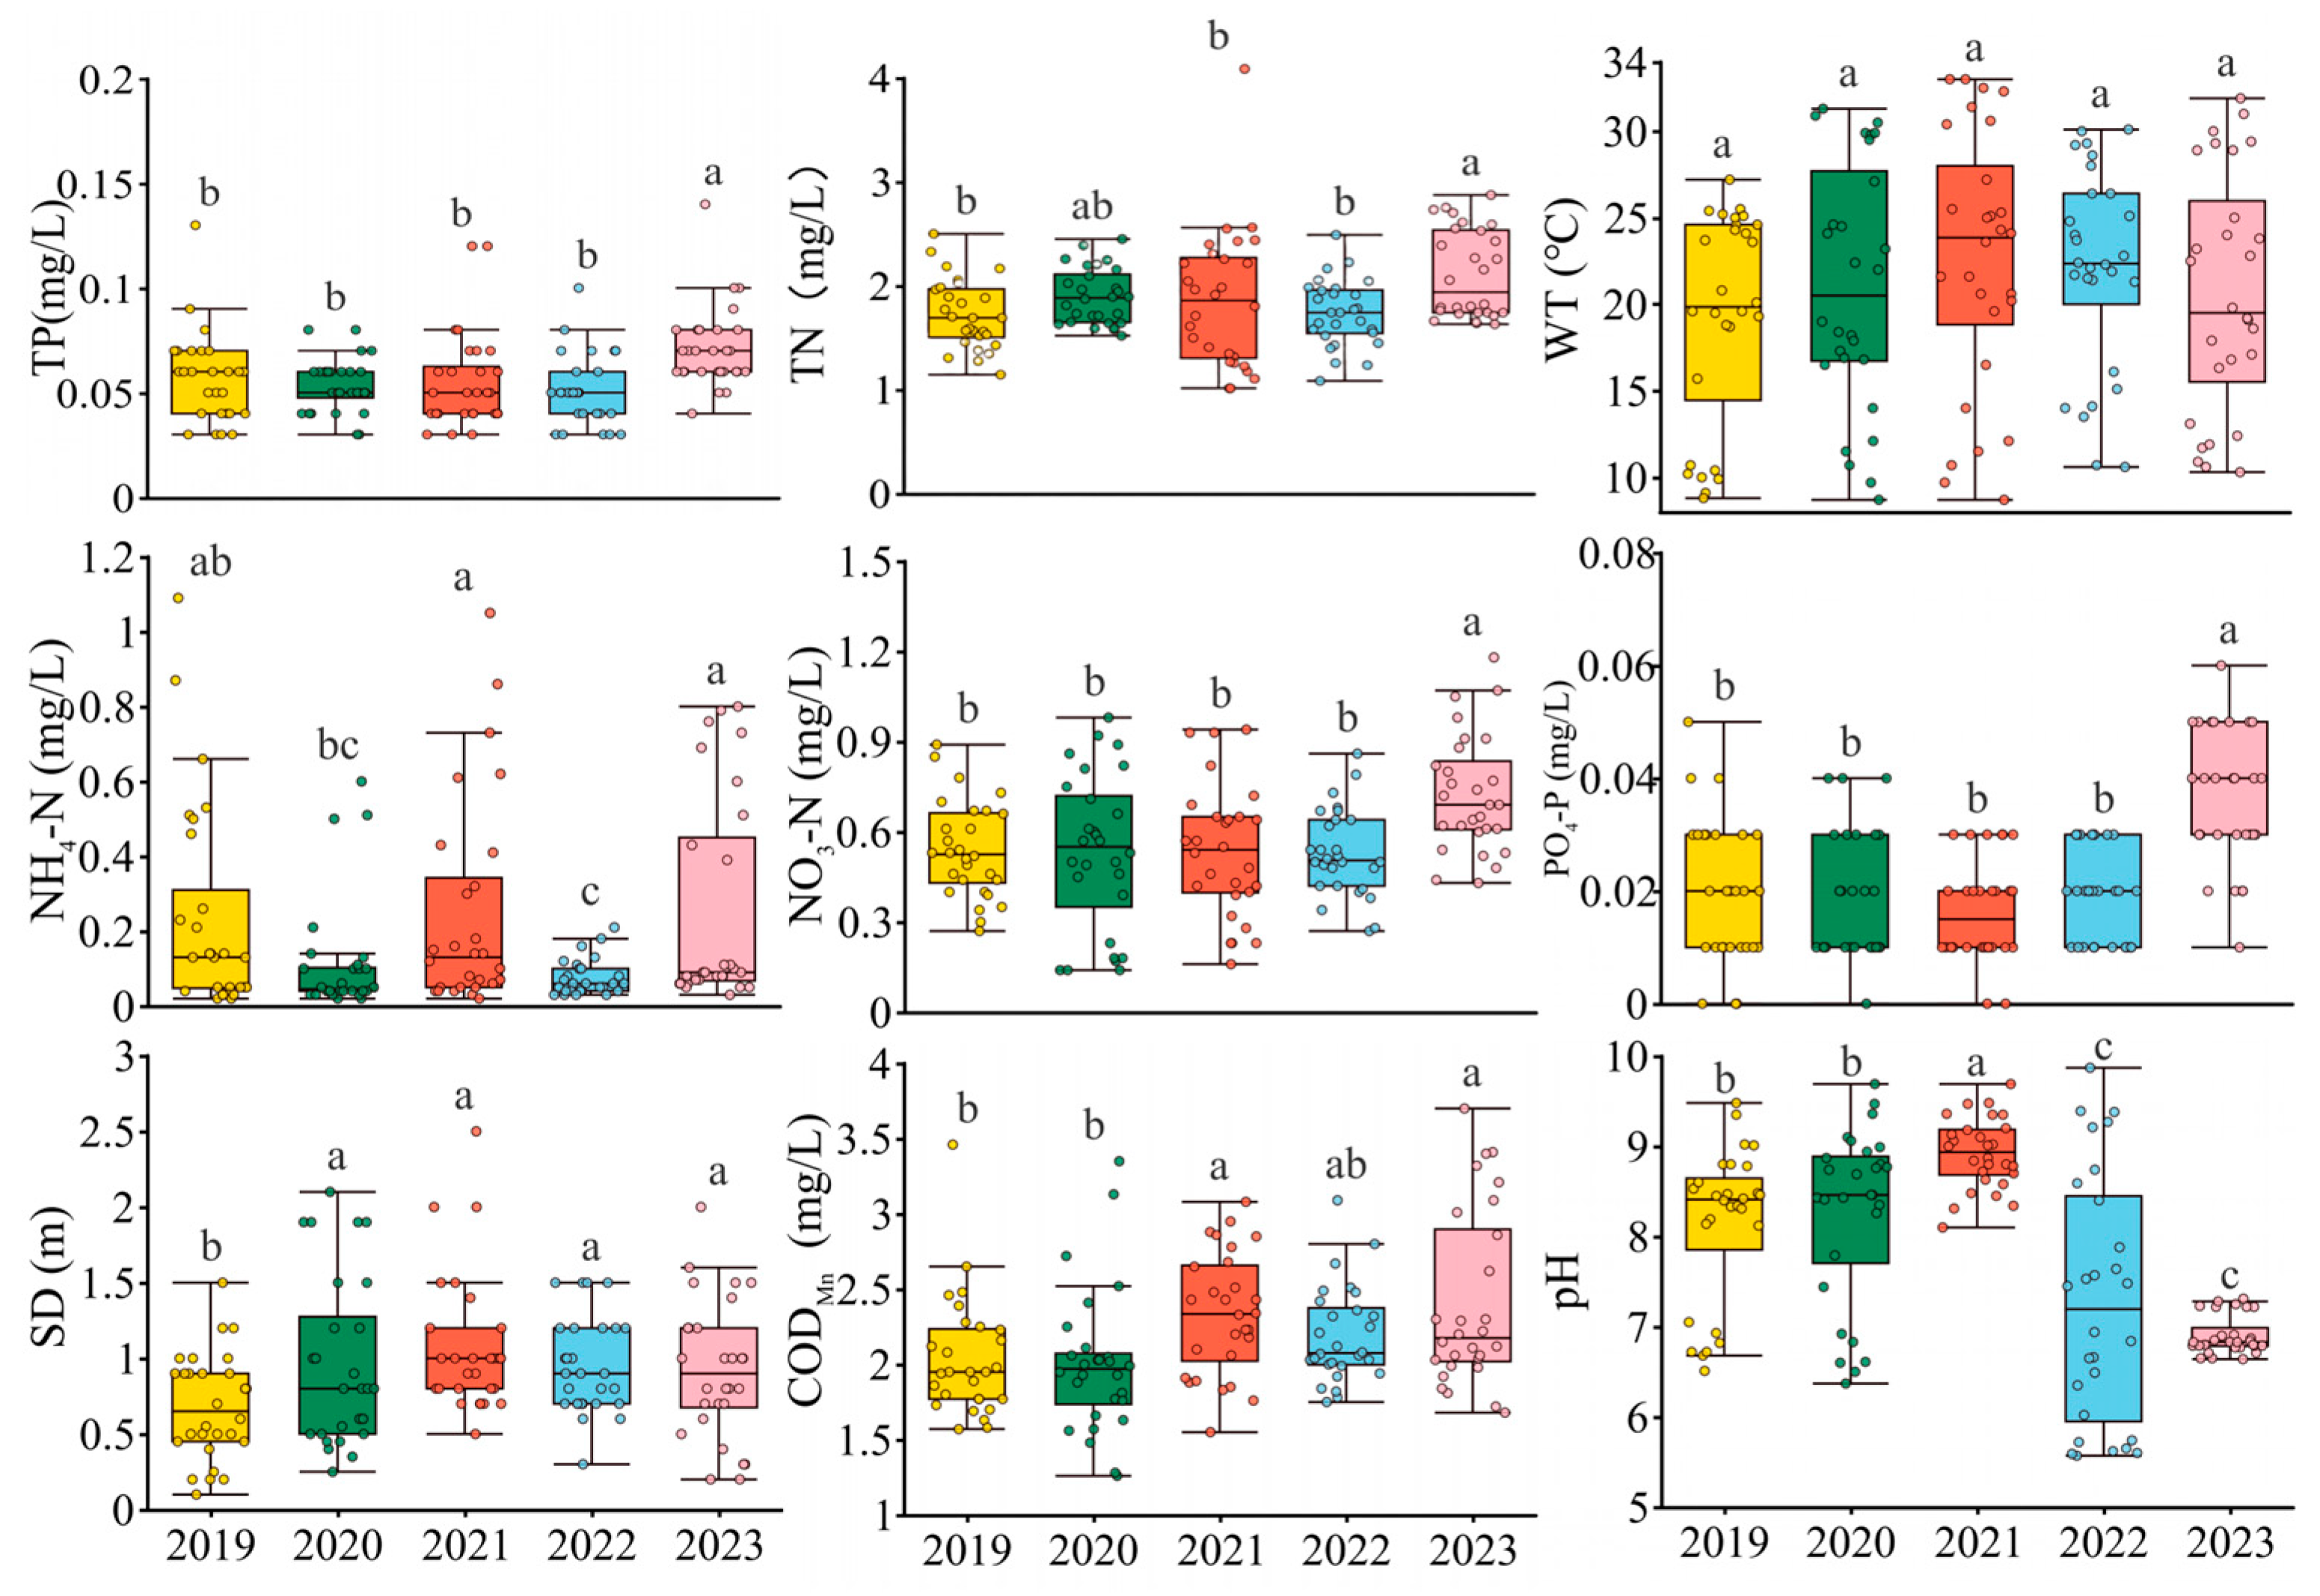
ANOVA of the physicochemical factors revealed significant interannual variations in water quality parameters (Figure 2). TN, TP, NO3-N and PO43−-P concentrations showed no significant variation from 2019 to 2022 but increased markedly in 2023, reaching average concentrations of 1.90 mg/L, 0.07 mg/L, 0.72 mg/L and 0.04 mg/L, respectively. NH4+-N concentrations were significantly lower in 2020 and 2022 compared to other years. Water pH first increased from 8.14 in 2019 to a peak of 8.92 in 2021 before declining sharply to a significantly lower value of 6.90 in 2023. SD was significantly lower in 2019 than in subsequent years but increased substantially from 2020 onwards, remaining at a relatively high level of 0.93–1.08 m from 2020 to 2023.
ANOVA of physicochemical factors revealed significant seasonal variations in water quality parameters (Figure 3). TN and NH4+-N concentrations were notably elevated in winter and spring compared to summer and autumn. TP and NO3-N concentrations both peaked in spring, reaching 0.07 mg/L and 0.74 mg/L, respectively, while PO43−-P concentrations were significantly lower in summer, at 0.015 mg/L. WT showed significant seasonal variation, with a minimum of 11.73 °C in winter, a progressive increase to 19.63 °C in spring, a peak of 28.83 °C in summer, and a subsequent decline to 24.13 °C in autumn. The CODMn index was significantly higher in summer compared to autumn and winter. SD was significantly lower in spring at 0.66 m, while pH showed no significant seasonal differences.
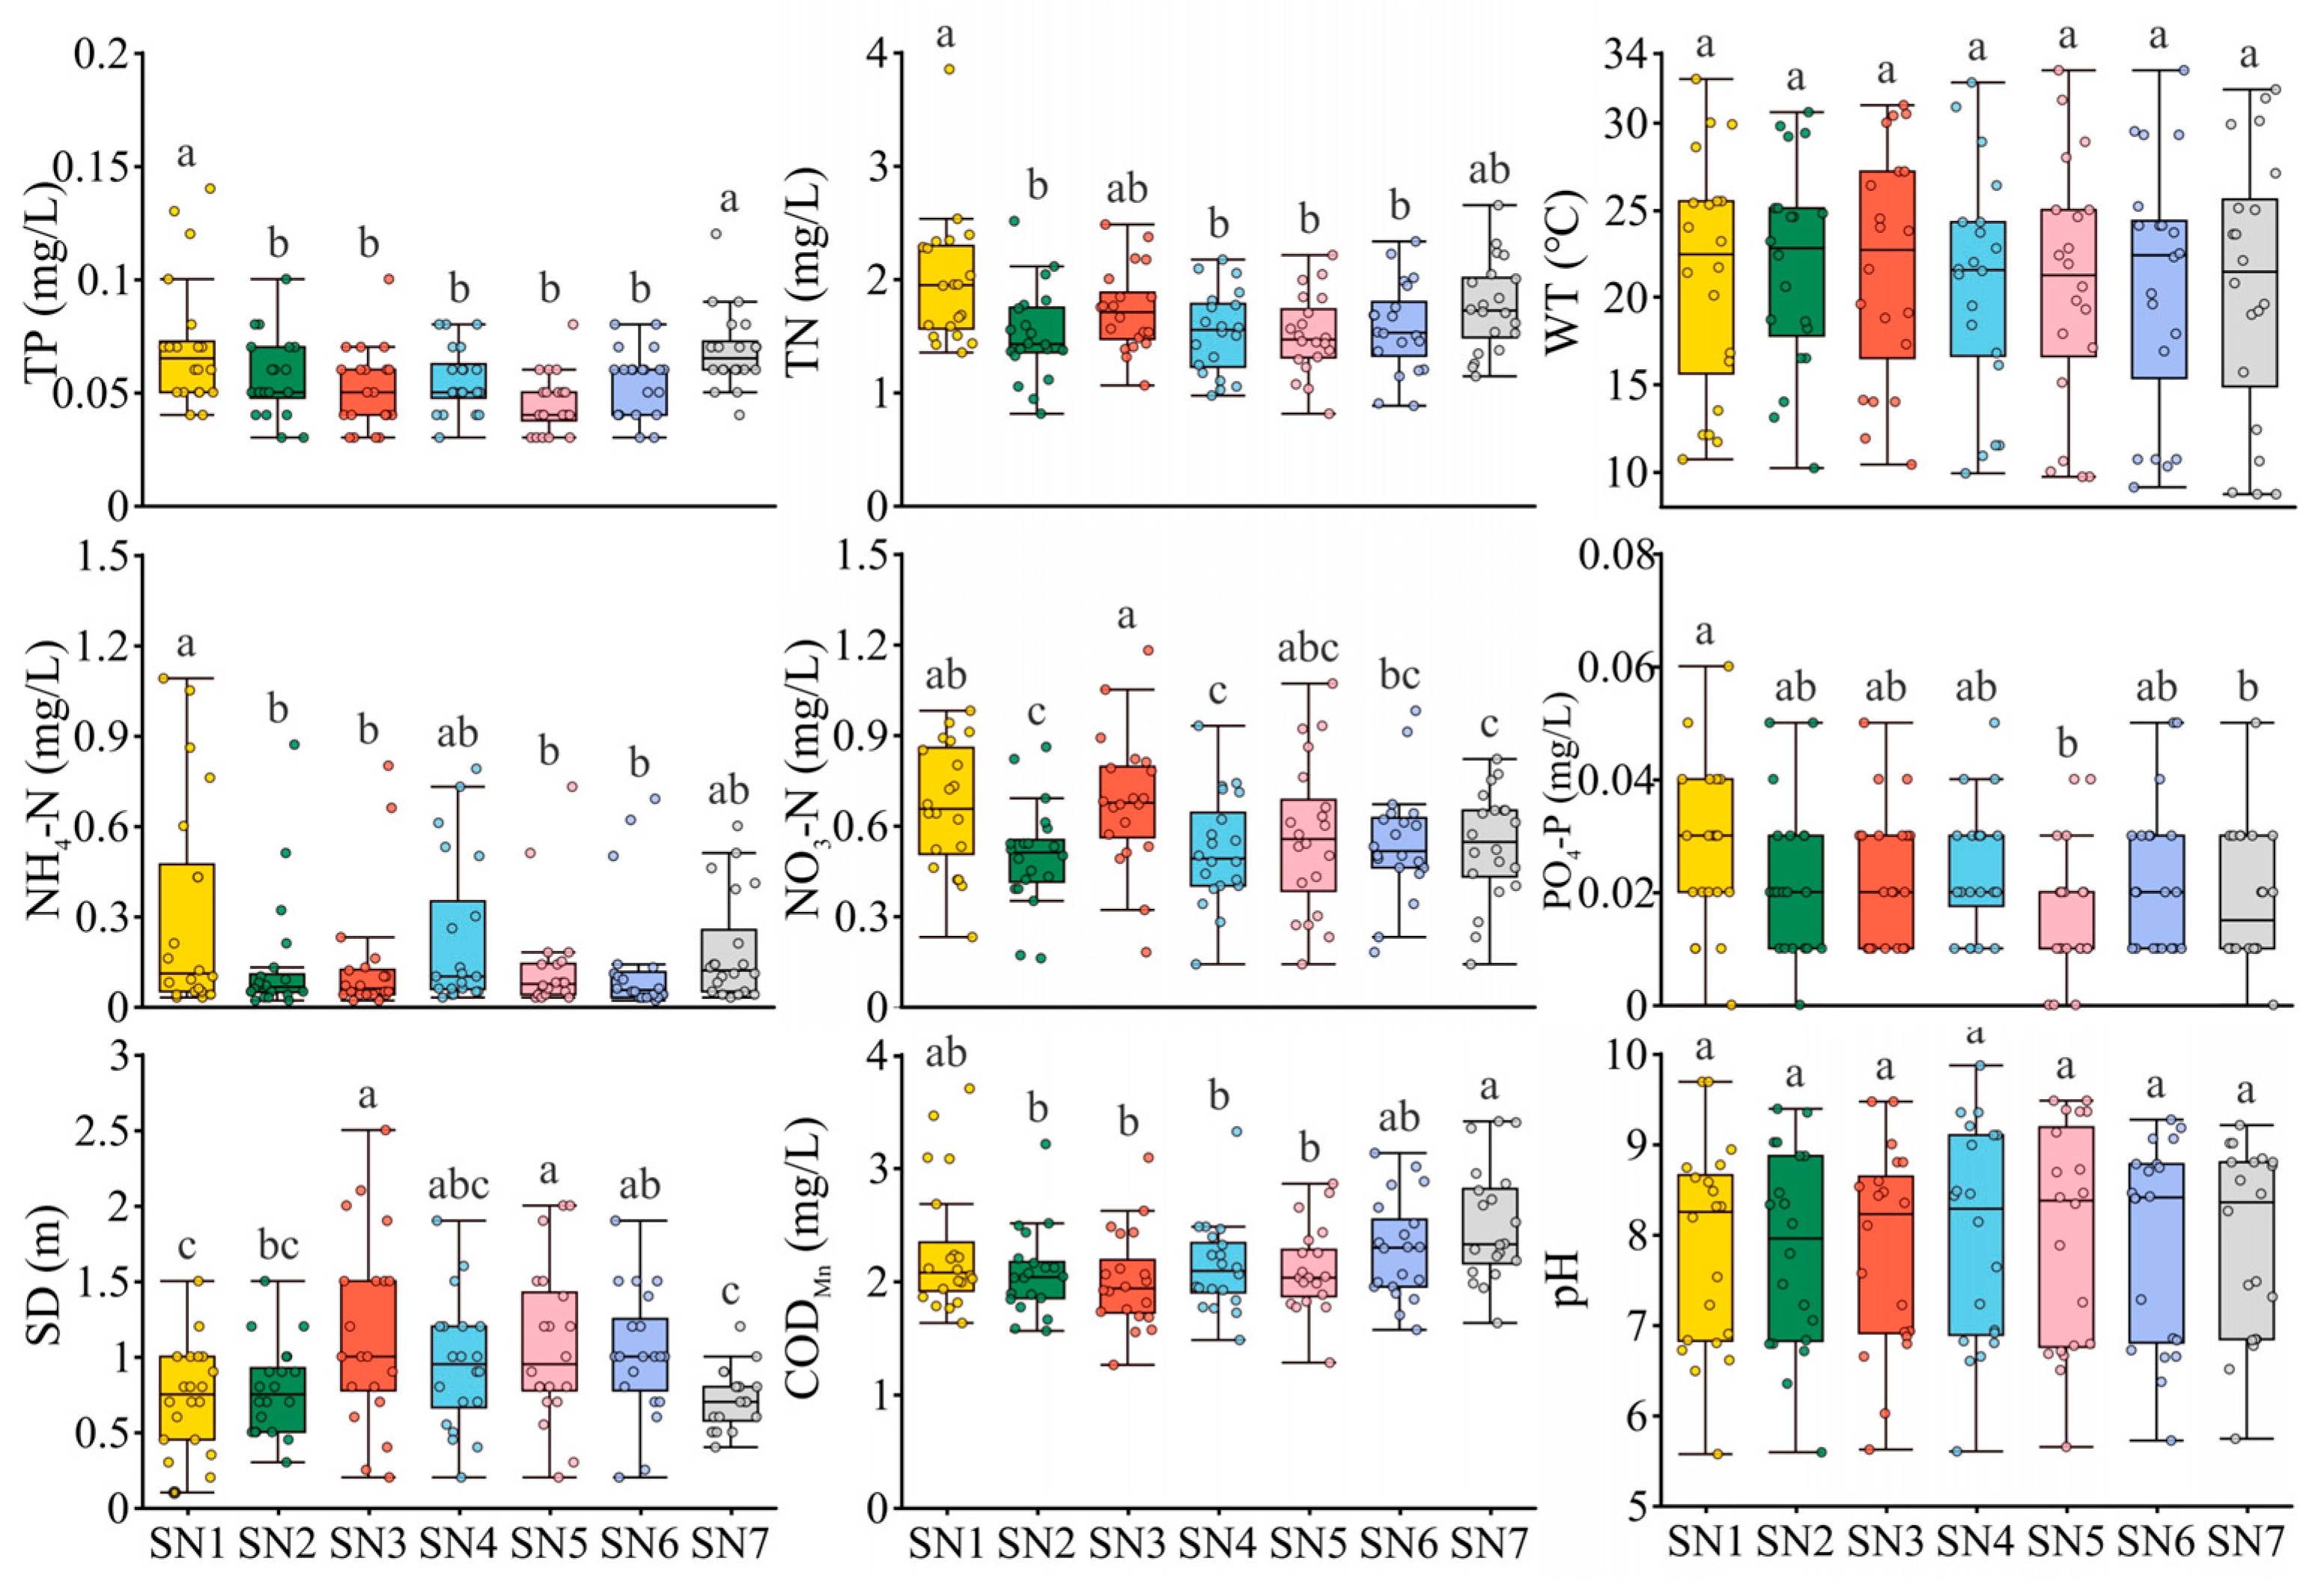
ANOVA of physicochemical factors revealed significant spatial variations in water quality parameters across monitoring sections (Figure 4). TP concentrations were significantly higher at SN1 (reservoir upstream) and SN7 (urban river section) compared to other sections. TN, NH4+-N, and NO3-N concentrations were all significantly higher at SN1 than at SN2 (reservoir). SD showed a significant increase at SN3 (downstream) but a substantial decrease at SN7. WT and pH did not vary significantly across the monitoring sections.

3.2. Phytoplankton Composition

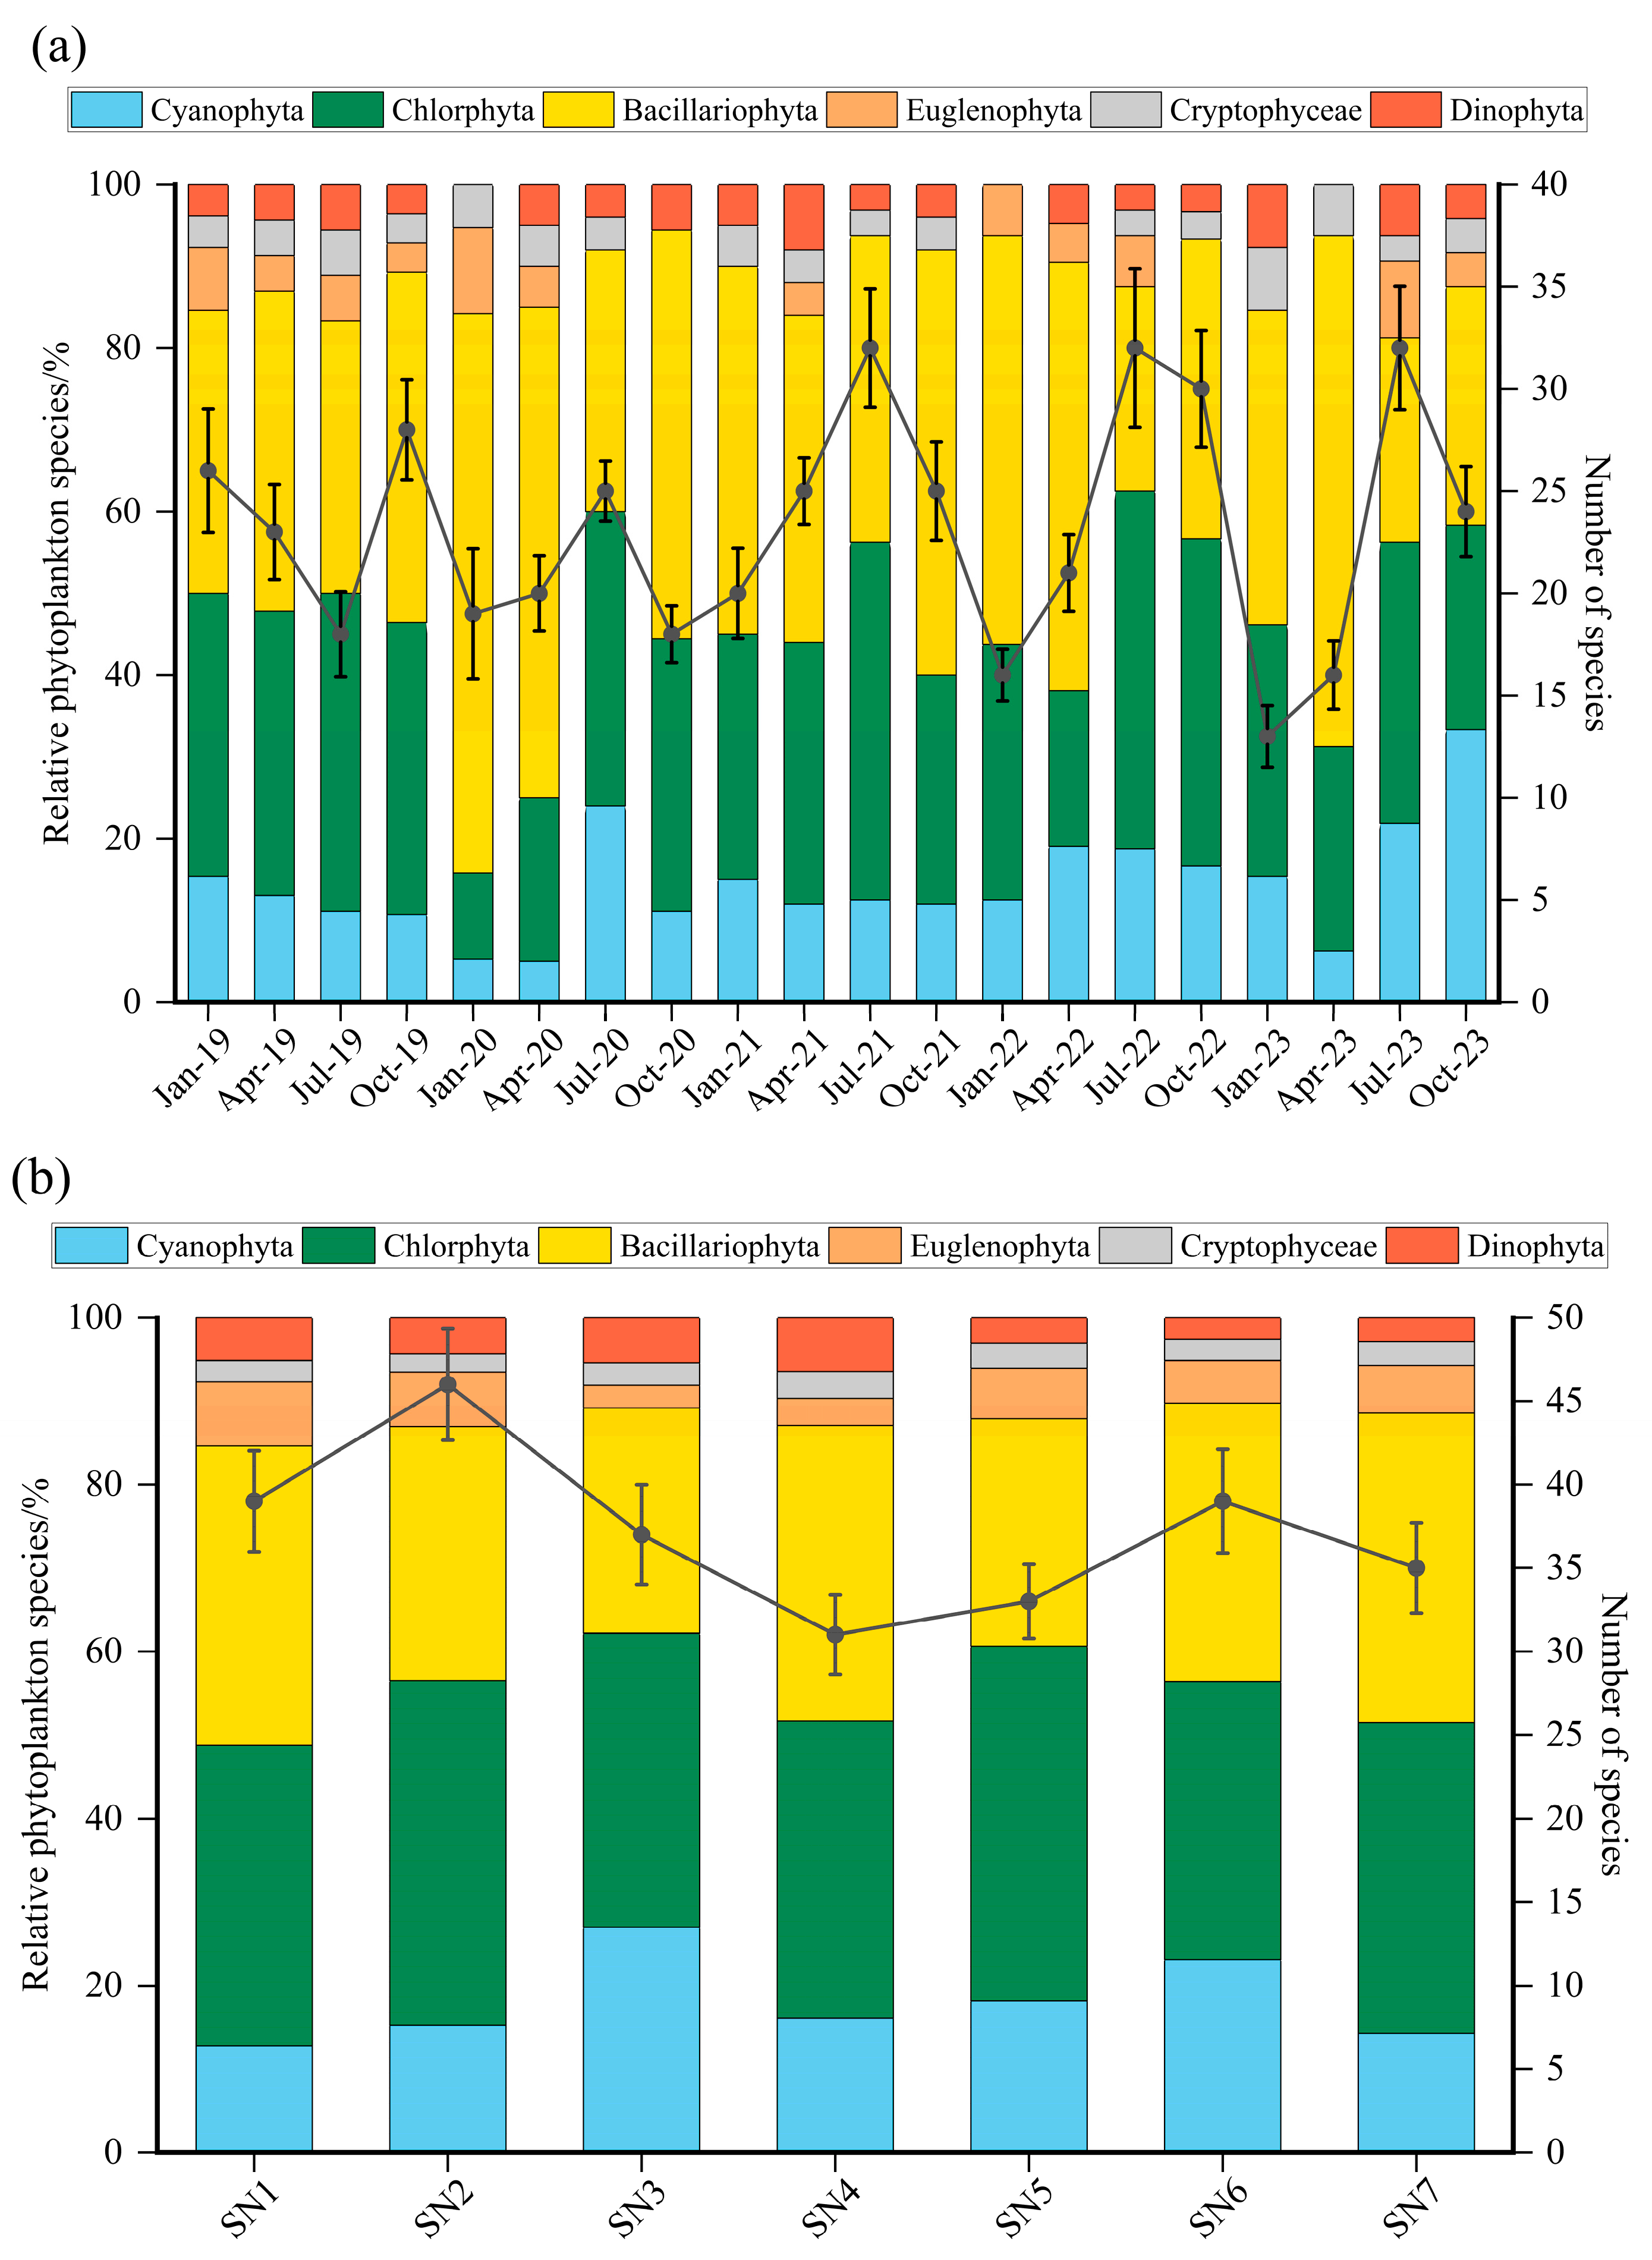
During the survey, phytoplankton species identified totaled 65 and represented 6 phyla (Table S1): Chlorophyta (28), Bacillariophyta (17), Cyanophyta (11), Euglenophyta (5), Dinophyta (3) and Cryptophyceae (1), accounting for 43.08%, 26.15%, 16.92%, 7.69%, 4.62%, and 1.52% of the total species, respectively. Phytoplankton species richness showed significant seasonal variation (p < 0.001; Figure S1a), from 2020 to 2023, summer had the highest species richness, with an average of 32 species, while winter had the lowest, with only 13 species recorded in winter 2023. The proportion of Bacillariophyta species continuously declined from winter to summer, with averages of 47.30% and 30.57%, respectively. Conversely, the proportions of Cyanophyta and Chlorophyta species continuously increased, from winter averages of 12.71% and 27.43% to summer averages of 17.65% and 39.35%. The proportions of all phyla tended toward equilibrium in autumn (Figure 5a).
Furthermore, spatial variation in phytoplankton species richness was highly significant (p < 0.05; Figure S1b). Species richness was generally higher within the reservoir area (SN2, SN5) than at upstream sites (SN1, SN4). Downstream sites (SN3) generally showed lower species richness than reservoir sites (SN2), while some downstream points (SN6) exhibited higher richness than neighboring reservoir points (SN5). Species richness at SN7, a downstream site further from the hub, was lower than at adjacent downstream sites (SN6). Regarding species composition, upstream sites (SN1, SN4) were dominated by Bacillariophyta and Chlorophyta, which accounted for the highest and similar proportions (e.g., SN1: 35.90% for both; SN4: 35.48% for both), followed by Cyanophyta (SN1: 12.82%; SN4: 16.13%). Upon entering the reservoir (SN2, SN5), a rapid shift to Chlorophyta dominance was observed, with a significant increase in its proportion (SN2: 41.30%; SN5: 42.42%). Concurrently, the proportion of Cryptophyceae increased (SN2: 15.22%; SN5: 18.18%), while Bacillariophyta experienced a precipitous decline (SN2: 30.43%; SN5: 27.27%). Downstream at SN3, Bacillariophyta dominance continued to decline to 27.03%, yet it recovered to 33.33% at the further downstream SN6. Concurrently, Cyanophyta showed a steady increase at these downstream sites (SN3: 27.03%; SN6: 23.08%), while Chlorophyta declined (SN3: 35.14%; SN6: 33.33%). At the most remote site, SN7, the community was co-dominated by Chlorophyta and Bacillariophyta (each at 37.14%), with Cyanophyta comprising only 14.29% (Figure 5b).

3.3. Seasonal Variation in Phytoplankton

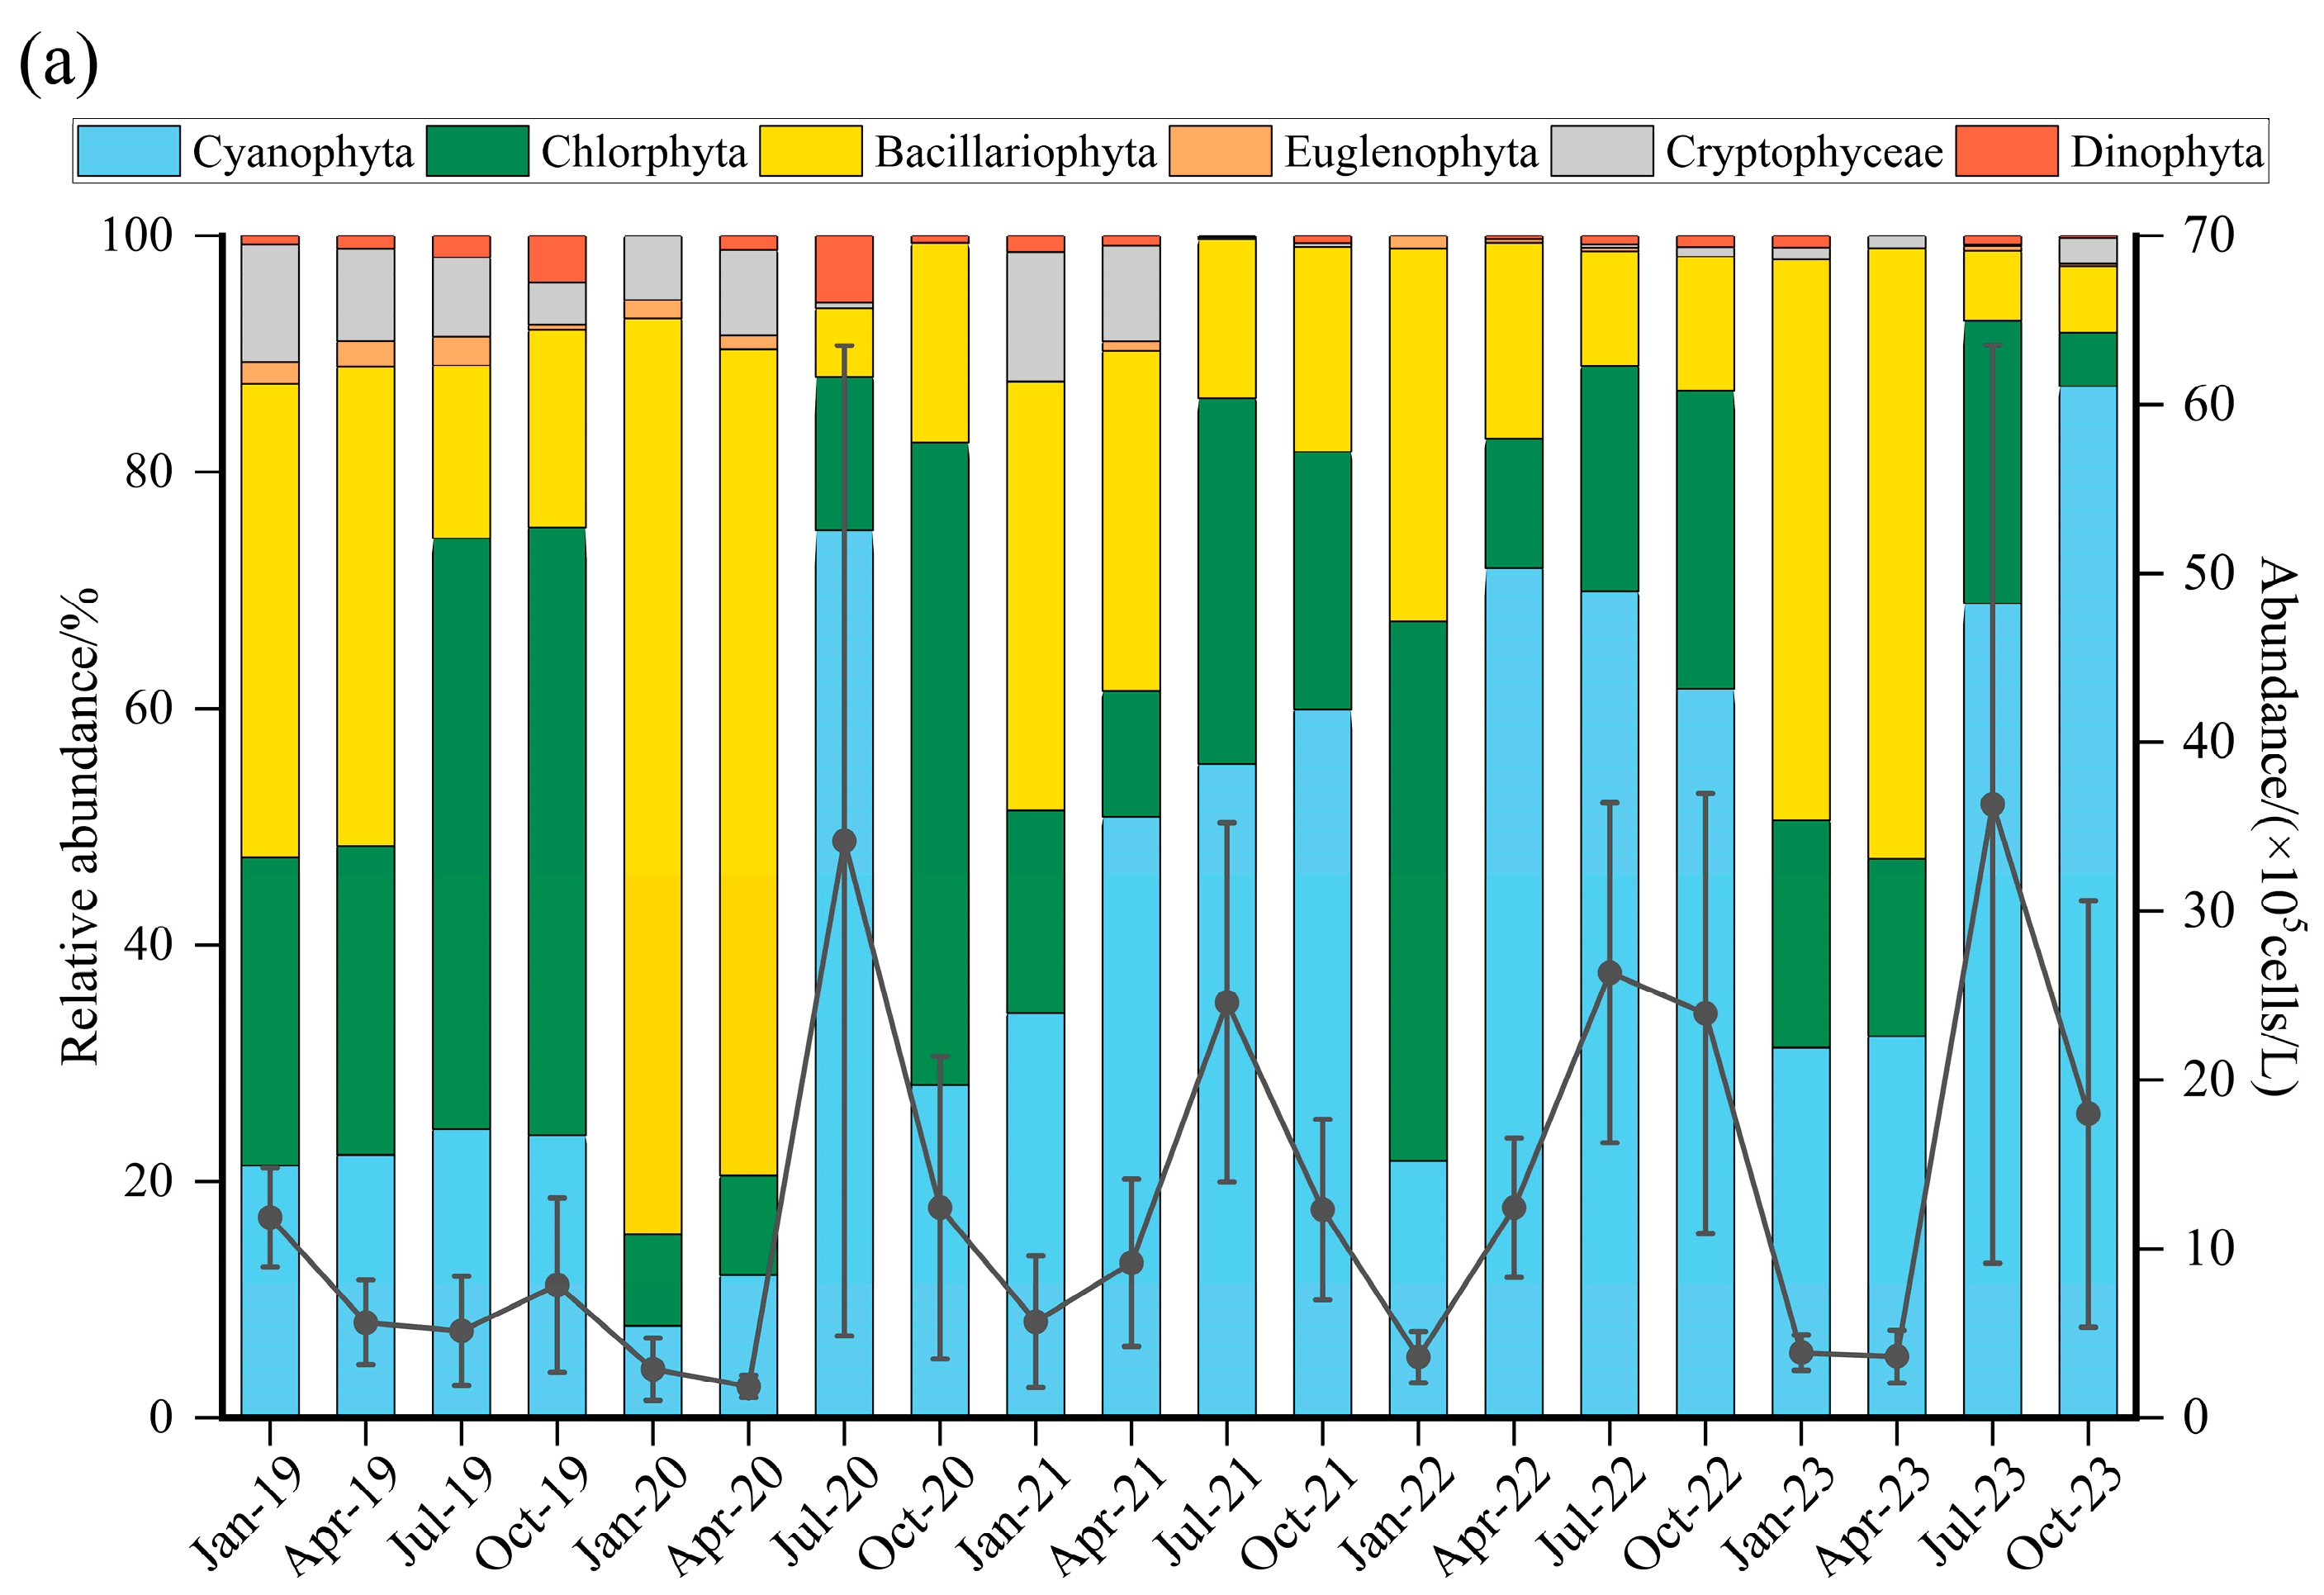
Phytoplankton abundance exhibited significant seasonal variation (p < 0.001; Figure S2a). During the survey period from 2019 to 2023, abundance ranged from 1.85 × 10⁵ to 36.33 × 10⁵ cells/L, with a mean of 13.08 × 10⁵ cells/L. Except for 2019, phytoplankton abundance was significantly higher in summer and autumn compared to winter and spring. In terms of community composition, Cyanophyta, along with Chlorophyta, comprised the dominant groups in the summer and autumn assemblages. Their combined maximum abundance reached 92.83% in summer 2023. In spring, a significant increase in Bacillariophyta abundance was observed, making it a co-dominant group alongside Cyanophyta and Chlorophyta. By the subsequent summer and autumn, Cyanophyta had become the absolute dominant group, showing a gradual increase in abundance that peaked at 87.26% in autumn 2023 (Figure 6a).
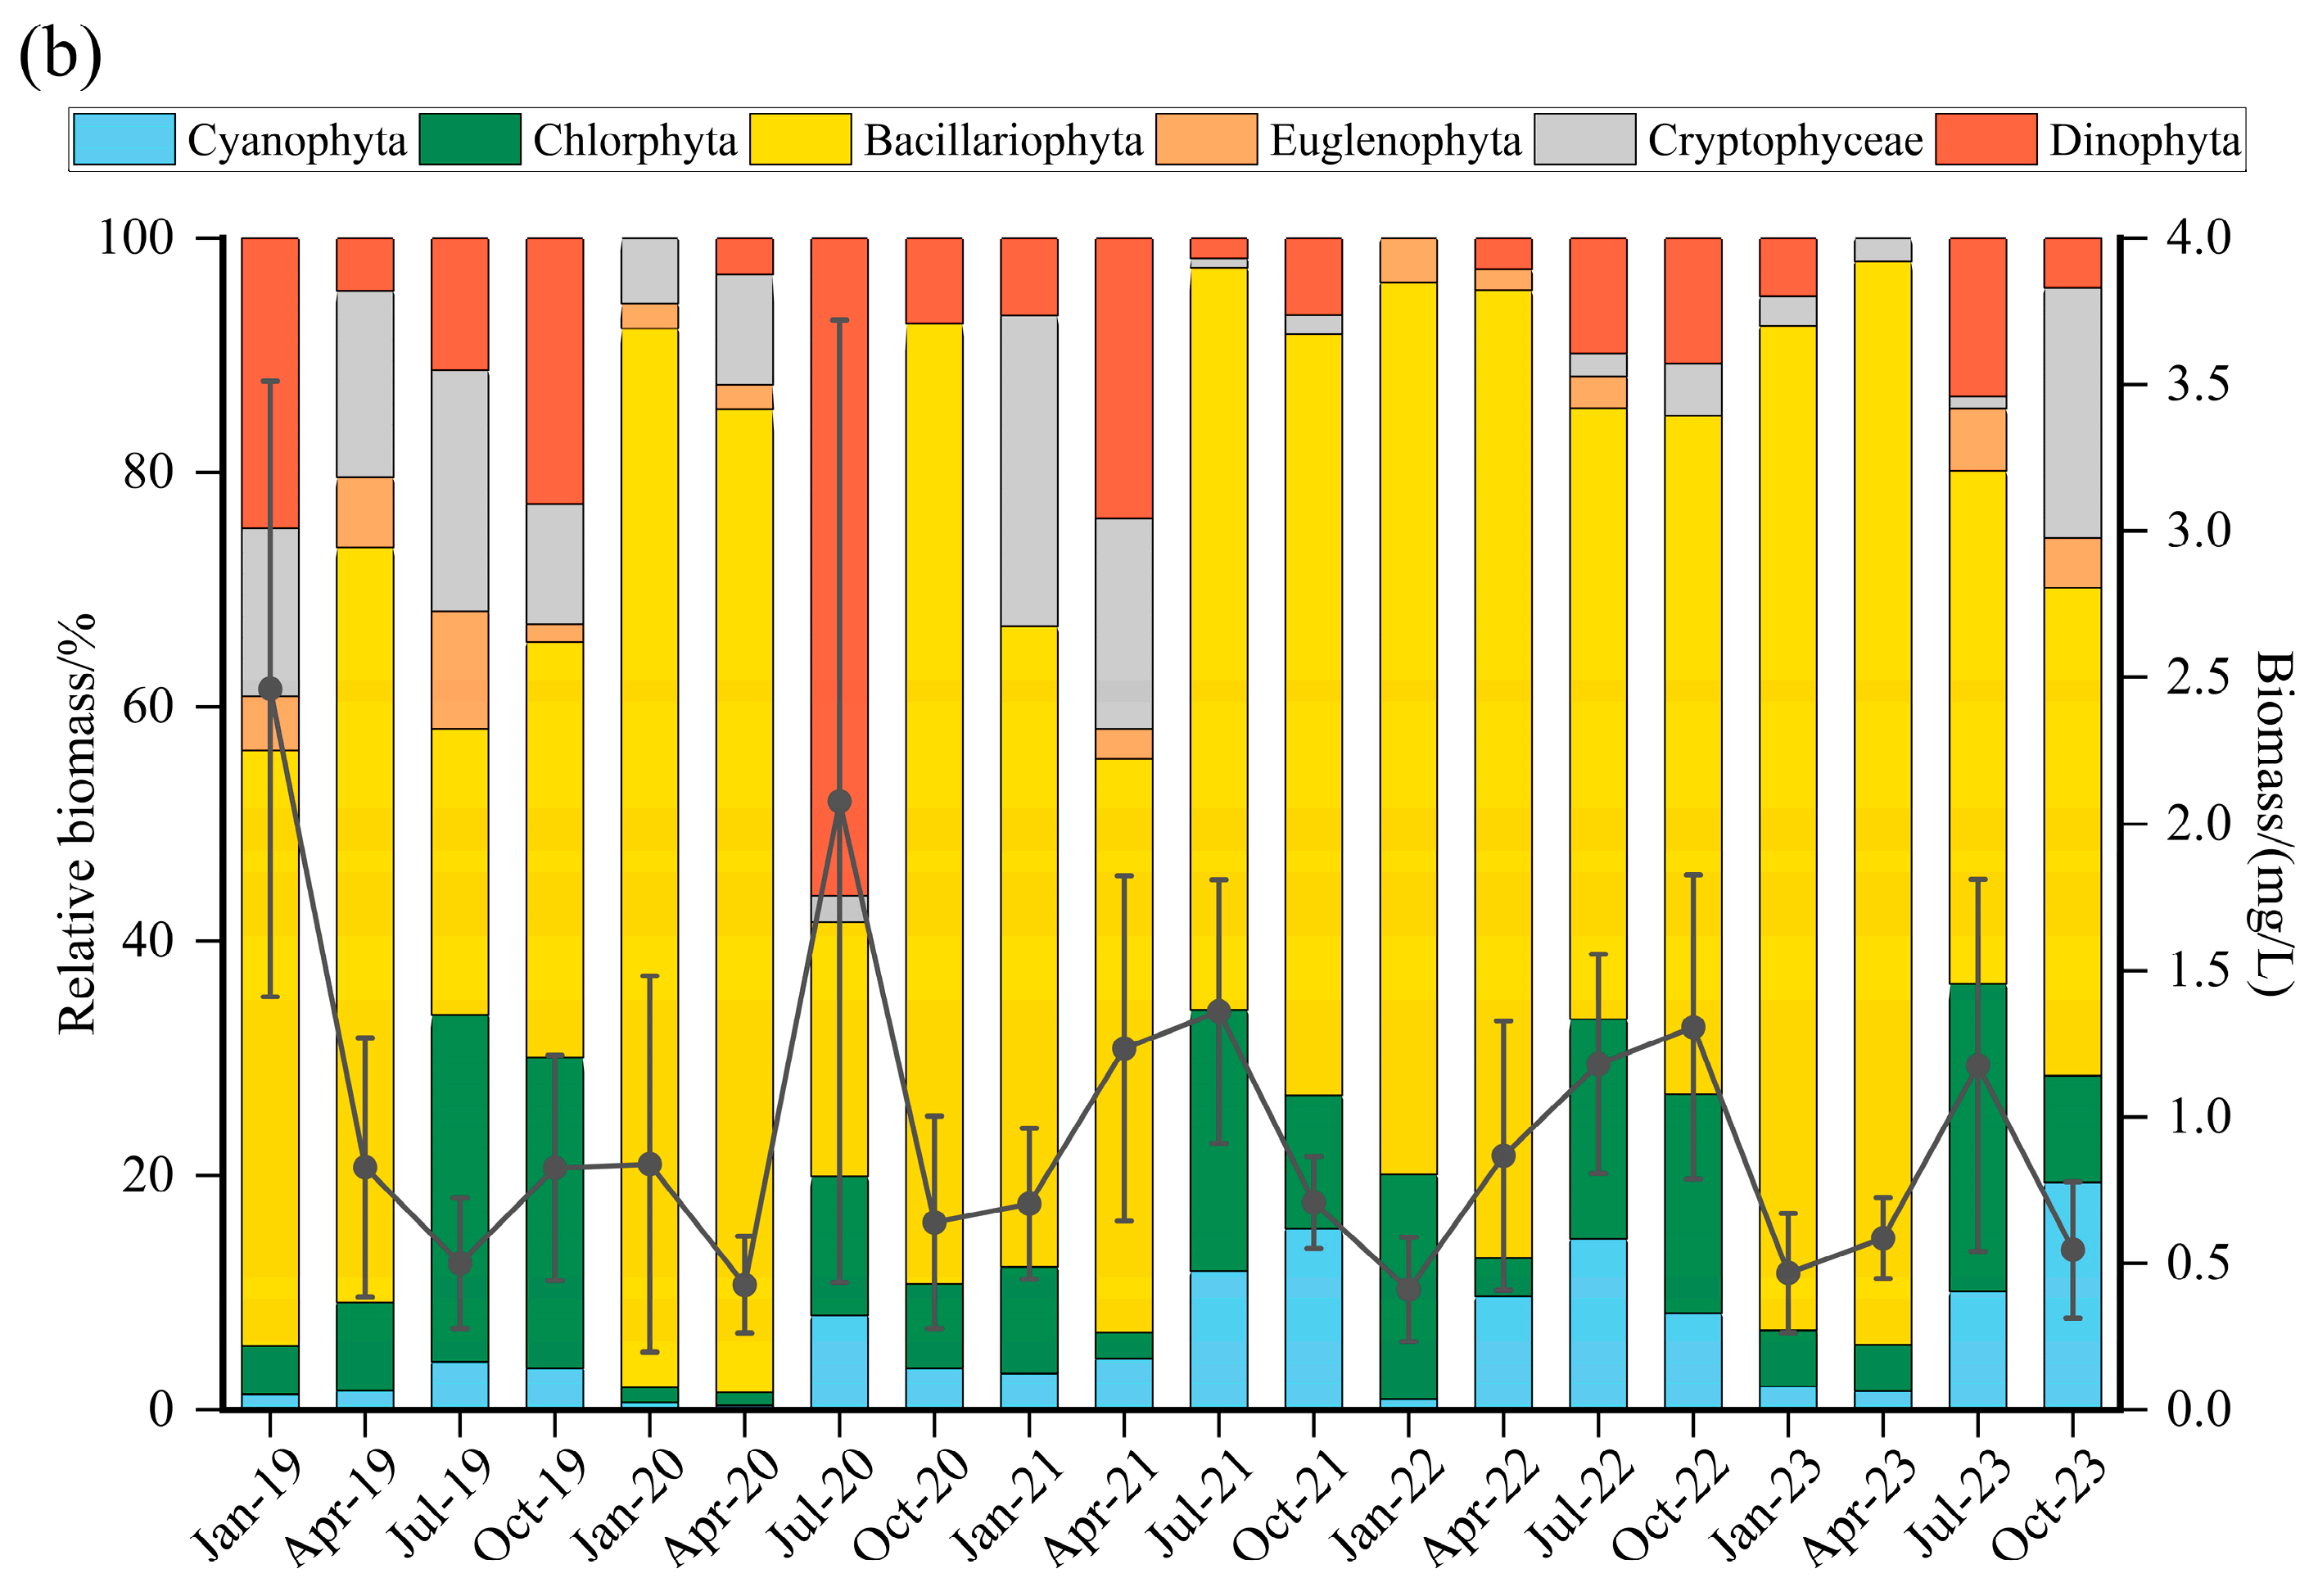
Phytoplankton biomass exhibited significant seasonal variation (p < 0.001; Figure S2b). Over the survey period, biomass ranged from 0.41 to 2.46 mg/L, with a mean value of 0.96 mg/L. Bacillariophyta was the main contributor to biomass, comprising an average of 60.86% of the total. The biomass proportion of Dinophyta reached its peak in spring 2023 (92.48%) and its lowest point in summer 2020 (21.7%), which aligned with the period of its highest overall biomass share (56.13%). During the summer and autumn months, Chlorophyta and Cyanophyta became significant contributors to biomass, emerging as dominant groups after Bacillariophyta. A distinct succession of dominant biomass groups was observed in winter, where the biomass proportion of Bacillariophyta rebounded sharply, while that of Chlorophyta and Cyanophyta showed a corresponding decline (Figure 6b).

3.4. Spatial Variation in Phytoplankton

Phytoplankton abundance exhibited significant spatial variation (p > 0.05; Figure S3a). Over the survey period, abundance varied from 14.02 × 10⁵ cells/L (at the upstream SN4 site) to 38.36 × 10⁵ cells/L (at the downstream SN3 site). Cyanophyta was the dominant group, contributing an average of 54.04% to the total abundance. The relative abundance of species was generally higher within the reservoir (SN2, SN5) compared to upstream sites near the hydraulic project (SN1, SN4). The highest abundance occurred at the immediate downstream site SN3 (81.37%), followed by a notable decline at the further downstream site SN6 (46.46%), before recovering to 55.87% at SN7. The spatial distribution pattern of Bacillariophyta abundance showed a pronounced negative correlation with that of Cyanophyta. The abundance proportion of Chlorophyta exhibited a longitudinal gradient, continuously decreasing from SN1 to SN3 and significantly increasing from SN4 to SN7. The combined abundance proportion of Cryptophyceae, Euglenophyta and Dinophyta consistently remained below 10% (Figure 7a).
Phytoplankton biomass exhibited no significant spatial variation (p > 0.05; Figure S3b). The observed biomass ranged from 0.70 mg/L (at the downstream SN3 site) to 1.28 mg/L (at the downstream SN6 site). Bacillariophyta was the main contributor to biomass, comprising an average of 55.71%. The biomass proportion of Bacillariophyta decreased longitudinally from SN1 to SN3 and from SN4 to SN6, before rebounding to its highest value (64.31%) at the final downstream site SN7. The spatial distribution pattern of Cyanophyta biomass closely mirrored its abundance variations. The biomass proportion of Chlorophyta fluctuated significantly between SN1 and SN3, and also showed marked variation from SN4 to SN7. Specifically, it increased from 7.49% at SN4 to 19.64% at SN5, then declined to 7.89% at SN6, before a slight rebound to 12.36% at SN7. The biomass proportions of Cryptophyceae and Euglenophyta were stable, showing no significant spatial variation, whereas Dinophyta exhibited a substantial peak biomass proportion (32.02%) at SN6 (Figure 7b).

3.5. The Influence of Physicochemical Factors on Phytoplankton

The correlation analysis results (Figure 8) indicate that WT was highly significantly and positively correlated (p < 0.001) with both the biomass and abundance of Cyanophyta and Chlorophyta. Conversely, WT showed a highly significant negative correlation (p < 0.01) with Cryptophyceae biomass and abundance. NH4+-N concentration demonstrated a highly significant positive correlation (p < 0.001) with Cryptophyceae biomass and abundance. Both TN and NO3-N concentrations were highly significantly and negatively correlated (p < 0.001 or p < 0.01) with Cyanophyta and Chlorophyta biomass and abundance. A highly significant negative correlation was also found between PO43−-P concentration and Chlorophyta biomass (p < 0.01). Additionally, CODMn was highly significantly and positively correlated with Chlorophyta abundance (p < 0.01).
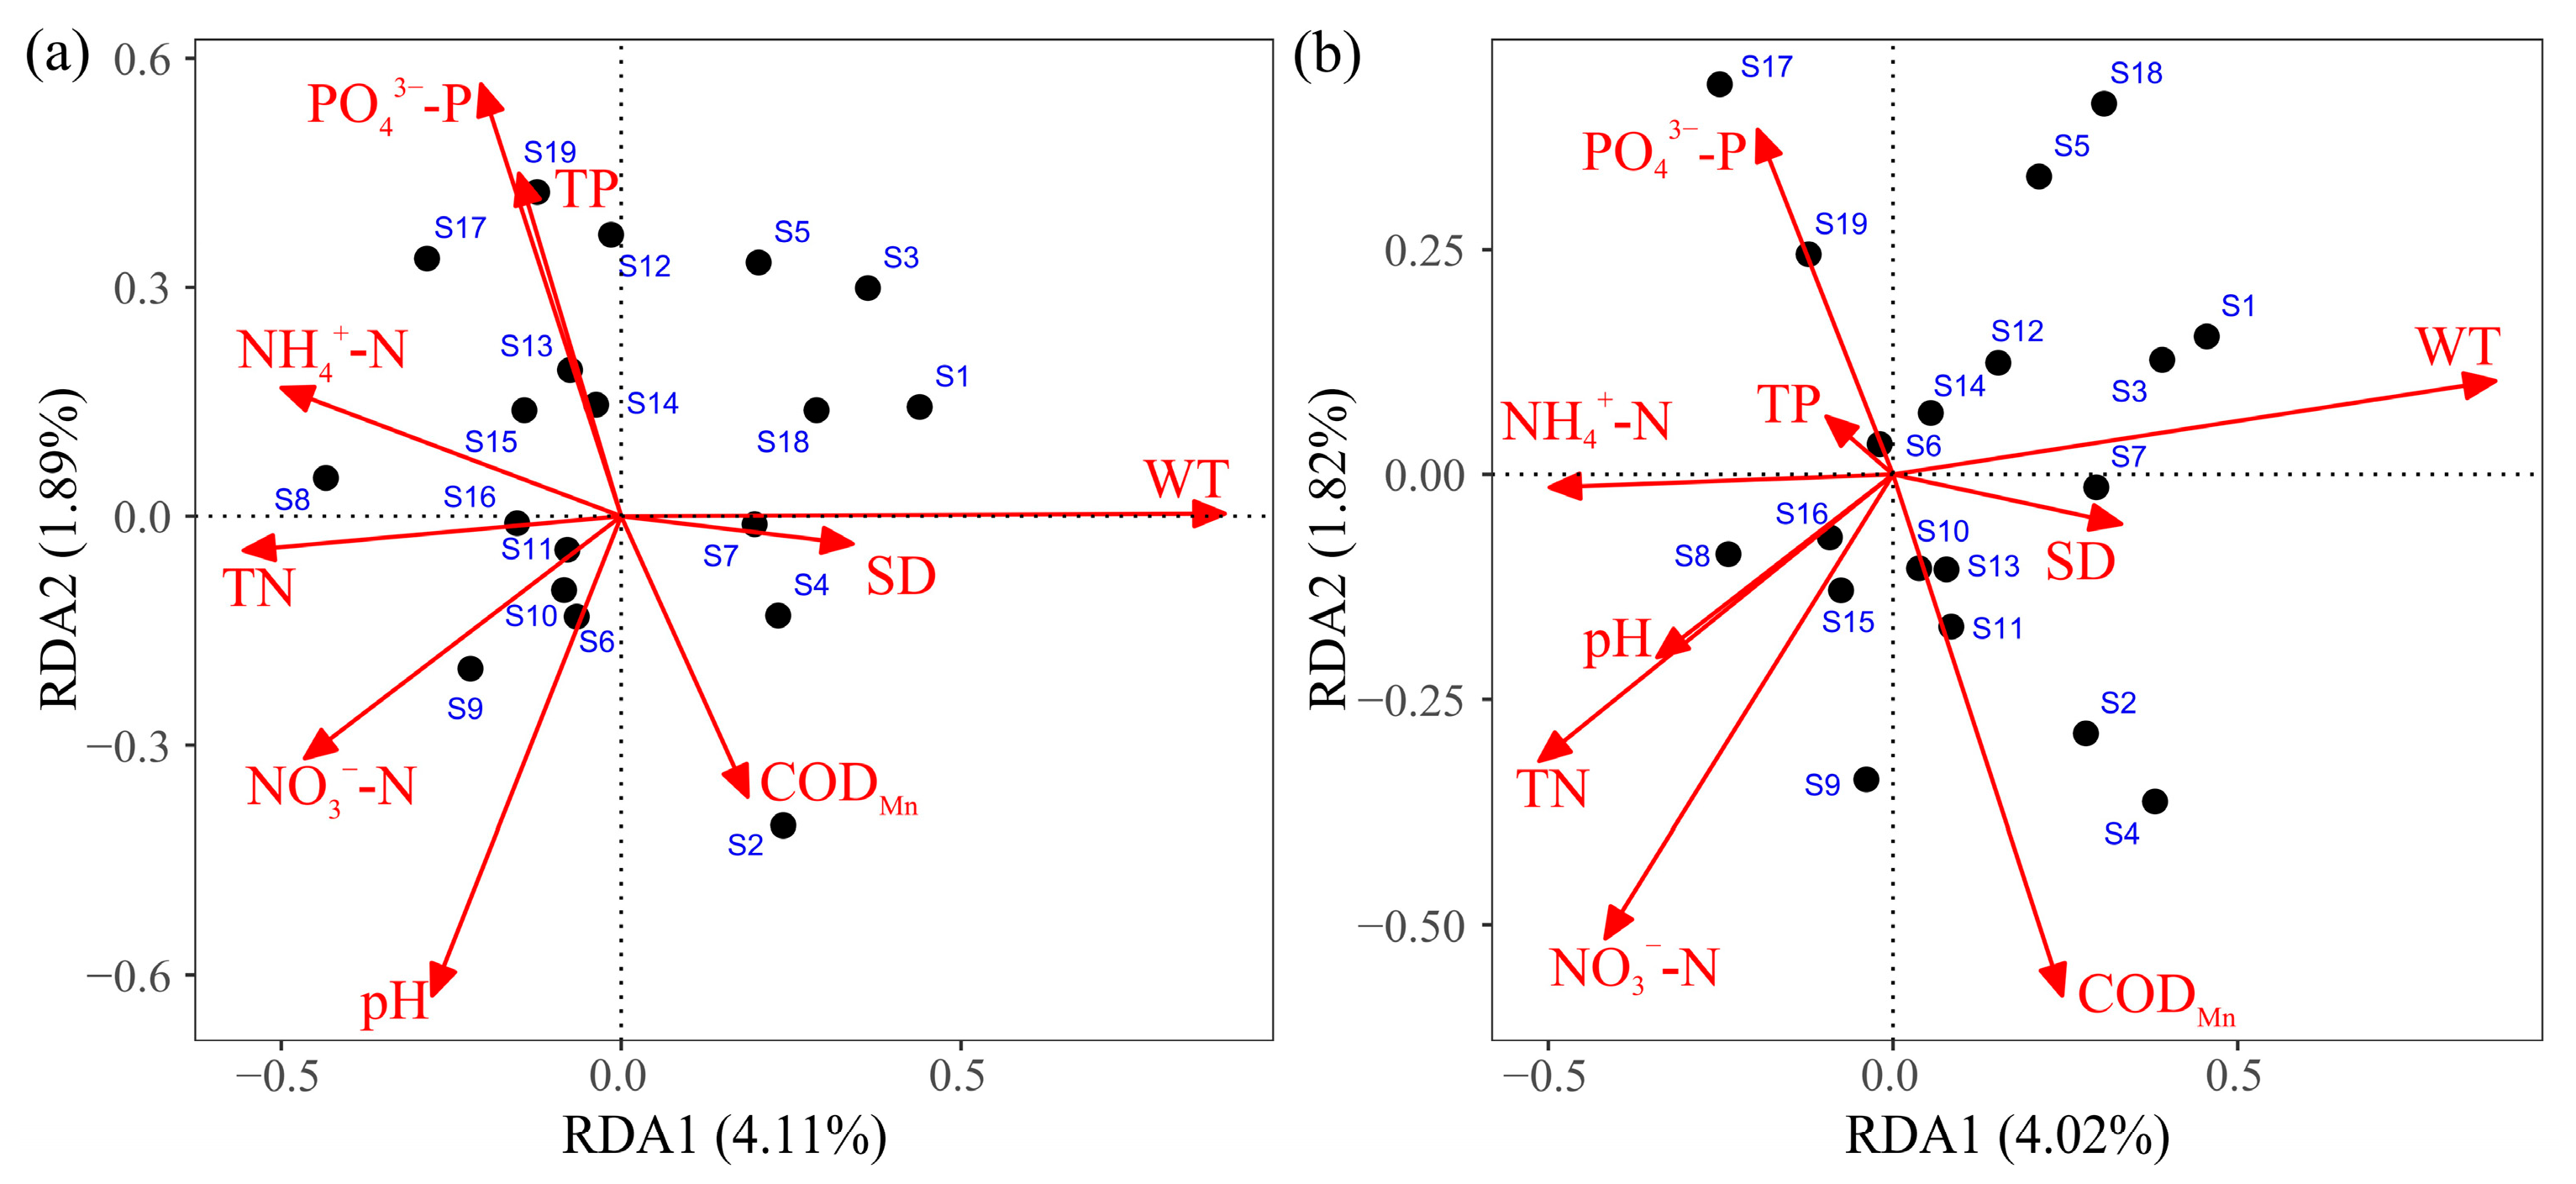
RDA results for dominant species abundance and physicochemical factors explained 10.3% of the total variance, with the primary and secondary ordination axes (RDA1 and RDA2) explaining 4.11% and 1.89% of the variance, respectively (Figure 9a). The correlation coefficients between WT and SD and the primary ordination axis were 0.888 and 0.341, respectively. The biomass and abundance of Cyanophyta (Anabaena sp., Planktothrix sp., Phormidium sp.) and Chlorophyta (Eudorina sp., Cosmarium sp., Chlorella sp.) were positively correlated with WT and SD. Bacillariophyta (Melosira sp., Cyclotella sp., Cymbella sp., Fragilaria sp.) and Euglenophyta (Euglena sp.) showed positive correlations with TN, NH4+-N and NO3-N. The biomass and abundance of Bacillariophyta (Synedra sp., Navicula sp., Gyrosigma sp., Nitzschia sp.), Cryptophyceae (Cryptomonas sp.) and Dinophyta (Ceratium sp.) were positively correlated with TP and PO43−-P.
RDA results for dominant species biomass and physicochemical factors explained 10.66% of the total variance, with the primary and secondary ordination axes (RDA1 and RDA2) explaining 4.02% and 1.82% of the variance, respectively (Figure 9b). The correlation coefficients between WT and SD and the primary axis were 0.874 and 0.331. Several groups, including Cyanophyta (Anabaena sp., Planktothrix sp., Phormidium sp.), Chlorophyta (Eudorina sp., Cosmarium sp., Chlorella sp.), Bacillariophyta (Melosira sp., Fragilaria sp., Synedra sp., Navicula sp., Gyrosigma sp.) and Dinophyta (Peridinium sp.) exhibited positive correlations with WT and SD. In contrast, Bacillariophyta (Nitzschia sp.) and Euglenophyta (Euglena sp.) showed positive correlations with TN, NH4+-N, NO3-N and pH. Cryptophyceae (Cryptomonas sp.) and Dinophyta (Ceratium sp.) were positively correlated with PO43−-P.

4. Discussion

4.1. Structural Characteristics of Phytoplankton Communities

The present study detected 65 species across six phyla of phytoplankton. While the total number is comparable to the 53 species across six phyla recorded by [27], the overall species richness is slightly higher. This discrepancy is likely attributable to the differing time frames and geographical ranges of the two surveys; it also reflects the interannual fluctuations in phytoplankton communities within the Ganjiang River basin, alongside the potential reshaping of community structure by hydraulic project. For instance, the dominant genus Anabaena, recorded in this survey, was absent in the previous one. Nevertheless, with regard to the composition of biomass, Chlorophyta were predominant, followed by Cyanophyta and Bacillariophyta. Cyanophyta, Bacillariophyta and Chlorophyta are regarded as indicator groups for water body nutrient status due to their species richness and wide distribution [7,28]. The proportion of Cyanophyta dropped noticeably, while the proportion of Bacillariophyta rose significantly compared to previous results. This phenomenon may be attributed to a variety of factors, including reduced nutrient loads, enhanced water quality, or the efficacy of ecological restoration initiatives [29,30]. At the abundance level, the order of phyla was as follows: Cyanophyta > Chlorophyta > Bacillariophyta > Cryptophyceae > Dinophyta > Euglenophyta. At the level of biomass, the order was as follows: Bacillariophyta > Dinophyta > Chlorophyta > Cryptophyceae > Cyanophyta > Euglenophyta. The high abundance but low biomass of Cyanophyta is primarily due to their smaller cell volumes and specific survival strategies; in contrast, Bacillariophyta and Dinophyta typically possess larger cell volumes [31]. This study supports the hypothesis of a decoupling between abundance and biomass characteristics, as evidenced by the findings of studies on the Xin Fengjiang Reservoir [32] and Yangtze River Estuary Reservoir [33], indicating that phytoplankton communities in the Ganjiang River basin’s hydraulic project exhibit typical reservoir ecosystem traits.
Phytoplankton communities exhibit pronounced seasonal dynamics, but their succession patterns show marked spatial heterogeneity due to variations in physicochemical factors, such as nutrient levels, hydrodynamic conditions and temperature [34]. During the summer of 2020, a significant increase in both Cyanophyta abundance and Bacillariophyta biomass was observed, a substantial deviation from patterns in other years. This anomaly was primarily attributed to an unprecedented historical flood in the Ganjiang River basin in July 2020 [35]. The flood transported large quantities of N and P via runoff, leading to a short-term surge in nutrient concentrations that supported the rapid proliferation of Cyanophyta and Bacillariophyta [36]. Concurrently, intense water mixing and a sharp increase in sediment content led to a significant decline in water transparency, suppressing phototrophic algae like Bacillariophyta and Chlorophyta. Conversely, Cyanophyta and certain Bacillariophyta can regulate buoyancy or utilize a mixed-feeding nutritional mode, enabling them to maintain a competitive advantage under low-light conditions, thus increasing their relative abundance [37]. The total phytoplankton abundance increased from upstream to downstream at both the Xiajiang and Wan’an hub cross-sections. This is attributed to the accelerated flow velocities in the upstream river channel, which hinder phytoplankton accumulation. Conversely, the reduced flow velocities in the reservoir and downstream sections, caused by dam impoundment, prolong nutrient retention times and create favorable conditions for phytoplankton proliferation [38]. This trend was particularly evident at Xiangjiang Reservoir, where phytoplankton biomass at the downstream sampling point (SN7) exceeded that of the reservoir sites. This suggests the downstream transport of nutrients, such as N and P, which accumulate from upstream agricultural and urban sources within the reservoir [39]. Notably, the SN7 sample had the highest Chlorophyta abundance at 28.49%. Given the presence of water sports facilities and catering establishments along its shoreline, human-induced nutrient discharge is hypothesized to be the primary factor driving this significant increase in Chlorophyta abundance [40].

4.2. Relationship Between Phytoplankton Community Structure and Physicochemical Factors

The composition and dynamics of phytoplankton community structure result from the interactions among various physicochemical factors [41]. RDA was used to determine the core drivers of this structure at the Ganjiang River Hydraulic Projects, revealing WT and N indicators as the two primary factors, both exerting an extremely significant influence (p < 0.01). WT is a pivotal factor in the temporal succession of phytoplankton, influencing it through three mechanisms [42,43]. First, it directly influences community composition and succession by modulating phytoplankton nutrient assimilation and metabolic rates [44]. Second, it triggers seasonal succession of dominant species through thermal fluctuations [45]. Third, it indirectly reshapes water stratification and vertical nutrient distribution while also influencing phytoplankton growth potential by regulating photosynthetic and respiratory enzyme activities [46]. Within the Ganjiang River hub, spatio-temporal variation in phytoplankton biomass and abundance is significantly governed by WT gradients [47]. The RDA ordination showed that biomass and abundance vectors for Cyanophyta and Chlorophyta clustered in quadrants 1 and 4, exhibiting significant positive correlations with WT. Correlation analysis confirmed this, with both biomass and abundance showing extremely significant positive correlations (p < 0.001) with WT, which explains their rapid proliferation from spring to summer as temperatures rise. In contrast, the Cryptophyceae (Eudorina sp.) showed a significant negative correlation with WT (p < 0.01). This is attributed to the exponential increase in photosynthetic rates of thermotolerant groups like Cyanophyta and Chlorophyta, which heightens competition for light and nutrients, causing a “dilution effect” on mesophilic and psychrophilic species [48]. This underscores WT’s pivotal role as a regulatory factor in community succession through both direct physiological stress and indirect resource competition.
N is a vital nutrient in freshwater ecosystems, where it is critical for primary productivity and the framework of aquatic food webs [49]. However, high nitrate concentrations in water bodies are a human health concern [50], which highlights the importance of nitrate as a key ecological regulator. This study demonstrates a significant negative correlation between N availability and the biomass/abundance of Cyanophyta and Chlorophyta. This phenomenon can be attributed to the effects of nutrient stoichiometric imbalance: even with high absolute nutrient concentrations, a relative deficiency in P, characterized by a high N/P ratio, can limit phytoplankton growth. The inhibitory effect of P limitation is particularly pronounced when N/P ratios exceed 20 [51]. In this study, all monitoring sections (SN1–SN7) had N/P ratios greater than 25. Additionally, research has indicated that beyond a certain nutrient threshold, the growth of Cyanophyta and Chlorophyta is primarily driven by non-nutrient factors such as light, WT and pH [52].
The present study corroborates earlier research that P exerts a significantly lesser influence on phytoplankton than N. Research indicates that N supplementation significantly increases phytoplankton biomass, while P supplementation has no significant effect [53]. This finding, observed in regions like the North Atlantic, South Atlantic and Western Pacific, underscores the pervasive N limitation in these areas and its critical role in phytoplankton growth. An additional study of 1382 lakes found that while both P and N correlate with chlorophyll-a, P has a stronger relationship under oligotrophic and mesotrophic conditions. In contrast, under eutrophic conditions, N and P are equally important [54]. This suggests that the effects of N and P on phytoplankton growth may vary with trophic status; however, the overall impact of N appears to be more significant.

4.3. Impact of Hydraulic Project on Phytoplankton Community Structure

The regulation of phytoplankton community structure by hydropower facilities is a complex ecological process involving hydrological disturbances, nutrient cycling and thermodynamic changes [55,56,57]. The study observed spatial heterogeneity, with higher species richness and Cyanophyta abundance in the reservoir sections (SN2, SN5) compared to upstream sections (SN1, SN4). Conversely, the immediate downstream section (SN3) had lower species richness than the reservoir sections (SN2). The downstream section of the gorge hub (SN6) showed an opposite trend (species richness > SN5) due to unique hydrodynamic conditions, the section SN7 had the lowest species richness, likely due to highly unfavorable environmental conditions, as suggested by its lowest SD values. The core mechanisms can be summarized in three aspects: (1) Hydrological restructuring effect: Hub construction significantly impacts river flow and velocity, directly regulating phytoplankton distribution. For instance, reservoir operations can restructure benthic phytoplankton communities and promote downstream migration of phytoplankton assemblages [58]. This hydrological pulse also influences phytoplankton growth cycles. (2) Thermal stratification-community response coupling: Thermal stratification extends the growing season, promoting the proliferation of thermophilic Cyanophyta [59,60]. Research indicates a significant correlation between high WT and Cyanophyta blooms, with Bacillariophyta dominating under low-temperature conditions [61]. (3) Nutrient availability and competition: Hydropower stations alter water residence time and dissolved oxygen, affecting N forms and concentrations, which reduces NO3 concentrations and impacts downstream ecosystems [62]. Additionally, imbalanced N:P ratios drive community succession toward N-fixing Cyanophyta, establishing their dominance under P-limited conditions [63].
Despite the finding that P exerts a significantly weaker influence on phytoplankton communities than N, study show that P is a primary limiting factor for phytoplankton growth. In some reservoirs, a significant correlation between P concentrations and phytoplankton chlorophyll-a content suggests that P limitation has a substantial impact on phytoplankton growth [64]. Furthermore, in agricultural regions, pesticide and nutrient inputs also affect phytoplankton communities, significantly altering their population structure and functional characteristics [65]. Finally, climate change and rising temperatures are additional critical factors. Research shows that as climates warm, phytoplankton growing seasons lengthen and water stratification occurs earlier, leading to increased phytoplankton cell densities [66]. Such changes have a significant influence on phytoplankton growth and can have profound effects on entire aquatic ecosystems.

5. Conclusions

Preliminary analysis pointed to WT and N as the primary drivers. The hydraulic projects significantly impacted hydrology, leading to thermal stratification and altered N cycling, which, in turn, influenced the succession of phytoplankton functional groups.
The impact of hydraulic projects on phytoplankton community structure is a complicated process driven by the combined effects of hydrological conditions, nutrient inputs and climate change. To enhance our understanding and management of these impacts, there is a clear need for more in-depth and systematic research. We recommend that future studies integrate long-term monitoring with model simulations to quantitatively assess the relative contributions of these physicochemical factors. This approach would provide a robust scientific foundation to support effective water resource management, environmental conservation and the strategic application of ecological scheduling.

Supplementary Materials

The following supporting information can be downloaded at: https://www.mdpi.com/article/10.3390/w17213126/s1, Figure S1: ANOVA analyses for species richness, abundance, and biomass; Figure S2: ANOVA for Abundance (a) and Biomass (b) across Seasons; Figure S3: ANOVA for Abundance (a) and Biomass (b) across Points; Table S1: List of phytoplankton species.

Author Contributions

Conceptualization, J.Z. and Y.C.; Methodology, J.Z., J.L., G.L. and Y.X.; Formal analysis, J.Z., S.Z. and Y.H.; Investigation, J.L., Y.C. and Y.X.; Data curation, Y.H.; Writing—original draft preparation, J.Z.; Writing—review and editing, J.L. and T.H.; Visualization, S.Z. and G.L.; Supervision, Y.C. and W.L.; Funding acquisition, J.Z., T.H. and W.L. All authors have read and agreed to the published version of the manuscript.

Funding

This work was supported by the Jiangxi Province 2025 Postgraduate Innovation Special Fund Project (No.: YC2025-S791), National Natural Science Foundation of China (No. 52260026) and the Major Science and Technology Program of Jiangxi Provincial Department of Water Resources (202426ZDKT30).

Data Availability Statement

The raw data supporting the conclusions of this article will be made available by the authors on request.

Acknowledgments

Thank you to all the staff who worked on the Ganjiang River sampling from 2019 to 2023. In particular, the research team was a tremendous help.

Conflicts of Interest

The authors declare no conflict of interest.

References

  1. Gogoi, P.; Das, S.K.; Das Sarkar, S.; Chanu, T.N.; Manna, R.K.; Sengupta, A.; Raman, R.K.; Samanta, S.; Das, B.K. physicochemical factors Driving Phytoplankton Assemblage Pattern and Diversity: Insights from Sundarban Eco-Region, India. Ecohydrol. Hydrobiol. 2021, 21, 354–367. [Google Scholar] [CrossRef]
  2. Hochfeld, I.; Hinners, J. Phytoplankton Adaptation to Steady or Changing Environments Affects Marine Ecosystem Functioning. Biogeosciences 2024, 21, 5591–5611. [Google Scholar] [CrossRef]
  3. Jin, X.; Xie, H.; Zhao, X.; He, D.; Zhan, A.; Cai, Y.; Wu, N.; Zhang, X.; Yang, J.; Wang, Y.; et al. Aquatic Ecosystem Health Assessment in China Based on Metacommunity Theory: From Theory to Practice. Carbon Res. 2025, 4, 16. [Google Scholar] [CrossRef]
  4. Zarfl, C.; Lumsdon, A.E.; Berlekamp, J.; Tydecks, L.; Tockner, K. A Global Boom in Hydropower Dam Construction. Aquat. Sci. 2015, 77, 161–170. [Google Scholar] [CrossRef]
  5. Soomro, A.G.; Shah, S.A.; Memon, A.H.; Alharabi, R.S.; Memon, D.; Panhwar, S.; Keerio, H.A. Cascade Reservoirs: An Exploration of Spatial Runoff Storage Sites for Water Harvesting and Mitigation of Climate Change Impacts, Using an Integrated Approach of GIS and Hydrological Modeling. Sustainability 2022, 14, 13538. [Google Scholar] [CrossRef]
  6. Yang, M.; Zhu, L.; Liu, J.; Zhang, Y.; Zhou, B. Influence of Water Conservancy Project on Runoff in the Source Region of the Yellow River and Wetland Changes in the Lakeside Zone, China. J. Groundw. Sci. Eng. 2023, 11, 333–346. [Google Scholar] [CrossRef]
  7. Xu, Y.; Liu, W.; Xu, B.; Xu, Z. Riverine Sulfate Sources and Behaviors in Arid Environment, Northwest China: Constraints from Sulfur and Oxygen Isotopes. J. Environ. Sci. 2024, 137, 716–731. [Google Scholar] [CrossRef]
  8. Wang, X.; Wang, P.; Wang, C.; Chen, J.; Hu, B.; Yuan, Q.; Du, C.; Xing, X. Cascade Damming Impacts on Microbial Mediated Nitrogen Cycling in Rivers. Sci. Total Environ. 2023, 903, 166533. [Google Scholar] [CrossRef]
  9. Bao, Y.; Sun, M.; Wang, Y.; Lu, J.; Wu, Y.; Chen, H.; Li, S.; Qin, Y.; Wang, Z.; Wen, J.; et al. Impact of Cascade Reservoir on the Sources of Organic Matter in Sediments of Lancang River. iScience 2025, 28, 111681. [Google Scholar] [CrossRef]
  10. Peñuelas, J.; Sardans, J.; Rivas-ubach, A.; Janssens, I.A. The Human-induced Imbalance between C, N and P in Earth’s Life System. Glob. Change Biol. 2012, 18, 3–6. [Google Scholar] [CrossRef]
  11. Grumbine, R.E.; Xu, J. Mekong Hydropower Development. Science 2011, 332, 178–179. [Google Scholar] [CrossRef]
  12. Orr, S.; Pittock, J.; Chapagain, A.; Dumaresq, D. Dams on the Mekong River: Lost Fish Protein and the Implications for Land and Water Resources. Glob. Environ. Change 2012, 22, 925–932. [Google Scholar] [CrossRef]
  13. Bai, H.; Wang, Y.; Song, J.; Kong, F.; Zhang, X.; Li, Q. Characteristics of Plankton Community Structure and Its Relation to physicochemical factors in Weihe River, China. Ecol. Environ. Sci. 2022, 31, 117–130. [Google Scholar] [CrossRef]
  14. Jiangxi Provincial Water Resources Department (Ed.) Encyclopedia of Rivers and Lakes in Jiangxi, 1st ed.; Chang Jiang Chu Ban She: Wuhan, China, 2010; ISBN 978-7-80708-942-1. [Google Scholar]
  15. Chen, C.; Zhang, Y.; Xiang, Y.; Wang, L. Study on Runoff Responses to Land Use Change in Ganjiang Basin. J. Nat. Resour. 2014, 29, 1758–1769. [Google Scholar] [CrossRef]
  16. Han, H.; Sun, J. An Analysis of the Meteorological and Hydrological Drought Propagation Characteristics in Ganjiang River Basin. China Rural Water Hydropower 2022, 64, 101–106. [Google Scholar] [CrossRef]
  17. Hu, F.; Hou, J.; Luo, J.; Hu, W. Analysis of Pollution Loading and Water Environmental Capacity of Gan River in Nanchang. Environ. Sci. Technol. 2010, 33, 192–195+205. Available online: https://lib.cqvip.com/Qikan/Article/Detail?id=1001415721 (accessed on 25 September 2025).
  18. Cao, B.; Lei, B.; Yu, J. Research on the Basin Water Temperature Impact of Important Hydro Junction Constructions of Ganjing Mainstream in Jiangxi Province. Jiangxi Chem. Ind. 2014, 30, 35–38. [Google Scholar] [CrossRef]
  19. Baird, R.B.; Eaton, A.D.; Rice, E.W. Standard Methods for the Examination of Water and Wastewater, 23rd ed.; American Public Health Association, American Water Works Association, Water Environment Federation, Eds.; American Public Health Association: Washington, DC, USA, 2017; ISBN 978-0-87553-287-5. [Google Scholar]
  20. Guo, T.; Fu, Z.; Zhou, C.; Chen, J.; OuYang, S.; Wu, X. Diversity of Eukaryotic Phytoplankton in Poyang Lake Based on Environmental DNA Metabarcoding. J. Hydroecol. 2023, 44, 67–75. [Google Scholar] [CrossRef]
  21. Hu, H.; Wei, Y. The Freshwater Algae of China: Systematics, Taxonomy and Ecology; Science Press: Beijing, China, 2006; ISBN 7-03-016633-7. [Google Scholar]
  22. Hillebrand, H.; Dürselen, C.; Kirschtel, D.; Pollingher, U.; Zohary, T. Biovolume Calculation for Pelagic and Benthic Microalgae. J. Phycol. 1999, 35, 403–424. [Google Scholar] [CrossRef]
  23. Liu, J.; Zou, H.; Deng, F.; Liu, Y.; Li, W.; Xu, J.; Liu, S.; Wu, Q.; Zhang, X.; Weng, F.; et al. Phytoplankton Functional Groups in Poyang Lake: Succession and Driving Factors. J. Ocean. Limnol. 2024, 42, 1764–1776. [Google Scholar] [CrossRef]
  24. Borcard, D.; Gillet, F.; Legendre, P. Numerical Ecology with R; Use R! 2nd ed.; Springer: Cham, Switzerland, 2018; ISBN 978-3-319-71404-2. [Google Scholar]
  25. Wang, Y.; Chen, L.; Niu, Y.; Yu, H.; Luo, M. Spatio-Temporal Variation in Phytoplankton Community and Its Influencing Factors in Danjiangkou Reservoir. J. Lake Sci. 2016, 28, 1057–1065. [Google Scholar] [CrossRef]
  26. Zhang, C.; Lei, G.; Zhao, F.; Chen, K.; Zhang, C.; Lu, C.; Luo, Q.; Song, J.; Chen, K.; Ye, J.; et al. Functional Trait-Based Phytoplankton Biomass and Assemblage Analyses in the Pre-Growing Season for Comprehensive Algal Bloom Risk Assessment. Water Res. 2024, 257, 121755. [Google Scholar] [CrossRef]
  27. Wang, J.; Xia, Y.; Yu, X.; Liu, J.; Li, H.; Chen, Y. Temporal and Spatial Distribution Characteristics and Water Quality Evaluation of Planktonic Algae in the Middle and Lower Reaches of Ganjiang River. J. Ecol. Rural Environ. 2023, 39, 1031–1041. [Google Scholar] [CrossRef]
  28. Zhao, X.; Fang, T.; Yang, K.; Li, J.; Liang, Y.; Lu, W. Community Structure Characteristics of Phytoplankton and Related physicochemical factors in Summer in Tuohu Lake, Anhui, China. Plant Sci. J. 2018, 36, 687–695. [Google Scholar] [CrossRef]
  29. Peimin, P.; Yuhong, L.; Jinfang, Z.; Yongbing, M.; Zhengkui, L.; Xiaoying, C. Eutrophication Control in Local Area through Phytoplankton Population Regulation by Eco-Remediation: A Case Study on Aqua-Eco-Remediation Engineering in Lake Hongfeng, Guizhou Province. J. Lake Sci. 2012, 24, 503–512. [Google Scholar] [CrossRef]
  30. Yu, H.; Ji, H.; Li, Y.; Qi, J.; Ma, B.; Hu, C.; Qu, J. Long-Term Succession in Cyanobacteria and Aquatic Plant Communities: Insights from Sediment Analysis. Engineering 2025, in press. [Google Scholar] [CrossRef]
  31. Xia, J.; Hu, H.; Gao, X.; Kan, J.; Gao, Y.; Li, J. Phytoplankton Diversity, Spatial Patterns, and Photosynthetic Characteristics under Environmental Gradients and Anthropogenic Influence in the Pearl River Estuary. Biology 2024, 13, 550. [Google Scholar] [CrossRef]
  32. Zhang, H.; Peng, Y.; Zou, X.; Zhang, T.; Wu, C.; Lin, X.; Qiao, Y.; Yang, H. Characteristics of Phytoplankton Functional Groups and Their Relationships with physicochemical factors in Xinfengjiang. China Environ. Sci. 2022, 42, 380–392. [Google Scholar] [CrossRef]
  33. Jin, X.; Wu, H.; Chen, Z.; Song, H.; He, Y. Phosphorus Fractions Sorption Characteristics and Its Release in the Sediments of Yangtze Estuary Reservoir China. Environ. Sci. 2015, 36, 448–456. [Google Scholar]
  34. Yuan, H.; Zhang, R.; Li, Q.; Lu, Q.; Chen, J. Bacterially Mediated Phosphorus Cycling Favors Resource Use Efficiency of Phytoplankton Communities in a Eutrophic Plateau Lake. Water Res. 2025, 277, 123300. [Google Scholar] [CrossRef] [PubMed]
  35. Liao, J.; Kang, S. Analysis and Reflection of the Exceeding De-Sign Standard Flood in Poyang Lake Basin in 2020. China Flood Drought Manag. 2021, 31, 45–48. [Google Scholar] [CrossRef]
  36. Li, W.; Jiang, M.; Xu, L.; Hu, S.; You, H.; Zhou, Q.; Chen, Z.; Zhang, L. Spatial and Temporal Characteristics of Phytoplankton in Lake Poyang and Its Response to Extreme Flood and Drying Events. J. Lake Sci. 2024, 36, 1001–1013. [Google Scholar] [CrossRef]
  37. Huang, Z.; Pan, B. Research on the Impact of Flood Process on Aquatic Ecosystem. J. Xi’an Univ. Technol. 2020, 36, 300–306. [Google Scholar] [CrossRef]
  38. Zhang, Q.; Chen, Y.; Lin, Y.; Chen, Q.; Zhang, J.; Ding, J.; Ma, H. Characteristic of Phytoplankton Community Structure and Its Driving Factors along the Cascade Reservoirs in the Lancang River. J. Lake Sci. 2023, 35, 530–539. [Google Scholar] [CrossRef]
  39. Liu, X.; Yang, Z.; Cao, B.; Li, J.; Peng, L. Distribution Characteristics of Nitrogen and Phosphorus Nutrients in Main Rivers of Ganjiang River during Wet and Dry Seasons. Environ. Monit. China 2023, 39, 21–32. [Google Scholar] [CrossRef]
  40. Liu, J.; Xu, M.; Huang, X.; Chen, Q.; Luo, Q. Investigation and Research on Water Pollution Sources along Riverside of Ganjiang River (Nanchang Reach). Water Resour. Hydropower Eng. 2010, 41, 13–18. [Google Scholar] [CrossRef]
  41. Breton, E.; Goberville, E.; Sautour, B.; Ouadi, A.; Skouroliakou, D.-I.; Seuront, L.; Beaugrand, G.; Kléparski, L.; Crouvoisier, M.; Pecqueur, D.; et al. Multiple Phytoplankton Community Responses to Environmental Change in a Temperate Coastal System: A Trait-Based Approach. Front. Mar. Sci. 2022, 9, 914475. [Google Scholar] [CrossRef]
  42. Li, C.; Feng, W.; Chen, H.; Li, X.; Song, F.; Guo, W.; Giesy, J.P.; Sun, F. Temporal Variation in Zooplankton and Phytoplankton Community Species Composition and the Affecting Factors in Lake Taihu—A Large Freshwater Lake in China. Environ. Pollut. 2019, 245, 1050–1057. [Google Scholar] [CrossRef] [PubMed]
  43. Grill, G.; Lehner, B.; Thieme, M.; Geenen, B.; Tickner, D.; Antonelli, F.; Babu, S.; Borrelli, P.; Cheng, L.; Crochetiere, H.; et al. Mapping the World’s Free-Flowing Rivers. Nature 2019, 569, 215–221. [Google Scholar] [CrossRef] [PubMed]
  44. Zhu, J.; Tang, S.; Cheng, K.; Cai, Z.; Chen, G.; Zhou, J. Microbial Community Composition and Metabolic Potential during a Succession of Algal Blooms from Skeletonema Sp. to Phaeocystis Sp. Front. Microbiol. 2023, 14, 1147187. [Google Scholar] [CrossRef]
  45. Jung, E.; Joo, G.-J.; Kim, H.G.; Kim, D.-K.; Kim, H.-W. Effects of Seasonal and Diel Variations in Thermal Stratification on Phytoplankton in a Regulated River. Sustainability 2023, 15, 16330. [Google Scholar] [CrossRef]
  46. Chang, F.; Hou, P.; Wen, X.; Duan, L.; Zhang, Y.; Zhang, H. Seasonal Stratification Characteristics of Vertical Profiles and Water Quality of Lake Lugu in Southwest China. Water 2022, 14, 2554. [Google Scholar] [CrossRef]
  47. Bestion, E.; Haegeman, B.; Alvarez Codesal, S.; Garreau, A.; Huet, M.; Barton, S.; Montoya, J.M. Phytoplankton Biodiversity Is More Important for Ecosystem Functioning in Highly Variable Thermal Environments. Proc. Natl. Acad. Sci. USA 2021, 118, e2019591118. [Google Scholar] [CrossRef] [PubMed]
  48. Konopka, A.; Brock, T.D. Effect of Temperature on Blue-Green Algae (Cyanobacteria) in Lake Mendota. Appl. Environ. Microbiol. 1978, 36, 572–576. [Google Scholar] [CrossRef] [PubMed]
  49. Mandal, S.; Shurin, J.B.; Efroymson, R.A.; Mathews, T.J. Heterogeneity in Nitrogen Sources Enhances Productivity and Nutrient Use Efficiency in Algal Polycultures. Environ. Sci. Technol. 2018, 52, 3769–3776. [Google Scholar] [CrossRef] [PubMed]
  50. Wu, W.; Wang, J.; Wang, H.; Liu, J.; Yao, Q.; Yu, Z.; Ran, X. Trends in Nutrients in the Changjiang River. Sci. Total Environ. 2023, 872, 162268. [Google Scholar] [CrossRef]
  51. Schindler, D.W.; Hecky, R.E.; Findlay, D.L.; Stainton, M.P.; Parker, B.R.; Paterson, M.J.; Beaty, K.G.; Lyng, M.; Kasian, S.E.M. Eutrophication of Lakes Cannot Be Controlled by Reducing Nitrogen Input: Results of a 37-Year Whole-Ecosystem Experiment. Proc. Natl. Acad. Sci. USA 2008, 105, 11254–11258. [Google Scholar] [CrossRef]
  52. Tang, B.; He, Y.; Yang, G.; Zhang, L.; Sun, X.; Ai, H.; He, Q.; Li, H. Identification of Phytoplankton Growth Limiting Factors during Flood Seasons in Tributary of the Three Gorges Reservoir. J. Southwest Univ. (Nat. Sci. Ed.) 2023, 45, 138–151. [Google Scholar] [CrossRef]
  53. Wu, X.; Liu, H.; Ru, Z.; Tu, G.; Xing, L.; Ding, Y. Meta-Analysis of the Response of Marine Phytoplankton to Nutrient Addition and Seawater Warming. Mar. Environ. Res. 2021, 168, 105294. [Google Scholar] [CrossRef]
  54. Liang, Z.; Soranno, P.A.; Wagner, T. The Role of Phosphorus and Nitrogen on Chlorophyll a: Evidence from Hundreds of Lakes. Water Res. 2020, 185, 116236. [Google Scholar] [CrossRef]
  55. Wang, B.; Yang, X.; Li, S.-L.; Liang, X.; Li, X.-D.; Wang, F.; Yang, M.; Liu, C.-Q. Anthropogenic Regulation Governs Nutrient Cycling and Biological Succession in Hydropower Reservoirs. Sci. Total Environ. 2022, 834, 155392. [Google Scholar] [CrossRef]
  56. Wang, L.; Tan, L.; Cai, Q. Distinct Differences of Vertical Phytoplankton Community Structure in Mainstream and a Tributary Bay of the Three Gorges Reservoir, China. Front. Plant Sci. 2024, 15, 1381798. [Google Scholar] [CrossRef]
  57. Luo, Q.; Zhu, L.; Li, D.; Zu, Z.; Chen, K.; Wang, J.; Yi, Y. Role of Hydraulic Residence Time in Shaping Phytoplankton Community Assembly in the Upper Yellow River Cascade Reservoirs. Front. Environ. Sci. 2025, 13, 1551988. [Google Scholar] [CrossRef]
  58. Atazadeh, E.; Gell, P.; Mills, K.; Barton, A.; Newall, P. Community Structure and Ecological Responses to Hydrological Changes in Benthic Algal Assemblages in a Regulated River: Application of Algal Metrics and Multivariate Techniques in River Management. Environ. Sci. Pollut. Res. 2021, 28, 39805–39825. [Google Scholar] [CrossRef]
  59. Dai, L.; Zhang, Q.; Ren, Y.; Chen, L.; Jiang, W.; Dai, H.; Tang, Z. Water Temperature Stratification Characteristics of Xiluodu Reservoir in Ecological Regulation Period under the Condition of Inflow Change. J. Water Resour. Hydraul. Eng. 2023, 34, 132–139. [Google Scholar] [CrossRef]
  60. Huang, Q.; Li, N.; Li, Y. Long-Term Trend of Heat Waves and Potential Effects on Phytoplankton Blooms in Lake Qiandaohu, a Key Drinking Water Reservoir. Environ. Sci. Pollut. Res. 2021, 28, 68448–68459. [Google Scholar] [CrossRef]
  61. Ji, L.; Zhang, H.; Wang, Z.; Tian, Y.; Tian, W.; Liu, Z. Temperature Orchestrates Phytoplankton Community and Environment in Mountain Stream for Enhancing Resource Use Efficiency. Front. Mar. Sci. 2025, 12, 1565858. [Google Scholar] [CrossRef]
  62. Chen, Q.; Shi, W.; Huisman, J.; Maberly, S.C.; Zhang, J.; Yu, J.; Chen, Y.; Tonina, D.; Yi, Q. Hydropower Reservoirs on the Upper Mekong River Modify Nutrient Bioavailability Downstream. Natl. Sci. Rev. 2020, 7, 1449–1457. [Google Scholar] [CrossRef] [PubMed]
  63. Fortin, N.; Munoz-Ramos, V.; Bird, D.; Lévesque, B.; Whyte, L.; Greer, C. Toxic Cyanobacterial Bloom Triggers in Missisquoi Bay, Lake Champlain, as Determined by next-Generation Sequencing and Quantitative PCR. Life 2015, 5, 1346–1380. [Google Scholar] [CrossRef]
  64. Kim, J.Y.; Atique, U.; Mamun, M.; An, K.-G. Long-Term Interannual and Seasonal Links between the Nutrient Regime, Sestonic Chlorophyll and Dominant Bluegreen Algae under the Varying Intensity of Monsoon Precipitation in a Drinking Water Reservoir. Int. J. Environ. Res. Public Health 2021, 18, 2871. [Google Scholar] [CrossRef]
  65. Wijewardene, L.; Wu, N.; Qu, Y.; Guo, K.; Messyasz, B.; Lorenz, S.; Riis, T.; Ulrich, U.; Fohrer, N. Influences of Pesticides, Nutrients, and Local Environmental Variables on Phytoplankton Communities in Lentic Small Water Bodies in a German Lowland Agricultural Area. Sci. Total Environ. 2021, 780, 146481. [Google Scholar] [CrossRef] [PubMed]
  66. Smucker, N.J.; Beaulieu, J.J.; Nietch, C.T.; Young, J.L. Increasingly Severe Cyanobacterial Blooms and Deep Water Hypoxia Coincide with Warming Water Temperatures in Reservoirs. Glob. Change Biol. 2021, 27, 2507–2519. [Google Scholar] [CrossRef] [PubMed]
Figure 1. Distribution of sampling points.
Water 17 03126 g001
Figure 2. Significance analysis of physicochemical factors across different years (Groups that do not share a common superscript letter show a statistically significant difference. The presence of the same letter signifies no significant difference).
Water 17 03126 g002
Figure 3. Significance analysis of physicochemical factors across different seasons (Groups that do not share a common superscript letter show a statistically significant difference. The presence of the same letter signifies no significant difference).
Water 17 03126 g003
Figure 4. Significance analysis of physicochemical factors at different sampling points (Groups that do not share a common superscript letter show a statistically significant difference. The presence of the same letter signifies no significant difference).
Water 17 03126 g004
Figure 5. Temporal distribution (a) and spatial distribution (b) of phytoplankton species by phylum.
Water 17 03126 g005
Figure 6. Phytoplankton abundance (a) and biomass (b) and relative abundance of different phyla across seasons.
Water 17 03126 g006aWater 17 03126 g006b
Figure 7. Phytoplankton abundance (a) and biomass (b) relative abundance of each phylum at different sampling points.
Water 17 03126 g007
Figure 8. Correlation analysis between phytoplankton abundance (a) and biomass (b) and physicochemical factors. * Denotes significance level: *** p < 0.001, ** p < 0.01, * p < 0.05.
Water 17 03126 g008
Figure 9. RDA ordination of dominant phytoplankton abundance (a) and biomass (b) versus physicochemical factors. (Cyanophyta: S1 Anabaena sp.; S2 Planktothrix sp.; S3 Phormidium sp.; Chlorophyta: S4 Eudorina sp.; S5 Cosmarium sp.; S6 Staurastrum sp.; S7 Chlorella sp.; Bacillariophyta: S8 Melosira sp.; S9 Cyclotella sp.; S10 Cymbella sp.; S11 Fragilaria sp.; S12 Synedra sp.; S13 Navicula sp.; S14 Gyrosigma sp.; S15 Nitzschia sp.; Euglenophyta: S16 Euglena sp.; Cryptophyceae: S17 Cryptomonas sp.; Dinophyta: S18 Peridinium sp.; S19 Ceratium sp.).
Water 17 03126 g009
Disclaimer/Publisher’s Note: The statements, opinions and data contained in all publications are solely those of the individual author(s) and contributor(s) and not of MDPI and/or the editor(s). MDPI and/or the editor(s) disclaim responsibility for any injury to people or property resulting from any ideas, methods, instructions or products referred to in the content.