Article

A Multi-Source Object-Oriented Framework for Extracting Aquaculture Ponds: A Case Study from the Chaohu Lake Basin, China

1
School of Geography and Tourism, Anhui Normal University, Wuhu 241002, China
2
Engineering Technology Research Center of Resources Environment and GIS, Wuhu 241002, China
3
Anhui Provincial Engineering Laboratory of Water and Soil Pollution Control and Remediation, School of Ecology and Environment, Anhui Normal University, Wuhu 241002, China
4
Key Laboratory of Environmental Engineering of Jiangsu Province, Jiangsu Provincial Academy of Environmental Science, Nanjing 210036, China
*
Author to whom correspondence should be addressed.
Water 2025, 17(9), 1406; https://doi.org/10.3390/w17091406
Submission received: 7 April 2025 / Revised: 5 May 2025 / Accepted: 6 May 2025 / Published: 7 May 2025
(This article belongs to the Special Issue Wetland Water Quality Monitoring and Assessment)

Abstract

:
Quantifying the extent and distribution of aquaculture ponds has become the key to management in the aquaculture industry, thereby contributing to the sustainable development of the region. However, accurate extraction of individual aquaculture pond boundaries from mesoscale remote sensing images remains a significant challenge. In this work, we developed the Multi-source Object-oriented Framework for extracting Aquaculture ponds (MOFA) to address mapping challenges in the Chaohu Lake basin, China. The MOFA combined Sentinel-1 synthetic aperture radar (SAR) with Sentinel-2 data, applying an object-oriented approach with adaptive threshold segmentation for robust and automated aquaculture pond delineation. Our performance evaluation results showed that the overall accuracy is as high as 90.75%. The MOFA is thus capable of distinguishing seasonal water bodies, lakes, reservoirs, and rivers from individual (non-centralized, contiguous) aquaculture ponds. Our results showed that the central and south sections of the Chaohu Lake basin are characterized by denser aquaculture pond distributions, relative to those in the western basin. The total area of aquaculture ponds across the entire basin decreased from 19,297.86 hm2 in 2016 to 18,262.77 hm2 in 2023, which is likely attributed to local policy adjustments, resource optimization, shifting market demands, or natural environmental changes. The abandonment and unregulated expansion of aquaculture ponds threaten sustainable development. Local governments must implement adaptive governance strategies to balance ecological preservation with economic growth. Overall, the MOFA can quickly and accurately extract and map aquaculture ponds, and further support the scientific planning of sustainable aquaculture development.

1. Introduction

Aquaculture ponds are considered a crucial food production system and aquatic ecosystem, which is tightly intertwined with food security, ecosystem health, and climate change [1,2]. According to the statistics from the China Fishery Statistical Yearbook in 2023, China’s total output of aquaculture products in 2022 reached 6.87 × 10⁵ tons, representing a 2.62% year-on-year increase. Among this, the output from aquaculture alone amounted to 5.57 × 10⁵ tons, reflecting a growth rate of 3.17% and accounting for 81.06% of the total production. The rapid spread of aquaculture ponds has caused serious eco-environmental challenges, encompassing the destruction of natural habitats [3,4], water eutrophication [5,6], ecosystem degradation [7,8], and other ecological issues [9,10]. Therefore, developing a robust aquaculture pond mapping framework is critically required to advance sustainable aquaculture management and ecosystem conservation.
Currently, optical remote sensing and SAR are widely employed to detect and extract aquaculture ponds across multiple spatial scales [11,12,13,14]. Aquaculture pond extraction algorithms can be categorized into three primary approaches: (1) High-resolution remote sensing images are combined with a pixel-oriented method [15,16,17,18,19]. High-resolution remote sensing images aid in accurately delineating the boundary of aquaculture ponds [20], but the high cost and low temporal resolution have restricted their long-term and large-scale application [21,22]. (2) A pixel-oriented method has been incorporated into SAR [23,24,25,26]. SAR has a high temporal resolution, a strong cloud-penetrating capability, and all-weather observation advantages [14,27]. Additionally, SAR can effectively distinguish fluctuating seasonal water bodies [28]. Nevertheless, they have more speckle and boundary noise that cannot be suppressed effectively [29,30]. (3) SAR has been combined with an object-oriented method [2,29,31,32,33]. The object-oriented method can identify diverse water bodies, and the geometric features are used to distinguish between aquaculture ponds and non-aquaculture ponds. However, reliance on the single data source has posed persistent challenges of mixed pixels and spectral confusion requiring resolution [34,35]. In conclusion, single data sources and pixel-oriented methods are insufficient to address challenges, including spectral confusion, seasonal water bodies, and dynamic monitoring. These limitations can be effectively overcome by integrating multi-source data with object-oriented methods.
The combination of multi-source datasets and object-oriented methods has become a standard practice for aquaculture pond mapping [12,17,26,31,36], which involves a combination of Sentinel-1 SAR and Sentinel-2 [31], a combination of Landsat 5 T1_SR and Landsat 8 T1_SR [11], and a combination of Landsat and GaoFen [17]. The boundary of water bodies is obtained by threshold segmentation, followed by the extraction of morphological features from the water body objects. Ultimately, on the basis of appropriate parameter selection, rules, and machine learning methods, aquaculture ponds are systematically distinguished from natural water bodies [32,37]. Spatiotemporal distribution maps are then generated to enable dynamic monitoring of aquaculture ponds. Long-term time series of remote sensing data with high temporal resolution enable effective differentiation of aquaculture ponds from seasonal water bodies, such as paddy rice fields, reservoirs, and marshes [19,38]. The object-oriented method can eliminate the influence of spectral confusion, and extract potential aquaculture ponds from the truncated rivers, lakes, and irregular boundary water bodies [25]. Consequently, integrating multi-source data with object-oriented methods can distinguish seasonal water bodies, extract potential aquaculture ponds from spectrally similar water objects, and achieve precise aquaculture pond delineation.
In this study, the primary objective is to develop an aquaculture pond extraction framework based on Google Earth Engine, and to use multi-source datasets combined with object-oriented methods for effective dynamic monitoring of aquaculture ponds. The framework is termed the Multi-source Object-oriented Framework for extracting Aquaculture ponds (MOFA). We applied the MOFA in the Chaohu Lake basin, China, to map the distribution of aquaculture ponds. Our ultimate goal is to use the MOFA to quantify the aquaculture pond area of some specific region, to investigate the pattern of aquaculture pond distribution, and to provide a reference for policy-makers when developing strategies to balance regional ecological and economic sustainability.

2. Materials and Methods

2.1. Study Area and Datasets

Chaohu Lake, one of China’s five largest freshwater lakes, is located in central Anhui Province (31°25′–31°43′ N, 117°17′–117°51′ E). The Chaohu Lake basin involves 6 major cities (Hefei, Wuhu, Maanshan, Luan, Anqing, and Tongling) and a total of 19 counties (small cities and districts; Figure 1). The basin covers an area of 13,486 km2, accounting for 9.3% of Anhui Province. The Chaohu Lake basin, with hilly terrain near the Yangtze River and Huaihe River, has a humid subtropical monsoon climate, featuring a mean annual temperature of 16 °C and rainfall of 1046 mm. According to the Anhui Provincial Statistical Yearbook, the total aquaculture output value of the Chaohu Lake basin reached CNY 3.04 × 10¹⁰ in 2022, accounting for 46.07% of the total aquaculture output value of Anhui Province. Of note, total phosphorus (TP) is the primary pollutant exceeding the standard in the basin [39].
To establish the MOFA, we collected the required data, including remote sensing image data, elevation data, and statistical yearbook data (Table 1). Remote sensing image data are derived from Google Earth Engine, comprising Sentinel-1 SAR and Sentinel-2 data. To remove mountain shade and mountaintop water [40], we acquired the SRTM version 3.0 global 1-arc-second DEM (SRTMGL1) dataset from Google Earth Engine. The aquaculture pond extraction results were validated against the statistical yearbook data, demonstrating high reliability in spatial mapping accuracy. Our research mainly refers to the China Fishery Statistical Yearbook and Anhui Provincial Statistical Yearbook.

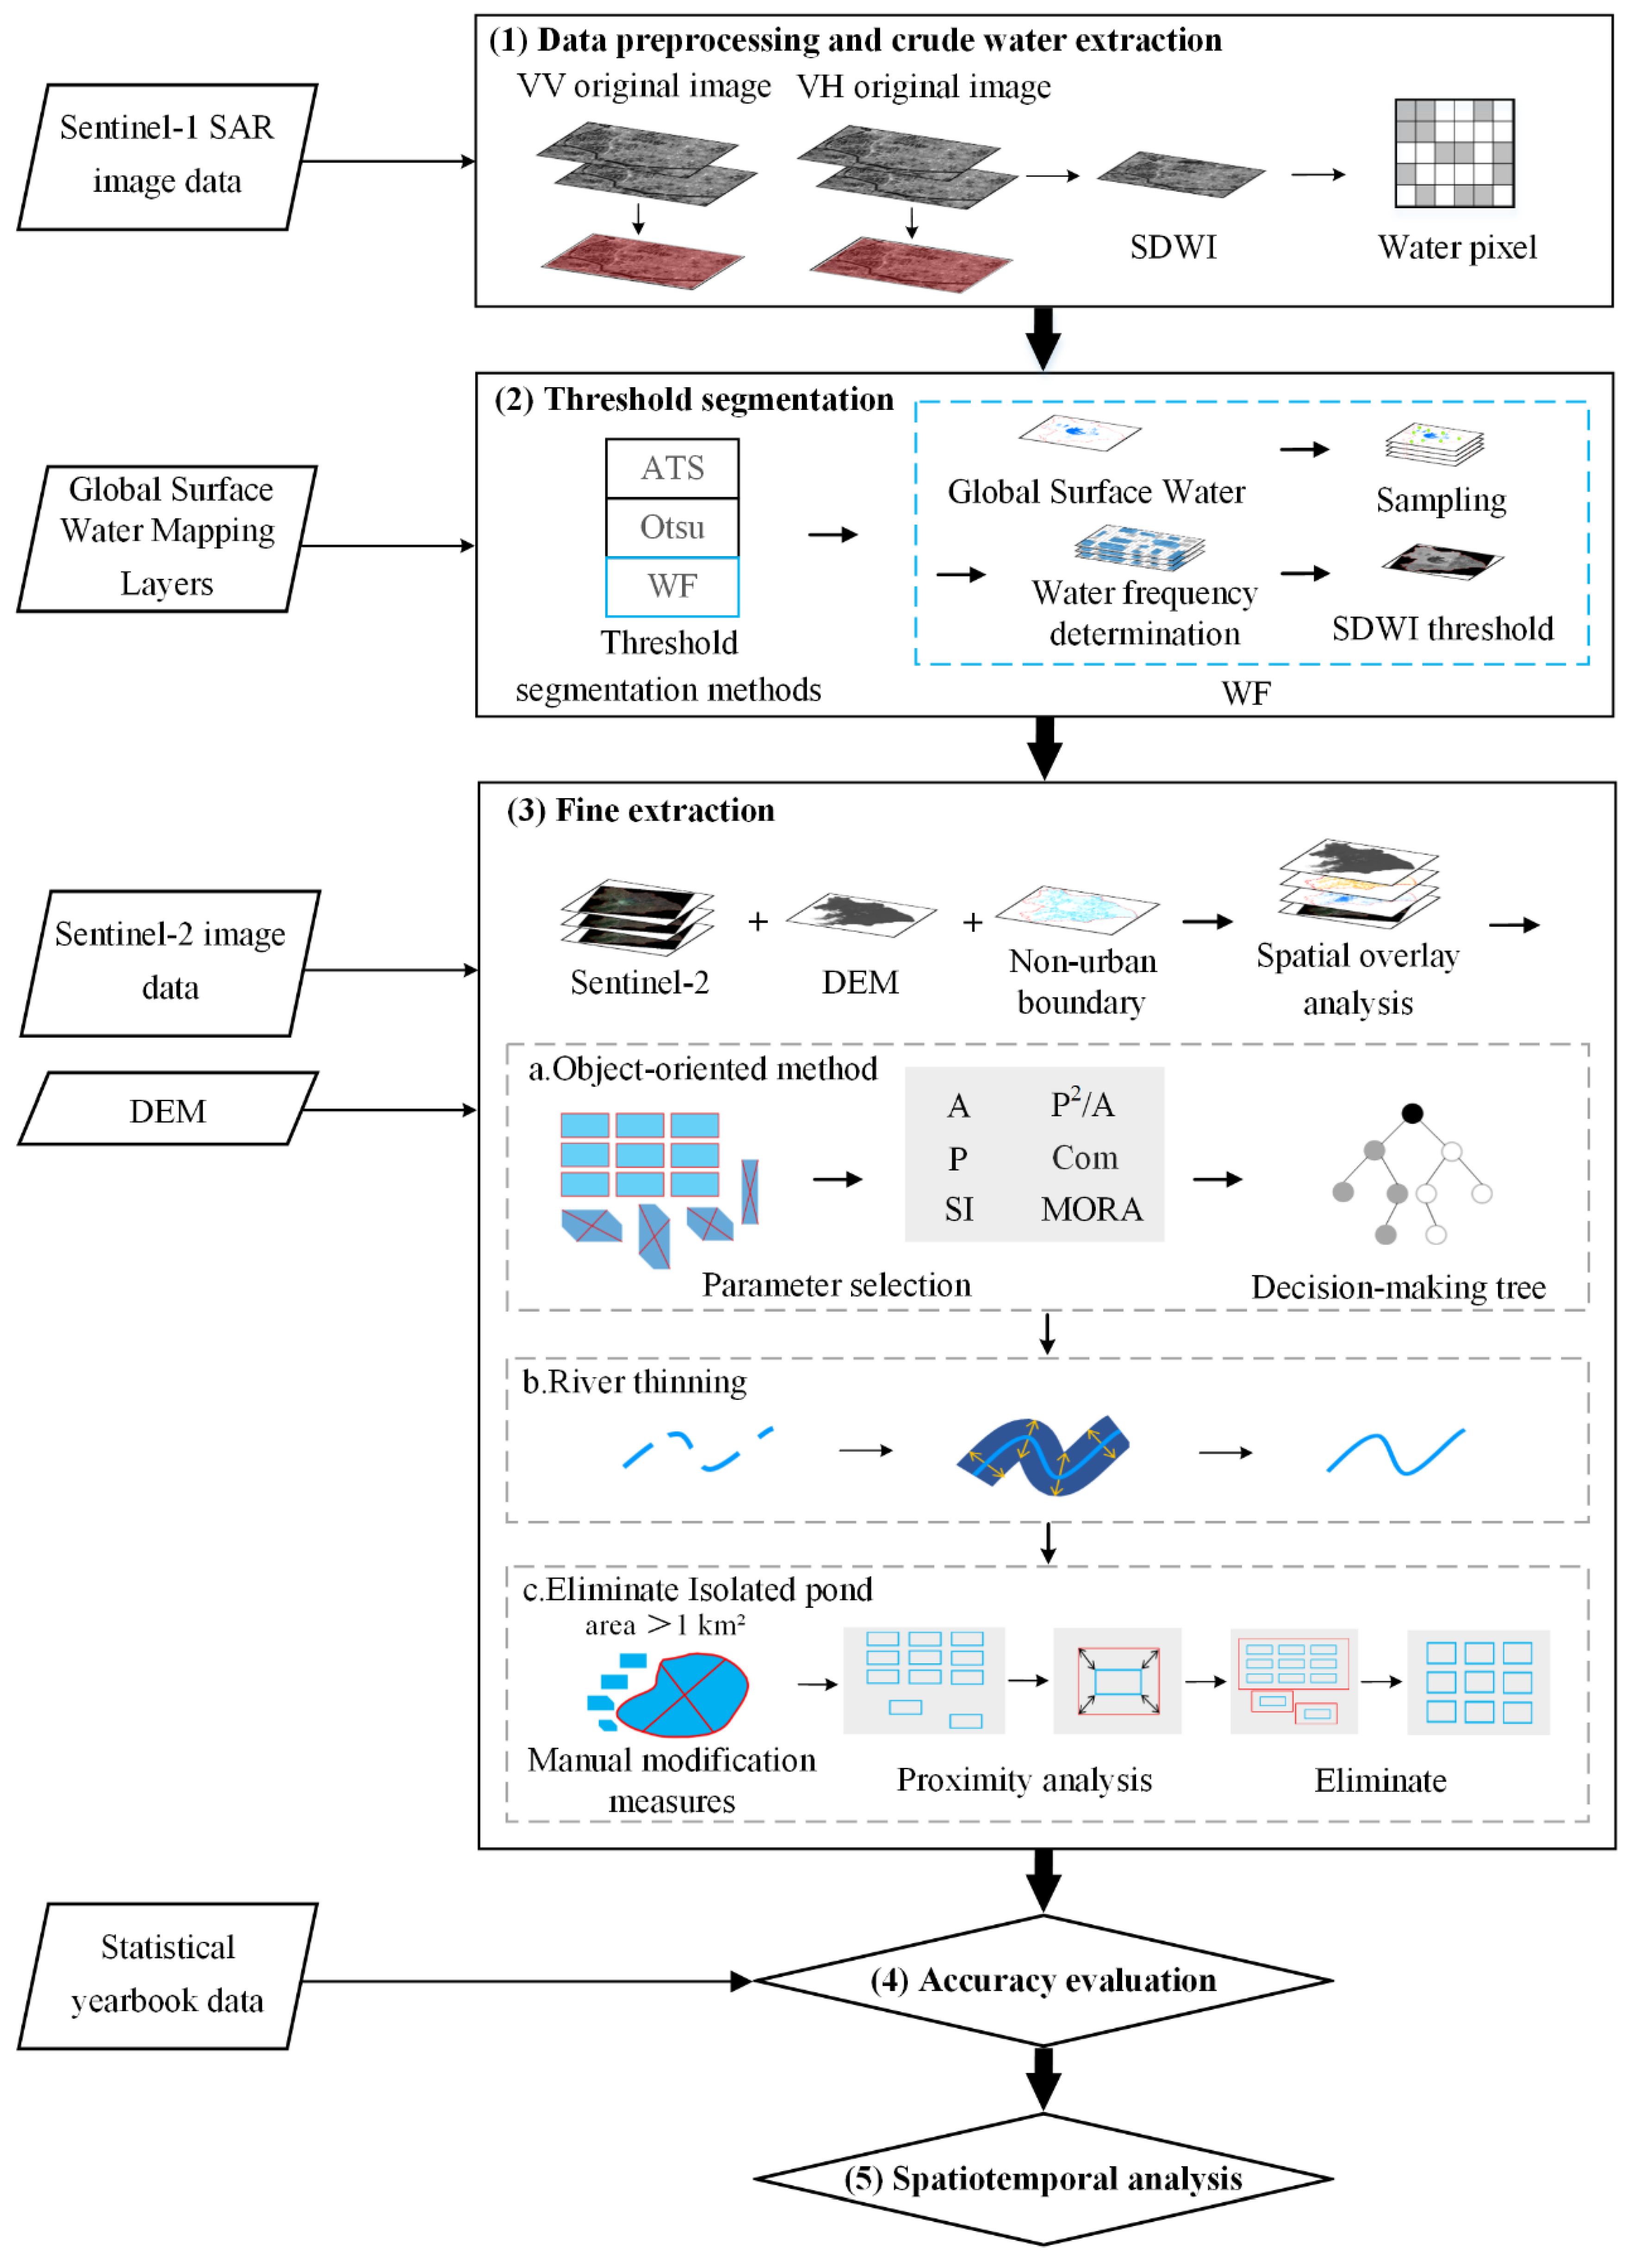
2.2. Modelling Framework

In the developed MOFA, the process consists of five major steps: (1) data preprocessing and crude water extraction, (2) threshold segmentation, (3) fine extraction, (4) accuracy evaluation, and (5) spatiotemporal analysis (see Figure 2).

2.2.1. Data Preprocessing and Crude Water Extraction

In the MOFA, Sentinel-1 SAR served as the primary input for initial water body delineation, with the Sentinel-1 Dual-Polarized Water Index (SDWI) employed to enhance water feature identification. The relationship between the Sentinel-1 Dual-Polarized Water Index (VV and VH) and water information extraction was studied. The extraction of water features was optimized through a reduction in soil and vegetation spectral interference. The outline of the lake, the zigzag channel, and the shape and structure of aquaculture ponds are clearly displayed and mapped, indicating that the SDWI method can extract water information perfectly.

2.2.2. Threshold Segmentation

For aquaculture ponds with weak boundary features, the default threshold value of SDWI may lose edge information, resulting in classification failure [2]. The selection of the SDWI threshold is critical to the accurate extraction of aquaculture ponds, so we select three approaches to determine the threshold, including adaptive threshold segmentation (ATS) [2], OTSU algorithm (OTSU) [41], and water frequency method (WF) [38]. We used the Chaohu Lake basin as an example to determine the optimal threshold extraction method. Then, we conducted stratified random sampling based on Google Earth’s high-resolution images to obtain a validation dataset for accuracy evaluation. After comparing the threshold segmentation effects among these three methods, we found that the extraction accuracy of WF is higher (Figure 3). Therefore, WF for threshold segmentation was selected for the MOFA.

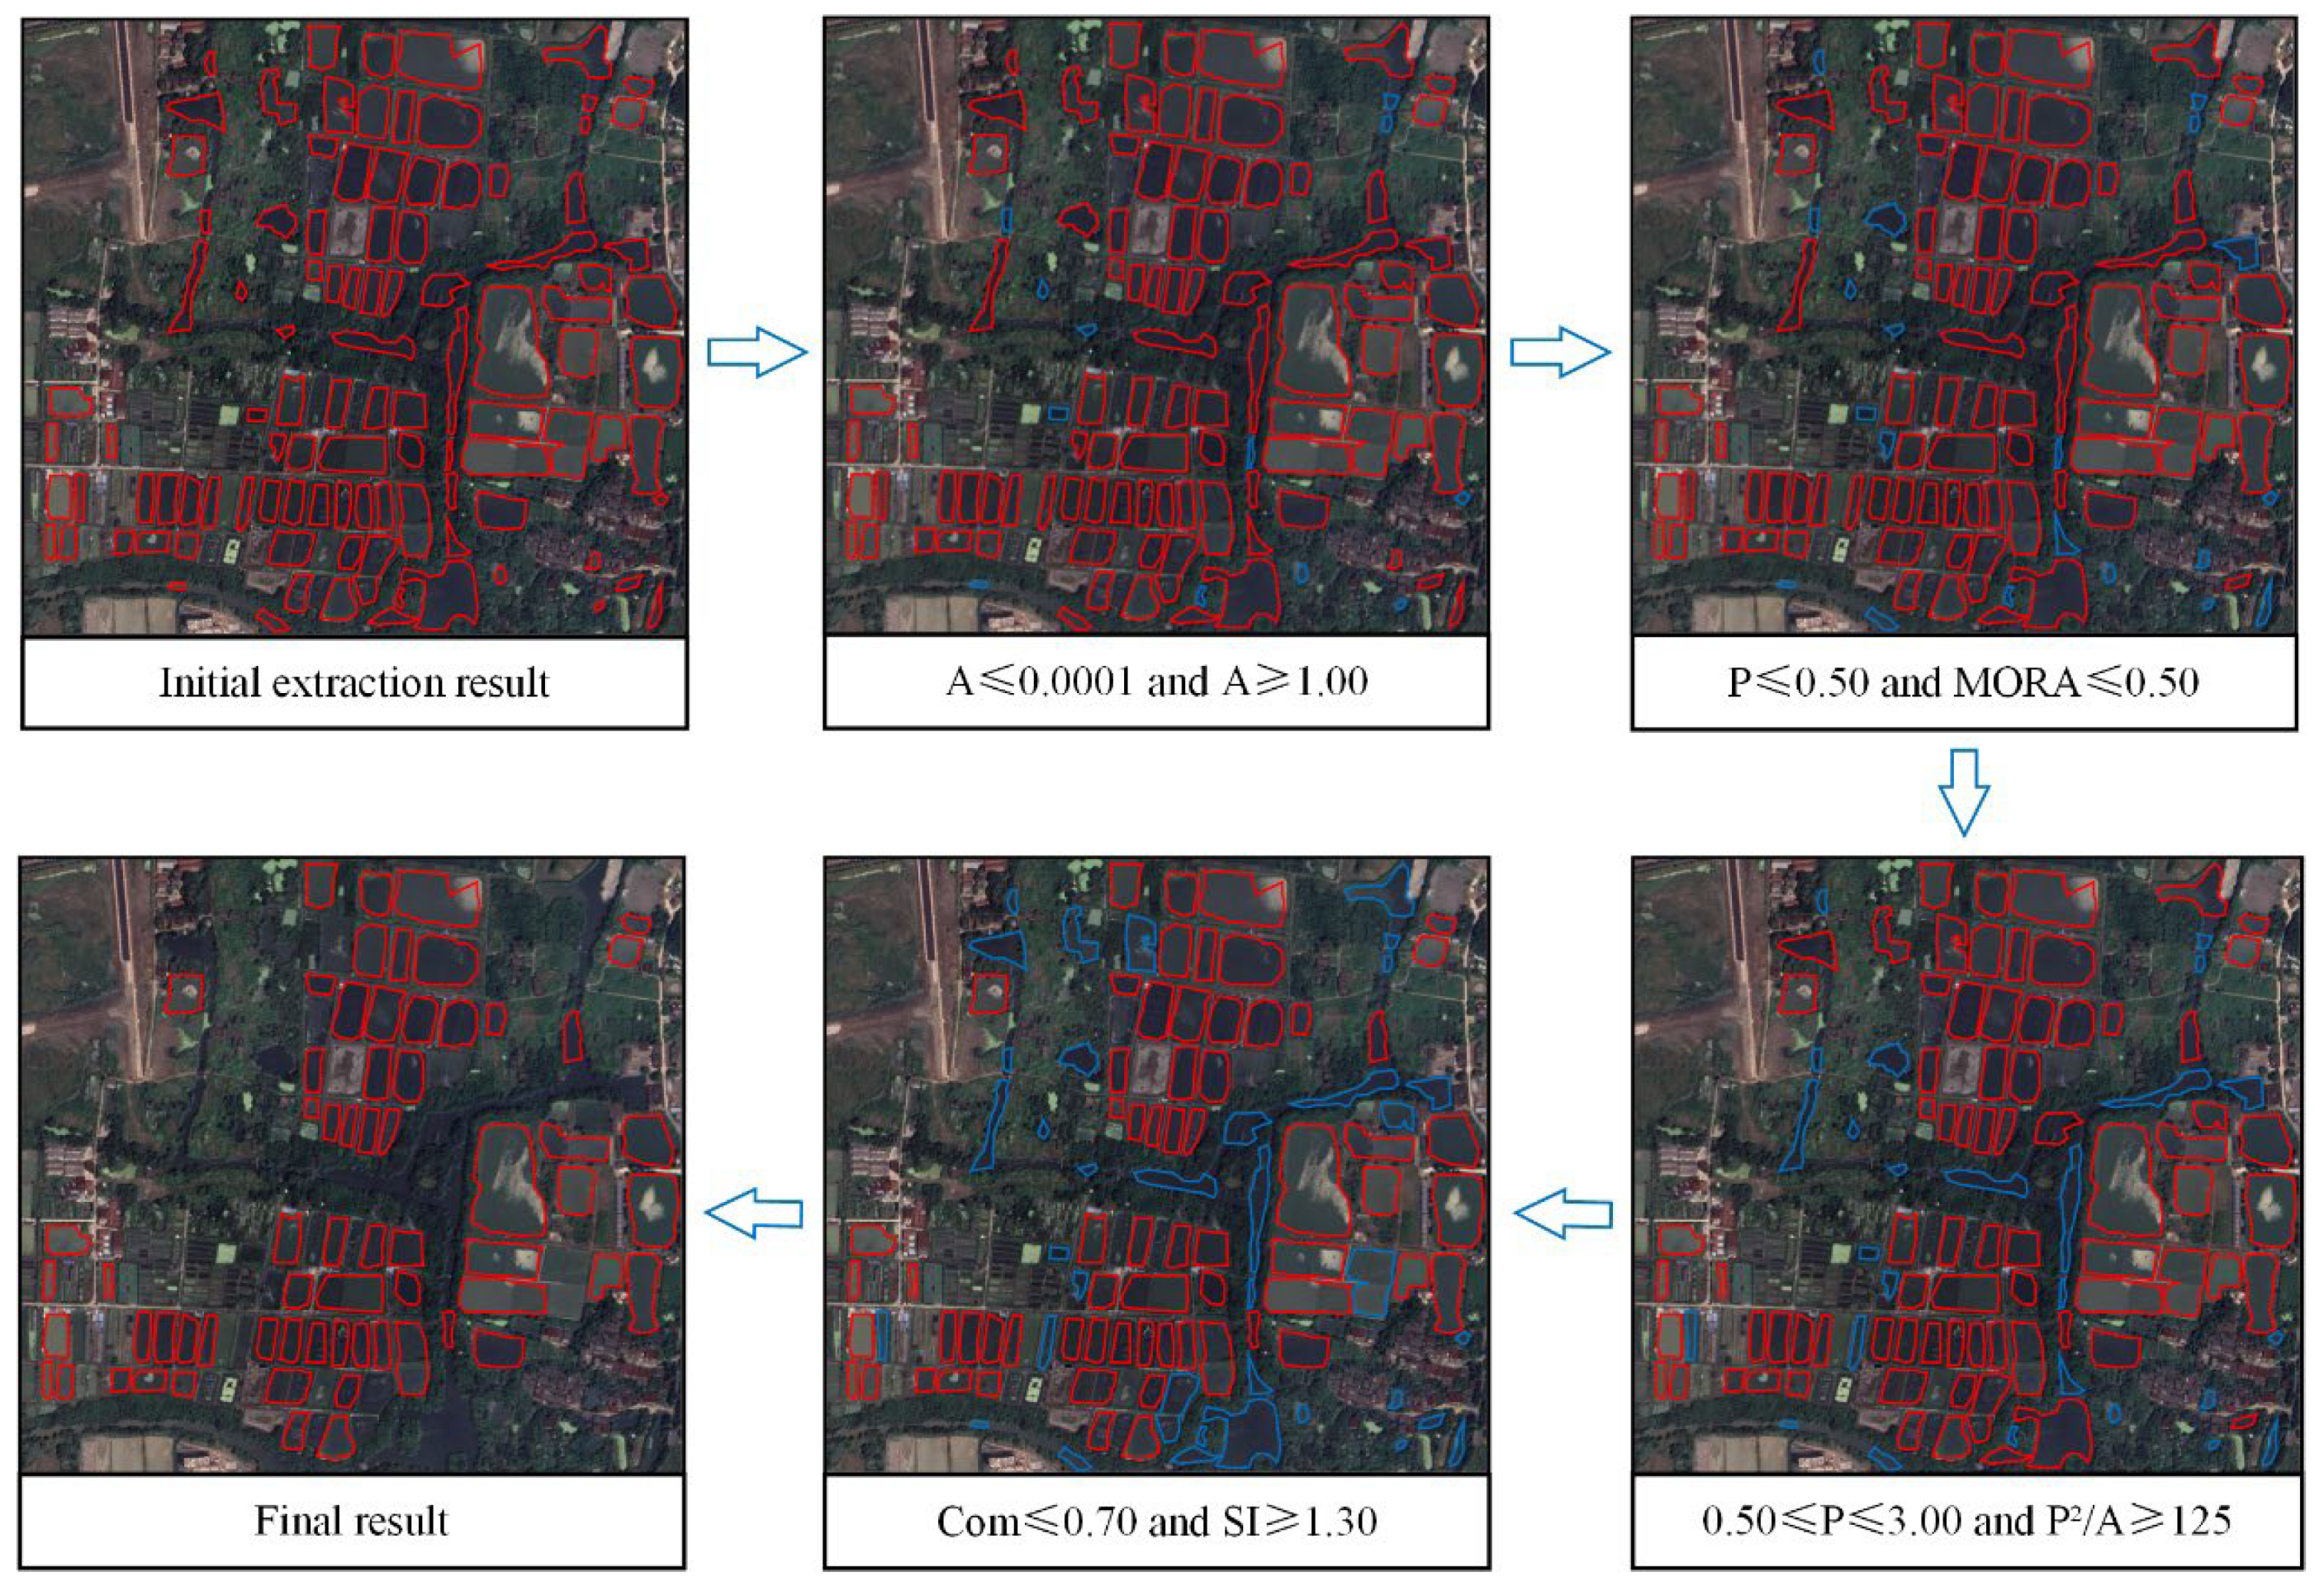
2.2.3. Fine Extraction

Aquaculture ponds are mainly shallow water bodies and can easily be confused with lakes, reservoirs, and rivers. The MOFA can effectively extract potential aquaculture ponds and achieve fine extraction for aquaculture ponds with obvious geometric features. Based on prior studies, six sensitive parameters were identified to characterize morphological differences between aquaculture and non-aquaculture pond boundaries (Table 2) [20,42,43].
The geometric parameter thresholds of aquaculture ponds were determined by comparing the high-resolution images from Google Earth, and then the surface water feature dataset of the Chaohu Lake basin was constructed. The feature dataset was utilized to train decision trees and validate their classification accuracy for aquaculture pond mapping in the Chaohu Lake basin [32].
Shown in Figure 4 are the decision trees based on datasets and geometric feature training. Decision tree classifiers may misclassify discontinuous rivers in SAR images as aquaculture ponds because they exhibit similar shape features and backscatter coefficients. The MOFA uses morphological techniques to remove discontinuous data streams. The MOFA first builds a buffer zone for each aquaculture pond object, then uses the erosion process to restore all buffers to their initial size, and ultimately extracts potential aquaculture ponds based on geometric features [32]. Aquaculture ponds, characterized by intensive management and large-scale operations, exhibit distinct features that differentiate them from natural water bodies, such as isolated lakes and reservoirs. Therefore, aquaculture ponds are usually close to each other, the MOFA uses a method based on neighborhood expansion and spatial extraction to remove isolated ponds.

2.2.4. Accuracy Evaluation

To verify the extraction effect of the MOFA, we first divided the Chaohu Lake basin into two categories: aquaculture ponds and non-aquaculture ponds (vegetation, ditches, rivers, and lakes). Then, 1027 sampling points were randomly constructed in the study area based on Google Earth’s images. Furthermore, the confusion matrix of aquaculture ponds and non-aquaculture ponds in the Chaohu Lake basin in different years was constructed. Finally, the user accuracy (UA), producer accuracy (PA), overall accuracy (OA), and Kappa coefficient were extracted from the confusion matrix to validate model performance.

2.2.5. Spatiotemporal Analysis

After completing the construction and accuracy verification of the MOFA, we applied it to the Chaohu Lake basin. The spatial patterns and temporal changes of aquaculture ponds in 2016, 2020, and 2023 in the Chaohu Lake basin were analyzed.

3. Results

3.1. Framework Application

We successfully applied the MOFA to the Chaohu Lake basin and obtained two key results (Figure 5). (1) Over the three distinct years (in 2016, 2020, and 2023), the OA of the MOFA in the Chaohu Lake basin reached 92.11%, 93.18%, and 92.79%, respectively (Table 3). (2) The Kappa coefficient, a common index to evaluate the classification accuracy, remained stable at approximately 85% over the three specific years. In conclusion, the MOFA has achieved remarkable results in aquaculture pond extraction within the Chaohu Lake basin. The research framework has expansibility, and the interpretation results have high accuracy and reliability, providing a robust foundation for subsequent related research.

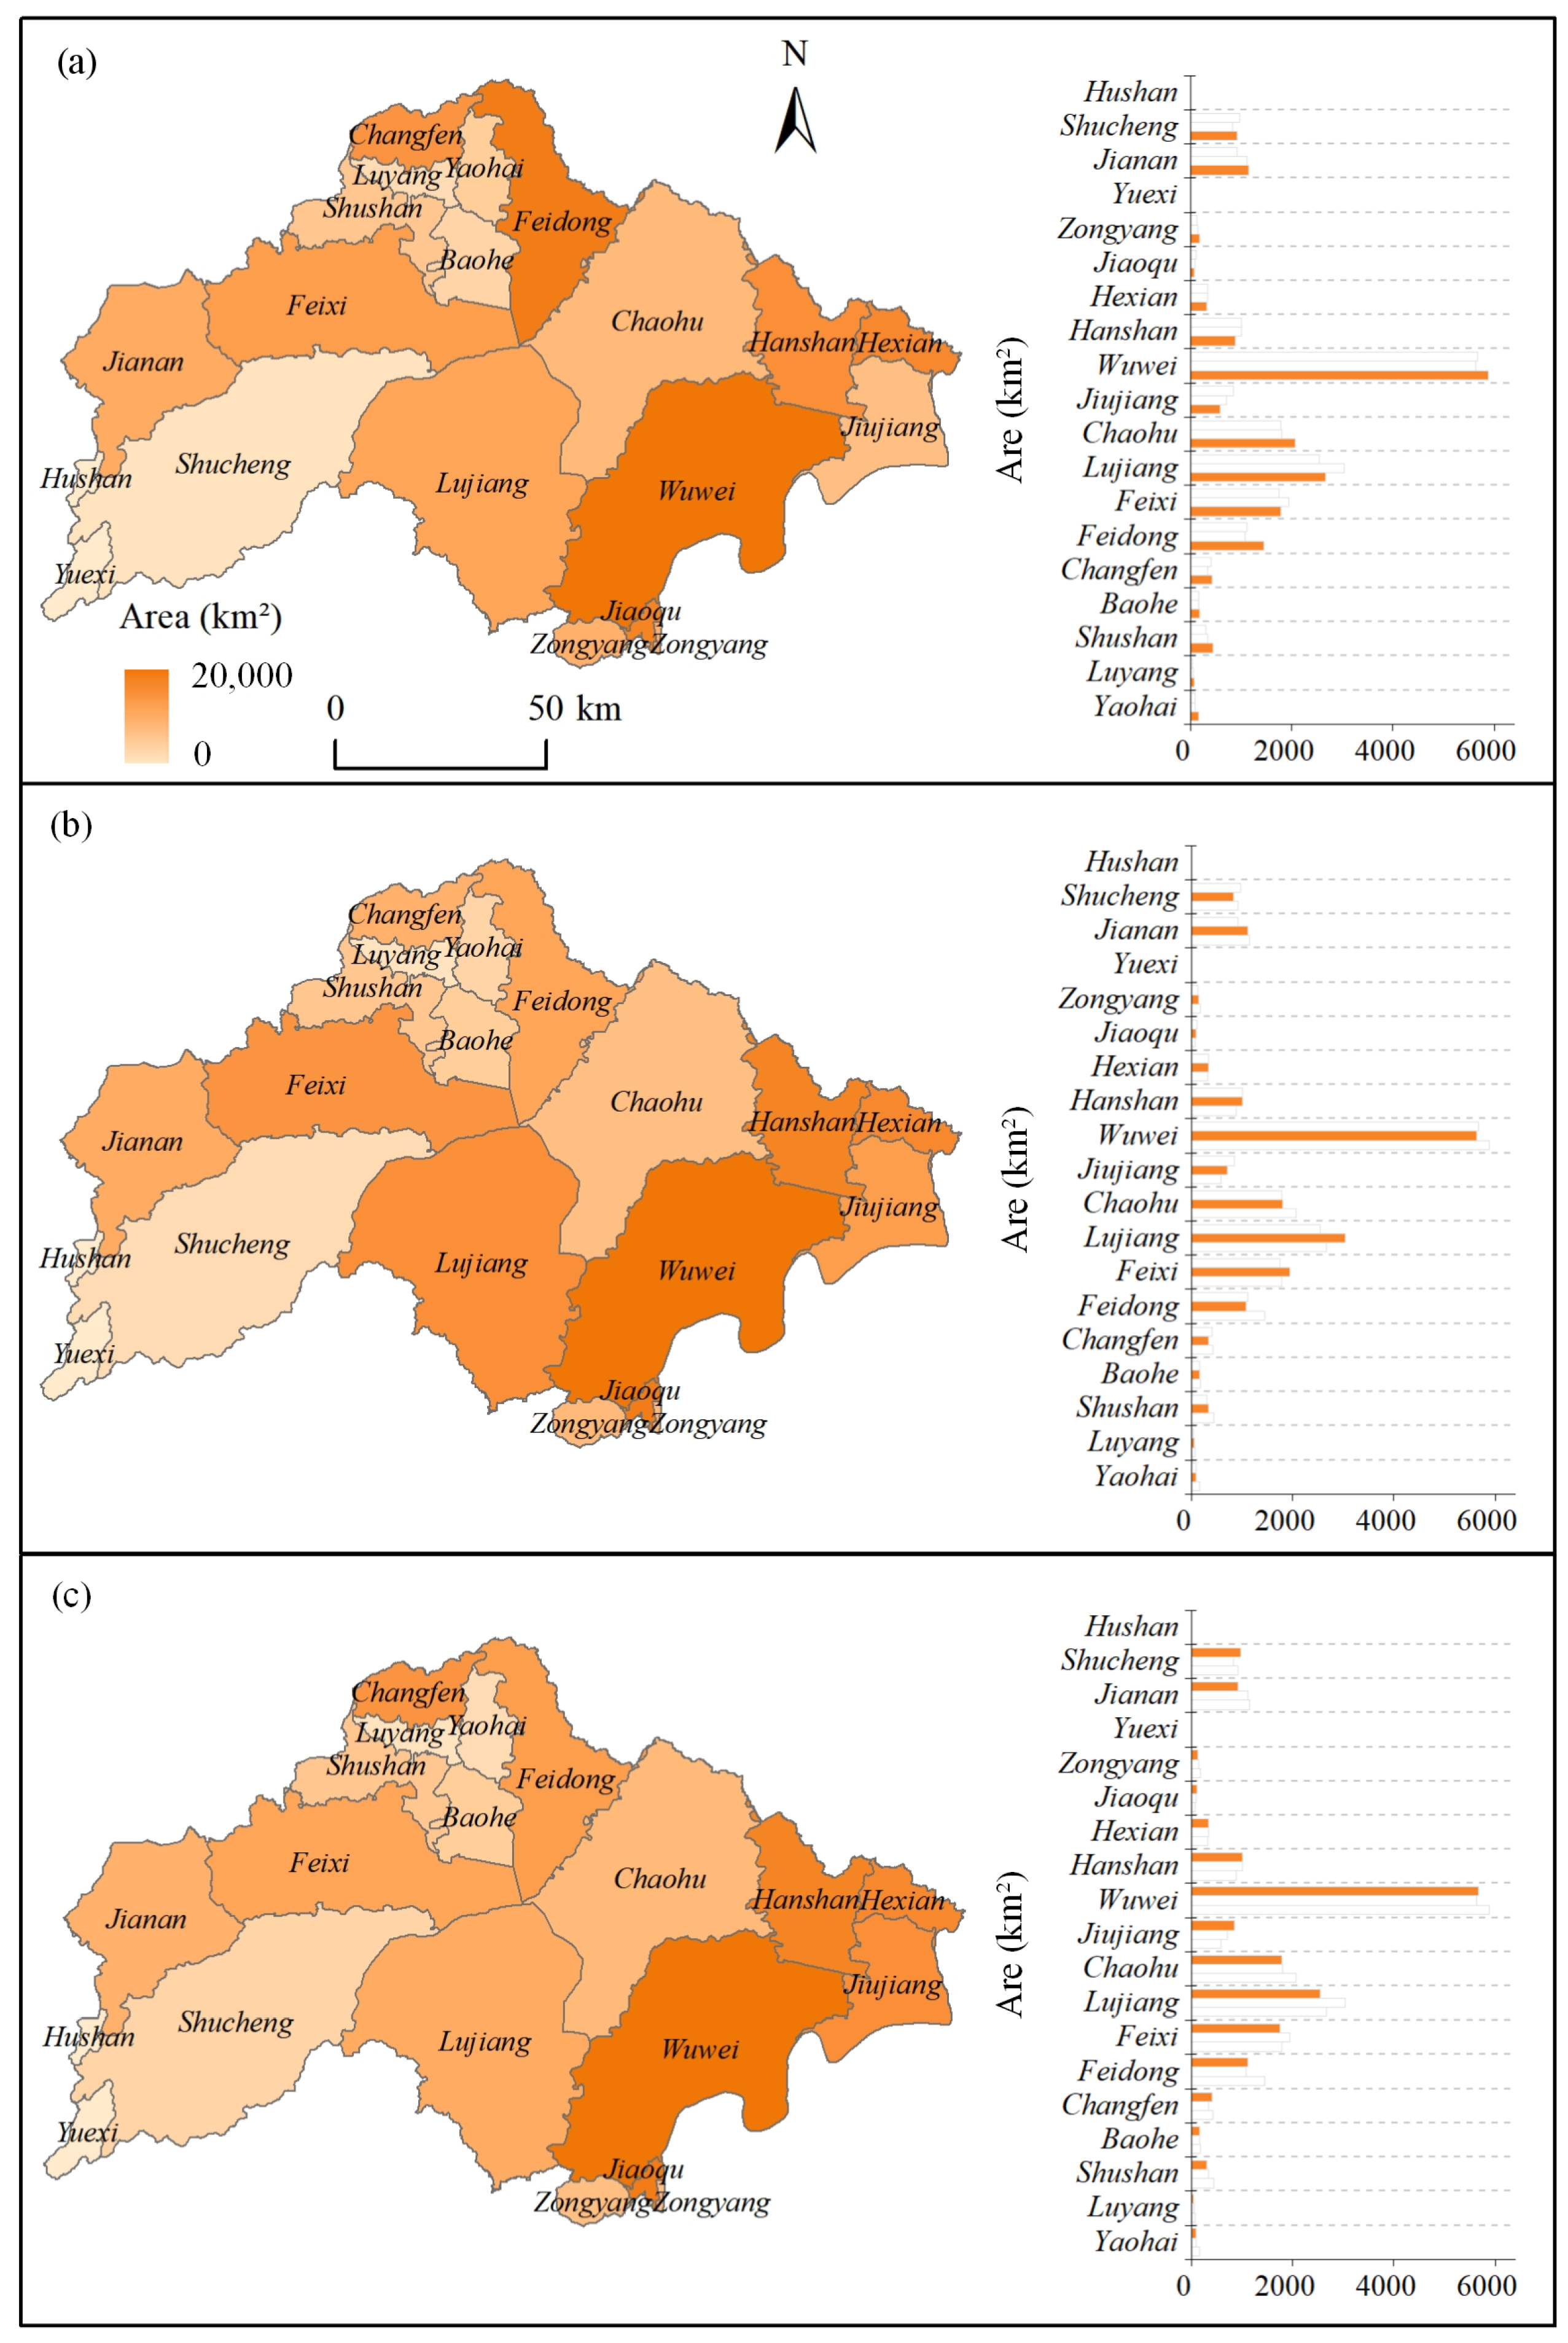
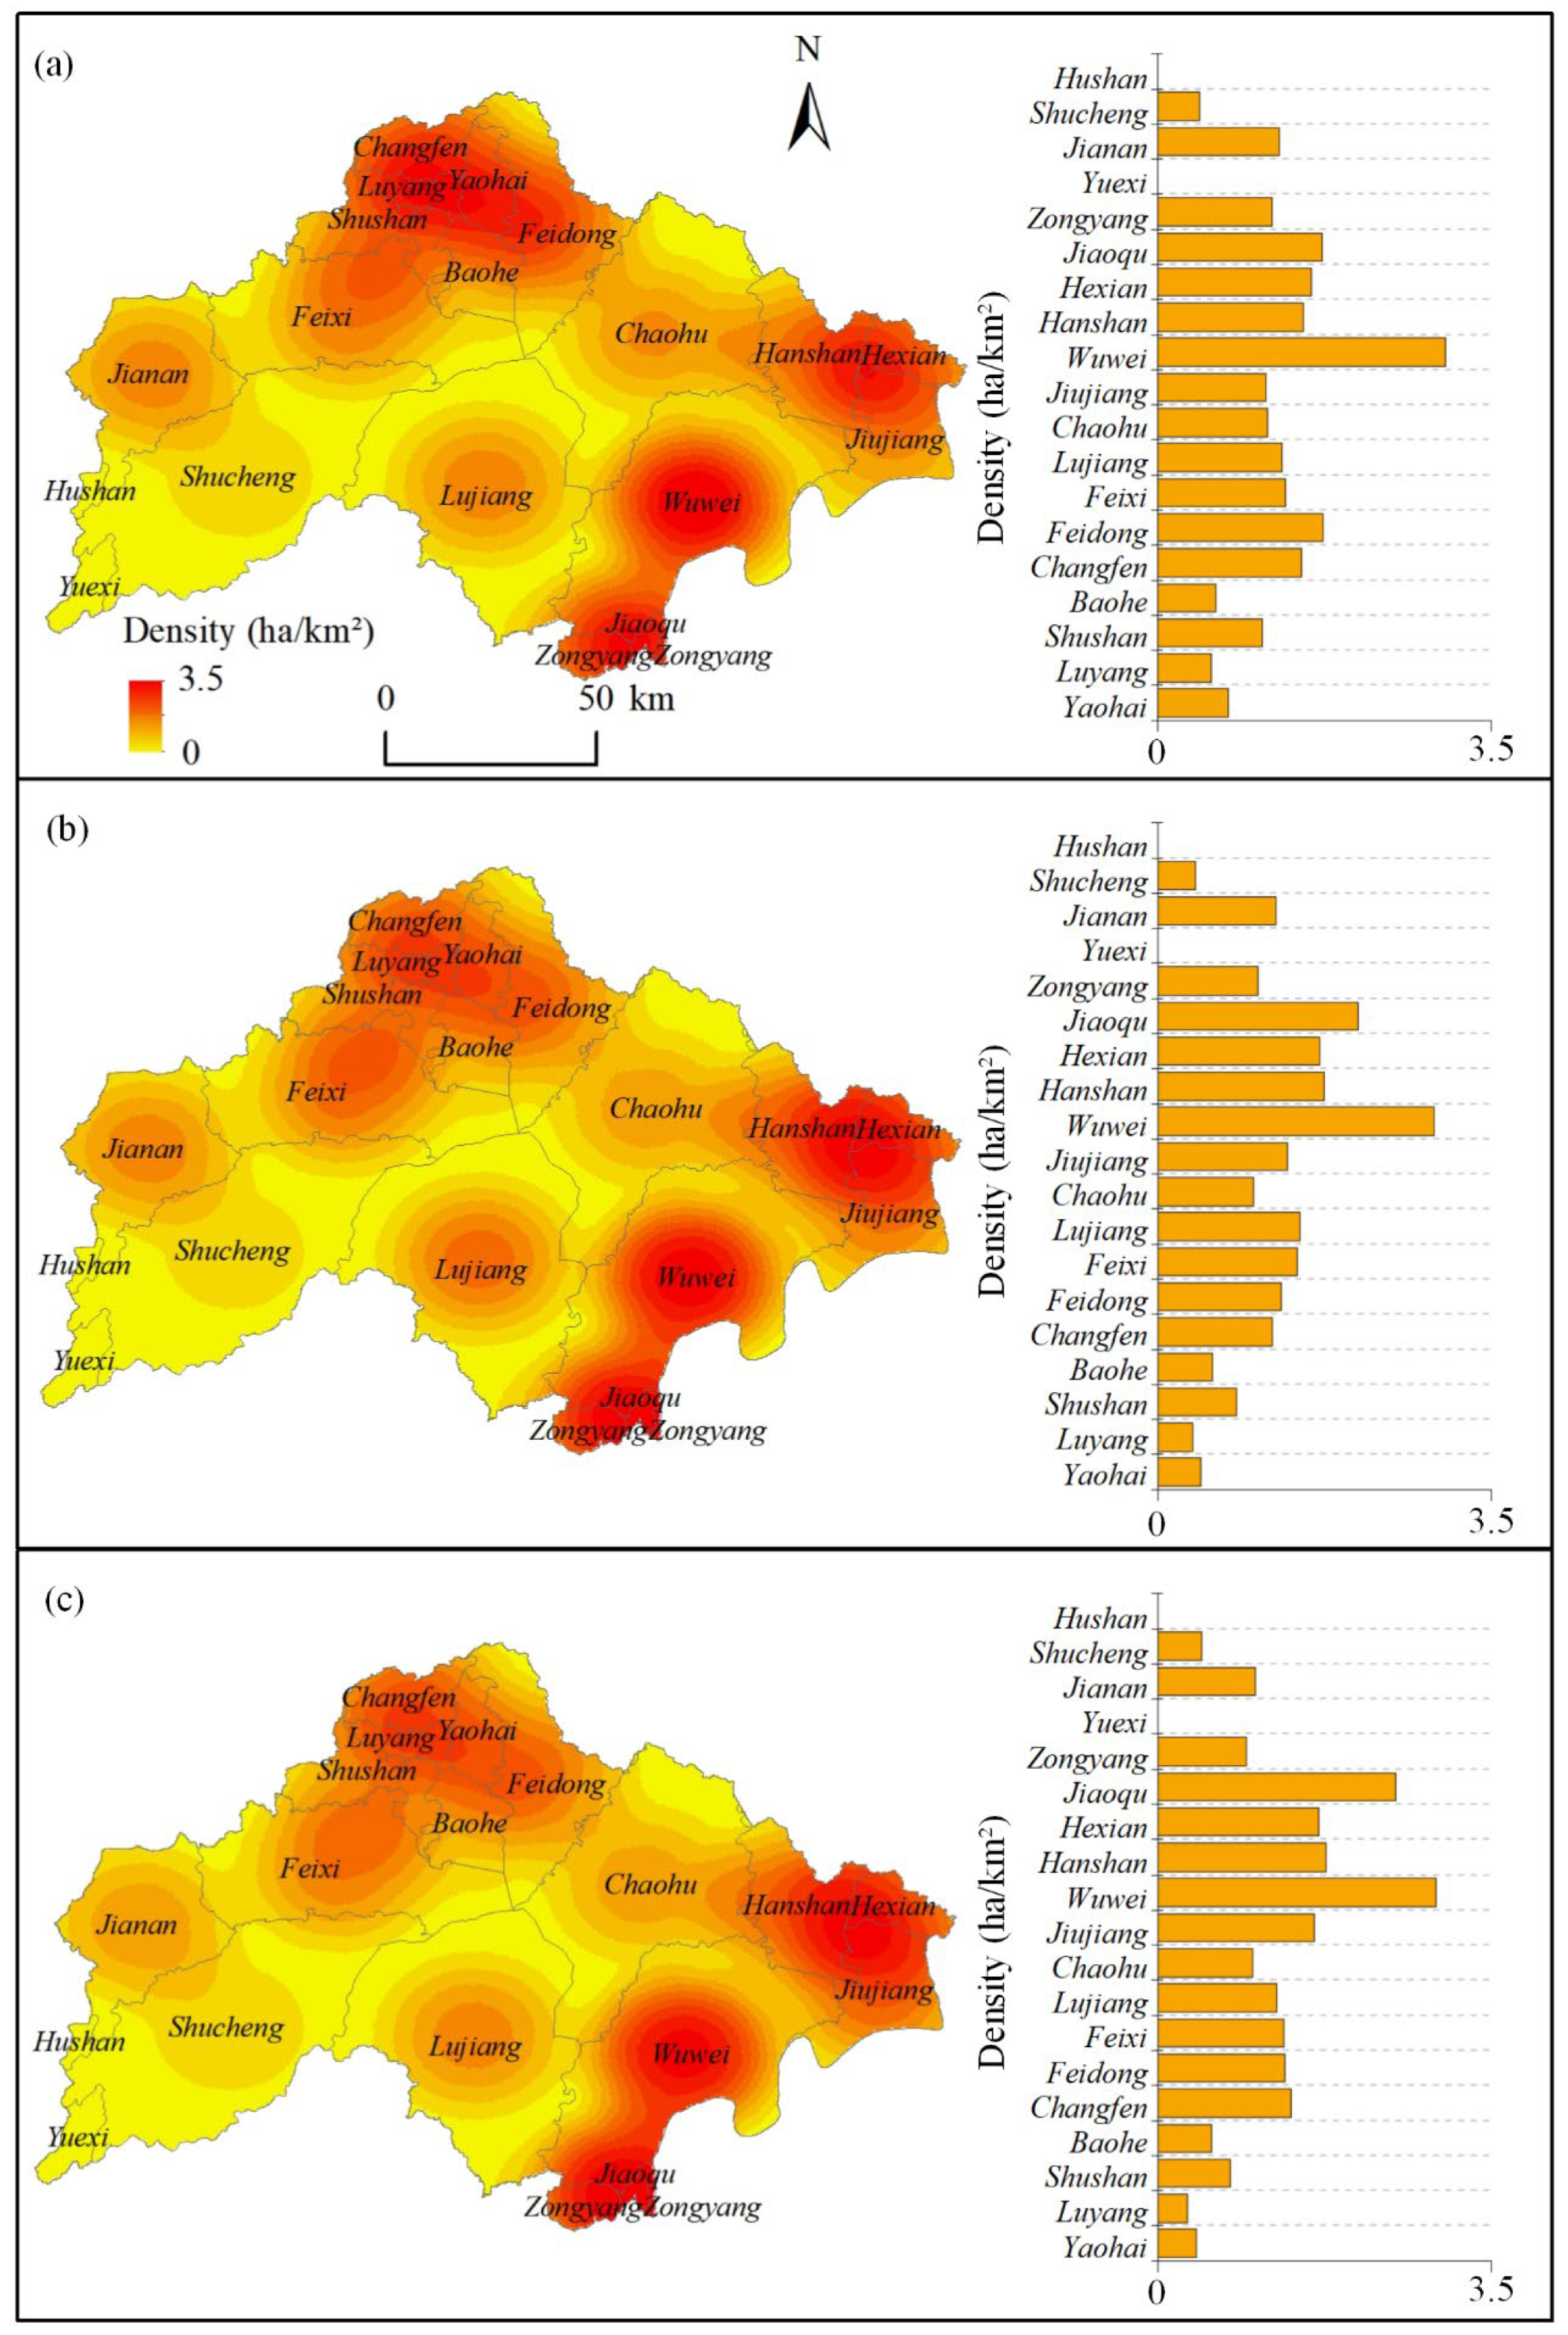
3.2. Spatial Characteristics of Aquaculture Ponds

The spatial patterns of aquaculture ponds in the Chaohu Lake basin exhibited a south-dense and north-sparse pattern during the study years of 2016, 2020, and 2023 (Figure 6). This uneven distribution reflects regional heterogeneity in the aquaculture industry. However, there is little change in the proportion of the aquaculture pond area in each county in 2016, 2020, and 2023. In 2016, Wuwei had the largest number of aquaculture ponds, occupying 30.50% of the Chaohu Lake basin, indicating that Wuwei was predominant in the aquaculture industry. Followed by Lujiang and Chaohu, whose distribution of aquaculture ponds was relatively concentrated, accounting for 13.81% and 10.73% of the total, respectively. In contrast, there is a small area of aquaculture ponds in Hefei’s districts of Luyang and Yaohai. This is due to geographical conditions, resource allocation, market demand, and other factors. This uneven spatial distribution highlights the need for local governments to account for regional heterogeneity and geographical characteristics when formulating aquaculture development strategies, emphasizing context-specific approaches tailored to local ecological and socio-economic conditions.
The area of aquaculture ponds in the Chaohu Lake basin exhibits a distinct south-dense and north-sparse pattern at the county level (Figure 7). In 2016, Shucheng had the lowest density of aquaculture ponds (0.44 ha/km2). This resulted from local natural conditions (hilly and mountainous terrain). In 2020 and 2023, the density of aquaculture ponds in Luyang decreased to the lowest, at 0.37 and 0.31 ha/km2, respectively. This is likely due to factors such as local policy adjustments, resource optimization, or changes in market demand. In contrast, aquaculture ponds in Wuwei maintained the highest density, accounting respectively for 3.02, 2.90, and 2.92 ha/km2 in 2016, 2020, and 2023. It reflects a heritage of the aquaculture industry on the basis of long-lived residents’ diet habits in Wuwei, and displays a regional leading role in aquaculture technology, as well as market development and scale.

4. Discussion

In the developed MOFA, Google Earth Engine was employed to map aquaculture ponds through the integration of multi-source datasets (Sentinel-1 SAR and Sentinel-2) and object-oriented methods (decision trees and morphological techniques). The MOFA achieves a high accuracy in the mapping of aquaculture ponds in the Chaohu Lake basin (Table 4). The application of the framework reveals the spatial heterogeneity of aquaculture ponds, which facilitates sustainable development in the inland aquaculture industry.

4.1. Advantages and Disadvantages of the Framework

(1) The MOFA has high precision, eliminates the limitations of single data sources, and effectively addresses the challenges of seasonal water body interference and spectral confusion. The MOFA uses multi-source datasets and solves the problems of high-resolution image costs, limited spatiotemporal coverage, and insufficient capability for handling large-scale aquaculture pond delineation tasks. The framework has addressed how to extract the pond boundary correctly in low-resolution images. Based on the time series SAR data, the framework effectively discriminates between seasonal water bodies and aquaculture ponds. The object-oriented method further improves the extraction efficiency of potential aquaculture ponds and solves the issue of spectral confusion in the process of extraction from the aquaculture ponds.
(2) The MOFA is not effective in extracting special kinds of aquaculture ponds. There are also specialized aquaculture ponds such as mulberry fish ponds and photovoltaic fish ponds in the aquaculture industry. The above factors may lead to potential uncertainties in aquaculture pond area estimates. Future research could specifically address the challenge of mixed pixels and consider other unique characteristics of aquaculture ponds. The accuracy of aquaculture pond extraction can be significantly improved.

4.2. Portability of the Framework

The MOFA developed for aquaculture ponds can be extended to other areas. The proposed method effectively extracts aquaculture ponds exhibiting low radar backscatter values and spatial clustering patterns. SAR images can effectively capture backscatter coefficients of surface features, enabling the extraction of diverse water bodies globally. However, the similarity in backscatter characteristics between aquaculture ponds and other water bodies remains a persistent challenge for SAR-based classification. The object-oriented method, combined with the geometric feature refinement process, effectively eliminates seasonal water bodies, lakes, rivers, and reservoirs. Modification of the parameters in the object-oriented method can better adapt to the extraction of various potential aquaculture ponds. Based on high-resolution Sentinel-1 SAR and Sentinel-2 images, small and micro-water bodies ignored in low-resolution images can be extracted. The MOFA is accessible through Google Earth Engine’s code repository and is transferable to other regions for aquaculture pond extraction, thereby facilitating the mapping of aquaculture ponds at a regional to global scale.

4.3. Implications for Sustainable Management of Aquaculture and Ecosystem Conservation

Currently, the continuous expansion of aquaculture ponds and production scale has caused an exposure of potential environmental and management problems in the aquaculture industry. For instance, some farmers commonly carry out high-density farming to pursue greater economic benefits, thereby resulting in serious environmental ramifications. Accurate and rapid delineation of aquaculture ponds is an important prerequisite for analyzing the development of the aquaculture industry. Extracting and mapping aquaculture ponds can provide strategic support for the sustainable development of the aquaculture industry and for ecosystem conservation. By applying the MOFA, we can accurately grasp the regional distribution of aquaculture ponds to alleviate adverse environmental and ecological ramifications and to enhance regional sustainable development strategies.

5. Conclusions

An aquaculture pond extraction framework (MOFA) was developed and successfully applied in the Chaohu Lake basin. Our framework development, validation, and application practices show that the MOFA may be an alternative (OA = 90.75%, Kappa = 85%) for quantifying the distribution of aquaculture ponds. The MOFA combines the object-oriented method and multi-source data to achieve dynamic monitoring of aquaculture ponds with satisfactory results. In addition, the MOFA has wide portability and can be well applied to other areas through Google Earth Engine. The implementation and application of the framework can better monitor aquaculture ponds and provide scientific suggestions for the aquaculture industry and aquatic environment protection.

Author Contributions

Conceptualization, L.Q. and L.Y.; Methodology, L.Q.; Software, L.Q. and H.Y.; Validation, H.Y.; Formal analysis, L.Q.; Investigation, L.Q. and M.G.; Resources, L.Y.; Data curation, Z.W., F.W. and K.Z.; Writing—original draft, L.Q.; Writing—review & editing, L.D., L.Y. and S.Z.; Visualization, Z.W., F.W. and K.Z.; Supervision, L.Y.; Funding acquisition, L.Q. and L.Y. All authors have read and agreed to the published version of the manuscript.

Funding

The project was financially supported by National Natural Science Foundation of China (42001087 and 42222104), Natural Science Research Project of Anhui Educational Committee (2023AH050151), Collaborative Innovation Center of Recovery and Reconstruction of Degraded Ecosystem in Wanjiang Basin (CIWB22-022), Science and Technology Project of Wuhu City (2023yf073), and Science and Technology Planning Project of NIGLAS (NIGLAS2022GS10). Special thanks to Zhangli Kang, Geliang Wei, and Wangxu Dong for their help and support.

Data Availability Statement

Dataset available on request from the authors.

Conflicts of Interest

The authors declare that they have no known competing financial interests or personal relationships that could have appeared to influence the work reported in this paper.

References

  1. Ottinger, M.; Clauss, K.; Kuenzer, C. Aquaculture: Relevance, distribution, impacts and spatial assessments—A review. Ocean. Coast. Manag. 2016, 119, 244–266. [Google Scholar] [CrossRef]
  2. Sun, Z.; Luo, J.; Gu, X.; Qi, T.; Xiao, Q.; Shen, M.; Ma, J.; Zeng, Q.; Duan, H. Policy-driven opposite changes of coastal aquaculture ponds between China and Vietnam: Evidence from Sentinel-1 images. Aquaculture 2023, 571, 739474. [Google Scholar] [CrossRef]
  3. Yao, H. Characterizing landuse changes in 1990–2010 in the coastal zone of Nantong, Jiangsu province, China. Ocean. Coast. Manag. 2013, 71, 108–115. [Google Scholar] [CrossRef]
  4. Bohnes, F.A.; Laurent, A. Environmental impacts of existing and future aquaculture production: Comparison of technologies and feed options in Singapore. Aquaculture 2021, 532, 736001. [Google Scholar] [CrossRef]
  5. Nguyen, T.T.N.; Némery, J.; Gratiot, N.; Strady, E.; Tran, V.Q.; Nguyen, A.T.; Aimé, J.; Peyne, A. Nutrient dynamics and eutrophication assessment in the tropical river system of Saigon—Dongnai (southern Vietnam). Sci. Total Environ. 2019, 653, 370–383. [Google Scholar] [CrossRef]
  6. Hukom, V.; Nielsen, R.; Asmild, M.; Nielsen, M. Do Aquaculture Farmers Have an Incentive to Maintain Good Water Quality? The Case of Small-Scale Shrimp Farming in Indonesia. Ecol. Econ. 2020, 176, 106717. [Google Scholar] [CrossRef]
  7. Yu, L.; Gan, J. Mitigation of Eutrophication and Hypoxia through Oyster Aquaculture: An Ecosystem Model Evaluation off the Pearl River Estuary. Environ. Sci. Technol. 2021, 55, 5506–5514. [Google Scholar] [CrossRef]
  8. Thomsen, E.; Herbeck, L.S.; Jennerjahn, T.C. The end of resilience: Surpassed nitrogen thresholds in coastal waters led to severe seagrass loss after decades of exposure to aquaculture effluents. Mar. Environ. Res. 2020, 160, 104986. [Google Scholar] [CrossRef]
  9. Cui, L.; Li, G.; Ouyang, N.; Mu, F.; Yan, F.; Zhang, Y.; Huang, X. Analyzing Coastal Wetland Degradation and its Key Restoration Technologies in the Coastal Area of Jiangsu, China. Wetlands 2018, 38, 525–537. [Google Scholar] [CrossRef]
  10. Ren, C.; Wang, Z.; Zhang, Y.; Zhang, B.; Chen, L.; Xi, Y.; Xiao, X.; Doughty, R.; Liu, M.; Jia, M.; et al. Rapid expansion of coastal aquaculture ponds in China from Landsat observations during 1984–2016. Int. J. Appl. Earth Obs. Geoinf. 2019, 82, 101902. [Google Scholar] [CrossRef]
  11. Duan, Y.; Li, X.; Zhang, L.; Chen, D.; Liu, S.A.; Ji, H. Mapping national-scale aquaculture ponds based on the Google Earth Engine in the Chinese coastal zone. Aquaculture 2020, 520, 734666. [Google Scholar] [CrossRef]
  12. Duan, Y.; Li, X.; Zhang, L.; Liu, W.; Liu, S.A.; Chen, D.; Ji, H. Detecting spatiotemporal changes of large-scale aquaculture ponds regions over 1988-2018 in Jiangsu Province, China using Google Earth Engine. Ocean. Coast. Manag. 2020, 188, 105144. [Google Scholar] [CrossRef]
  13. Ottinger, M.; Clauss, K.; Kuenzer, C. Large-Scale Assessment of Coastal Aquaculture Ponds with Sentinel-1 Time Series Data. Remote Sens. 2017, 9, 440. [Google Scholar] [CrossRef]
  14. Prasad, K.A.; Ottinger, M.; Wei, C.; Leinenkugel, P. Assessment of Coastal Aquaculture for India from Sentinel-1 SAR Time Series. Remote Sens. 2019, 11, 357. [Google Scholar] [CrossRef]
  15. Gusmawati, N.; Soulard, B.; Selmaoui-Folcher, N.; Proisy, C.; Mustafa, A.; Le Gendre, R.; Laugier, T.; Lemonnier, H. Surveying shrimp aquaculture pond activity using multitemporal VHSR satellite images—Case study from the Perancak estuary, Bali, Indonesia. Mar. Pollut. Bull. 2018, 131, 49–60. [Google Scholar] [CrossRef]
  16. Peng, Y.; Sengupta, D.; Duan, Y.; Chen, C.; Tian, B. Accurate mapping of Chinese coastal aquaculture ponds using biophysical parameters based on Sentinel-2 time series images. Mar. Pollut. Bull. 2022, 181, 113901. [Google Scholar] [CrossRef]
  17. Zeng, Z.; Wang, D.; Tan, W.; Huang, J. Extracting aquaculture ponds from natural water surfaces around inland lakes on medium resolution multispectral images. Int. J. Appl. Earth Obs. Geoinf. 2019, 80, 13–25. [Google Scholar] [CrossRef]
  18. Hou, Y.; Zhao, G.; Chen, X.; Yu, X. Improving Satellite Retrieval of Coastal Aquaculture Pond by Adding Water Quality Parameters. Remote Sens. 2022, 14, 3306. [Google Scholar] [CrossRef]
  19. Zou, Z.; Chen, C.; Liu, Z.; Zhang, Z.; Liang, J.; Chen, H.; Wang, L. Extraction of Aquaculture Ponds along Coastal Region Using U2-Net Deep Learning Model from Remote Sensing Images. Remote Sens. 2022, 14, 4001. [Google Scholar] [CrossRef]
  20. Virdis, S.G.P. An object-based image analysis approach for aquaculture ponds precise mapping and monitoring: A case study of Tam Giang-Cau Hai Lagoon, Vietnam. Environ. Monit. Assess. 2014, 186, 117–133. [Google Scholar] [CrossRef]
  21. Jayanthi, M.; Thirumurthy, S.; Nagaraj, G.; Muralidhar, M.; Ravichandran, P. Spatial and temporal changes in mangrove cover across the protected and unprotected forests of India. Estuar. Coast. Shelf Sci. 2018, 213, 81–91. [Google Scholar] [CrossRef]
  22. Fan, J.; Zhao, J.; An, W.; Hu, Y. Marine Floating Raft Aquaculture Detection of GF-3 PolSAR Images Based on Collective Multikernel Fuzzy Clustering. IEEE J. Sel. Top. Appl. Earth Obs. Remote Sens. 2019, 12, 2741–2754. [Google Scholar] [CrossRef]
  23. Geng, X.; Li, X.M.; Jia, T. Automatic Extraction of Marine Aquaculture Areas Based on the Semantic Segmentation Network from GF-3 SAR Data. In Proceedings of the IGARSS 2022–2022 IEEE International Geoscience and Remote Sensing Symposium, Kuala Lumpur, Malaysia, 17–22 July 2022; pp. 5164–5167. [Google Scholar] [CrossRef]
  24. Yu, J.; He, X.; Yang, P.; Motagh, M.; Xu, J.; Xiong, J. Coastal Aquaculture Extraction Using GF-3 Fully Polarimetric SAR Imagery: A Framework Integrating UNet++ with Marker-Controlled Watershed Segmentation. Remote Sens. 2023, 15, 2246. [Google Scholar] [CrossRef]
  25. Ottinger, M.; Clauss, K.; Kuenzer, C. Opportunities and Challenges for the Estimation of Aquaculture Production Based on Earth Observation Data. Remote Sens. 2018, 10, 1076. [Google Scholar] [CrossRef]
  26. Tian, P.; Liu, Y.; Li, J.; Pu, R.; Cao, L.; Zhang, H.; Ai, S.; Yang, Y. Mapping Coastal Aquaculture Ponds of China Using Sentinel SAR Images in 2020 and Google Earth Engine. Remote Sens. 2022, 14, 5372. [Google Scholar] [CrossRef]
  27. Liang, J.; Liu, D. A local thresholding approach to flood water delineation using Sentinel-1 SAR imagery. ISPRS J. Photogramm. Remote Sens. 2020, 159, 53–62. [Google Scholar] [CrossRef]
  28. Singha, M.; Dong, J.; Zhang, G.; Xiao, X. High resolution paddy rice maps in cloud-prone Bangladesh and Northeast India using Sentinel-1 data. Sci. Data 2019, 6, 26. [Google Scholar] [CrossRef]
  29. Liu, C.; Xu, J.; Xu, K.; Yu, J. Mapping large-scale aquaculture ponds in Jiangsu Province, China: An automatic extraction framework based on Sentinel-1 time-series imagery. Aquaculture 2024, 581, 740441. [Google Scholar] [CrossRef]
  30. Chen, S.; Huang, W.; Chen, Y.; Feng, M. An Adaptive Thresholding Approach toward Rapid Flood Coverage Extraction from Sentinel-1 SAR Imagery. Remote Sens. 2021, 13, 4899. [Google Scholar] [CrossRef]
  31. Ottinger, M.; Bachofer, F.; Huth, J.; Kuenzer, C. Mapping Aquaculture Ponds for the Coastal Zone of Asia with Sentinel-1 and Sentinel-2 Time Series. Remote Sens. 2022, 14, 153. [Google Scholar] [CrossRef]
  32. Sun, Z.; Luo, J.; Yang, J.; Yu, Q.; Zhang, L.; Xue, K.; Lu, L. Nation-Scale Mapping of Coastal Aquaculture Ponds with Sentinel-1 SAR Data Using Google Earth Engine. Remote Sens. 2020, 12, 3086. [Google Scholar] [CrossRef]
  33. Li, B.; Gong, A.; Chen, Z.; Pan, X.; Li, L.; Li, J.; Bao, W. An Object-Oriented Method for Extracting Single-Object Aquaculture Ponds from 10 m Resolution Sentinel-2 Images on Google Earth Engine. Remote Sens. 2023, 15, 856. [Google Scholar] [CrossRef]
  34. Chen, Y.; He, X.; Wang, J.; Xiao, R. The Influence of Polarimetric Parameters and an Object-Based Approach on Land Cover Classification in Coastal Wetlands. Remote Sens. 2014, 6, 12575–12592. [Google Scholar] [CrossRef]
  35. Perin, V.; Tulbure, M.G.; Gaines, M.D.; Reba, M.L.; Yaeger, M.A. A multi-sensor satellite imagery approach to monitor on-farm reservoirs. Remote Sens. Environ. 2022, 270, 112796. [Google Scholar] [CrossRef]
  36. Wang, Z.; Zhang, J.; Yang, X.; Huang, C.; Su, F.; Liu, X.; Liu, Y.; Zhang, Y. Global mapping of the landside clustering of aquaculture ponds from dense time-series 10 m Sentinel-2 images on Google Earth Engine. Int. J. Appl. Earth Obs. Geoinf. 2022, 115, 103100. [Google Scholar] [CrossRef]
  37. Xia, Z.; Guo, X.; Chen, R. Automatic extraction of aquaculture ponds based on Google Earth Engine. Ocean. Coast. Manag. 2020, 198, 105348. [Google Scholar] [CrossRef]
  38. Wang, M.; Mao, D.; Xiao, X.; Song, K.; Jia, M.; Ren, C.; Wang, Z. Interannual changes of coastal aquaculture ponds in China at 10-m spatial resolution during 2016–2021. Remote Sens. Environ. 2023, 284, 113347. [Google Scholar] [CrossRef]
  39. Min, M.; Li, H.; Ma, T.; Miao, C. Will agricultural land scale management aggravate non-point source pollution?—Chaohu Lake Basin, China as a case study. Appl. Geogr. 2023, 158, 103056. [Google Scholar] [CrossRef]
  40. Duan, Y.; Tian, B.; Li, X.; Liu, D.; Sengupta, D.; Wang, Y.; Peng, Y. Tracking changes in aquaculture ponds on the China coast using 30 years of Landsat images. Int. J. Appl. Earth Obs. Geoinf. 2021, 102, 102383. [Google Scholar] [CrossRef]
  41. Otsu, N. A Threshold Selection Method from Gray-Level Histograms. IEEE Trans. Syst. Man Cybern. 1979, 9, 62–66. [Google Scholar] [CrossRef]
  42. Samet, H. Connected Component Labeling Using Quadtrees. Assoc. Comput. Mach. 1981, 28, 487–501. [Google Scholar] [CrossRef]
  43. Ren, C.; Wang, Z.; Zhang, B.; Li, L.; Chen, L.; Song, K.; Jia, M. Remote Monitoring of Expansion of Aquaculture Ponds Along Coastal Region of the Yellow River Delta from 1983 to 2015. Chin. Geogr. Sci. 2018, 28, 430–442. [Google Scholar] [CrossRef]
  44. Chen, Y.Q.; Nixon, M.S.; Thomas, D.W. Statistical geometrical features for texture classification. Pattern Recognit. 1995, 28, 537–552. [Google Scholar] [CrossRef]
  45. Dehua, M.; Zongming, W.; Baojia, D.; Lin, L.; Yanlin, T.; Mingming, J.; Yuan, Z.; Kaishan, S.; Ming, J.; Yeqing, W. National wetland mapping in China: A new product resulting from object-based and hierarchical classification of Landsat 8 OLI images. ISPRS J. Photogramm. Remote Sens. 2020, 164, 11–25. [Google Scholar] [CrossRef]
Figure 1. Location of the Chaohu Lake basin and remote sensing image of sample aquaculture pond extraction in each county.
Water 17 01406 g001
Figure 2. Schematic illustration of the MOFA, including data preprocessing and crude water extraction (1), threshold segmentation (2), fine extraction (3), accuracy evaluation (4), and spatiotemporal analysis (5).
Water 17 01406 g002
Figure 3. Comparison of the extraction effect of different threshold segmentation methods, using Wuwei as an example, where (a) is OTSU, (b) is ATS, and (c) is WF. (dh) show aquaculture pond extraction results under varying water frequency.
Water 17 01406 g003
Figure 4. The decision tree flowchart for aquaculture pond classification in the Chaohu Lake basin extracts potential ponds as red polygons and non-aquaculture ponds as blue polygons.
Water 17 01406 g004
Figure 5. Results of aquaculture pond extraction in the Chaohu Lake basin. (ac) represent the distribution of aquaculture ponds in 2016, 2020, and 2023, respectively, and it shows the distribution of aquaculture ponds in Wuwei, which has the largest area of aquaculture ponds.
Water 17 01406 g005
Figure 6. (ac) are the distribution maps of aquaculture ponds in the counties of the Chaohu Lake basin in 2016, 2020, and 2023, respectively.
Water 17 01406 g006
Figure 7. (ac) are the nuclear density maps of aquaculture ponds in the counties of the Chaohu Lake basin in 2016, 2020, and 2023, respectively.
Water 17 01406 g007
Table 1. Parameters and description of relevant image datasets used in this study.
CategoryNameTime PeriodSpatial ResolutionSource
Remote sensing imageSentinel-1 SAR and Sentinel-22016, 2020, 202310 mEuropean Space Agency
DEMSRTM V3200030 mNational Aeronautics and Space Administration (NASA)
Other auxiliary dataGlobal Surface Water Mapping Layers202030 mEC JRC (European Commission’s Joint Research Centre)
Global urban boundary202030 mStar Cloud Data Service Platform
Statistical dataAnhui Provincial Statistical Yearbook2017–2022/Anhui Provincial Bureau of Statistics
China Fishery Statistical Yearbook2017–2022/Ministry of Agriculture and Rural Affairs of the People’s Republic of China
Table 2. Geometric feature quantization table.
Feature/MetricDescriptionReferences
Area (A)The coverage range of a specific feature or target in a two-dimensional geographic space[44]
Perimeter (P)The total length of closed boundaries of a specific feature or target in two-dimensional geographic space
Shape index (SI)Combining the perimeter and area of the ground features, the regularity of the target boundary is reflected[45]
Compactness (Com)Compare the perimeter and area of the target object to evaluate its similarity to a circle[32]
Perimeter2/Area (P2/A)Perimeter to area ratio/
MORAMinimum outlying rectangular area ratio/
Table 3. Confusion matrix for aquaculture ponds validation in 2016, 2020, and 2023.
YearClassAquacultureNon-AquacultureUA/%PA/%OA/%Kappa/%
2016Aquaculture4951796.6888.5592.1184.23
Non-Aquaculture6445187.5796.37
2020Aquaculture4931497.2489.8093.1886.38
Non-Aquaculture5646489.2397.07
2023Aquaculture5031597.1089.5092.7985.58
Non-Aquaculture5945088.4196.77
Table 4. Methods used in prior literature for the extraction of aquaculture ponds.
TechniquesSensorAccuracyStudy AreaProcessReference
Object-oriented methodSentinel-1 SAROverall accuracy
93%
Jiangsu Province, ChinaObject-based methods and multi-threshold segmentation for aquaculture pond extraction[29]
Object-oriented methodSentinel-2Relative error 1.13%Northwest Province,
Sri Lanka
An iterative water body segmentation algorithm integrating grayscale morphology and edge detection[33]
Object-oriented methodSentinel-1 SAROverall accuracy 90.16%VietnamTime series Sentinel-1 SAR images, threshold segmentation, combined with object-oriented methods[32]
SVM classification methodLandsat OLI,
Landsat TM,
GaoFen-1 WFV
Overall accuracy
94%
Hubei Province, ChinaSVM classification method to extract natural and aquaculture ponds[17]
Edge DetectionSentinel-2Overall accuracy 83.91 %Global scaleSentinel-2 time series, edge detection, morphology[36]
Decision tree classifierLandsat 5 T1_SR, Landsat 8 T1_SROverall accuracy higher than 91%Jiangsu Province, ChinaExtraction of aquaculture ponds by decision trees combined with shape index[11]
Decision tree classifierLandsat 8 T1_SROverall accuracy 96%Jiangsu Province, ChinaExtraction of aquaculture ponds by decision trees combined with water index[12]
Threshold segmentationSentinel-1 SAROverall accuracy 83%The Mekong Delta,
Red River Delta,
Pearl River Delta,
Yellow River Delta
Time series Sentinel-1 data, water threshold segmentation[13]
Object-oriented methodSentinel-1 SAR, Sentinel-2Overall accuracy 91.90%Coastal AsiaObject-oriented methods based on multiple sensors[31]
Biophysical parametersSentinel-2Overall accuracy 91%Coastal ChinaA method combining spatial characteristics and biophysical parameters[16]
Object-oriented methodSentinel-1 SAROverall accuracy 89%Coastal IndiaOpen-source connected component segmentation algorithm[14]
Object-oriented methodLandsat TMOverall accuracy 92.90%Coastal ChinaIntegrate updated approach with object-oriented methods[10]
Object-oriented methodSentinel-1 SAROverall accuracy higher than 90%Coast of China and VietnamCombining neighborhood discrimination and morphological features[2]
Threshold segmentationSentinel-1 SAROverall accuracy 93%Coastal ChinaWater index combined with object-oriented extraction methods[26]
Hierarchical decision treesSentinel-2Overall accuracy higher than 90%Coastal ChinaA hybrid approach combining noniterative clustering with hierarchical decision trees[38]
Deep learningGF-3F1 greater than 94%East coast of Jiangsu Province, ChinaMark-controlled watershed method combined with UN++ method[24]
Disclaimer/Publisher’s Note: The statements, opinions and data contained in all publications are solely those of the individual author(s) and contributor(s) and not of MDPI and/or the editor(s). MDPI and/or the editor(s) disclaim responsibility for any injury to people or property resulting from any ideas, methods, instructions or products referred to in the content.

