Abstract
This study employed Computational Fluid Dynamics (CFD) simulations using FLOW-3D v11.2 software to systematically investigate the hydraulic characteristics of Asymmetric Triangular Labyrinth Weirs (ATLWs), with a comparative analysis against conventional Symmetric Triangular Labyrinth Weirs (STLWs). The Volume of Fluid (VOF) method and the Renormalization Group (RNG) k-ε turbulence model were adopted to accurately capture the free-surface and turbulence behaviors. The results demonstrate that ATLWs induce significant flow deflection, leading to the formation of distinctive local cavities and a unique flow regime characterized by the coexistence of fully aerated nappe flow and local submergence. Compared to STLWs, this asymmetric configuration generates more complex three-dimensional flow structures and altered pressure distribution patterns. Under low headwater conditions, the hydraulic performance (Cd and Q/Qn) of both weir types is similar; however, under high headwater conditions, the Cd of STLWs is approximately 5.4–14.3% higher than that of ATLWs. A noteworthy finding is that increasing the cycle number (n) significantly enhances the discharge capacity of ATLWs, whereas this effect is not pronounced in STLWs. Based on comprehensive parametric analysis, this study developed a generalized empirical formula with exceptionally high predictive accuracy for estimating Cd, providing a practical tool for optimizing ATLW designs in engineering applications.
1. Introduction
In hydraulic engineering, overflow weirs are critical structures for flood control and water resource management, whose stable discharge capacity is essential to the safety of hydraulic infrastructure. However, intensified global climate change has resulted in more frequent extreme precipitation events and a sharp rise in peak flood discharges, making conventional linear weirs insufficient for handling floods exceeding design standards. This limitation represents a potential vulnerability in flood control systems [1,2,3]. To address this challenge, labyrinth weirs have gained prominence owing to their unique nonlinear crest geometry, which significantly increases the effective overflow length within a limited space. Under the same hydraulic head and channel width, their discharge capacity can be several times greater than that of conventional linear weirs, thus effectively attenuating flood peaks [4,5,6]. In current engineering practice, classical symmetric labyrinth weirs (STLWs, including triangular, trapezoidal, rectangular, and semi-circular configurations) are widely used. These weirs typically consist of one or more cycles of symmetrically arranged geometric units [7,8,9]. Although symmetric structures exhibit excellent hydraulic performance and stability under uniform flow conditions and regular topography, their adaptability and discharge efficiency are limited in real-world scenarios characterized by complex terrain, heterogeneous geology, and nonuniform flow conditions. In this context, the design philosophy of asymmetric labyrinth weirs (ATLWs) has emerged, guided by the principles of flexible adaptation to complex environments and tailored responses to diverse operational demands. By breaking geometric symmetry constraints, ATLWs achieve seamless integration with complex topography, varying flow conditions, and esthetic requirements, demonstrating superior adaptability across diverse application scenarios.
Since the development of labyrinth weir technology, research on hydraulic performance has primarily focused on symmetric configurations. Numerous studies have investigated the influence of various geometric and hydraulic parameters on weir performance, including weir type, cycle number (n), sidewall angle (α), relative crest length (L/B), relative upstream head (H0/P), weir height (P), and apex angle (θ) [10]. Taylor [11] performed early evaluations of semicircular, sharp-crested triangular, and trapezoidal labyrinth weirs. Tullis et al. [12] systematically investigated the effect of sidewall angles (6–18°) on the discharge coefficient of trapezoidal labyrinth weirs, extrapolating the results to larger angles (25°, 35°), and noted that discharge efficiency decreases with increasing relative upstream head. Kumar et al. [13] found that reducing the apex angle of triangular labyrinth weirs significantly reduces the discharge coefficient. Carollo et al. [14] identified H0/P and n as key parameters affecting the discharge capacity of triangular labyrinth weirs. Tacail et al. [15] showed that, for a given channel width, triangular labyrinth weirs with n = 2 cycles perform better than those with n = 3 cycles. Namazi and Mozaffari [16] compared triangular and semicircular labyrinth weirs with n = 1 and n = 2 cycles under fixed relative crest lengths. Emiroglu et al. [17] observed that trapezoidal labyrinth side weirs with n = 1 cycle are more efficient than those with n = 2 cycles due to reduced nappe interference. Khode et al. [18] proposed a discharge coefficient formula for trapezoidal labyrinth weirs with n = 2 cycles with sidewall angles of 6–30°. Christensen [19] noted that, for n ≥ 5, the discharge coefficient of semicircular labyrinth weirs becomes independent of the number of cycles. Gupta et al. [20] demonstrated that reducing weir height increases discharge under the same hydraulic head and derived a discharge coefficient formula that incorporates relative upstream head and relative crest length. Sangsefidi et al. [21] experimentally showed that although increasing the relative upstream head and decreasing sidewall angles improve the efficiency of semicircular labyrinth weirs, the discharge coefficient decreases when H0/P exceeds 0.4. Safarrazavi Zadeh et al. [22] experimentally investigated the influence of various hydraulic and geometric parameters on the discharge coefficients of semicircular and sinusoidal labyrinth weirs and proposed predictive formulas. Samadi et al. [23] used experimental and numerical methods to systematically analyze the effects of geometric parameters on triangular and trapezoidal labyrinth weirs. Bilhan and Emiroglu [24] compared trapezoidal weirs (with a 37° sidewall angle) with inverted semicircular weirs and concluded that trapezoidal configurations provide higher discharge coefficients. Kabiri-Samani et al. [25] combined experimental and theoretical approaches to conduct a comprehensive study on rectangular labyrinth weirs. Bilhan et al. [26] conducted experimental and numerical investigations specifically on circular labyrinth weirs. Ziaei et al. [27] numerically simulated triangular labyrinth side weirs (with apex angles of 45°, 60°, and 90°), showing that their discharge capacity is 1.25–1.7 times that of conventional side weirs, with performance improving as the apex angle decreases. Khalili and Honar [28] derived a discharge coefficient formula for semicircular labyrinth side weirs through experiments and dimensional analysis, confirming their superiority over rectangular configurations. In contrast, studies on asymmetric labyrinth configurations remain limited. Karimi et al. [29] compared asymmetric and symmetric triangular labyrinth side weirs and found that the asymmetric design achieved a significantly higher discharge coefficient. Similarly, Borghei and Parvaneh [30] and Parvaneh et al. [31] investigated asymmetric triangular labyrinth side weirs and found that geometric asymmetry enhances the discharge performance of these weirs. However, these investigations were restricted to side weirs with lateral inflow, and the hydraulic characteristics of asymmetric frontal labyrinth weirs have not been systematically explored. In summary, existing studies have primarily focused on symmetric geometries under idealized conditions, with limited attention devoted to asymmetric configurations. Moreover, the adaptability of labyrinth weirs under complex topography and non-uniform inflow conditions has been largely overlooked, introducing significant uncertainties in engineering applications and design optimization.
Therefore, this study focuses on asymmetric triangular labyrinth frontal weirs (ATLWs), aiming to thoroughly investigate their hydraulic behavior and systematically quantify the influence of key hydraulic parameters and geometric parameters on both discharge capacity and flow field distribution. To accurately capture the complex flow dynamics around asymmetric labyrinth weirs under varying hydraulic conditions, numerical simulations are conducted using FLOW-3D software. The RNG k-ε turbulence model is employed for simulating the turbulent flow, while the Volume of Fluid (VOF) method is applied to model free surface flow. These methods are crucial for achieving precise simulations and comprehensive analyses of the flow characteristics surrounding asymmetric labyrinth weirs, ensuring the accuracy and reliability of the results. The findings will not only address critical theoretical gaps in asymmetric weir design but also provide a scientific basis for weir configuration in complex environments. Furthermore, this research has significant practical value for improving preparedness for extreme flood events and enhancing the resilience of water infrastructure, while also supporting the modern water management philosophy of integrated water-ecology-landscape development.
2. Materials and Methods
2.1. Computational Domain and Mesh
Building upon the experimental foundation established by Aydin et al. [32], this study developed three-dimensional models for asymmetric triangular labyrinth weirs (ATLWs) with non-integer cycle numbers (n = 1.5, 2.5, 3.5). Conventional symmetric triangular labyrinth weirs (STLWs) with integer cycle numbers (n = 2, 3) were retained as control groups for comparison. For each cycle number, five distinct geometric configurations (designated V1 through V5) were designed, characterized by the following parameter ranges: relative crest length (L/B) from 1.37 to 2.88, sidewall angle (α) from 20° to 47°, sidewall length (l1) from 87.8 to 185.2 mm, and relative headwater (H0/P) from 0.13 to 0.55. The weir height (P) was maintained constant at 100 mm for all models. When varying the cycle number while maintaining a constant L/B ratio, the corresponding channel width ranged from 0.19 m to 0.45 m. A total of 150 distinct operational conditions were systematically investigated using numerical simulations. Figure 1 presents the top view and side view schematic of ATLW and STLW, with the corresponding detailed computational parameters listed in Table 1. To enable detailed flow field analysis, a cross-section X2 was defined 0.04 m downstream of the upstream weir crest section X1. Additionally, two observation sections (Y1 and Y2) were established relative to the positions of the downstream weir crest corners. The computational domain was divided into three distinct regions: the weir zone, the upstream zone, and the downstream zone. As illustrated in Figure 2, a fine uniform grid size of 0.0025 m was applied in all directions within the critical weir region to ensure simulation accuracy. A slightly coarser uniform grid of 0.005 m was used for discretizing the upstream and downstream zones.
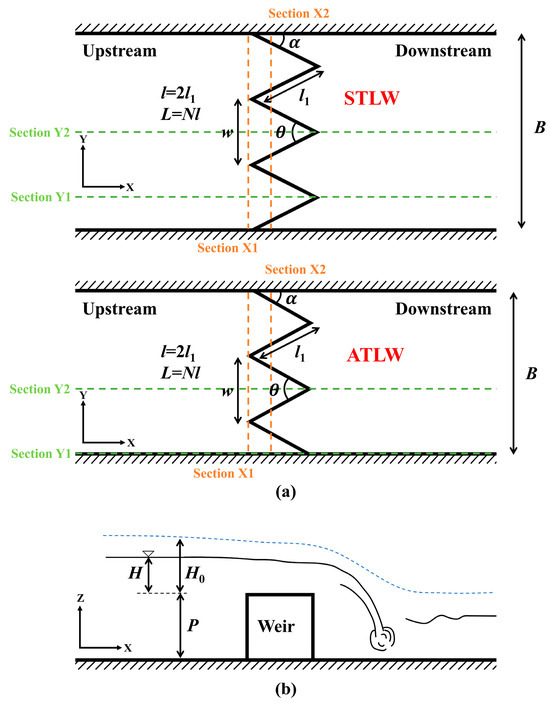
Figure 1.
Schematic diagram of ATLW and STLW: (a) top view; (b) side view.

Table 1.
Geometric and hydraulic variables of the investigated ATLWs and STLWs.
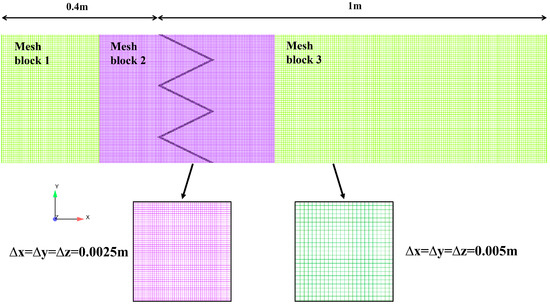
Figure 2.
Grid generation.
2.2. Control Equations and Model Selection
2.2.1. Control Equations
In this study, a single-phase fluid model was employed, accounting for the free surface and assuming the fluid to be incompressible. Within this framework, a zero fluid fraction represents a void region where pressure and density remain uniform, and inertia is negligible relative to that of the fluid. Thus, only a single fluid phase is considered in the governing equations.
The numerical model utilizes the Volume of Fluid (VOF) method proposed by Hirt and Nichols [33] to capture the water surface, with its Cartesian-coordinate formulation presented in Equation (4) as follows:
In this equation, F denotes the volume fraction occupied by a single fluid. When F = 1, the computational cell is completely filled with liquid; when F = 0, the cell is empty; and when 0 < F < 1, the cell represents a free-surface region.
For the motion of an incompressible fluid, the continuity equation and the governing equations are as follows [34]:
Continuity equation
Momentum equation
where ρ is the fluid density; t is time; ui and uj are the velocity components in the i and j directions, respectively; xi and xj are the coordinate components along the i and j directions, respectively; μ is the molecular viscosity coefficient; μt is the turbulent viscosity; p is the pressure.
It should be noted that surface tension effects were neglected in the present numerical simulations. Previous studies indicate that scale effects due to surface tension are generally more pronounced at very low headwater [35]. In this study, the minimum relative headwater is H0/P = 0.13, which exceeds the critical threshold of 0.12 given by Tullis et al. [35] for their largest model scale of 0.12. Thus, surface tension is expected to have a negligible impact on flow characteristics, with any resulting scale effects remaining within ±5%, consistent with observations for piano key weirs with flat crests [35,36].
2.2.2. Turbulence Model
The Renormalization Group (RNG) k-ε model was employed to resolve turbulence in the flow field. This model is capable of simulating low-intensity turbulence, flows with strong shear regions, and swirling flows over highly refined computational meshes. It is widely recommended in the literature for providing more accurate and efficient solutions [37,38,39,40,41]. The governing equations of the RNG k-ε turbulence model are expressed as follows:
where k is the turbulent kinetic energy per unit mass; ε is the turbulence dissipation rate per unit mass; µeff is the effective viscosity (µeff = µ + µt); Gk is the production of turbulent kinetic energy due to the velocity gradient; Gb is turbulent kinetic energy production from buoyancy; YM is turbulence dilation oscillation distribution; the terms Sk and Sε are source terms for k and ε, respectively; αk and αε are the turbulent Prandtl numbers for k and ε, respectively; Rε is an additional correction term in the ε equation; η is the ratio of the turbulent time scale to the mean strain rate; C1ε, C2ε, C3ε, Cµ, η0 and β are model constants.
2.3. Boundary Conditions
The boundary conditions in this study are set as follows: The inlet boundary is set as a pressure inlet, and the free-surface elevation of the channel inlet section is given, with the head over the weir (H) prescribed in the range of 0.013 m to 0.05 m. The downstream outlet plane adopts a free outflow boundary condition. The lower and two side boundaries are regarded as rigid walls and set as no-slip wall boundaries during the simulation. The upper boundary of the channel is set as an air inlet, and the rest of the boundary conditions are set as symmetric boundary conditions. The boundary condition settings for each mesh block are illustrated in Figure 3 and summarized in Table 2.
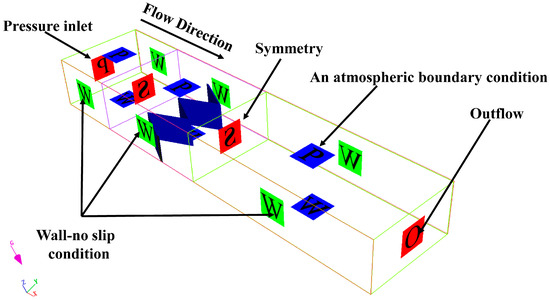
Figure 3.
Applied boundary conditions.
Table 2.
Boundary conditions.
2.4. Verification
To ensure the reliability of the numerical simulations, a Grid Convergence Index (GCI) analysis and experimental validation were performed. The GCI method quantifies the discretization error and assesses how closely the numerical solution approaches the asymptotic value. Based on this method, many researchers have studied the independence of numerical results from mesh size [42,43,44,45]. Simulations were conducted with three grid sizes (0.0025 m, 0.00325 m, and 0.0039 m) under a total head over the weir (H0) of 0.013 m. As shown in Table 3, for a grid resolution of 0.0025 m in the weir region, the GCI value is below 1.5%. This result confirms that the numerical solution at this resolution is grid-independent and meets the predefined accuracy criteria.
Table 3.
Grid Convergence Index (GCI) Analysis.
The GCI used to refine the grid can be written as the following formula:
where FS is the safety factor, with a value range of 1.25 to 3.0; Di and Di+1 are the coarse and fine grid sizes, respectively; |σi+1,1| is the relative error between the numerical solutions at grid sizes Di and Di+1; fi and fi+1 are the numerical solutions at grid sizes Di and Di+1, respectively, typically representing a physical quantity such as discharge (Q) or velocity (V); r is the grid size ratio; β is the convergence accuracy; and |σ| is the absolute error between the numerical solutions at grid sizes Di and Di+1.
To validate the accuracy of the numerical simulations, the computed discharge coefficients were compared with the experimental data reported by Aydin et al. [31]. For a specific configuration (L/B = 2.33, n = 3), the simulated discharge (Q) under various total head over the weir (H0) was compared with experimental measurements, as illustrated in Figure 4. The results demonstrate excellent agreement, with relative errors ranging from 0.72% to 6.84%, confirming the credibility of the numerical model.
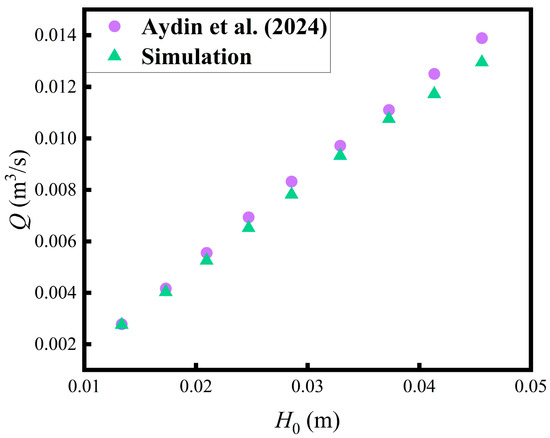
Figure 4.
Discharge verification [32].
The convergence of the steady-state numerical solution was rigorously monitored by tracking the discharge at a specified cross-section throughout the entire simulation process. Figure 5 presents the time series of discharge at the monitoring cross-section for the ATLW with L/B = 2.33 and n = 2.5, which serves as a key indicator for assessing the convergence of the computation. The simulation was conducted for a sufficiently long duration to ensure that all initial transient effects were completely eliminated. As shown in Figure 5, after an initial development phase of approximately 2 to 3 s, the discharge curves under both relative headwater conditions (H0/P = 0.13 and 0.5) exhibited an asymptotic convergence trend, gradually approaching a constant value. At around 6 s, the temporal variation in discharge became negligible, with fluctuations confined within ±0.5% of the mean value. The high stability of discharge variation at the monitoring section indicates that the entire flow field had achieved full convergence, yielding a reliable steady-state solution.
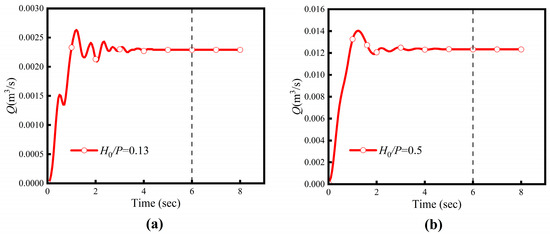
Figure 5.
Discharge time series of ATLW: (a) H0/P = 0.13; (b) H0/P = 0.5.
3. Results
3.1. Pressure Profiles
To investigate the flow patterns and pressure distribution under identical cross-sectional conditions, computational fluid dynamics (CFD) analysis was employed to obtain two-dimensional profiles of both ATLWs (n = 1.5, 2.5) and STLWs (n = 2, 3) under various relative headwater conditions (H0/P), as illustrated in Figure 6. The results indicate that at low H0/P values, the flow characteristics of ATLWs and STLWs are identical, both exhibiting fully symmetrical clinging nappe flow. The water smoothly passes over the weir crest, with the nappe closely adhering to the downstream face. No nappe interference or local submergence is observed between adjacent cycles, indicating a stable flow state, high discharge efficiency, and a maximum discharge coefficient. As H0/P increases, all chambers of the STLW become fully submerged. In contrast, the ATLW exhibits a fully aerated nappe and develops a large cavity between cross-sections Y1 and Y2. These cavities exhibit similar irregular and closed shapes, while the flow in the remaining chambers resembles that of the STLW, being fully submerged. This flow behavior is attributed to the asymmetric geometry of the ATLW and the resulting mainstream deflection caused by sidewall confinement. With a further increase in H0/P, the cavities in the STLW persist, and their size remains largely constant. Specifically, when H0/P ranges from 0.13 to 0.21, both ATLWs and STLWs exhibit clinging nappe flow with identical characteristics. When H0/P increases to 0.37, the STLW becomes fully submerged, whereas a distinct cavity forms between sections Y1 and Y2 in the ATLW. As H0/P further rises to 0.54, this cavity persists and its size stabilizes.
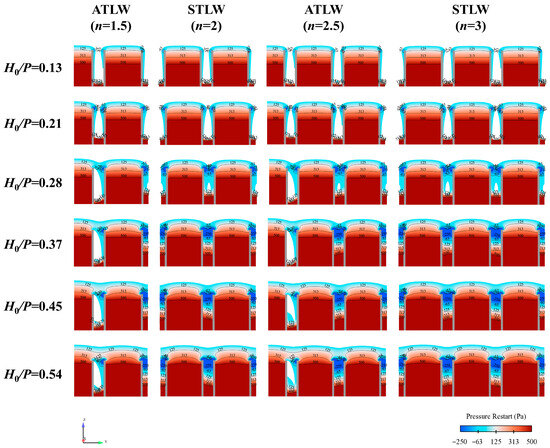
Figure 6.
Water surface profiles with pressure contours of the ATLW and STLW at the same cross-section X1 (L/B = 2.33).
Further analysis of the pressure distribution reveals that at low H0/P, the pressure within the chambers of both ATLWs and STLWs generally follows a hydrostatic distribution, with only small, low-magnitude negative pressure zones near the weir crest. The primary reason for the occurrence of slight negative pressure at the weir crest is that, as the flow passes over the crest, the nappe is relatively thin and the water depth is small. Although the flow velocity at the weir crest is not high, it experiences a certain acceleration, which leads to a decrease in static pressure and consequently generates negative pressure. Under low H0/P conditions, the flow velocity at the weir crest is constrained, resulting in a relatively low negative pressure at the weir crest. Moreover, the nappe flows along the weir surface without noticeable separation, and the negative pressure zone is primarily confined to the initial portion of the weir crest. As H0/P increases, the negative pressure zone near the crest expands significantly, and the maximum negative pressure value reaches approximately four times that under low headwater conditions. In the STLW, the negative pressure zone is concentrated and uniformly distributed along the crest. In the ATLW, however, influenced by the cavity, the extent of the negative pressure zone between sections Y1 and Y2 is significantly reduced compared to the STLW. In summary, due to the combined effects of structural configuration and sidewall confinement, the differences in flow patterns and pressure distribution between ATLWs and STLWs are primarily concentrated between cross-sections Y1 and Y2.
3.2. Streamlines
Based on the preceding pressure distribution analysis, streamline visualization for the specific chamber (i.e., between cross-sections Y1 and Y2) systematically reveals the evolution of the flow pattern within the chamber, induced by nappe interference and local submergence. Figure 7 illustrates the distribution of lower-layer streamlines at the channel bottom (z/P = 0.1) in both ATLWs and STLWs under various flow and geometric conditions. The results show that the lower-layer streamlines primarily extend from the downstream apex, enter the inlet cycle chamber, and pass over the weir crest. This indicates that at this water level, the downstream apex plays a dominant role in maintaining the discharge capacity. At lower H0/P ratios, the streamlines of both ATLWs and STLWs follow identical patterns without any observed deflection. The streamlines, originating near the downstream weir corner, converge towards the central extension line of the upstream weir crest corner. As the H0/P ratio increases, the streamlines in the STLW maintain their low-head trend. In contrast, within the ATLW, significant streamline deflection occurs due to its asymmetric structure and sidewall constraints. This deflection phenomenon is a key factor contributing to cavity formation within the cycle chambers. Specifically, when H0/P ranges from 0.13 to 0.21, the streamlines from sections Y1 and Y2 in both ATLWs and STLWs all converge towards the central extension line of their respective upstream weir crest corners, with no flow deflection observed during this stage. When H0/P increases to 0.28, the streamlines at section Y1 in the ATLW begin to deflect significantly towards section Y2, and this deflection persists with further increases in H0/P. In contrast, the flow paths in the STLW remain largely unaffected by changes in H0/P.
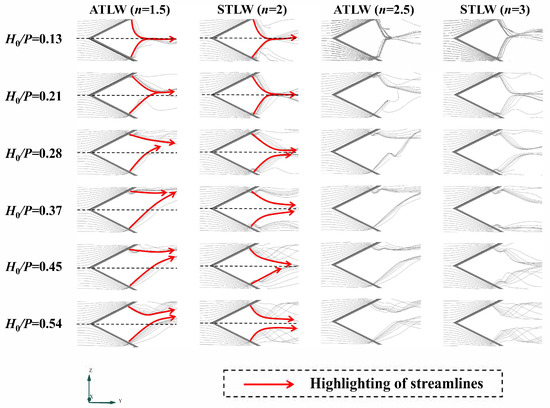
Figure 7.
Streamlines at the channel bottom (z/P = 0.1) in both ATLWs and STLWs under various flow and geometric conditions (L/B = 2.33).
Figure 8 displays the distribution of upper-layer streamlines near the weir crest (z/P = 1) in both ATLWs and STLWs under various flow and geometric conditions. The upper-layer streamlines primarily originate from the upstream apex and flow into the downstream cycle chamber. At lower H0/P ratios, the flow patterns of ATLWs and STLWs are similar, with a low degree of streamline disorder, indicating that nappe interference and local submergence have not yet occurred. As the H0/P ratio increases further, the degree of streamline disorder intensifies significantly in both ATLWs and STLWs. This is because the increased discharge intensifies the collision and interaction of nappes between adjacent cycle chambers, causing the nappe impact point to shift upstream. This interaction is accompanied by energy dissipation resulting from direct nappe impact and shear action. Furthermore, although significant nappe interference occurs in the STLW after the H0/P increase, even more intense nappe disturbance is observed in the ATLW, which is related to the complex flow characteristics induced by its asymmetric structure.
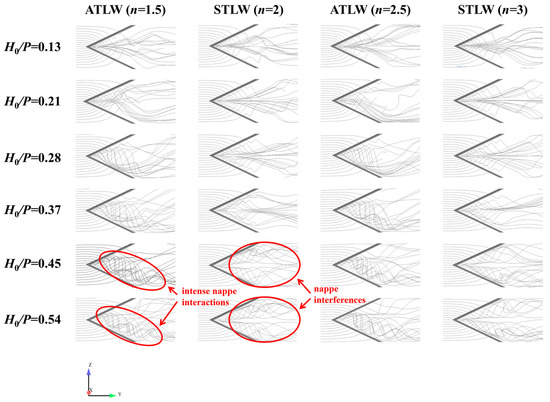
Figure 8.
Streamlines near the weir crest (z/P = 1) in both ATLWs and STLWs under various flow and geometric conditions (L/B = 2.33).
3.3. Hydraulic Performance
Based on the principle of energy conservation between the upstream and downstream cross-sections, the head-discharge relationship for a sharp-crested weir oriented perpendicular to the flow direction can be expressed as follows [46]:
where Q is the weir discharge, Cd is the discharge coefficient, B is the channel width, g is the gravitational acceleration, and H0 is the total head over the weir.
To further investigate the variation patterns of the discharge coefficient for triangular labyrinth weirs, this section presents a comparative analysis of the discharge coefficient (Cd) between ATLWs and STLWs with different cycle numbers n. Figure 9 illustrates the relationship between the discharge coefficient (Cd) and the relative headwater (H0/P) in both ATLWs and STLWs with different n under various relative crest lengths (L/B). The results indicate that, influenced by nappe interference and local submergence effects, the Cd for both ATLWs and STLWs decreases as H0/P increases. It is noteworthy that for L/B ratios of 1.37, 1.50, and 1.67, Cd exhibits a slight increase under lower H0/P conditions. This phenomenon may stem from the combined effects of weir wall thickness, crest shape, and surface tension under low headwater conditions. Furthermore, under identical H0/P conditions, Cd increases with the L/B ratio, primarily attributable to the increase in the effective overflow length. Specifically, for the STLW, when H0/P = 0.13, the Cd for L/B = 2.88 is 1.84 times that for L/B = 1.37; this ratio decreases to 1.46 at H0/P = 0.52. For the ATLW, when H0/P = 0.13, the Cd for L/B = 2.88 is also 1.84 times that for L/B = 1.37, whereas at H0/P = 0.52, this ratio ranges between 1.51 and 1.56.
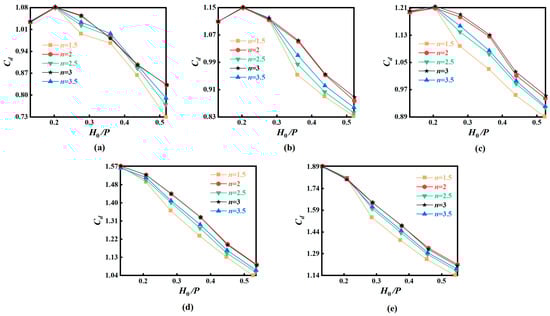
Figure 9.
Variation in the discharge coefficients (Cd) with respect to the relative waterhead (H0/P) in both ATLWs and STLWs under different relative crest length conditions: (a) L/B = 1.37; (b) L/B = 1.50; (c) L/B = 1.67; (d) L/B = 2.33; (e) L/B = 2.88.
Further analysis of the effect of cycle number n reveals that at lower H0/P, the Cd values for both ATLWs and STLWs are essentially identical across different L/B conditions. As H0/P increases beyond a certain threshold, significant differences begin to emerge between the Cd values of ATLWs and STLWs. The reason for this is that at low heads, the interference between outflows from individual cycles is weak, and no flow blockage occurs, whereas with increasing H0/P, localized flow blockage gradually develops near the weir crest, leading to the divergence in discharge coefficients. Taking L/B = 1.37 as an example, the Cd values for ATLWs and STLWs are consistent at H0/P of 0.13 and 0.21; a noticeable difference appears when H0/P increases to 0.37. Under identical H0/P conditions, the Cd of the STLWs is generally higher than that of the ATLWs. When H0/P = 0.52, the Cd of STLWs increases by approximately 5.4% to 14.3% compared with that of ATLWs. Regarding the cycle number effect, the Cd values for n = 2 and n = 3 are similar in STLWs, whereas in ATLWs, influenced by their asymmetric structure, Cd shows an increasing trend with the increase in n.
Another metric for evaluating the discharge performance of a labyrinth weir is the flow magnification ratio (Q/Qn), defined as the ratio of the labyrinth weir’s discharge (Q) to that of a linear weir (Qn) of equivalent crest width. Rehbock’s formula is commonly used to calculate the discharge of a standard linear crested weir.
Based on the aforementioned variation patterns of the discharge coefficient (Cd), this study further compares the flow magnification ratio (Q/Qn) of both ATLWs and STLWs relative to a conventional linear weir. To evaluate the influence of the cycle number (n), Figure 10 compares the Q/Qn values of ATLWs and STLWs with different n against the baseline value of the ATLW with n = 2.5, illustrating the variation in the flow magnification ratio (Q/Qn) with the relative headwater (H0/P). Overall, the relationship between Q/Qn and the n follows these patterns: at low H0/P, the differences in Q/Qn between ATLWs and STLWs are not significant. As H0/P increases, the Q/Qn of STLWs consistently remains higher than that of ATLWs. Furthermore, the Q/Qn values for STLWs with different cycle numbers are relatively similar; whereas in ATLWs, the influence of the n is quite pronounced, with the Q/Qn value increasing with n, i.e., n = 3.5 > n = 2.5 > n = 1.5. Moreover, the improvement magnitude from n = 1.5 to n = 2.5 is substantially greater than that from n = 2.5 to n = 3.5. Specifically, for the case of L/B = 2.88 and H0/P = 0.38, the Q/Qn value for both n = 2 and n = 3 in STLWs is approximately 3.3% higher than the baseline (i.e., the ATLW with n = 2.5). In contrast, for ATLWs, the Q/Qn value for n = 3.5 is only 1.1% higher than that for n = 2.5; however, the value for n = 2.5 shows a significant increase of 3.6% compared to that for n = 1.5.
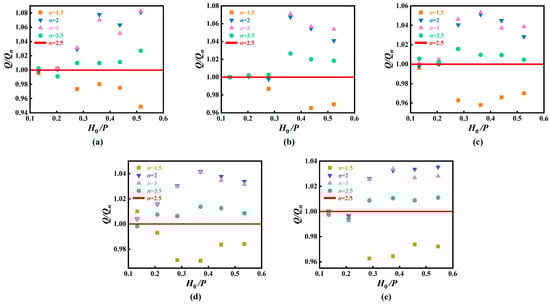
Figure 10.
Variation in the flow magnification ratio (Q/Qn) with the relative headwater (H0/P) for ATLWs and STLWs with different cycle numbers (reference: ATLW, n= 2.5) under various relative crest length conditions: (a) L/B = 1.37; (b) L/B = 1.50; (c) L/B = 1.67; (d) L/B = 2.33; (e) L/B = 2.88.
To quantitatively assess the influence of geometric parameters and hydraulic conditions on the discharge capacity of ATLWs and STLWs, this study developed an empirical formula for estimating the discharge coefficient (Cd). The formula was derived based on the following parameter ranges: sidewall angle (α) from 20° to 47°, relative crest length (L/B) from 1.37 to 2.88, relative headwater (H0/P) from 0.13 to 0.55, and cycle number (n) from 1.5 to 3.5. As listed in Table 4, the empirical formula (Equation (13)) demonstrates excellent fitting performance, with a coefficient of determination (R2) as high as 0.980. In addition to R2, multiple statistical metrics, including the Root Mean Square Error (RMSE), Mean Square Error (MSE), and Mean Absolute Error (MAE), were employed to comprehensively evaluate the formula’s predictive accuracy, reliability, and stability. A comparison between the predicted and observed values is shown in Figure 11. The results indicate that the empirical formula possesses satisfactory predictive capability, and the predicted values agree well with the observed data. The maximum relative error for all data points does not exceed 10%, and the average relative error is 2.64%.
Table 4.
Comparison of different error analyses.
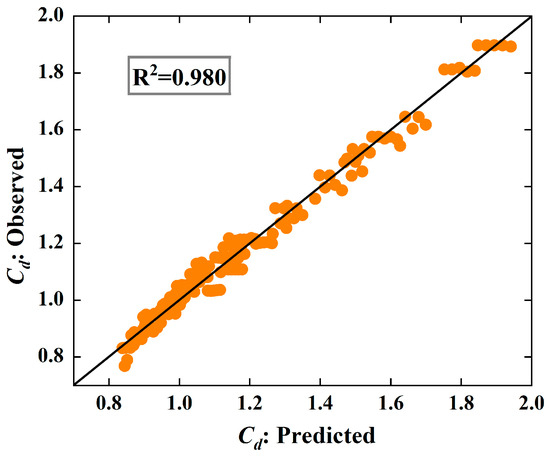
Figure 11.
Predicted discharge coefficients compared with observed values.
4. Conclusions
This study conducted three-dimensional numerical simulations of the hydraulic characteristics of flow over ATLWs and STLWs using FLOW-3D software, leading to the following conclusions:
- In STLWs, the flow regime transitions uniformly from clinging nappe flow to complete submergence, with the negative pressure zone concentrated uniformly along the weir crest. In contrast, for ATLWs, dominated by their asymmetric structure and sidewall constraints, the main flow undergoes significant deflection, inducing persistent cavities in local regions, which are absent in STLWs. This cavity results in a significantly reduced extent of the local negative pressure zone compared to the STLW. Concurrently, it leads to a unique flow regime characterized by a combination of fully aerated nappe flow and local submergence. This phenomenon intensifies with increasing H0/P and eventually stabilizes.
- Streamline visualization systematically reveals fundamental differences in the flow structures between ATLWs and STLWs. At low H0/P ratios, the lower-layer streamlines of both configurations show no deflection, the upper-layer streamlines exhibit minimal disorder, and their flow patterns are similar. As H0/P increases, distinct differences emerge: the lower-layer streamlines in STLWs maintain their original trend, while the upper-layer streamlines, despite increased disorder, remain relatively organized. In contrast, ATLWs exhibit significant and persistent deflection in the lower-layer streamlines, directly contributing to cavity formation. Their upper-layer streamlines demonstrate intense disturbances not observed in STLWs, which are directly associated with the unique nappe interference induced by the asymmetric geometry.
- At lower H0/P ratios, the Cd and Q/Qn of ATLWs and STLWs are essentially identical, indicating that the asymmetric design can achieve flow conveyance efficiency comparable to that of the symmetric weir under low-headwater conditions. However, as H0/P increases, the Cd and Q/Qn of ATLWs are generally lower than those of STLWs under the same conditions, due to the increased energy dissipation caused by cavity formation, streamline deflection, and more intense nappe disturbances in ATLWs. Furthermore, in ATLWs, an increase in the cycle number (n) can significantly enhance the flow capacity, whereas this effect is not pronounced in STLWs.
- Based on an extensive parameter range, this study derived a generalized empirical formula for predicting the discharge coefficient (Cd) of triangular labyrinth weirs. This formula demonstrates exceptionally high goodness-of-fit (R2 = 0.980) and low prediction error (mean relative error of 2.64%), providing a practical and reliable quantitative basis for the hydraulic design and performance optimization of ATLWs in complex environments.
Author Contributions
Conceptualization, Y.Z.; methodology, Y.Z.; validation, W.X. (Wufeng Xu) and K.X.; formal analysis, W.X. (Weitong Xu) and L.J.; investigation, Z.Y.; resources, Y.Z.; data curation, S.J.; writing—original draft preparation, K.X.; writing—review and editing, Y.Z. and K.X.; visualization, W.Q.; funding acquisition, Y.Z. All authors have read and agreed to the published version of the manuscript.
Funding
This research is supported by the Joint Funds of the Zhejiang Provincial Natural Science Foundation of China (Grant No. LZJWY23E090002), the Nanxun Scholars Program for Young Scholars of ZJWEU (RC2022020948), and the Jinhua Science and Technology City Project (2024-4-305).
Data Availability Statement
The original contributions presented in this study are included in the article. Further inquiries can be directed to the corresponding author.
Conflicts of Interest
Author Yu Zhou and Siwei Jia were employed by the company Yiwu Andy Water Conservancy and Hydropower Survey and Design Co., Ltd. The remaining authors declare that the research was conducted in the absence of any commercial or financial relationships that could be construed as a potential conflict of interest.
Abbreviations
| ATLW | Asymmetric Triangular Labyrinth Weir |
| STLW | Symmetric Triangular Labyrinth Weir |
| H0/P | Relative headwater |
| n | Cycle number |
| L/B | Relative crest length |
| B | Channel width |
| L | Weir crest length |
| α | Sidewall angle |
| θ | Apex angle |
| P | Weir height |
| Qn | Discharge of a conventional linear weir |
| Q/Qn | Flow magnification ratio |
| Q | Discharge |
| Cd, CL | Discharge coefficient |
| H | head over the weir |
| H0 | Total head over the weir |
| l1 | Sidewall length |
| V1–V5 | Case numbers |
| GCI | Grid Convergence Index |
| R2 | Coefficient of determination |
| MSE | Mean Squared Error |
| RMSE | Root Mean Squared Error |
| MAE | Mean Absolute Error |
References
- Said, M.B.; Ouamane, A. Discharge Capacity of an Improved Form of Labyrinth Weir. In International School of Hydraulics; Springer Nature: Cham, Switzerland, 2023; pp. 13–28. [Google Scholar] [CrossRef]
- Isleem, H.F.; Elshaarawy, M.K.; Hamed, A.K. Analysis of Flow Dynamics and Energy Dissipation in Piano Key and Labyrinth Weirs Using Computational Fluid Dynamics; IntechOpen: London, UK, 2024. [Google Scholar] [CrossRef]
- Idrees, A.K.; Al-Ameri, R. Investigating a New Approach to Enhance the Discharge Capacity of Labyrinth Weirs. J. Hydroinform. 2023, 25, 300–317. [Google Scholar] [CrossRef]
- Mattos-Villarroel, E.D.; Ojeda-Bustamante, W.; Díaz-Delgado, C.; Salinas-Tapia, H.; Flores-Velázquez, J.; Bautista Capetillo, C. Methodological Proposal for the Hydraulic Design of Labyrinth Weirs. Water 2023, 15, 722. [Google Scholar] [CrossRef]
- Aydin, M.C.; Ulu, A.E.; Işık, E. Determination of Effective Flow Behaviors on Discharge Performance of Trapezoidal Labyrinth Weirs Using Numerical and Physical Models. Model. Earth Syst. Environ. 2024, 10, 3763–3776. [Google Scholar] [CrossRef]
- Aydin, M.C.; Ulu, A.E.; Işık, E. Investigation of Hydraulic Characteristics of Stepped Labyrinth Weirs under Fixed Crest Length. Water Resour. Manag. 2025, 39, 3295–3310. [Google Scholar] [CrossRef]
- Mattos-Villarroel, E.; Flores-Velázquez, J.; Ojeda-Bustamante, W.; Díaz-Delgado, C.; Salinas-Tapia, H. Influence of Crest Geometric on Discharge Coefficient Efficiency of Labyrinth Weirs. Flow Meas. Instrum. 2021, 81, 102031. [Google Scholar] [CrossRef]
- Ghaderi, A.; Daneshfaraz, R.; Dasineh, M.; Di Francesco, S. Energy Dissipation and Hydraulics of Flow over Trapezoidal–Triangular Labyrinth Weirs. Water 2020, 12, 1992. [Google Scholar] [CrossRef]
- Mohammadzadeh-Habili, J.; Heidarpour, M.; Samiee, S. Study of Energy Dissipation and Downstream Flow Regime of Labyrinth Weirs. Iran. J. Sci. Technol., Trans. Civ. Eng. 2018, 42, 111–119. [Google Scholar] [CrossRef]
- Ghaderi, A.; Daneshfaraz, R.; Abbasi, S.; Abraham, J. Numerical Analysis of the Hydraulic Characteristics of Modified Labyrinth Weirs. Int. J. Energy Water Resour. 2020, 4, 425–436. [Google Scholar] [CrossRef]
- Taylor, G. The Performance of Labyrinth Weirs. Ph.D. Thesis, University of Nottingham, Nottingham, UK, 1968. [Google Scholar] [CrossRef]
- Tullis, J.P.; Amanian, N.; Waldron, D. Design of Labyrinth Spillways. J. Hydraul. Eng. 1995, 121, 247–255. [Google Scholar] [CrossRef]
- Kumar, S.; Ahmad, Z.; Mansoor, T. A New Approach to Improve the Discharging Capacity of Sharp-Crested Triangular Plan Form Weirs. Flow Meas. Instrum. 2011, 22, 175–180. [Google Scholar] [CrossRef]
- Carollo, F.G.; Ferro, V.; Pampalone, V. Experimental Investigation of the Outflow Process over a Triangular Labyrinth Weir. J. Irrig. Drain Eng. 2012, 138, 73–79. [Google Scholar] [CrossRef]
- Tacail, F.G.; Even, B.; Babb, A. Case Study of a Labyrinth weir Spillway. Can. J. Civ. Eng. 1990, 17, 1–7. [Google Scholar] [CrossRef]
- Namazi, F.S.A.; Mozaffari, J. Investigation of Labyrinth Weirs Discharge Coefficient with the Same Length. Flow Meas. Instrum. 2023, 94, 102468. [Google Scholar] [CrossRef]
- Emiroglu, M.E.; Aydin, M.C.; Kaya, N. Discharge Characteristics of a Trapezoidal Labyrinth Side Weir with One and Two Cycles in Subcritical Flow. J. Irrig. Drain Eng. 2014, 140, 04014007. [Google Scholar] [CrossRef]
- Khode, B.V.; Tembhurkar, A.R.; Porey, P.D.; Ingle, R.N. Experimental Studies on Flow over Labyrinth Weir. J. Irrig. Drain Eng. 2012, 138, 548–552. [Google Scholar] [CrossRef]
- Christensen, N.A. Flow Characteristics of Arced Labyrinth Weirs. Master’s Thesis, Utah State University, Logan, UT, USA, 2013. [Google Scholar] [CrossRef]
- Gupta, K.K.; Kumar, S.; Ahmad, Z. Effect of Weir Height on Flow Performance of Sharp Crested Rectangular-Plan Form Weirs. World Appl. Sci. J. 2015, 33, 168–175. [Google Scholar] [CrossRef]
- Sangsefidi, Y.; Mehraein, M.; Ghodsian, M. Experimental Study on Flow over In-Reservoir Arced Labyrinth Weirs. Flow Meas. Instrum. 2018, 59, 215–224. [Google Scholar] [CrossRef]
- Safarrazavi Zadeh, M.; Esmaeili Varaki, M.; Biabani, R. Experimental Study on Flow over Sinusoidal and Semicircular Labyrinth Weirs. ISH J. Hydraul. Eng. 2021, 27 (Suppl. 1), 304–313. [Google Scholar] [CrossRef]
- Samadi, A.; Salmasi, F.; Arvanaghi, H.; Mousaviraad, M. Effects of Geometrical Parameters on Labyrinth Weir Hydraulics. J. Irrig. Drain. Eng. 2022, 148, 06022006. [Google Scholar] [CrossRef]
- Bilhan, O.; Emiroglu, M.E. Experimental Studies on Determination of Discharge Capacity of Circular Labyrinth Weirs Located on a Straight Channel. Int. J. Electron. Mech. Mech. Eng. 2016, 6, 1227–1239. [Google Scholar] [CrossRef]
- Kabiri-Samani, A.; Javaheri, A.; Borghei, S.M. Discharge Coefficient of a Rectangular Labyrinth Weir. Proc. Inst. Civ. Eng.-Water Manag. 2013, 166, 443–451. [Google Scholar] [CrossRef]
- Bilhan, O.; Aydin, M.C.; Emiroglu, M.E.; Miller, C.J. Experimental and CFD Analysis of Circular Labyrinth Weirs. J. Irrig. Drain. Eng. 2018, 144, 04018007. [Google Scholar] [CrossRef]
- Ziaei, A.N.; Nikou, N.S.; Beyhaghi, A.; Attarzadeh, F.; Khodashenas, S.R. Flow Simulation over a Triangular Labyrinth Side Weir in a Rectangular Channel. Prog. Comput. Fluid Dyn. Int. J. 2019, 19, 22–34. [Google Scholar] [CrossRef]
- Khalili, M.; Honar, T. Discharge Coefficient of Semi-Circular Labyrinth Side Weir in Subcritical Flow. Water SA 2017, 43, 433–441. [Google Scholar] [CrossRef]
- Karimi, M.; Ghazizadeh, M.J.; Saneie, M.; Attari, J. Flow Characteristics over Asymmetric Triangular Labyrinth Side Weirs. Flow Meas. Instrum. 2019, 68, 101574. [Google Scholar] [CrossRef]
- Borghei, S.M.; Parvaneh, A. Discharge Characteristics of a Modified Oblique Side Weir in Subcritical Flow. Flow Meas. Instrum. 2011, 22, 370–376. [Google Scholar] [CrossRef]
- Parvaneh, A.; Borghei, S.M.; Jalili Ghazizadeh, M.R. Hydraulic Performance of Asymmetric Labyrinth Side Weirs Located on a Straight Channel. J. Irrig. Drain. Eng. 2012, 138, 766–772. [Google Scholar] [CrossRef]
- Aydin, M.C.; Ulu, A.E.; Işık, E.; Hamidi, N. An Experimental and Numerical Investigation of Hydraulic Performance of In-Channel Triangular Labyrinth Weir for Free Overflow. ISH J. Hydraul. Eng. 2024, 30, 430–439. [Google Scholar] [CrossRef]
- Hirt, C.W.; Nichols, B.D. Volume of Fluid (VOF) Method for the Dynamics of Free Boundaries. J. Comput. Phys. 1981, 39, 201–225. [Google Scholar] [CrossRef]
- Chunrong, L.; Aode, H.; Wenju, M. Numerical and Experimental Investigation of Flow over a Semicircular Weir. Acta Mech. Sin. 2002, 18, 594–602. [Google Scholar] [CrossRef][Green Version]
- Tullis, B.P.; Crookston, B.M.; Young, N. Scale Effects in Free-Flow Nonlinear Weir Head-Discharge Relationships. J. Hydraul. Eng. 2020, 146, 04019056. [Google Scholar] [CrossRef]
- Tullis, B.P.; Young, N.; Crookston, B.M. Physical Modeling Size-Scale Effects for Labyrinth Weirs with Half-Round Crests. In Labyrinth and Piano Key Weirs III; CRC Press: Boca Raton, FL, USA, 2017; pp. 185–192. [Google Scholar] [CrossRef]
- Mei, J.; Zhou, Y.; Xu, K.; Xu, G.; Shu, Z.; Gan, Q.; Yu, Q.; Qian, J. Energy Dissipation on Inclined Stepped Spillways. Water 2025, 17, 251. [Google Scholar] [CrossRef]
- Mirkhorli, P.; Ghaderi, A.; MohammadNezhad, H.; Kisi, O. Hydraulic Behavior and Energy Dissipation in Piano Key Weirs vs. Rectangular Labyrinth Weirs: A Comparative Study. Flow Meas. Instrum. 2025, 102, 102830. [Google Scholar] [CrossRef]
- Roy Biswas, T.; Singh, P.; Sen, D. Submerged Flow over Barrage Weirs: A Computational Fluid Dynamics Model Study. J. Irrig. Drain. Eng. 2021, 147, 04021058. [Google Scholar] [CrossRef]
- Safarzadeh, A.; Noroozi, B. 3D Hydrodynamics of Trapezoidal Piano Key Spillways. Int. J. Civ. Eng. 2017, 15, 89–101. [Google Scholar] [CrossRef]
- Arjenaki, M.O.; Sanayei, H.R.Z. Numerical Investigation of Energy Dissipation Rate in Stepped Spillways with Lateral Slopes Using Experimental Model Development Approach. Model. Earth Syst. Environ. 2020, 6, 605–616. [Google Scholar] [CrossRef]
- Shen, G.; Cao, D.; Li, S.; Li, G. Numerical and Sensitivity Analysis of Hydraulic Characteristics of Triangular Labyrinth Side Weir. Flow Meas. Instrum. 2024, 100, 102686. [Google Scholar] [CrossRef]
- Celik, I.B.; Ghia, U.; Roache, P.J.; Freitas, C.J. Procedure for Estimation and Reporting of Uncertainty Due to Discretization in CFD Applications. J. Fluids Eng.-Trans. ASME 2008, 130, 078001. [Google Scholar] [CrossRef]
- Soydan Oksal, N.G.; Akoz, M.S.; Simsek, O. Numerical Modelling of Trapezoidal Weir Flow with RANS, LES, and DES Models. Sādhanā 2020, 45, 91. [Google Scholar] [CrossRef]
- Oksal, N.G.S.; Akoz, M.S.; Simsek, O. Experimental Analysis of Flow Characteristics over Hydrofoil Weirs. Flow Meas. Instrum. 2021, 79, 101867. [Google Scholar] [CrossRef]
- Rouse, H. Open Channel Flow. By F. M. Henderson. Macmillan, 1966. 522 pp. $14.95. J. Fluid Mech. 1967, 29, 414–415. [Google Scholar] [CrossRef]
Disclaimer/Publisher’s Note: The statements, opinions and data contained in all publications are solely those of the individual author(s) and contributor(s) and not of MDPI and/or the editor(s). MDPI and/or the editor(s) disclaim responsibility for any injury to people or property resulting from any ideas, methods, instructions or products referred to in the content. |
© 2025 by the authors. Licensee MDPI, Basel, Switzerland. This article is an open access article distributed under the terms and conditions of the Creative Commons Attribution (CC BY) license (https://creativecommons.org/licenses/by/4.0/).